connecting globally - new zealand … returns* as at 30 june 2014 one year five years since...
TRANSCRIPT

CONNECTING GLOBALLY
B.21
ANNUAL REPORT 2014

FOR FUTUREGENERATIONS

Glade Copper/ Pepe Para Riki
A curious New Zealand butterfly that explores new horizons.

FUND RETURNS*
As at 30 June 2014 One year
Five years
Since inception**
Actual Fund Return (before tax, after costs) 19.36% 17.01% p.a. 9.78% p.a.
Value added by Guardians (compared to passive Reference Portfolio benchmark) -0.11% 2.92% p.a. 1.03% p.a.
Net Return (returns over and above the Treasury Bill return – the Government’s marginal cost of debt)
16.82% 14.44% p.a. 5.06% p.a.
* See pages 42-44 for explanations of our benchmarks.** The first capital contributions were invested in September 2003.
2013/14 ACHIEVEMENTS:
• Risk budget framework developed
• New performance reporting system introduced
• Internal direct investment capability increased
PRIORITIES FOR 2014/15:
• Embed risk budget process in core activities
• Pursue more NZ and international direct deals
• Broaden and deepen strategic tilting programme
• Review technology platforms for evolving regulatory and investment needs
19.36%
RETURN
$25.82B
FUND SIZE
FOR THE YEAR
$3.26B
INCREASE IN FUND SIZE
$1.09B
NZ TAX EXPENSE
| NEW ZEALAND SUPERANNUATION FUND | ANNUAL REPORT 20142
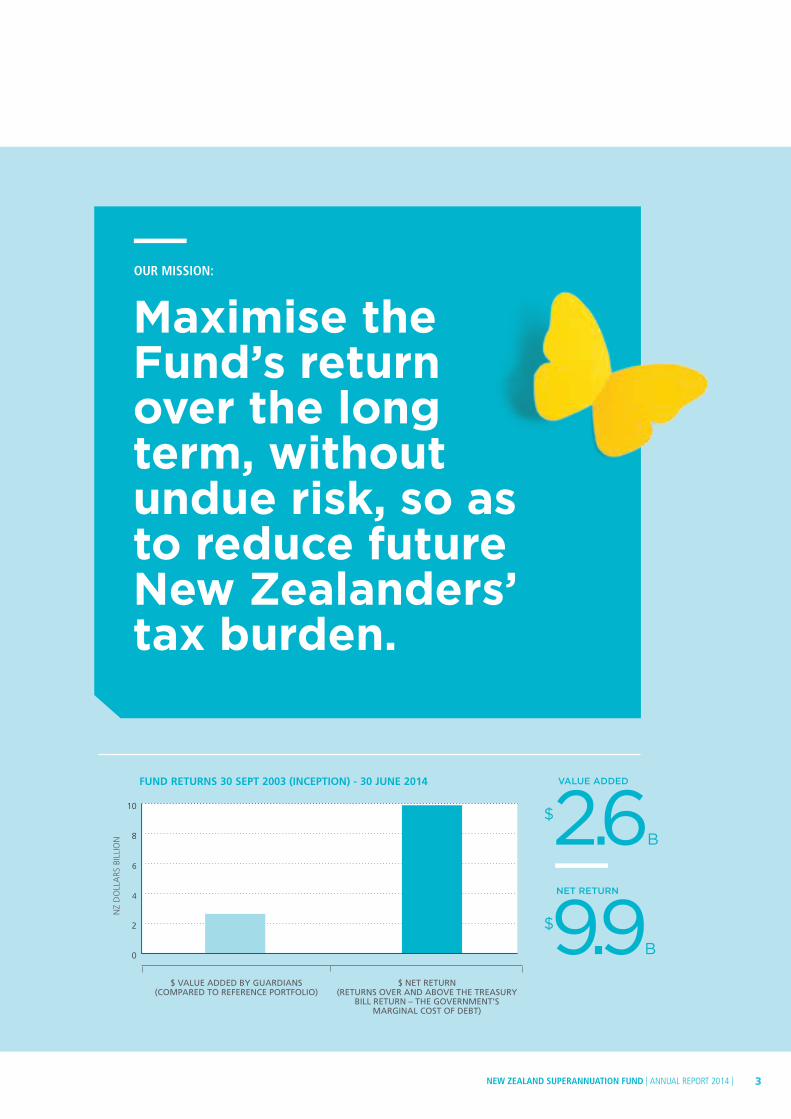
Maximise the Fund’s return over the long term, without undue risk, so as to reduce future New Zealanders’ tax burden.
OUR MISSION:
FUND RETURNS 30 SEPT 2003 (INCEPTION) - 30 JUNE 2014
$ VALUE ADDED BY GUARDIANS (COMPARED TO REFERENCE PORTFOLIO)
$ NET RETURN (RETURNS OVER AND ABOVE THE TREASURY
BILL RETURN – THE GOVERNMENT’S MARGINAL COST OF DEBT)
0
2
4
6
8
10
NZ
DO
LLA
RS B
ILLI
ON
$2.6B
VALUE ADDED
$9.9B
NET RETURN
NEW ZEALAND SUPERANNUATION FUND | ANNUAL REPORT 2014 | 3

Contents
2 OVERVIEW
8 Chair’s Statement
10 CEO’s Statement
12 10 Years of Connecting Globally for Future Generations
14 Progress against our Strategic Plan
16 GOVERNANCE
17 Overview
20 Board Members
22 Leadership Team
24 Principles
30 Independent Review
31 Risk Management
34 Remuneration and Discretionary Incentive Scheme
59 CASE STUDY
Metlifecare – Investing in retirement villages and aged care
60 CASE STUDY
Iwi take stake in Kaingaroa Timberlands
61 Responsible Investment Report
36 INVESTMENT REPORT
37 Performance Report
46 How We Invest
48 Investment Activity Report – Global
54 CASE STUDY
Cheap, flexible access to global share markets
56 CASE STUDY
NZ Super Fund and KKR – a strategic partnership
57 Investment Activity Report – New Zealand
2.5%
0.7%
1.4%
44.6%
6.0%
24.5%
6.5%
13.8%
| NEW ZEALAND SUPERANNUATION FUND | ANNUAL REPORT 20144

85 COMPLIANCE STATEMENTS
86 Statement of Service Performance
91 Managers and Custodians
94 SIPSP Compliance
68 OPERATIONAL REPORT
69 Highlights
70 CASE STUDY
Q&A with Head of Tax John Payne
72 Cost Efficiency and Benchmarking
75 Regulatory Update
77 Our People
83 Environmental Performance
95 FINANCIAL STATEMENTS
96 Financial Statements and Audit Report – Fund
173 Financial Statements and Audit Report – Guardians
200 Glossary
205 Corporate Directory
HOW TO READ THIS REPORT
This Annual Report describes the activities and performance of the Guardians and Fund over 2013/14, in the context of our long-term purpose.
In the Overview section, you can get the basics: a performance summary; who we are and what we do; key achievements; and future priorities.
For those who want more depth, the remainder of the Report details three important aspects of the Guardians and Fund: our governance; the performance of the Fund’s investment portfolio; and the Guardians’ operational activities.
Supplementary information is available on www.nzsuperfund.co.nz, including a detailed explanation of ‘How We Invest’; an index of this Annual Report against the Global Reporting Initiative 3.1 criteria; and a list of the Fund’s global equity holdings as at 30 June 2014.
We welcome feedback to help us improve our reporting. Comments can be directed to [email protected].
NEW ZEALAND SUPERANNUATION FUND | ANNUAL REPORT 2014 | 5
Investing globally to ensure a sustainable future
OVERVIEW OF GUARDIANS AND FUND
The New Zealand Superannuation Fund is a Government savings vehicle to help reduce the tax burden on future generations.
WHAT IS THE PROBLEM THE FUND IS HELPING TO SOLVE?
All New Zealanders aged 65 and over are eligible to receive New Zealand Superannuation payments (also known as the pension, National Super or Super). These payments are paid for by today’s taxpayers.
Over the next few decades, however, the New Zealand population will age significantly. Proportionally, there will be fewer taxpayers of working age to support those people receiving the pension.
These demographic changes mean that future generations face a much higher tax burden than that carried by their predecessors, in order to keep funding universal superannuation payments.
HOW DO WE FIT IN?
To help reduce the burden on future generations, the Government passed the New Zealand Superannuation and Retirement Income Act 2001 (the Act), which established:
• the New Zealand Superannuation Fund (the Fund), a pool of assets on the Crown’s balance sheet; and
• the Guardians of New Zealand Superannuation (the Guardians), a Crown entity charged with managing the Fund.
Between 2003 and 2009, the Government contributed NZD14.88 billion to the Fund. Contributions are scheduled to restart once core Crown net debt is 20% of GDP, currently forecast in 2020/21. From around 2029/30, the Government will begin to withdraw money from the Fund to help pay for New Zealand Superannuation. The Fund is expected to peak in size in the 2080s.
WHAT DO WE DO?
The Guardians, which has operational independence regarding its investment decisions, invests the money the Government has contributed to the Fund. The Fund is a growth-oriented and highly diversified global portfolio of investments.
In this way, the Fund adds to Crown wealth, improves the ability of future Governments to pay for superannuation and, ultimately, reduces the tax burden of the cost of superannuation on future New Zealanders.
| NEW ZEALAND SUPERANNUATION FUND | ANNUAL REPORT 20146

Our Mandate
By using the Fund to save now in order to pay for future retirement benefits, the Government aims to reduce the cost of New Zealand Superannuation for future generations.
MANDATE
Under the Act, the Guardians must invest the Fund on a prudent, commercial basis and, in doing so, must manage and administer the Fund in a manner consistent with:
• best-practice portfolio management;
• maximising return without undue risk to the Fund as a whole; and
• avoiding prejudice to New Zealand’s reputation as a responsible member of the world community.
MISSION
Maximise the Fund’s return over the long term, without undue risk, so as to reduce future New Zealanders’ tax burden.
VISION
A great team building the best portfolio.
PERFORMANCE EXPECTATIONS
We compare the performance of the Fund to a passive Reference Portfolio, in order to benchmark the value we have added through active investment.
We also compare the performance of the Fund to that of 90-day Treasury Bills as a measure of the ‘opportunity cost’ to the Government of contributing capital to the Fund, instead of using the money to retire debt.
It is our expectation, given our mandate and, hence, our portfolio construction, that we will return at least the Treasury Bill return plus 2.5% p.a. over any 20-year moving average period.
VALUES
Inclusiveness: We combine diverse skills, and seek relevant views and rigorous analysis, in a supportive environment.
Innovation: We encourage initiative taking, continuous learning and smart decision-making.
Integrity: We behave in a transparent and commercial manner for the long-term benefit of the Fund.
NEW ZEALAND GOVERNMENT
GUARDIANS OF NEW ZEALAND SUPERANNUATION
(‘DOUBLE-ARM’S-LENGTH’ CROWN ENTITY)
NEW ZEALAND SUPERANNUATION FUND
(LONG-TERM SAVINGS VEHICLE)
OVERVIEW OF GUARDIANS AND FUND
NEW ZEALAND SUPERANNUATION FUND | ANNUAL REPORT 2014 | 7

Chair’s Statement
The New Zealand Superannuation Fund has had a very strong year, with a total return of 19.36% (after costs, before NZ tax). As at 30 June 2014, the Fund stood at NZD25.8 billion after tax, an increase of NZD3.3 billion over a year ago.
PERFORMANCE SINCE INCEPTION
Since investing began in September 2003, the Fund has returned 9.78% p.a. (after costs, before NZ tax).
This compares favourably to an 8.75% p.a. return for the passive Reference Portfolio benchmark we use to measure the value the Guardians have added to the Fund through active investment. The Guardians have added NZD2.6 billion to the Fund, or 1.03% p.a., compared to the Reference Portfolio.
The Fund has also created significant wealth for New Zealand by exceeding the Treasury Bill return by 5.06% p.a. (NZD9.9 billion) since inception. In simple terms this means that the New Zealand Government’s balance sheet is nearly NZD10 billion better off than if it had used the money to reduce debt.
The Fund has paid NZD4.36 billion in New Zealand tax since inception*. Total Fund returns of NZD15.5 billion (before NZ tax) now exceed the capital the Government has contributed to the Fund.
PERFORMANCE DURING 2013/14
The Fund benefited from a strong rally in equity markets during 2013/14. The Fund’s total return of 19.36% was the third highest in its history, comparing favourably to a 2.55% return for Treasury Bills, while slightly behind a 19.47% return by the Reference Portfolio.
The Reference Portfolio, by construct, is a deliberately difficult benchmark to beat. The main reason the Fund underperformed it this year was the impact of the rising New Zealand dollar on our currency tilting strategy.
We have taken a view that the New Zealand dollar is overvalued and will revert to a more normal level in time. We remain comfortable with this view. Tilting is a long-term, multi-year strategy, and movements up and down from year to year are to be expected.
Since our tilting strategy commenced in April 2009, it has added NZD798 million in value to the Fund.
Detailed performance information, including a breakdown of the key contributors to the performance of the Actual Portfolio compared to the Reference Portfolio, can be found on pages 37-45.
LONG-TERM THINKING
Since the Global Financial Crisis in 2008/09, the Fund has benefited from a strong rebound in global investment markets. Fund returns have been exceptional: 17.01% p.a. over the last five years.
While we remain confident that the Fund will continue to deliver value for taxpayers, ongoing returns at this level should be seen as exceptional.
Our long-run performance expectation is that our Reference Portfolio benchmark will exceed the Treasury Bill rate by 2.5% p.a. On top of that, we estimate that our active investment activities will add another 1.0% p.a. to total Fund returns.
Along the way, there will be good years and bad. It is important to appreciate that periods of market weakness, while testing for stakeholders, are the very times where long-term investors such as ourselves can find the best opportunities.
With the Fund not forecast to peak in size until the 2080s, we remain firmly committed to our long-term, growth-oriented investment strategies.
RESPONSIBLE INVESTMENT
This long-term investing horizon is also a key driver of the integration of environmental, social and governance factors into our investment processes. Our approach to responsible investment is discussed further on pages 61-67.
During the year, like many other large asset owners, we were challenged about our response to climate change, with advocacy groups suggesting that we should divest from companies with exposure to fossil fuels.
See pages 37-45 for a full explanation of these benchmarks and further details of the Fund’s performance relative to them.
“It is important to appreciate that periods of market weakness, while testing for stakeholders, are the very times where long-term investors such as ourselves can find the best opportunities.”
* Including NZD415 million paid in July 2014 in respect of the 2013/14 financial year.
OVERVIEW OF GUARDIANS AND FUND
| NEW ZEALAND SUPERANNUATION FUND | ANNUAL REPORT 20148

We are concerned about climate change and have undertaken significant work to build the risks and opportunities associated with it into our investment process. As a result, we are committed to a long-term strategy to increase the Fund’s exposure to low-carbon and renewable energy.
We have also made a significant investment in a Mercer-led collaborative research project on climate change in 2014, which will inform our future thinking on the issue. We continue to encourage companies in which we invest to manage climate change risks through our long-term participation in the Carbon Disclosure Project and the Investor Group on Climate Change.
COMMITMENT TO GLOBAL BEST PRACTICE
Under our Act, we are required to manage the Fund in line with best-practice portfolio management. We define this as global best practice, and benchmark ourselves against similar pension and Sovereign Wealth Funds internationally. Our Statement of Service Performance at pages 86-90 shows how we are performing against these measures.
I’m pleased to report that the Fund is held in high regard among major institutional investors globally.
We have been blessed with legislation that is a model of best practice and good, independent governance. We are one of very few truly long-term investors globally, and have been able to take advantage of this generous horizon, our small size and relative youth to work innovatively and nimbly.
Our Reference Portfolio approach has been widely admired, as highlighted by Institutional Investor magazine during the year. It is now being emulated by a number of leading funds globally.
We have been also been fortunate to attract a very capable Board and staff members that are of a global standard.
GA
VIN
WA
LKER
C
HA
IR
My Board colleagues have put in a tremendous effort to ensure that they are on top of the global game in governing a long-term investment fund. In doing so, they have been ably assisted by the Guardians’ team through peer investor interaction and ongoing education modules. Some global recognition of the quality of our work is the fact that our CEO, Adrian Orr, was elected Deputy Chair of the International Forum of Sovereign Wealth Funds, and Deputy Chair of the Pacific Pension Institute, during the year.
These global connections and relationships are important strategies for us as we look to overcome the challenges to the Fund posed by New Zealand’s small size and distance from the world’s major capital markets.
GAVIN WALKER, CHAIR
NEW ZEALAND SUPERANNUATION FUND | ANNUAL REPORT 2014 | 9

CEO’s Statement
GLOBAL CONNECTIONS
While we are very much a New Zealand organisation with a unique Kiwi culture, the Fund is, by virtue of its mandate, globally focused. In order to meet this best practice mandate, and to maximise returns without undue risk, we must invest internationally as well as in New Zealand. Global investments offer access to a full spectrum of investment opportunities and assist in the protection of the Fund from New Zealand-specific economic shocks through diversification.
New Zealand’s geographic isolation will always pose a challenge for our country’s economic development. However, the ‘tyranny of distance’ is reducing through better technologies and transportation, a much higher reliance on intellectual value-add in our trade and through governments’ policies internationally, which encourage open flows of labour, capital, and goods and services, between nations.
The Fund faces its own challenges because of distance. These include:
• managing a complex portfolio from an unsympathetic time zone;
• sourcing and investigating new direct investments – activities that have no substitute for a close ear to the ground and some local insight; and
• monitoring investment managers.
New Zealand’s geographic distance increases the costs of acquiring information and risks reducing its quality and/or timeliness. When all other things are equal, distance can, therefore, reduce our confidence and increase the ‘hurdle’ rate of return we require to make an offshore investment.
If these factors are not overcome, the Fund could become less competitive than alternative sources of capital that, by virtue of being closer to the action, are better informed. These ‘proximity’ concerns are not unique to New Zealand. In fact, most nations have some form of significant ‘home bias’ in their investment preferences, given a perceived superior insight into local activities.
COMBATING THE DISTANCE DISADVANTAGE
So what do we do to mitigate the challenges posed by our geographic distance from the markets in which we invest?
We are fortunate that our governance, transparency and long-term investment approach present the Fund internationally as a thoughtful, consistent and patient source of capital. These qualities improve our attractiveness as an investor, even if we seek a higher return than do competing sources. In short, we are invited to the dance as a preferred partner.
We have sought to develop strong relationships with other similar funds offshore, sharing knowledge and comparing notes, always aiming to benchmark our practices and costs against the best in the world.
We have co-invested alongside some of these funds, sharing due diligence costs and gaining diversification benefits.
We also participate in, and help set the agenda at, international forums that make the case for Sovereign Wealth Funds as valuable and responsible sources of foreign capital. These organisations help connect us with our peers, with best practice, and with the global investment community.
Our staff and Board actively travel, understand the necessity of staying on top of opportunities, and are aligned with peer investors and aware of global best practices in investing amongst our identified peers. I thank all of the team and Board for their considerable and time-consuming efforts.
2013/14 OVERVIEW
This year marked the end of the ‘build’ phase of the Guardians’ evolution. A number of major projects were completed during the year:
• the development of our Risk Allocation Process through the introduction of Risk Budgets (page 47);
• the implementation of a new performance reporting system (page 69); and
• processes to accommodate regulatory changes relating to central clearing (page 69).
Our investment process is now fully developed and we do not envisage any major changes to it or to our organisational structure, in the near to medium term. While ongoing innovation will be required to stay in tune with global best practice, we are now firmly focused on the ‘operate’ phase.
2014/15 CHALLENGES
Looking to 2014/15 and beyond, we will continue to focus on developing our global connectedness; on ensuring we have a scalable and efficient organisation; and on maintaining our strong workplace culture.
We are encouraged by an accelerating pace of growth for the global economy and an improving outlook for activity in the coming years. Prospects are good for sustainable growth in developed economies as well as in emerging markets.
Nevertheless, five years on from the events of the Global Financial Crisis, many major economies remain below their pre-crisis trajectories, resulting in a lingering drag on incomes, employment, and profits.
OVERVIEW OF GUARDIANS AND FUND
| NEW ZEALAND SUPERANNUATION FUND | ANNUAL REPORT 201410

AD
RIA
N O
RR
C
HIE
F EX
ECU
TIV
E O
FFIC
ER
To a large extent, economic recovery remains dependent on extensive monetary stimulus in Western economies.
Likewise, many developed economies find themselves in precarious fiscal positions which present both long-term destabilising forces in their own rights and limit capacity to respond to global challenges like ageing populations and global warming.
As such, we must remain wary. The current low risk environment can foster complacency, planting the seeds of future financial upheaval. In particular, the transition away from a low-interest-rate environment over the next few years could prove a disruptive force for countries or business models that are overly burdened with debt.
From an investor’s point of view, the easy value-add runs have been made post the Global Financial Crisis. Prices for most major asset classes have now returned to their long-term fair value levels, having plunged in 2008/09. In some instances, especially for some currencies, prices are now above their medium-term fair values. There is no point chasing additional risk
if we are not going to be adequately rewarded. This means we can expect more normal returns going forward and continued hard work to add value.
We look forward to these challenges as they provide unique opportunities for disciplined long-term investors. In that regard, I’d like to thank the Board and staff of the Guardians for their contributions to what has been a challenging and busy, but ultimately very successful, year for the organisation. The global environment in which we are operating is complex, changeable and highly competitive. I appreciate your commitment and focus on the things that matter.
ADRIAN ORR, CHIEF EXECUTIVE OFFICER
NEW ZEALAND SUPERANNUATION FUND | ANNUAL REPORT 2014 | 11

10 Years of Connecting Globally for Future Generations
“Establishing a global investment fund from New Zealand has been an immense task, and it was good to have the opportunity to thank our staff, Government and community stakeholders, and business partners, for their efforts on behalf of the Fund.
Building the team, the infrastructure, the policy framework and the necessary relationships has
been a big endeavour. The support the Guardians and Fund have received over this period has been phenomenal and is deeply appreciated.
To mark the milestone, local iwi Nga-ti Wha-tua bestowed a Ma-ori name on the Guardians and Fund: Te Kaitiaki Ta-hua Penihana Kaumatua o- Aotearoa. We acknowledge and take pride in the gift of the name, and have incorporated it into our logo.”
In September 2013 we marked our 10th anniversary of investing at stakeholder events in Auckland and Wellington.
First independent review of the Guardians tabled in Parliament
Further external investment mandates awarded
First review of Strategic Asset Allocation completed
First commitment to New Zealand private equity announced
First New Zealand unlisted property mandate awarded
First purchase of New Zealand timber assets
First US timber purchase announced
The Guardians signs United Nations Principles of Responsible Investment
Minority interest acquired in Kaingaroa Forest
Adrian Orr appointed CEO
Fund divests from tobacco stocks
Paul Costello appointed CEO
Initial Strategic Asset Allocation determined
Commenced investing in September 2003 with NZD2.4 billion
First external investment mandates awarded
Board appointed
David May appointed Chair
Office established
2002
2003
2005
2004
2006
2007
Gavin Walker, Chair
OVERVIEW OF GUARDIANS AND FUND
| NEW ZEALAND SUPERANNUATION FUND | ANNUAL REPORT 201412
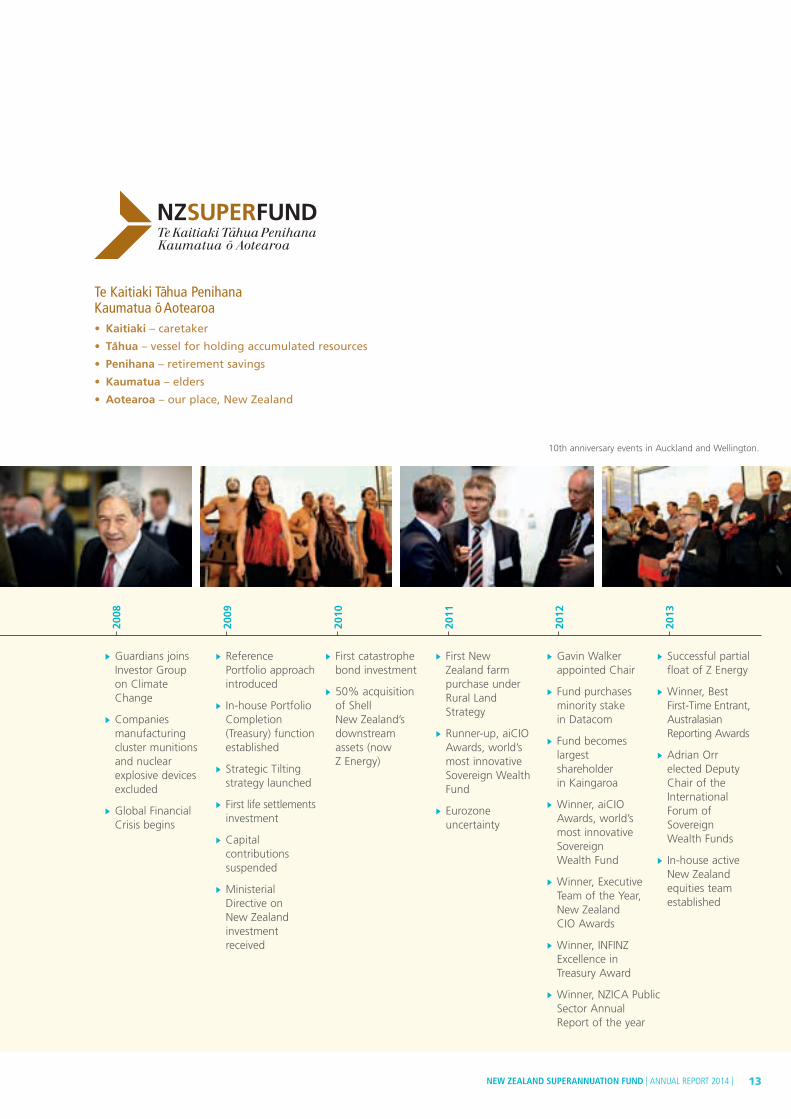
Guardians joins Investor Group on Climate Change
Companies manufacturing cluster munitions and nuclear explosive devices excluded
Global Financial Crisis begins
Reference Portfolio approach introduced
In-house Portfolio Completion (Treasury) function established
Strategic Tilting strategy launched
First life settlements investment
Capital contributions suspended
Ministerial Directive on New Zealand investment received
First catastrophe bond investment
50% acquisition of Shell New Zealand’s downstream assets (now Z Energy)
First New Zealand farm purchase under Rural Land Strategy
Runner-up, aiCIO Awards, world’s most innovative Sovereign Wealth Fund
Eurozone uncertainty
Gavin Walker appointed Chair
Fund purchases minority stake in Datacom
Fund becomes largest shareholder in Kaingaroa
Winner, aiCIO Awards, world’s most innovative Sovereign Wealth Fund
Winner, Executive Team of the Year, New Zealand CIO Awards
Winner, INFINZ Excellence in Treasury Award
Winner, NZICA Public Sector Annual Report of the year
Successful partial float of Z Energy
Winner, Best First-Time Entrant, Australasian Reporting Awards
Adrian Orr elected Deputy Chair of the International Forum of Sovereign Wealth Funds
In-house active New Zealand equities team established
2008
2010
2009
2011
2012
2013
10th anniversary events in Auckland and Wellington.
Te Kaitiaki Ta-hua Penihana Kaumatua o- Aotearoa • Kaitiaki – caretaker
• Ta-hua – vessel for holding accumulated resources
• Penihana – retirement savings
• Kaumatua – elders
• Aotearoa – our place, New Zealand
NEW ZEALAND SUPERANNUATION FUND | ANNUAL REPORT 2014 | 13

Progress against our Strategic Plan
Here we provide an overview of progress made during 2013/14 against the medium-term objectives in our 2013-2018 Strategic Plan.
OBJECTIVE: BEST PORTFOLIO
WHAT DOES SUCCESS LOOK LIKE IN 2018?
• Single view across a wide range of opportunities
• Higher reliance on internal capability to identify opportunities
• Opportunistic investing in a structured and consistent way
• Broad assessment of access points
• Systematic monitoring of strategies and managers
• Fully implemented investment strategies:– Adding value net of costs to the
Reference Portfolio– Improving the Sharpe Ratio– Maximising cost efficiency and effectiveness
• Risk taking is well aligned with risk appetite
ACHIEVEMENTS DURING 2013/14
• Fund-wide risk budget framework developed
• New cash and active collateral internal mandates implemented
• NZ and International Direct teams strengthened
• Internal NZ active equities mandate launched
PRIORITIES FOR 2014/15
• Complete implementation of the Risk Budget investment approach and supporting infrastructure
• Pursue more NZ and international direct deals: originate, execute and manage
• Improve collateral pool management
• Expand direct arbitrage strategy and exploit new Portfolio Completion opportunities
• Broaden and deepen the Strategic Tilting programme
OBJECTIVE: COLLABORATION WITH PEERS
WHAT DOES SUCCESS LOOK LIKE IN 2018?
• Co-investments alongside peers
• Regular bilateral exchange of best practice alongside wider effectiveness and efficiency benchmarking
• Active membership of global forums that exercise influence
ACHIEVEMENTS DURING 2013/14
• Iwi investor Kakano introduced as an investor to Kaingaroa Timberlands
• Innovation Alliance investments in Ogin Inc. and Bloom Energy
• Adrian Orr elected Deputy Chair of both the International Forum of Sovereign Wealth Funds and Pacific Pension Institute
PRIORITIES FOR 2014/15
• Focused peer engagement: fewer, deeper relationships targeting co-investments
• Active participation, leadership and agenda-setting at multilateral forums
OVERVIEW OF GUARDIANS AND FUND
Neil Woods, Chairman of Kaingaroa Timberlands; Antoine Bisson-McLernon of PSP; and Vanessa Eparaima, Chair of Kakano Investments.
| NEW ZEALAND SUPERANNUATION FUND | ANNUAL REPORT 201414

OBJECTIVE: BUILD AND MAINTAIN A GREAT TEAM
WHAT DOES SUCCESS LOOK LIKE IN 2018?
• Best practice across governance, enterprise risk management and IT
• Strong leadership, strong culture and values, focus on talent development and retention
ACHIEVEMENTS DURING 2013/14
• Overall employee engagement score of 71% compared to global average of 61%
• 92% rating (2nd out of 20 funds) in the GeoEconomica Santiago Principles (Best Practice) Compliance Index
PRIORITIES FOR 2014/15
• Implement formal learning and development programme
• Automate and simplify Human Resources systems and processes
• Focus annual performance incentives on achieving our desired culture
Global employee engagement average (CEB)
61Our employee engagement
71
OBJECTIVE: EFFICIENCY, SCALABILITY AND INNOVATION
WHAT DOES SUCCESS LOOK LIKE IN 2018?
• Best practice investment and operational processes and work flows
• High degree of transparency over our organisation and activities
• Improvement opportunities actively sought and measurable benefits realised
ACHIEVEMENTS DURING 2013/14
• New PEARL investment performance system introduced
• IT road map developed
• Trading under new central clearing regulations
• Intranet redeveloped and education modules launched
• New website substantially progressed; launched August 2014
PRIORITIES FOR 2014/15
• Develop or improve several technology platforms and operations systems: IT mobility; systems capability in trading over-the-counter derivatives; intranet; collateral optimisation
• Examine and incubate new ideas for business innovation through an Innovation Hub staff forum
% %
NEW ZEALAND SUPERANNUATION FUND | ANNUAL REPORT 2014 | 15

Governance
17 Overview
20 Board Members
22 Leadership Team
24 Principles
30 Independent Review
31 Risk Management
34 Remuneration and Discretionary Incentive Scheme
| NEW ZEALAND SUPERANNUATION FUND | ANNUAL REPORT 201416

The Guardians has been vested with the powers and responsibilities to allow it to perform its investment mandate. In turn, sound governance and quality public reporting, with a high degree of transparency, are critical to maintaining stakeholder and public confidence in the Guardians and Fund.
New Zealand Government Appoints members of independent Nominating Committee
Independent Nominating Committee Identifies candidates for the Guardians’ Board
Board and Management of the Guardians Decide investment policy and make investment decisions
Minister of Finance Selects Board candidates from the pool chosen
by independent Nominating Committee.Can direct the Guardians as to expectations of Fund’s
risk and return
First ‘arm’ of independence – Government does not decide pool of Board candidates
Second ‘arm’ of independence – investment decisions made by the Board and Management of the Guardians
The Guardians has a governance framework that:
• exemplifies best practice in the operation of a Sovereign Wealth Fund;
• ensures investment decisions are made on a purely commercial basis;
• reflects the New Zealand Financial Market Authority’s corporate governance principles;
• has a strong focus on transparency, legislative compliance, risk awareness and ethical behaviour; and
• provides clarity over accountability, roles and responsibilities.
GOVERNANCE FRAMEWORK
As an autonomous Crown entity, the Guardians is legally separate from the Crown and operates at ‘double-arm’s length’. The functions of the Guardians are to manage and administer the Fund. The Fund is a pool of Crown assets but is not an entity in its own right.
OverviewGOVERNANCE
NEW ZEALAND SUPERANNUATION FUND | ANNUAL REPORT 2014 | 17

Great Team – Our Policies CommunicationsHuman Resources
Procurement & OutsourcingRisk Management
Travel & Sensitive Expenditure
Best Portfolio – Our Policies Direct Investments
Externally Managed InvestmentsInvestment Risk Allocation
Portfolio Completion & Internally Managed Securities Policy
Strategic Tilting
DelegationsStatement of Investment Policies, Standards and Procedures (SIPSP)
Consistent with our commitment to transparency, the Board Charter, SIPSP and copies of the Guardians’ Policies are available on www.nzsuperfund.co.nz.
HOW DO WE IMPLEMENT GOVERNANCE?
The way in which governance is implemented at the Guardians and Fund is recorded in the Board Charter (including the Board Code of Conduct) and the following organisational policies:
Board Code of ConductThe Board Code of Conduct (the ‘Code’) sets out the standards for appropriate ethical and professional conduct for members of the Guardians Board. The Board Chair is responsible for monitoring compliance with the Code.
Under the Code, it is the collective responsibility of the Board to ensure that the Guardians:
• acts in a manner consistent with its objectives, functions and Statement of Intent;
• performs its functions efficiently, effectively and consistently with the spirit of service to the public;
• operates in a financially responsible manner; and
• complies with the legal requirements regarding subsidiaries and other entities.
It is each Board Member’s individual duty to:
• not contravene or cause the contravention of the Crown Entities Act 2004 or New Zealand Superannuation and Retirement Income Act 2001;
• act with honesty and integrity;
• act in good faith and not pursue his or her own interests at the expense of the Guardians’ interests;
• exercise the care, diligence and skill that a reasonable person would exercise in the same circumstances taking into account the nature of the Guardians, the nature of the action, the position of the member and the nature of his or her responsibilities;
• not disclose information obtained in his or her capacity as a Board Member, with some limited exceptions.
Among other items, the Code notes the desirability of having Board Members with relevant investment skills and work experience, and provides detailed guidance to Board Members on managing actual or perceived conflicts of interest.
Staff Code of Conduct and Securities Trading ProcedureOur Human Resources Policy, available on www.nzsuperfund.co.nz, includes our employee Code of Conduct. Among other provisions, the Code of Conduct requires all staff members and contractors to:
• keep all non-public information confidential;
• not benefit from the possession of confidential information for personal gain;
• disclose conflicts or possible conflicts of interest; and
• comply with the law.
The Human Resources Policy includes a detailed Securities Trading Procedure that aims to reduce the risk of the Guardians as an organisation, staff or contractors breaching the Securities Markets Act, or similar legislation. It does this by providing guidance on the law and the consequences of getting it wrong; setting rules about information flows; and setting rules about trading. Staff members are required to sign a quarterly attestation, which discloses any personal trading they have undertaken, and to seek permission in advance before trading securities and the NZD currency (over a threshold).
For further information on our Human Resources Policy, including on health and safety matters, see pages 77-79.
Overview (continued)
GOVERNANCE
| NEW ZEALAND SUPERANNUATION FUND | ANNUAL REPORT 201418

ACHIEVEMENTS IN 2013/14
• Risk Budget framework (see page 47) developed to further enhance the Risk Allocation Process;
• Continued Board and staff education programmes to promote staff and Board understanding of key investment concepts and strategies, and risk-management processes; and
• IT initiatives enabling greater staff technology utilisation, including enhanced business continuity planning, records management, relationship management tools and intranet systems, and greater access to information and data on mobile devices.
THE YEAR AHEAD – 2014/15
• Implementation of the Risk Budget investment approach;
• Examining and incubating new ideas for business innovation;
• Benchmarking resource capabilities against comparable organisations; and
• Reviewing our suite of policies including improving our documentation of key internal processes.
Intranet-based staff education module
NEW ZEALAND SUPERANNUATION FUND | ANNUAL REPORT 2014 | 19

Board MembersGOVERNANCE
1 GAVIN WALKER, CHAIR BCA
Gavin Walker was appointed to the Board of the Guardians of New Zealand Superannuation in July 2010, to the position of Deputy Chair in May 2012 and appointed Chair in September 2012. His term expires in June 2018.
Gavin is currently the Chair of ASB Bank, Sovereign Insurance, Commonwealth Securities Ltd and the Kirin International Advisory Board. He has been a Director of Lion Pty Ltd since 2000. Gavin has extensive experience in the funds management industry, including as CEO of Bankers Trust Investment Bank in both New Zealand and Australia. He is a past chairman of the Foreign Direct Investment Advisory Board and a past director of BT Investment Management Limited, Southern Cross Building Society and Goodman Fielder Limited.
Committee membership: Chair, Employee Policy and Remuneration; Audit
2 CATHERINE SAVAGE, DEPUTY CHAIR BCA, CA
Catherine Savage was appointed to the Board of the Guardians of New Zealand Superannuation in November 2009 and as Deputy Chair in September 2012. Her term of office expires on 30 September 2019.
Catherine is Chair of the National Provident Fund, an independent Director of Kiwibank, Todd Family Office Ltd., and NZICA as well as a Director of Pathfinder Asset Management. She is also the Managing Director of CMS Capital Limited.
Catherine was Treasurer of the National Gas Corporation from 1991-1993 prior to moving to AMP Capital Investors (NZ) Ltd where she worked in various senior management roles until 2000 when she became the Managing Director – AMP’s youngest and only female country manager.
Committee membership:Employee Policy and Remuneration
3 STEPHEN MOIR
Stephen Moir was appointed to the Board of the Guardians of New Zealand Superannuation in November 2009. His term of office expires on 30 September 2019. Stephen is Chair of BNZ Life Insurance and a non-executive director of the Bank of New Zealand.
Stephen has more than 25 years of experience in financial services, including being the General Manager of the Westpac Institutional Bank from 1998-2001, preceded by senior positions with Credit Suisse in Singapore, Citibank in Singapore, Bangkok and Sydney.
Committee membership: Employee Policy and Remuneration
4 MARK TUME BBS, Dip. Banking Studies
Mark Tume was appointed to the Board of the Guardians of New Zealand Superannuation in April 2006. His term of office expires on 30 April 2016.
Over his career, Mark has held a variety of senior roles within the finance sector, in areas such as investment management, capital markets, asset and liability management, and risk control.
Mark holds a number of directorships, including New Zealand Oil and Gas, the New Zealand Refining Company Limited and the Chairmanship of Infratil Limited.
Mark is a past recipient of the Victoria University of Wellington Hunter Fellowship.
Committee membership:Chair, Audit
5 CRAIG ANSLEY BSc (Hons), PhD
Craig Ansley was appointed to the Board of the Guardians of New Zealand Superannuation in September 2011. His term of office expires on 30 September 2016.
Craig is an Adjunct Professor in Finance at the University of Auckland and a Board member of the Government Superannuation Fund Authority.
Prior to his retirement in October 2010, Craig spent many years in senior roles with Russell Investment Group. A founder of Russell’s New Zealand office, Craig has been the Director of its Australasian consulting practice, the Director of Capital Markets Research in Australia and New Zealand Chair.
Craig was a member of the Savings Working Group in 2010-11 and has been a director of the Mortgage Corporation of New Zealand Limited and Mortgage Services Limited, Group Rentals New Zealand Limited and the National Provident Fund.
Craig is a Fellow of the New Zealand Society of Actuaries.
Committee membership: Audit
6 PIP DUNPHY BHort Science, CFA
Pip Dunphy was appointed to the Board of the Guardians of New Zealand Superannuation in May 2012. Her term of office expires on 30 April 2017.
A former member of the Nominating Committee for the Guardians, Pip’s work experience and knowledge is in capital markets, banking, finance and investment management. Her previous governance experience includes being a board member of Auckland Transport, NZ Post,the Earthquake Commission, ACC and Crown Health Financing. Current appointments include Chair of Solid Energy and NZ Clearing House Depository, and directorships at Abano Healthcare and Fonterra Shareholders Fund.
Committee membership: Audit
7 LINDSAY WRIGHT BCom
Lindsay Wright was appointed to the Board of the Guardians of New Zealand Superannuation on 1 December 2012. Her term of office expires on 31 October 2017.
Lindsay is the CEO of Harvest Alternatives Investment Group, the alternatives arm of Harvest Fund Management, the second largest
| NEW ZEALAND SUPERANNUATION FUND | ANNUAL REPORT 201420

asset management company in China. She is also Head of Strategy and Business Development for the Harvest Fund Management Group and Vice Chairman of Harvest Global Investments. Lindsay also holds a Directorship with Kiwibank.
Prior to joining Harvest in September 2010, Lindsay was Managing Director and Global Head of Strategy and Business Development for Deutsche Asset Management/DWS based in New York.
During a 24 year career with Deutsche Asset Management and Deutsche Bank, Lindsay held roles including Head of Strategy and
4
2 3
65
1
7
Business Development for Deutsche Asset Management, Asia Pacific and Middle East region, based in Singapore; Chief Operating Officer Deutsche Asset Management, Asia Pacific, based in Tokyo; Managing Director and Partner, DB Capital Partners Asia Pacific, the direct private equity business of Deutsche Bank, based in Sydney; and Managing Director, Chief Financial and Operating Officer, Deutsche Bank New Zealand (formerly Bankers Trust New Zealand), based in Auckland.
Committee membership:Audit
NEW ZEALAND SUPERANNUATION FUND | ANNUAL REPORT 2014 | 21

Leadership TeamGOVERNANCE
1 ADRIAN ORR, CHIEF EXECUTIVE OFFICER BSocSci, MA (Dist)
Adrian joined the Guardians in February 2007 from the Reserve Bank of New Zealand where he was Deputy Governor. Adrian has also held the positions of Chief Economist at Westpac Banking Corporation, Chief Manager of the Economics Department of the Reserve Bank of New Zealand and Chief Economist at The National Bank of New Zealand. He has also worked at the NZ Treasury and the OECD based in Paris. Adrian is the Deputy Chair of International Forum of Sovereign Wealth Funds, Vice Chair of the Pacific Pensions Institute, a member of the Long-Term Investment Council for the World Economic Forum and of the Expert Advisory Group for the World Bank’s Treasury. He is also a Board Member of the Emory Center for Alternative Investments at Emory University, Atlanta, Georgia.
Areas of responsibility: General management of the Guardians under delegation from the Board.
2 MATT WHINERAY, CHIEF INVESTMENT OFFICER BCom, LLB (Hons)
Matt joined the Guardians in May 2008 from Credit Suisse (Hong Kong) where he was Head of Financial Sponsor Coverage for non-Japan Asia. Prior to this, Matt was a Managing Director of First NZ Capital and Vice President at Credit Suisse First Boston (New York). Matt began his career as a Barrister and Solicitor with Russell McVeagh.
Matt is a member of the Future of Investing Council for the World Economic Forum.
Areas of responsibility: Appointment of investment managers, asset allocation, investment analysis including macroeconomic strategy and responsible investment, NZ and international direct investments, public and private market investments.
3 MIKA AUSTIN, GENERAL MANAGER HUMAN RESOURCES BA/LLB
Prior to joining the Fund in 2012 as Head of Human Resources, Mika was a Senior Associate with Russell McVeagh, specialising in commercial litigation. She has also worked for the Financial Services Authority in London.
Areas of responsibility People and performance, culture.
4 STEWART BROOKS, GENERAL MANAGER FINANCE BCom, CA
Stewart joined the Guardians in 2003 from Sterling Grace Portfolio Management Group, where he was Group Company Secretary. Stewart was previously Financial Controller for Motorola Cellular and worked in private equities for seven years. Prior to this, he worked for a computer multinational in the UK.
Areas of responsibility: Chair, Risk Committee; external audit process, financial reporting, financial control, tax.
5 MARK FENNELL, GENERAL MANAGER PORTFOLIO COMPLETION MSocSci (Hons), DipAcc, ACA, CTP
Mark joined the Guardians in 2007 from The Warehouse Group, where he was the Company Secretary and Treasurer. Mark also has significant public sector experience, working in a senior finance position for the Ministry of External Relations and Trade, and for State Owned Enterprises (Forestry Corporation and NZ Railways Corporation).
Areas of responsibility:Treasury operations including passive exposure, currency overlay, liquidity management and portfolio rebalancing; portfolio investments.
6 SARAH OWEN, GENERAL MANAGER CORPORATE AFFAIRS AND GENERAL COUNSEL BA/LLB, DipAcc
Sarah joined the Guardians in 2007 from Westpac/BT Funds Management where she was senior legal counsel/company secretary for the Westpac wealth management companies. Prior to this, Sarah was a Senior Associate at Minter Ellison Rudd Watts, and before that, DLA Phillips Fox, specialising in funds management/superannuation and commercial law.
Areas of responsibility: Legal, Board secretariat, communications, records management.
7 DAVID SARA, GENERAL MANAGER OPERATIONS BMS(Hons), MBS(Dist)
David joined the Guardians in 2009. He has substantial experience in financial services, including as Head of Strategy with UK-based Platform Home Loans, Head of Venture Development for Lloyds Banking Group, and Manager of Strategic Planning for the National Bank of New Zealand.
Areas of responsibility:Information technology, investment operations, portfolio risk and compliance.
| NEW ZEALAND SUPERANNUATION FUND | ANNUAL REPORT 201422

PORTFOLIO COMPLETION Mark Fennell
OPERATIONS David Sara
INVESTMENTS Matt Whineray
BOARD
LEGAL COMMUNICATIONS
ACCOUNTING
RECORDS MANAGEMENT
HUMAN RESOURCES
TAX
INTERNAL AUDIT
ASSET ALLOCATION NZ DIRECT
INTERNATIONAL DIRECT
INVESTMENT ANALYSIS
INVESTMENTS
ITINVESTMENT OPERATIONS
PORTFOLIO COMPLETION
PORTFOLIO INVESTMENTS
PORTFOLIO RISK & COMPLIANCE
CEO Adrian Orr
STRATEGIC DEVELOPMENT
HUMAN RESOURCES Mika Austin
FINANCE Stewart Brooks
CORPORATE AFFAIRS Sarah Owen
GUARDIANS OF NZ SUPERANNUATION – ORGANISATIONAL CHART
1
4
7
2 3
65
NEW ZEALAND SUPERANNUATION FUND | ANNUAL REPORT 2014 |NEW ZEALAND SUPERANNUATION FUND | ANNUAL REPORT 2014 | 23

GOVERNANCE
Principles
This section reports on the Guardians’ governance framework in relation to each of the Financial Markets Authority’s corporate governance principles in the year to 30 June 2014.
DIRECTORS SHOULD OBSERVE AND FOSTER HIGH ETHICAL STANDARDS
Both the Board and employees have codes of conduct setting out clear expectations of the ethical standards expected at the Guardians. The codes, which are discussed further on page 18, address:
• professional conduct and duties of Board members and employees;
• conflicts of interests;• confidentiality;• securities markets legal obligations;• use of Guardians’ information and assets;
• receipt of gifts and entertainment;
• political participation; and
• whistleblowing.
For Board members, actual or potential conflicts of interest are managed in accordance with the requirements of the Guardians’ governing legislation. The codes are reviewed regularly as part of the Guardians’ Legislative Compliance Framework and are available on www.nzsuperfund.co.nz.
1
2THERE SHOULD BE A BALANCE OF INDEPENDENCE, SKILLS, KNOWLEDGE, EXPERIENCE AND PERSPECTIVES AMONG DIRECTORS SO THAT THE BOARD WORKS EFFECTIVELY
The skills and attributes required for a person to be a Board member are set out in the Act. Board members are chosen for their experience, training and expertise in the management of financial investments, as well as their collective mix of complementary skills.
Board members are appointed by the Governor-General on the recommendation of the Minister of Finance. The Minister’s recommendation follows nominations from a committee, independent of the Guardians, which is established by the Minister. On receiving those nominations, the Minister consults with representatives of other political parties in Parliament before recommending the Governor-General appoint a person to the Board.
The Board must comprise at least five, but no more than seven, members. Each Board member is appointed for a term of up to five years and is eligible to be reappointed.
The first Board members were appointed in August 2002. The Board composition at 30 June 2014 with details of individual Board members’ backgrounds is set out on pages 20-21.
The Guardians’ governing legislation and the Board Charter define Board responsibilities, responsibilities of individual Board members, as well as matters reserved for the Board and matters delegated to management. While the day-to-day responsibility for the operation of the business is delegated to the Chief Executive Officer, there are a number of matters which, either because it is required by law or because the Board has decided it is in the interests of the Guardians to do so, are decided only by the Board as a whole.
The Board regularly reviews its delegations and governance priorities. The Board also hears directly from a range of external experts on investment markets, and regularly visits international peer funds for the purpose of assessing developments in best practice.
| NEW ZEALAND SUPERANNUATION FUND | ANNUAL REPORT 201424

THE BOARD SHOULD USE COMMITTEES WHERE THIS WOULD ENHANCE ITS EFFECTIVENESS IN KEY AREAS WHILE RETAINING BOARD RESPONSIBILITY
The Board had two standing committees during the 2013/14 financial year:
• Audit Committee: Oversees financial reporting, internal and external audit, compliance (including tax compliance), accuracy of financial statements, and other control systems.
• Employee Policy and Remuneration Committee (EPRC): Oversees the development and operations of employment and remuneration policies.
The roles and responsibilities of each Board committee are set out in the respective committee’s Terms of Reference. Copies of the Terms of Reference are available on www.nzsuperfund.co.nz in the Board Charter.
Minutes of the committees’ meetings are provided to the Board. In addition, all Board members are able to attend any committee meeting.
From time to time, the Board may establish a specific subcommittee to address a particular matter or for a particular purpose. This allows the Board to function effectively and to manage conflicts of interest.
The Board committees either meet quarterly or are convened as necessary. Each committee is entitled to the resources and information it requires to operate effectively. The Chief Executive Officer and other management are invited to attend committee meetings as necessary.
The Board met seven times during 2013/14, including for a Strategy Day. The Audit Committee met four times and the Employee Policy and Remuneration Committee met five times. The following table sets out the number of meetings attended by each Board member relative to the total number of meetings they could have attended.
BOARD AUDIT COMMITTEE EPRC
Number of meetings 7 4 5
Gavin Walker 7/7 4/4 5/5
Mark Tume 7/7 4/4 N/A
Stephen Moir 7/7 1/1* 5/5
Catherine Savage 7/7 1/1* 4/5
Craig Ansley 7/7 4/4 N/A
Philippa Dunphy 6/7 4/4 N/A
Lindsay Wright 7/7 4/4 N/A
* The full Board joins the Audit Committee in its review of the annual financial statements.
3
NEW ZEALAND SUPERANNUATION FUND | ANNUAL REPORT 2014 | 25

4THE BOARD SHOULD DEMAND INTEGRITY BOTH IN FINANCIAL REPORTING AND IN THE TIMELINESS AND BALANCE OF DISCLOSURES ON ENTITY AFFAIRS
As a Crown entity, the Guardians must meet all its obligations in respect of the Guardians and the Fund under the Act, the Crown Entities Act 2004 and the Public Finance Act 1989.
The diagram below summarises the Guardians’ reporting requirements.
Reporting Framework
THREE-YEARLY ANNUALLYQUARTERLY TO MINISTER MONTHLY AS IT HAPPENS
Five-year Statement of Intent setting out key strategic objectives and performance measures
Annual Statement of Performance Expectation forecasting Fund performance and setting out priority activities for the year
Annual Report summarising the year’s performance against the Annual Statement of Performance Expectation
Review by Parliamentary Select Committee with participation from the Office of the Auditor-General
Fund Performance
Important decisions made about the Fund
Important developments at the Guardians
Fund Performance
Portfolio composition
Major listed holdings
Anything necessary to comply with the expectation that we will operate on a ‘No Surprises’ basis with the Minister of Finance
Responses to questions from Parliament, media and via the Official Information Act 1982
Following amendments to the Crown Entities Act which came into force on 1 July 2014, the Guardians is required to prepare a three-yearly Statement of Intent (SOI) and annual Statement of Performance Expectation (SPE).
The Statement of Intent, which sets out strategic objectives and performance measures for the five years from 2014–2019, was published in July 2014.
The Annual Statement of Performance Expectation sets out a detailed plan of work and financial forecasts for the coming financial year.
The Guardians’ objectives for the 2013/14 financial year were set out in the 2013–2018 Strategic Plan and Statement of Intent, and are reported against in the Statement of Service Performance at pages 86-90 of this Annual Report.
Copies of our Statements of Intent and Statement of Performance Expectation are available on www.nzsuperfund.co.nz.
The Annual Report, which is tabled in the House of Representatives, is available to the public in hard copy and on www.nzsuperfund.co.nz. The report contains both financial statements for the Fund, which are signed by the Chair of the Board and the Chief Executive Officer, and financial statements for the Guardians, which are signed by the Chair and one other Board member.
The Guardians also reports quarterly to the Minister of Finance with a written report on the progress of the Fund and the Guardians.
The Guardians reports to a Select Committee annually or upon request. The Guardians provided written responses to a series of questions from the Committee in March 2014. A link to the Parliamentary record, which includes the Guardians’ full written responses, is available on www.nzsuperfund.co.nz.
The Guardians received eight Official Information Act 1982 requests during 2013/14. This compares to seven in 2012/13.
The requests related to:
• Exclusion of Africa Israel, Danya Cebus, Elbit Systems, Shikun & Binui and FreePort-McMoran from the Fund; material relating to G4S, Caterpillar and Bank Hapoalim;
• Scales Corporation and South Canterbury Finance;
• Ogin Inc.;
• Energy investments, decision-making processes and management of conflicts of interest;
• Renewable energy, energy efficiency, biofuels and clean technology investments;
• The Minister of Finance’s Letter of Expectation and response.
As at 30 June 2014, one request was outstanding.
GOVERNANCE
Principles (continued)
| NEW ZEALAND SUPERANNUATION FUND | ANNUAL REPORT 201426

5
6
8
7
THE REMUNERATION OF DIRECTORS AND EXECUTIVES SHOULD BE TRANSPARENT, FAIR AND REASONABLE
The remuneration of Board members is set by the Minister of Finance operating in accordance with the Fees Framework for Members of Statutory and Other Bodies Appointed by the Crown. Board members’ remuneration is disclosed in Note 11 to the Guardians’ financial statements.
Comprehensive information regarding executive remuneration including details of the Guardians’ discretionary incentive scheme is disclosed at pages 34-35 and at Note 12 of the Guardians’ financial statements.
THE BOARD SHOULD REGULARLY VERIFY THAT THE ENTITY HAS APPROPRIATE PROCESSES THAT IDENTIFY AND MANAGE POTENTIAL AND RELEVANT RISKS
The Board has a number of strategies in place to safeguard the Fund’s and Guardians’ assets and interests, and to ensure the integrity of reporting.
For further information, see our discussion of Risk Management on pages 31-33.
THE BOARD SHOULD ENSURE THE QUALITY AND INDEPENDENCE OF THE EXTERNAL AUDIT PROCESS
The Audit Committee is responsible for overseeing the external audit of the Guardians and the Fund. Accordingly, it monitors developments in the areas of audit and threats to audit independence, to ensure its policies and practices are consistent with emerging best practice in these areas. The external auditors are not permitted to perform non-audit work assignments without the approval of the Audit Committee.
The Auditor-General has appointed, to carry out the external audit of the Guardians and the Fund on her behalf, Brent Penrose of Ernst & Young.
THE BOARD SHOULD FOSTER CONSTRUCTIVE RELATIONSHIPS WITH STAKEHOLDERS THAT ENCOURAGE THEM TO ENGAGE WITH THE ENTITY
The Guardians is a Crown entity and its assets, and the assets of the Fund, form part of the Crown’s assets. The Guardians is accountable to Parliament, through the Minister of Finance, for those assets. A summary of the Guardians’ reporting requirements is outlined on page 26.
As noted on page 17, the Guardians is an autonomous Crown entity that operates at ‘double-arm’s length’ from political stakeholders. This helps ensure that investment decision-making is on a purely commercial basis.
Nevertheless, it is desirable that a degree of alignment is attained with key external stakeholders (e.g. the Minister of Finance, Cabinet, Treasury and parliamentarians generally) around the strategic objectives for the Guardians, to ensure that stakeholders do not oppose those objectives and, ideally, support them.
The Minister of Finance may give directions regarding the Crown’s expectations as to the Fund’s performance, including its expectations regarding risk and return. However, the Minister may not give any direction that is inconsistent with the duty to invest the Fund on a prudent, commercial basis.
No directions were received in the 2013/14 financial year. We report on our progress in implementing the single direction received to date (May 2009, about our New Zealand investment activities) on pages 57-60 of this Annual Report.
Along with the other New Zealand Crown Financial Institutions, the Guardians received an annual Letter of Expectation from the Minister of Finance on 21 March 2014.
This letter and the Guardians’ response are available on www.nzsuperfund.co.nz.
See pages 28-29 for more information on stakeholder engagement activities.
NEW ZEALAND SUPERANNUATION FUND | ANNUAL REPORT 2014 | 27

GOVERNANCE
Principles (continued)
THE BOARD SHOULD RESPECT THE INTERESTS OF STAKEHOLDERS WITHIN THE CONTEXT OF THE ENTITY’S OWNERSHIP TYPE AND ITS FUNDAMENTAL PURPOSE
In addition to the Government, Parliament and the Minister of Finance, the Guardians’ key stakeholder groups include:
• public of New Zealand;
• asset and investment managers (for a full list of Managers and Custodians see pages 91-94);
• co-investors;
• Crown Financial Institutions such as ACC and Government Superannuation Fund;
• employees;
• investee companies;
• investor groups (e.g. UNPRI);
• iwi;
• media;
• non-government organisations (NGOs);
• peer funds;
• regulatory bodies in New Zealand and globally;
• relevant New Zealand public sector agencies (e.g. Treasury, Reserve Bank, State Services Commission, Financial Markets Authority, Commerce Commission, Inland Revenue, Office of the Auditor General and Ministry of Business Innovation and Enterprise); and
• suppliers.
We strive to be as transparent as possible about our management of the Fund and the way in which the Fund performs. Our stakeholders can access a wealth of current, detailed information easily on our website.
This information includes: monthly performance and portfolio reports; detailed historical performance figures for the Fund since inception; and copies of our media statements along with speeches and presentations given by staff and Board members of the Guardians.
The Guardians is an active participant in a wide range of industry networks and investor groups, and has close working relationships with a number of government agencies, in particular the Crown Monitoring Unit within the New Zealand Treasury. We also put significant effort into managing our relationships with peer funds, investment managers and potential co-investors.
The Guardians continued to actively participate in a wide range of global investment and responsible investment initiatives during the year. Groups on which we are represented at Board/Governance level include the following:
• International Forum of Sovereign Wealth Funds;
• Pacific Pension Institute;
• Emory University Center for Alternative Investments;
• World Economic Forum Long-term Investment Council;
• World Bank Expert Advisory Council; and
• Responsible Investment Association of Australasia.
We also participate at all levels in the Rotman International Centre for Pension Management, International Pensions Conference, United Nations Principles for Responsible Investment and the Carbon Disclosure Project.
Stakeholder engagement and collaboration activities undertaken in 2013/14 included:
• facilitation of a collaborative roundtable for the New Zealand Crown Financial Institutions and ongoing collaboration with them on responsible investment and central clearing;
• collaboration with Treasury and the Reserve Bank of New Zealand on Crown balance sheet modelling;
• facilitation of education sessions on the Guardians and Fund for Treasury relationship managers, on topics including strategic tilting, use of derivatives, responsible investment, performance reporting and liquidity management;
• formation of a group of like-minded New Zealand institutional investors to advance best practice corporate governance in domestic capital markets;
• participation, alongside other Sovereign Wealth Funds, in the Sovereign Wealth Fund Tax Forum, Canadian Pension Counsel Forum and Fiduciary Investors Forum;
• participation in a discussion forum at The University of Auckland Retirement Policy and Research Centre;
9
| NEW ZEALAND SUPERANNUATION FUND | ANNUAL REPORT 201428

• sponsorship of the annual Responsible Investment Association of Australasia NZ Conference;
• engagement with stakeholder representatives to inform the redevelopment of www.nzsuperfund.co.nz; and
• communications and stakeholder events to support the anniversary of 10 years of investment of the Fund, including the unveiling of Te Kaitiaki Ta-hua Penihana Kaumatua o- Aotearoa, our new Ma-ori name.
Priorities for 2014/15 include:
• further progressing collaborative work to improve corporate governance in New Zealand capital markets;
• continuing to collaborate with Treasury and the Reserve Bank of New Zealand on Crown balance sheet modelling;
• completion of a stakeholder perception audit and engagement to enhance the quality and relevance of our public reporting; and
• developing relationships across a range of potential interest groups to create additional co-investment opportunities.
10th anniversary events in Auckland and Wellington
NEW ZEALAND SUPERANNUATION FUND | ANNUAL REPORT 2014 | 29

Independent ReviewGOVERNANCE
Our Act requires the Minister of Finance, periodically, to appoint an independent reviewer to review how efficiently and effectively the Guardians is performing its functions.
The Minister of Finance sets the Terms of Reference for the review, which must be undertaken at intervals that are no more than five years apart.
The first independent review of the Guardians was completed in August 2004 by Jonathan Eriksen. A second review was conducted by Mercer in October 2009.
A third review, by Promontory Financial Group (www.promontory.com), commenced in May 2014. Promontory’s report and the Guardians’ response to its recommendations will be published on www.nzsuperfund.co.nz in 2014/15.
| NEW ZEALAND SUPERANNUATION FUND | ANNUAL REPORT 201430
Risk ManagementGOVERNANCE
Understanding and managing the risks that the Fund faces – investment, operational, legal, reputational and strategic – is central to the work of the Guardians.
Risk is a necessary part of doing business for any investment fund and we must take investment risk in order to achieve our mission. Risk must be understood to ensure that the risks taken are appropriate, however, for the returns anticipated.
The Board is responsible for reviewing and approving the Guardians’ risk-management strategy, including its risk-management framework and Risk Records. It does this on a regular schedule that is set out in the Board calendar. The Board also considers special reviews undertaken by the Guardians’ Risk Committee on a case-by-case basis.
The Guardians has extensive risk-management policies, procedures and other internal controls for application by staff, external investment managers and other expert service providers. Our approach to managing investment risks is set out in our Statement of Investment Policies, Standards and Procedures and Risk Management Policy, both of which are available on www.nzsuperfund.co.nz.
The Board has developed a risk-appetite statement outlining its expectations of the level of risk that is appropriate for the Fund to take on. This statement can be found at Schedule 2 of the Risk Management Policy. The Guardians’ performance against this statement is measured and reported to the Board on a regular basis, with any major breaches being notified on an exception basis.
The Audit Committee reviews the reports of management, and of the internal and external auditors, on the effectiveness of systems for internal control and financial reporting.
The Board delegates day-to-day management of risk to the Chief Executive Officer. Inherent in this delegation is a desire to ensure that day-to-day responsibility for risk management is at the business unit level, where risk is seen as part of the overall business process, and a robust framework of identification, evaluation, monitoring and control exists.
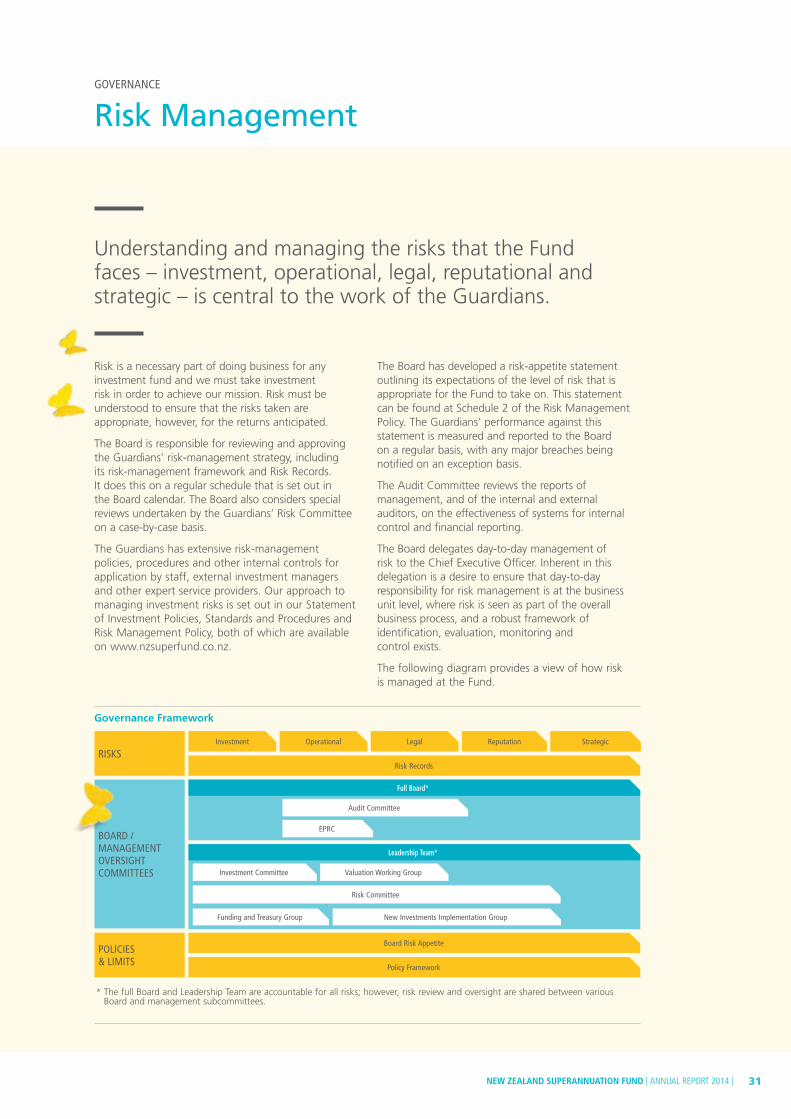
The following diagram provides a view of how risk is managed at the Fund.
RISKSRisk Records
Board Risk Appetite
Policy Framework
Risk Committee
Funding and Treasury Group New Investments Implementation Group
Investment
Investment Committee Valuation Working Group
Audit Committee
EPRC
Operational Legal Reputation Strategic
BOARD / MANAGEMENT OVERSIGHT COMMITTEES
POLICIES& LIMITS
* The full Board and Leadership Team are accountable for all risks; however, risk review and oversight are shared between various Board and management subcommittees.
Governance Framework
Full Board*
Leadership Team*
NEW ZEALAND SUPERANNUATION FUND | ANNUAL REPORT 2014 | 31

Risk Management (continued)
GOVERNANCE
RISK RECORDS AND RISK REGISTERS
As part of our efforts to proactively identify, manage and monitor risk, we have identified 11 risks that span all of the Guardians’ various business units. They are:
Alignment Governance Mindset
Building Services & IT Infrastructure Investments – Value Add Strategies Models & Data
Execution & Process Management Legal & Regulatory Skills & Capability
Fraud & Ethics Major Supplier
For each of these risks, the Guardians maintains a ‘Risk Record’ setting out an assessment of inherent and residual risk, causes, impacts, key controls, mitigants and open action items. The Risk Records provide a top-down view for managing risk across the entire organisation. They are complemented by bottom-up tools – individual Risk Registers maintained by each business unit.
MONITORING
Staff compliance with the relevant policies and procedures is actively monitored, as is compliance by external managers with the mandates we give them.
The following table sets out performance against key Fund risk measures relating to rebalancing (designed to keep the Fund’s overall volatility in line with the Reference Portfolio), strategic tilting active risk, active manager risk limits and target levels of liquidity. It refers to potential rather than actual risk and is designed to encourage continuous disclosure and improvement (lessons learned).
PERFORMANCE AGAINST KEY FUND RISK MEASURES
TARGET 2013/14 2012/13 2011/12
INVESTMENT RISK MEASURES
REBALANCING
• Breaches of absolute risk limit (overall acceptable level of risk in the Fund) post-portfolio rebalancing 0 0 0 0
• Breaches of relative risk limit (rebalancing limits) post-portfolio rebalancing 0 0 0 0
BREACHES OF ACTIVE MANAGER LIMIT 0 0 0 0
TILTING
• Breaches of strategic tilting active risk limit post-portfolio rebalancing 0 0 0 0
• Breaches of strategic tilting absolute risk limit post-portfolio rebalancing 0 0 0 0
BREACHES OF TARGET LIQUIDITY LEVEL 0 0 0 0
BUSINESS RISK MEASURES
• Active breaches of compliance with investment mandates* 0 3 5 4
• Loss of data/IT services of more than 30 minutes 0 0 0 0
• Regulatory non-compliance 0 0 0 0
• Reported instances of fraud 0 0 0 0
• Restatement of Fund reporting 0 0 0 0
• Operational incidents or errors rated as potentially high risk** N/A 3 0 6
* Our custodian reports any breaches of compliance with the Fund’s segregated listed investment mandates to us for investigation and discussion with the manager involved (e.g. failing to sell a stock that had dropped out of an index within an agreed time period). All breaches, passive and active, are factored into our monitoring and reviews of our external and internal investment managers. In the case of serious incidents, a claims process may be available to the Fund. All active mandate breaches were resolved prior to year-end.
** The Guardians has a structured process for reporting, investigating and rectifying operational incidents and errors (e.g. a data entry error or a failure to correctly follow a process/instruction). Incidents or errors with potentially medium or high impacts are reported to the Board’s Audit Committee as soon as is practicable. As our objective is to capture as much information as possible with a view to improving our processes and controls, we do not set a target for reducing the number of errors reported. The potential operational incidents and errors reported during the period did not expose the Fund to any actual high risk.
| NEW ZEALAND SUPERANNUATION FUND | ANNUAL REPORT 201432

RISK COMMITTEE
The role of the Guardians’ Risk Committee, the organisation’s key risk oversight body, was reviewed during the year. The purpose of the review was to strengthen the capability of the Committee and focus it on the most important enterprise-wide risks.
The Committee is now focused on:
• assessing potential risk profile changes;
• undertaking specific reviews on behalf of management to confirm risks are being managed effectively;
• assessing the effectiveness of control frameworks including Risk Records and Risk Registers;
• obtaining confirmation from the business that specific processes are robust and used consistently, and that any exceptions are handled appropriately; and
• smoothing and simplifying processes to facilitate organisational scalability, while ensuring effective risk management.
The Risk Committee has benchmarked its approach for identifying and assessing emerging and existing enterprise-level risks. There is a diverse range of risk reporting and assessment practices in use internationally; these are being considered by the Committee. Enhancements in 2014/15 are expected to further improve the visibility of potential changes to the Guardians’ top risks.
The Risk Committee is continuing to review operational risk assessments of prospective new investments. Post-implementation reviews of investment strategies, opportunities, access points and other Fund activities formerly undertaken by the Risk Committee are now being undertaken by the Guardians’ Investment Committee.
The members of the Risk Committee are: General Manager Finance, Stewart Brooks (Chair); Head of Portfolio Risk and Compliance, Michael Mitchell (Deputy Chair); General Manager Operations, David Sara; Head of Internal Audit, Garry Sue; General Counsel/General Manager Corporate Affairs, Sarah Owen.
NEW ZEALAND SUPERANNUATION FUND | ANNUAL REPORT 2014 | 33
GOVERNANCE
Remuneration and Discretionary Incentive Scheme
Being able to attract, retain and develop high-calibre people is vital to our success and our ability to maximise the Fund’s returns without undue risk. The global investment market is highly competitive and we can find and enter into the best investment strategies only if we have capable and experienced staff.
Staff salaries, including incentive payments, are met by the Fund and not by parliamentary appropriation. We aim for an employment offering which is reasonable in the New Zealand context but also sufficient to recruit and retain the talented people who can deliver value in terms of Fund performance, relative to cost incurred. Remuneration is benchmarked against the New Zealand finance sector.
The Guardians’ remuneration framework includes base remuneration and a discretionary incentive scheme.
BASE REMUNERATION
Every employee has a pay range associated with their position. Pay ranges are determined by positions being evaluated by remuneration specialists using market evaluation systems, and are authorised by the Chief Executive Officer and General Manager Human Resources.
Employee remuneration levels are based on:
• independently determined job sizes;
• employees’ competence in roles; and
• current, independent remuneration market data.
The Employee Policy and Remueration Committee reviews the Chief Executive Officer’s remuneration and makes recommendations to the Board. The Chief Executive Officer’s remuneration is determined in consultation with the State Services Commission and, where relevant, the Minister of Finance. The final decision, however, is made by the Board.
The remuneration of the Chief Executive Officer’s direct reports is overseen by the Employee Policy and Remuneration Committee.
Refer to the Guardians’ Human Resources Policy, available on www.nzsuperfund.co.nz, for more information.
DISCRETIONARY INCENTIVE SCHEME
Discretionary incentive payments are linked to individual objectives and, where appropriate, to long-term, whole-of-Fund financial performance. All bonus payments are at the discretion of the Board.
There are two components to the bonus payments, both of which are variable:
• annual achievement of individual objectives; and
• whole-of-Fund financial performance over rolling four-year periods, comprising:
– performance compared to the 90-day Treasury Bill return; and
– performance compared to the Fund’s Reference Portfolio (passive benchmark).
Every permanent staff member is eligible to receive a bonus payment for the achievement of individual objectives.
The Chief Executive Officer, Leadership Team and staff in the Investments and Portfolio Completion teams (47 out of a total of 98 staff members as at 30 June 2014) are eligible for the financial performance component of the incentive scheme.
The financial performance components are measured over four-year moving averages and, hence, take four years to reach their full potential. Payments made in any one year will reflect a four-year moving history.
| NEW ZEALAND SUPERANNUATION FUND | ANNUAL REPORT 201434

OTHER BENEFITS
A range of other benefits is also offered to permanent staff on a discretionary, non-contractual basis. These benefits include income protection insurance, life insurance and health insurance.
MAXIMUM POTENTIAL BONUS AS A % OF BASE REMUNERATION
BONUS SCHEME STRUCTURE CORPORATE STAFF
INVESTMENTS AND PORTFOLIO
COMPLETION STAFF
CEO AND REMAINING
MEMBERS OF THE LEADERSHIP TEAM
Individual objectives 20% 30% 20%
Financial performance vs. Treasury Bills (4-year moving average) N/A 10% 6.67%
Financial performance vs. Reference Portfolio (4-year moving average) N/A 20% 13.33%
INCENTIVE ACHIEVEMENT IN 2013/14
• Total incentives to be paid: NZD5.2 million (NZD4.6 million in 2012/13).
• 79% of individual stretch targets were achieved (74% in 2012/13).
• Fund exceeded the Treasury Bill return by 14.8% in 2013/14 (15.3% p.a. over last four years). Actual bonus payments reached their maximum at 4% above Treasury Bill return.
• Fund underperformed the Reference Portfolio return by 0.11% in 2013/14 (exceeded by 3.4% p.a. over last four years). Actual bonus payments reach their maximum at 0.75% above Reference Portfolio return. Because the Actual Portfolio slightly underperformed the Reference Portfolio during 2013/14, there is no payment due this year for one quarter of this component. The strong positive value added in prior years results in payments being due for the remaining three quarters of this component.
2013/14 INCENTIVE PAYMENTS
TOTAL PAYMENTS
$000
AVERAGE PAYMENT
$000
Corporate staff (including CEO) $1,684 $29
Investments and Portfolio Completion staff $3,531 $82
Total $5,215 $51
CEO REMUNERATION 2013/14
Base 74%
Bonus – performance vs Treasury Bills 4%
Bonus – performance vs Reference Portfolio 7%
Bonus – individual objectives 15%
CEO BONUS PAYMENT ($204,666) BREAKDOWN 2013/14
Individual objectives 57%
Financial Performance – current year 5%
Financial Performance – prior years 38%
CHIEF EXECUTIVE OFFICER REMUNERATION
The Chief Executive Officer’s remuneration for the 2013/14 year, including base remuneration and accrued incentive entitlements, was NZD791,462, compared to NZD667,102 in 2012/13. These pie charts illustrate the components of the CEO’s remuneration.
NEW ZEALAND SUPERANNUATION FUND | ANNUAL REPORT 2014 | 35
InvestmentReport
37 Performance Report
46 How We Invest
48 Investment Activity Report – Global
54 CASE STUDY Cheap, flexible access to global share markets
56 CASE STUDY NZ Super Fund and KKR: a strategic partnership
57 Investment Activity Report – New Zealand
59 CASE STUDY Metlifecare – Investing in retirement villages and aged care
60 CASE STUDY Iwi take stake in Kaingaroa
61 Responsible Investment Report
| NEW ZEALAND SUPERANNUATION FUND | ANNUAL REPORT 201436 | NEW ZEALAND SUPERANNUATION FUND | ANNUAL REPORT 201436
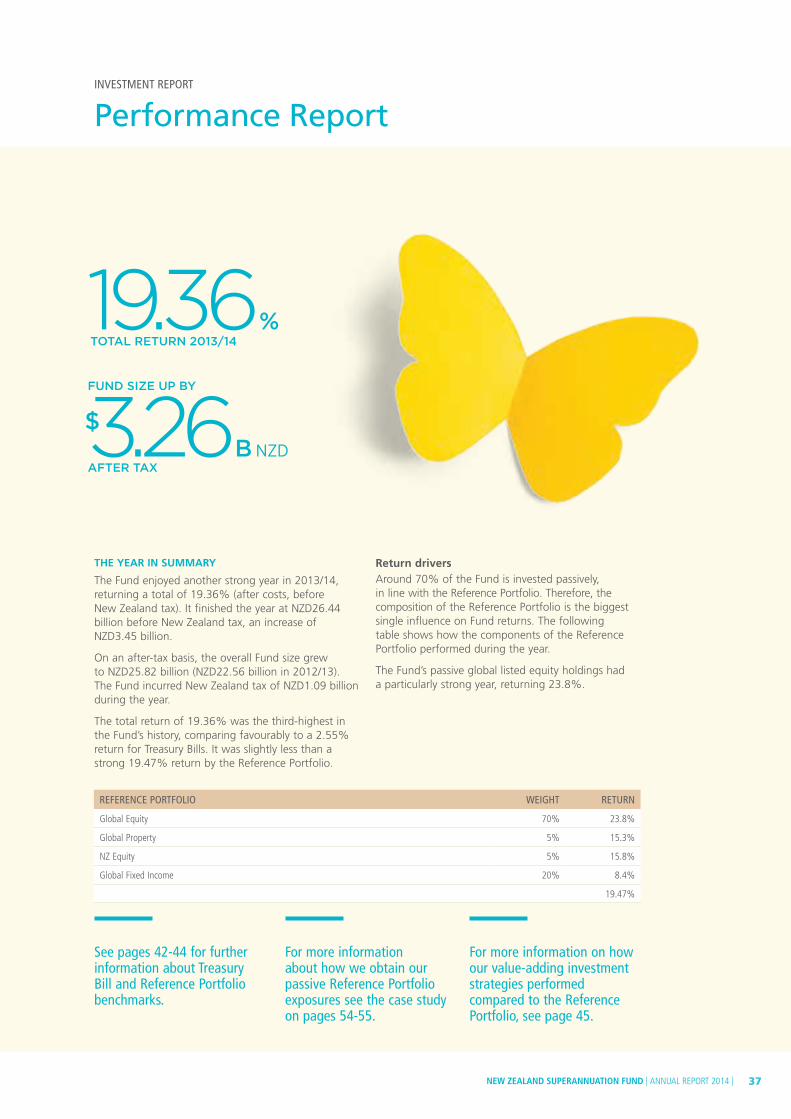
$
Performance ReportINVESTMENT REPORT
THE YEAR IN SUMMARY
The Fund enjoyed another strong year in 2013/14, returning a total of 19.36% (after costs, before New Zealand tax). It finished the year at NZD26.44 billion before New Zealand tax, an increase of NZD3.45 billion.
On an after-tax basis, the overall Fund size grew to NZD25.82 billion (NZD22.56 billion in 2012/13). The Fund incurred New Zealand tax of NZD1.09 billion during the year.
The total return of 19.36% was the third-highest in the Fund’s history, comparing favourably to a 2.55% return for Treasury Bills. It was slightly less than a strong 19.47% return by the Reference Portfolio.
Return driversAround 70% of the Fund is invested passively, in line with the Reference Portfolio. Therefore, the composition of the Reference Portfolio is the biggest single influence on Fund returns. The following table shows how the components of the Reference Portfolio performed during the year.
The Fund’s passive global listed equity holdings had a particularly strong year, returning 23.8%.
See pages 42-44 for further information about Treasury Bill and Reference Portfolio benchmarks.
19.36%
TOTAL RETURN 2013/14
FUND SIZE UP BY
3.26 B NZDAFTER TAX
For more information about how we obtain our passive Reference Portfolio exposures see the case study on pages 54-55.
For more information on how our value-adding investment strategies performed compared to the Reference Portfolio, see page 45.
REFERENCE PORTFOLIO WEIGHT RETURN
Global Equity 70% 23.8%
Global Property 5% 15.3%
NZ Equity 5% 15.8%
Global Fixed Income 20% 8.4%
19.47%
NEW ZEALAND SUPERANNUATION FUND | ANNUAL REPORT 2014 | 37

$
$
This graph illustrates the various components of the Fund’s performance for the year, as measured by Fund size (post-tax). From a starting point on 1 July 2013 of NZD22.56 billion after tax, the Fund ended the year at NZD25.82 billion after tax. Income from Fund investments1 added NZD0.73 billion over the year; fair value changes2 and foreign exchange movements contributed a further NZD3.75 billion. Expenses3 detracted NZD0.13 billion.
VALUE ADDED SINCE INCEPTION
2.6B NZD NET RETURN ABOVE TREASURY BILL RETURN SINCE INCEPTION
9.9B NZD
FUND RETURN SINCE INCEPTION
9.78%P.A
PERFORMANCE SINCE INCEPTION Relative to its long-term purpose and investing horizon, the Fund is still young. It did, however, celebrate its 10th anniversary of investing in 2013 and has now been invested for 10¾ years. This period includes the Fund’s establishment phase along with the massive financial shock of the 2008-2009 Global Financial Crisis.
The Fund is well ahead of its performance benchmarks since inception. Since we began investing, the Fund has returned 9.78% p.a. (after costs and before New Zealand tax), beating the Treasury Bill or ‘risk-free’ return by 5.06% (NZD9.9 billion). It has also beaten the passive Reference Portfolio benchmark by 1.03% (NZD2.6 billion).
For more information on how we measure our performance, including explanations of the Treasury Bill and Reference Portfolio benchmarks, see pages 41-43. Further detail is available on our website at www.nzsuperfund.co.nz/performance.
1. Investment income primarily comprises dividends and interest received, along with income from timber, milk and livestock sales.
2. Fair value changes in our investments represent the revaluation of our investment holdings to their market values.
3. Total expenses primarily comprises fees paid to investment managers, the operating expenses of our timber and farm holdings, trade expenses associated with the sale, purchase and custody of investments and the administrative expenses of the Fund including payroll. The administrative expenses of the Fund amounted to NZD30.1 million.
Performance Report (continued)
INVESTMENT REPORT
22,563,162
731,929
3,748,874
-134,35227,600,000
26,600,000
25,600,000
24,600,000
23,600,000
22,600,000
21,600,000
20,600,000
19,600,000
18,600,000
-1,094,5569,651
25,824,708
Opening net assets
Investment income1
Fair value changes2 and
foreign exchange
Total expenses3
NZ tax expense
Movement in reserves
Closing net assets
MOVEMENT IN NET ASSETS (POST-TAX) FOR YEAR ENDED 30 JUNE 2014
NET
ASS
ETS
($’0
00)
| NEW ZEALAND SUPERANNUATION FUND | ANNUAL REPORT 201438
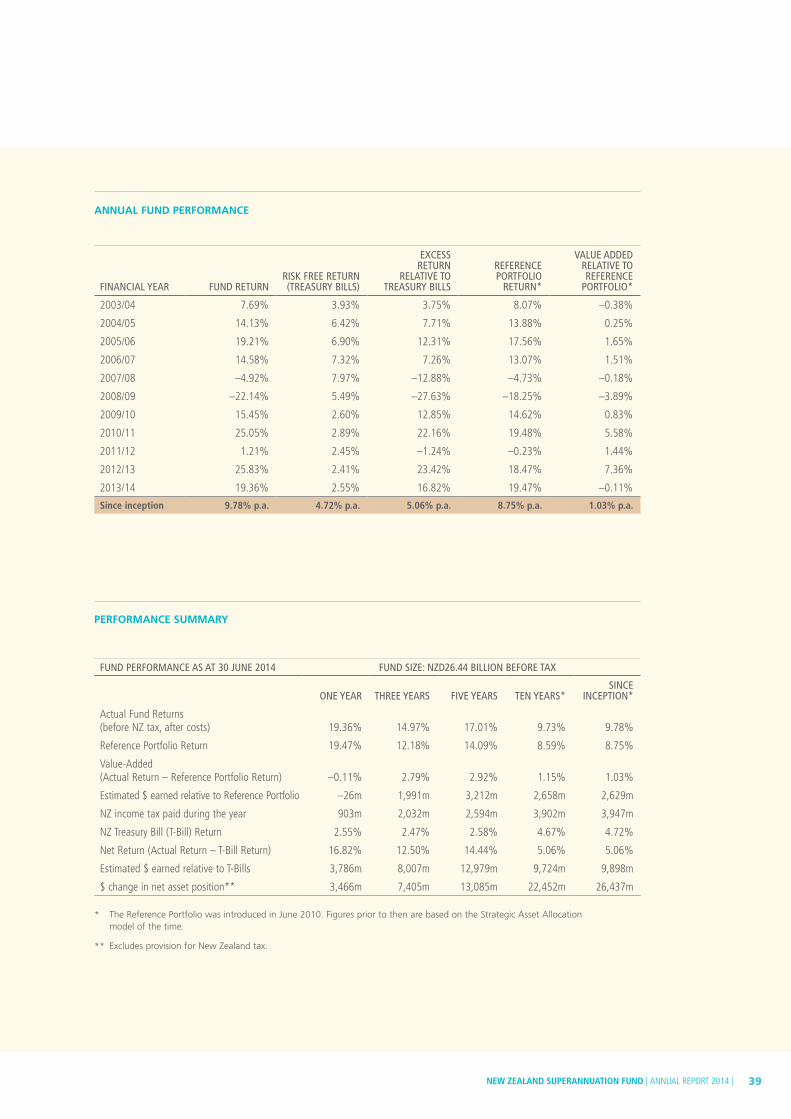
ANNUAL FUND PERFORMANCE
FINANCIAL YEAR FUND RETURN RISK FREE RETURN (TREASURY BILLS)
EXCESS RETURN
RELATIVE TO TREASURY BILLS
REFERENCE PORTFOLIO
RETURN*
VALUE ADDED RELATIVE TO REFERENCE
PORTFOLIO*
2003/04 7.69% 3.93% 3.75% 8.07% –0.38%
2004/05 14.13% 6.42% 7.71% 13.88% 0.25%
2005/06 19.21% 6.90% 12.31% 17.56% 1.65%
2006/07 14.58% 7.32% 7.26% 13.07% 1.51%
2007/08 –4.92% 7.97% –12.88% –4.73% –0.18%
2008/09 –22.14% 5.49% –27.63% –18.25% –3.89%
2009/10 15.45% 2.60% 12.85% 14.62% 0.83%
2010/11 25.05% 2.89% 22.16% 19.48% 5.58%
2011/12 1.21% 2.45% –1.24% –0.23% 1.44%
2012/13 25.83% 2.41% 23.42% 18.47% 7.36%
2013/14 19.36% 2.55% 16.82% 19.47% –0.11%
Since inception 9.78% p.a. 4.72% p.a. 5.06% p.a. 8.75% p.a. 1.03% p.a.
PERFORMANCE SUMMARY
FUND PERFORMANCE AS AT 30 JUNE 2014 FUND SIZE: NZD26.44 BILLION BEFORE TAX
ONE YEAR THREE YEARS FIVE YEARS TEN YEARS*SINCE
INCEPTION*
Actual Fund Returns (before NZ tax, after costs) 19.36% 14.97% 17.01% 9.73% 9.78%
Reference Portfolio Return 19.47% 12.18% 14.09% 8.59% 8.75%
Value-Added (Actual Return – Reference Portfolio Return) –0.11% 2.79% 2.92% 1.15% 1.03%
Estimated $ earned relative to Reference Portfolio –26m 1,991m 3,212m 2,658m 2,629m
NZ income tax paid during the year 903m 2,032m 2,594m 3,902m 3,947m
NZ Treasury Bill (T-Bill) Return 2.55% 2.47% 2.58% 4.67% 4.72%
Net Return (Actual Return – T-Bill Return) 16.82% 12.50% 14.44% 5.06% 5.06%
Estimated $ earned relative to T-Bills 3,786m 8,007m 12,979m 9,724m 9,898m
$ change in net asset position** 3,466m 7,405m 13,085m 22,452m 26,437m
* The Reference Portfolio was introduced in June 2010. Figures prior to then are based on the Strategic Asset Allocation model of the time.
** Excludes provision for New Zealand tax.
NEW ZEALAND SUPERANNUATION FUND | ANNUAL REPORT 2014 | 39

Five year Financial SummaryThis table provides a high-level overview of how the finances of the Fund have changed over the last five years.
20142013
(RESTATED)*2012
(RESTATED)* 2011 2010
NZD’000 NZD’000 NZD’000 NZD’000 NZD’000
Income StatementInterest and dividend income, both of which vary in line with the amount invested and market returns.
Investment income 731,929 602,715 549,825 533,157 432,952
Changes in the value of our investments – fluctuates in line with market movements.
Investment gains and losses
3,748,874 4,394,553 (212,590) 3,504,044 1,752,528
Our biggest expense is external manager and performance fees. These costs vary from year to year in line with investment returns.
Expenses (134,352) (168,264) (110,676) (134,904) (99,499)
Profit before tax 4,346,451 4,829,004 226,559 3,902,297 2,085,981 The Fund makes returns to the Crown in the form of tax payments. The introduction of the Fair Dividend Rate (FDR) resulted in unusual tax outcomes in 2012.
Tax (expense)/credit (1,094,556) (1,006,280) (183,342) (906,837) (378,202)
Profit after tax 3,251,895 3,822,724 43,217 2,995,460 1,707,779
Balance SheetCash and cash equivalents decreased – in part due to our decreasing level of derivative exposure during the year – see pages 54-55 for more information.
Cash and cash equivalents
3,352,901 6,141,822 3,056,111 2,903,094 1,942,798
Investments 23,487,130 17,349,232 15,848,063 16,050,241 13,543,234
Other assets 392,527 229,264 293,945 256,896 633,046
Other liabilities (795,446) (728,682) (183,151) (178,009) (495,923)
NAV excluding tax 26,437,112 22,991,636 19,014,968 19,032,222 15,623,155
Current tax (409,162) (248,741) (133,326) (250,831) 69,277
Deferred tax (203,242) (179,733) (159,954) (129,877) (36,721)
NAV including tax 25,824,708 22,563,162 18,721,688 18,651,514 15,655,711
Crown contributions to the Fund – suspended in 2009.
Contributed capital 14,882,079 14,882,079 14,882,079 14,882,079 14,882,079
Predominantly cumulative net profit after NZ tax.
Other reserves 10,942,629 7,681,083 3,839,609 3,769,435 773,632
25,824,708 22,563,162 18,721,688 18,651,514 15,655,711
* Restatements are the result of the adoption of New Zealand International Financial Reporting Standards changes. There have been no past misstatements.
Performance Report (continued)
INVESTMENT REPORT
| NEW ZEALAND SUPERANNUATION FUND | ANNUAL REPORT 201440

MEASURING OUR PERFORMANCE SINCE INCEPTION
3.0
2.8
2.6
2.4
2.2
2.0
1.8
1.6
1.4
0.8
1.0
1.2
Sep-03 Sep-04 Sep-05 Sep-06 Sep-07 Sep-08 Sep-09 Sep-10 Sep-11 Sep-12 Sep-13
IND
EXED
FU
ND
RET
UR
N S
TAR
TIN
G F
RO
M 1
.0
Fund RP T-Bill T-Bill + 2.5%
This graph shows the cumulative Fund return since inception, relative to its key benchmarks. The impact of the Global Financial Crisis, and the subsequent recovery in Fund returns, can be seen in the 2008-2014 period.
The gap between the Reference Portfolio return and the actual Fund return, as at 30 June 2014, illustrates the value the Fund’s active investment strategies have added since inception (NZD2.6 billion or 1.03% p.a.). The gap between the Treasury Bill return and the Fund return shows the return earned in excess of the Government’s marginal cost of debt (NZD9.9 billion or 5.06% p.a.).
In recent years, the composition of the Fund has become increasingly different from the Reference Portfolio, and the Fund has moved visibly ahead of the Reference Portfolio’s returns. For more information, see our explanation of the Reference Portfolio on page 42 and our breakdown of value-add on page 45.
Note: the Reference Portfolio was introduced in June 2010. Figures prior to then are based on the Strategic Asset Allocation model of the time.
In total, the Guardians’ active investment activities have added significant value to the Fund since inception (1.03% p.a. or NZD2.6 billion). It is important to appreciate, however, that we follow long-term strategies that are designed to pay off over a number of years. Negative returns as well as positive, and movements up and down between years, are expected.
NEW ZEALAND SUPERANNUATION FUND | ANNUAL REPORT 2014 | 41

THE REFERENCE PORTFOLIO
We use a Reference Portfolio, which is set by the Guardians’ Board, to benchmark the performance of our actual investment portfolio and the value we are adding through our active investment strategies.
The Reference Portfolio, which is capable of meeting the Fund’s objectives over time, is a shadow or notional portfolio of passive, low-cost, listed investments suited to the Fund’s long-term investment horizon and risk profile. It has an 80:20 split between growth and fixed-income investments and its foreign currency exposures are 100% hedged to the New Zealand dollar.
The Reference Portfolio is, therefore, a very clear and ‘pure’ way for the Guardians to:
• estimate the Fund’s expected returns;
• benchmark active (value-add) investment returns net of all costs; and
• be clear on the ‘hurdles’ for active investments.
Since the Fund’s inception, the Reference Portfolio has returned an average 8.75% p.a., 4.03% p.a. ahead of the Treasury Bill rate.
Our aim, as an active investor, is to add more value to the Fund after all costs than the reference approach would do, using strategies based on the Fund’s natural advantages as a long-term, sovereign investor with low liquidity requirements.
For example, we:
• invest in a range of illiquid assets – including infrastructure, private equity and timber;
• undertake extensive due diligence and manager monitoring to ensure we choose the most effective and skilled investment managers;
• aim to implement our trades and investments as efficiently as possible; and
• periodically adjust our exposure to various asset classes within our actual portfolio, using our long-term horizon to take advantage of market volatility. This is called ‘Strategic Tilting’.
These activities bring a higher expected return and/or offer diversification benefits for the Fund, albeit with more complexity and cost.
The facing chart illustrates the allocation of assets within our actual investment portfolio as at 30 June 2014 (excluding the impact of any Strategic Tilting positions). It shows the diversification of the actual
portfolio away from the Reference Portfolio into private markets, timber and infrastructure.
The Reference Portfolio approach also encourages greater separation and delegation of value-adding activities from the Board to internal management. This allows the Board to focus on governance around the risk allocation and investment process, and allows management to focus on adding value to the portfolio.
Reference Portfolio reviewThe Reference Portfolio is not ‘set and forget’, and its asset class and risk-return composition can change over time, for example, if:
• assumptions about the long-term risk-return attributes of asset classes change; or
• aspects of the Fund’s purpose or endowments (e.g. our long-term horizon) change; or
• market developments mean that a narrower or wider set of representative market exposures can be accessed passively and at a low cost.
The Reference Portfolio is formally reviewed at least every five years, with the next review planned for 2014/15.
Performance expectationsOur long-term expectation for the Reference Portfolio return is that it will generate the Treasury Bill return + 2.5% p.a. Since inception the Reference Portfolio return has exceeded the Treasury Bill return by 4.03% p.a. The Actual Portfolio has outperformed the Reference Portfolio by 1.03% p.a. or NZD2.6 billion net of all costs.
In 2013/14, the Fund underperformed the Reference Portfolio by -0.11% or NZD26 million. Further information is available on page 45.
Note: the Reference Portfolio has been our core performance benchmark since July 2010. Prior to that date, the Guardians used a Strategic Asset Allocation model to measure the value the Guardians were adding through active investment. Comparisons prior to July 2010 are based on the Strategic Asset Allocation model.
Performance Report (continued)
INVESTMENT REPORT
| NEW ZEALAND SUPERANNUATION FUND | ANNUAL REPORT 201442

REFERENCE PORTFOLIO
Global equities 70%
Global property 5%
NZ equities 5%
Global fixed income 20%
ACTUAL PORTFOLIO (PRE-TILT) AS AT 30 JUNE 2014
Global equities 62%
Property 6%
NZ equities 5%
Global fixed income 12%
Infrastructure 4%
Timber 5%
Private equity 3%
Rural 1%
Other private markets 2%
-0.38%
10.00%
8.00%
6.00%
4.00%
2.00%
0.00%
-2.00%
-4.00%
-6.00%
PERFORMANCE RELATIVE TO REFERENCE PORTFOLIO – VALUE ADD
% R
ETU
RN
– A
NN
UA
L
CU
MU
LATI
VE
RET
UR
N IN
NZD
MIL
LIO
NS
2,800
1,600
1,200
800
400
2,000
2,400
-
(800)
(400)
(1,200)
(1,600)
% Annual Value Added vs Reference Portfolio
Cumulative $ Return in excess of Reference Portfolio
Jun-04 Jun-06 Jun-07 Jun-09Jun-05 Jun-10Jun-08 Jun-13Jun-11 Jun-14Jun-12
0.26%
1.63% 1.50%
-3.89%
0.83%
5.57%
1.44%
7.36%
-0.11%-0.18%
See page 37 for a breakdown of how the components of the Reference Portfolio performed during 2013/14.
NEW ZEALAND SUPERANNUATION FUND | ANNUAL REPORT 2014 | 43
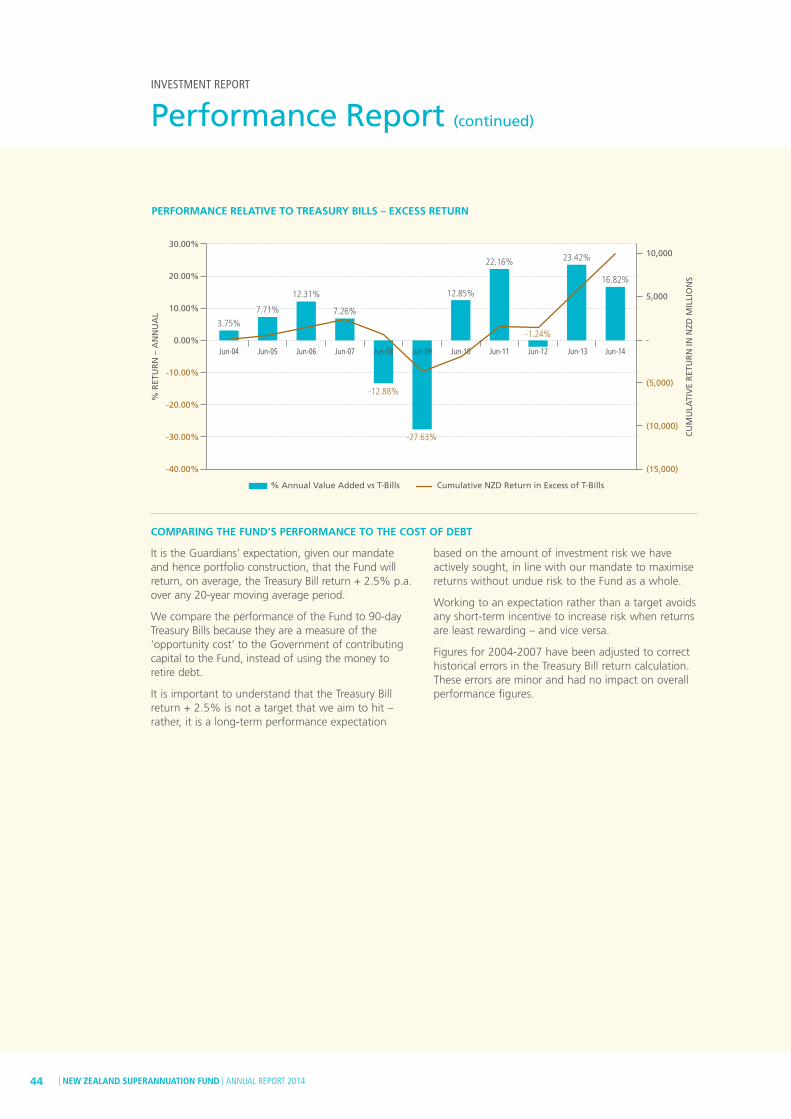
COMPARING THE FUND’S PERFORMANCE TO THE COST OF DEBT
It is the Guardians’ expectation, given our mandate and hence portfolio construction, that the Fund will return, on average, the Treasury Bill return + 2.5% p.a. over any 20-year moving average period.
We compare the performance of the Fund to 90-day Treasury Bills because they are a measure of the ‘opportunity cost’ to the Government of contributing capital to the Fund, instead of using the money to retire debt.
It is important to understand that the Treasury Bill return + 2.5% is not a target that we aim to hit – rather, it is a long-term performance expectation
based on the amount of investment risk we have actively sought, in line with our mandate to maximise returns without undue risk to the Fund as a whole.
Working to an expectation rather than a target avoids any short-term incentive to increase risk when returns are least rewarding – and vice versa.
Figures for 2004-2007 have been adjusted to correct historical errors in the Treasury Bill return calculation. These errors are minor and had no impact on overall performance figures.
Performance Report (continued)
INVESTMENT REPORT
12.31%
7.26%
-12.88%
-27.63%
12.85%
22.16%
-1.24%
23.42%
16.82%
3.75%
30.00%
20.00%
10.00%
0.00%
-10.00%
-20.00%
-30.00%
-40.00%
PERFORMANCE RELATIVE TO TREASURY BILLS – EXCESS RETURN
% R
ETU
RN
– A
NN
UA
L
CU
MU
LATI
VE
RET
UR
N IN
NZD
MIL
LIO
NS
10,000
5,000
-
(5,000)
(10,000)
(15,000)
% Annual Value Added vs T-Bills Cumulative NZD Return in Excess of T-Bills
Jun-04 Jun-06 Jun-07 Jun-09Jun-05 Jun-10Jun-08 Jun-13Jun-11 Jun-14Jun-12
7.71%
| NEW ZEALAND SUPERANNUATION FUND | ANNUAL REPORT 201444

VALUE-ADD IN 2013/14
In this section, we break down the contributions made by the Guardians’ various value-adding activities during the year. By value-add, we mean the difference in performance between our Actual Portfolio and the Reference Portfolio.
In total, our Actual Portfolio slightly under performed the Reference Portfolio (-0.11% or minus NZD26 million) over the year.
In the following table, we set out the top contributors (whether positive or negative) to the value added by our investment activities during 2013/14.
Since 1 July 2013, we have been using a new performance reporting system, which is discussed in more detail on page 69. As a result of this change, we are using a different and more granular format to report on the key contributors to value add than we have been able to use in previous years.
Because the key contributors to value-add change from year to year, and the numbers produced under our new reporting system are not directly comparable to previous years’ figures, we have chosen not to compare to value-add figures for 2012/13. We will provide annual comparisons in next year’s Annual Report.
KEY CONTRIBUTOR DESCRIPTION
VALUE ADDED COMPARED
TO REFERENCE PORTFOLIO IN 2013/14
Portfolio Completion
How efficiently we manage our passive exposures. See the case study on pages 54-55 for more information.
0.54%
Timber Our global timber holdings including Kaingaroa Timberlands. 0.47%
Active NZ Equity Our NZ equity holdings managed by our internal NZ active equities team and external investment managers AMP Capital, Devon Funds Management and Milford Asset Management.
0.16%
Direct Investment Our direct investments in New Zealand and globally. This includes our investments in Datacom, Metlifecare, Scales, Bloom Energy and Ogin (but not Z Energy).
0.15%
Global Macro Global hedge funds Bridgewater and D.E. Shaw. 0.12%
Commodities Global hedge funds Blenheim and Vermillion. 0.12%
Strategic Tilting Strategic Tilting is our strategy of making occasional shifts towards or away from asset classes when we think that the market has substantially over reacted up or down compared with our long-term assessment of relative value. The rise in the New Zealand dollar was the main negative driver of returns in tilting over the year. However, tilting is a long-term strategy designed to play out over a full market cycle. Since the strategy commenced in April 2009, it has generated a total of NZD798 million in value add.
-1.39%
“We aim to beat the Reference Portfolio over the long term. Our strategies mean we can and will deviate from the Reference Portfolio significantly and for long periods. We take advantage of our long horizon and tolerance for risk by not limiting ourselves to strategies that will play out over less than one year. As a result, we expect both positive and negative annual performance comparisons to the Reference Porfolio.”
Matt Whineray, Chief Investment Officer
NEW ZEALAND SUPERANNUATION FUND | ANNUAL REPORT 2014 | 45
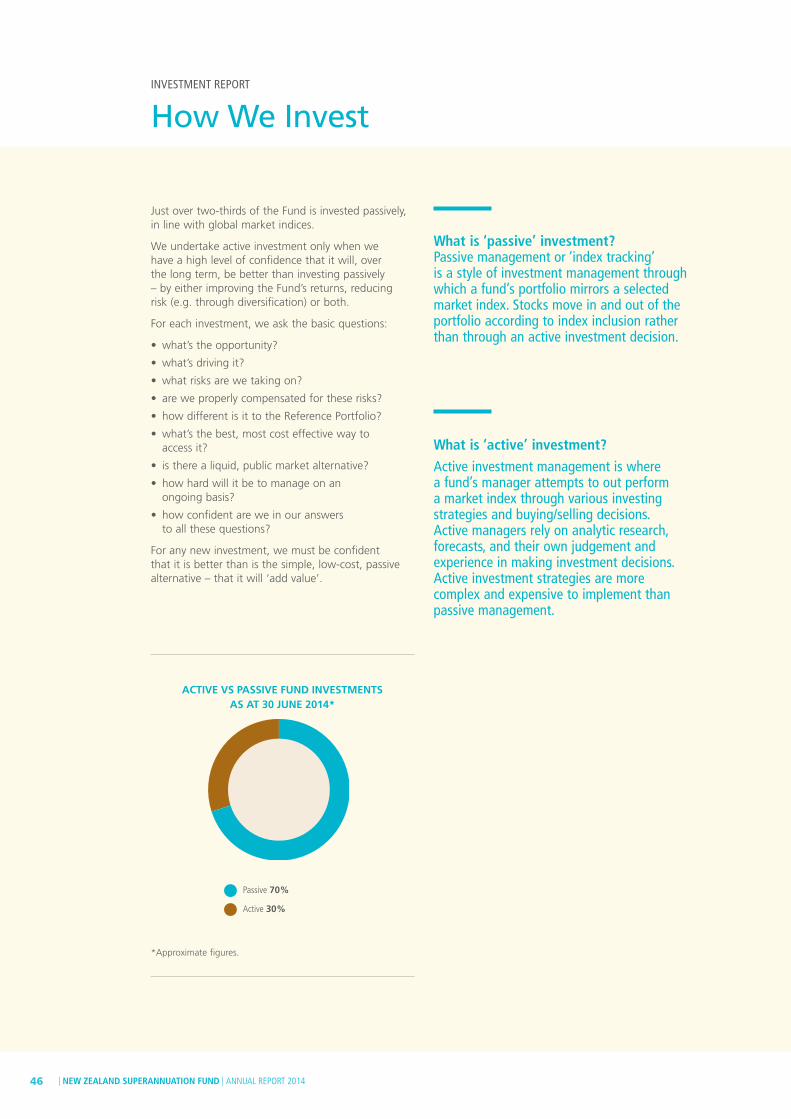
INVESTMENT REPORT
How We Invest
Just over two-thirds of the Fund is invested passively, in line with global market indices.
We undertake active investment only when we have a high level of confidence that it will, over the long term, be better than investing passively – by either improving the Fund’s returns, reducing risk (e.g. through diversification) or both.
For each investment, we ask the basic questions:
• what’s the opportunity?
• what’s driving it?
• what risks are we taking on?
• are we properly compensated for these risks?
• how different is it to the Reference Portfolio?
• what’s the best, most cost effective way to access it?
• is there a liquid, public market alternative?
• how hard will it be to manage on an ongoing basis?
• how confident are we in our answers to all these questions?
For any new investment, we must be confident that it is better than is the simple, low-cost, passive alternative – that it will ‘add value’.
What is ‘passive’ investment? Passive management or ‘index tracking’ is a style of investment management through which a fund’s portfolio mirrors a selected market index. Stocks move in and out of the portfolio according to index inclusion rather than through an active investment decision.
What is ‘active’ investment? Active investment management is where a fund’s manager attempts to out perform a market index through various investing strategies and buying/selling decisions. Active managers rely on analytic research, forecasts, and their own judgement and experience in making investment decisions. Active investment strategies are more complex and expensive to implement than passive management.
ACTIVE VS PASSIVE FUND INVESTMENTS AS AT 30 JUNE 2014*
Passive 70%
Active 30%
*Approximate figures.
| NEW ZEALAND SUPERANNUATION FUND | ANNUAL REPORT 201446

Risk Allocation Process There are thousands of potential investment opportunities for the Fund. How do we choose the best ones?
We rank and map all our existing and potential investments by:
• attractiveness (expected return, adjusted for confidence and risk); and
• consistency with the Fund’s investment style.
The purpose of this process is to break down each investment into its risk and return component parts, and allow us to:
• clearly understand what additional risks each investment brings, above the Reference Portfolio, and the return we expect to achieve to compensate for those risks; and
• allocate capital to and from investments on a timely, consistent and commercial basis.
Each investment is assessed in three ways:
• we look at the drivers of expected return (essentially our beliefs about what gives rise to an investment opportunity);
• our confidence in the expected return (derived from our view of how well we understand the drivers and their transparency and credibility); and
• our view of how good a fit it is with our way of investing. This is derived from how consistent it is with our preferred investment style, our investment beliefs, endowments and themes, and our focus on Responsible Investment.
The better a prospective opportunity or existing investment satisfies each test, the higher its ranking. For a prospective investment, a higher ranking means it is more likely that we will seek an access point – passively, directly or via a manager. Ranking is also key to sizing our investment.
For an existing investment, a higher ranking means that, at the very least, we are likely to maintain that investment. It may also mean that we allocate further capital to it. The reverse is true of a lower ranking: a likely outcome is a reduction in the size of the investment or an orderly exit.
Risk BudgetsAs part of the Risk Allocation Process, we use risk budgets to help ensure that we allocate active investment risk consistently over baskets of investment opportunities. This is the best means to ensure a single-portfolio focus for the whole team, rather than simply meeting an asset-class quota.
Within a Board-approved overall active risk budget for the Fund, various investment opportunities with similar underlying drivers are grouped together into baskets by the Guardians’ Investment Committee. The investment opportunities in each basket have similar risk characteristics: e.g. diversifiers, market pricing or asset pricing.
The overall risk budget is allocated by the Investment Committee across these baskets.
Teams of investment professionals then monitor investment opportunities within each basket, making risk allocation recommendations to the Chief Investment Officer and General Manager Portfolio Completion.
These risk allocation recommendations inform our investment and divestment activities.
This process helps us assign capital judiciously, allowing investment professionals who are deeply familiar with investment opportunities to be closely involved in decision-making.
The Risk Budget process will be fully implemented in 2014/15.
STATEMENT
OF INTENT
key strategic
plan activity
Achieved
NEW ZEALAND SUPERANNUATION FUND | ANNUAL REPORT 2014 | 47

INVESTMENT REPORT
Investment Activity Report – Global
INVESTING GLOBALLY – GENERATING RETURNS FOR KIWIS
The Fund is highly diversified, with investments in a range of markets and sectors all around the world. More than 80% of the Fund is invested offshore, in both developed and emerging markets. This diversification is in keeping with the Guardians’ mandate to manage the Fund in line with best-practice portfolio management, and to invest it on a prudent, commercial basis.
The majority of the Fund’s global investments are held passively. These holdings give us cost-effective, diversified exposure to global share markets. See pages 54-55 for a case study explaining how we achieve our passive exposure.
We also invest globally in a range of active investment opportunities, including re-insurance, life settlements, distressed credit, timber, energy, private equity and real estate.
WHERE WE INVEST
The following table outlines the proportion of our investments by exposure to each geographic area. This analyses the Fund as a whole by economic exposure and excludes: hedging instruments, as well as cash; collateral held to back derivative positions; and any ‘market neutral’ investments (e.g. arbitrage trades or hedge funds).
Historically, we have reported our geographic allocation on the basis of the value of our investments in each region. Given the Fund’s use of derivative financial instruments, particularly in achieving our desired passive exposures (see page 54), we consider that providing a global view of the Fund on an exposure basis is a more appropriate analysis of where we invest.
We discuss our New Zealand investments further in the New Zealand Investment Activity Report on pages 57-60.
EXPOSURE 30 JUNE 2014 30 JUNE 2013
New Zealand 13.8% 14.2%
Australia 2.5% 1.7%
Africa 0.7% 0.7%
Europe 24.5% 24.5%
Asia (excl. Japan) 6.0% 5.7%
Japan 6.5% 5.8%
North America 44.6% 46.0%
South America 1.4% 1.4%
WHERE WE INVEST – AS AT 30 JUNE 2014
1.4%
44.6%
| NEW ZEALAND SUPERANNUATION FUND | ANNUAL REPORT 201448
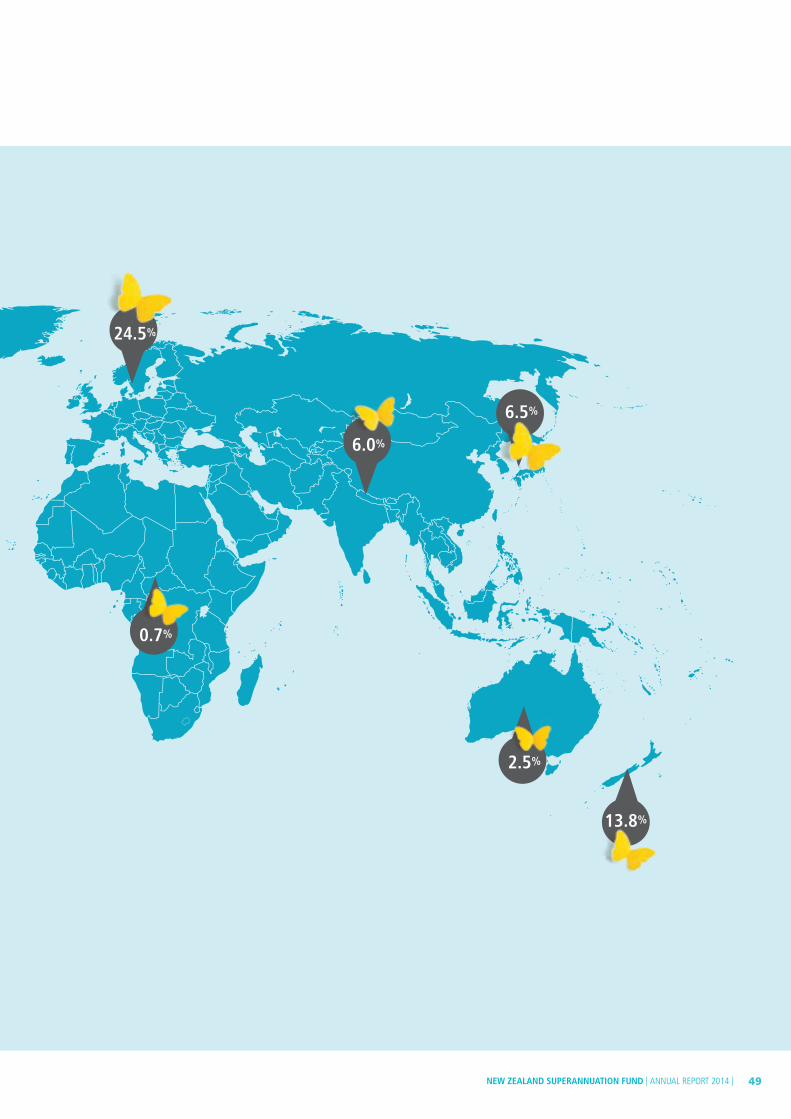
2.5%
0.7%
6.0%
24.5%
6.5%
13.8%
NEW ZEALAND SUPERANNUATION FUND | ANNUAL REPORT 2014 | 49

INVESTMENT REPORT
Investment Activity Report - Global (continued)
NEW INVESTMENTS AND PORTFOLIO ACTIVITIES DURING 2013/14
Apollo Global ManagementIn October 2013, we committed USD200 million to Apollo Global Management’s second life settlements fund, Apollo Financial Credit Investment II.
Life settlements are transactions in which the original owner of a life insurance policy sells the policy to a third party, typically an institutional investor, for cash. The third party pays the premiums and receives the pay-out when the person dies.
Like other insurance-related investments, life settlements help to diversify the Fund away from equity and credit markets.
This is the Fund’s second investment with Apollo, having committed USD55 million to Apollo’s first life settlements fund, Apollo Financial Credit Investment I, in 2012. Both Apollo funds focus on the North American life settlements market.
KKR energy mandateIn March 2014, we announced a USD250-million commitment to North American gas and oil opportunities with experienced energy investor KKR. For more information, see the case study on page 56.
Innovation Alliance updateIn 2012/13, we formed an alliance with the Alberta Investment Management Corporation (AIMCo) and the Abu Dhabi Investment Authority (ADIA) to invest in growth capital opportunities globally. The Alliance members pool their existing relationships and due diligence capabilities in order to find suitable capital investment opportunities available globally.
The Fund’s investments in Bloom Energy and Ogin Inc. were identified through the Innovation Alliance.
Bloom EnergyIn March 2014, we announced a second investment of USD50 million into California-based Bloom Energy (www.bloomenergy.com), a maker of on-site power generation systems using fuel cell technology. The investment, which will help support Bloom Energy’s continued growth, will bring the Fund’s total investment in the company to USD100 million.
Bloom Energy announced the completion of its first international project at SoftBank’s M-Tower in Fukuoka, Japan, in November 2013. Earlier in the year, the company opened a large manufacturing centre in Newark, Delaware, and completed a number of major projects, including a deployment at an eBay data centre in Utah.
Bloom Energy’s fuel cells, by generating electricity on-site, provide reliable baseload power, eliminate the need for costly backup infrastructure and reduce carbon emissions.
Bloom Energy has more than 100MW of Bloom Energy servers installed in the United States.
Bloom Energy servers at a Nokia Site in Sunnyvale, California.
| NEW ZEALAND SUPERANNUATION FUND | ANNUAL REPORT 201450

Northern TrustIn 2013, we appointed Northern Trust’s asset management arm, a leading global provider of index, active and multi-manager solutions, to manage four new passive global equities mandates. The mandates track global large cap, global small cap, emerging markets and developed REITs (real estate investment trust) market indices.
Adding a third passive manager to our stable (the others are BlackRock and State Street Global Advisors) has given the Fund more capacity and flexibility in managing this very important part of our portfolio.
Northern Trust has had a custodial relationship with the Fund since 2007. Appropriate separation is in place between Northern Trust’s asset management and asset-servicing custodial businesses. Northern Trust has both asset-management and custodial relationships with the majority of its global clients.
As at 30 June 2014, Northern Trust, which is celebrating its 125th anniversary, had USD924.4 billion in assets under management and USD6 trillion in assets under custody.
Ogin IncThe Fund announced a USD55-million equity and debt investment in Massachusetts-based wind turbine manufacturer Ogin Inc. (www.oginenergy.com) in November 2013. Ogin has used aerospace technology to develop a smaller, high-performance wind turbine, and aims to help wind-energy developers bring clean energy production closer to customers.
Ogin repaid the debt portion of the investment in early 2014 and is on track for a commercial roll-out of its wind turbines in 2015.
Ogin’s wind turbine on site.
Northern Trust, August 2014, 125th-Anniversary.
NEW ZEALAND SUPERANNUATION FUND | ANNUAL REPORT 2014 | 51

INVESTMENT REPORT
Investment Activity Report – Global (continued)
Finance loansDuring the year, we provided financing of NZD263 million to two Collaterised Loan Obligation (CLO) warehouses. A CLO warehouse provides short-term funding to enable the establishment of a CLO product which is then on-sold to investors. Both of these investments were in Europe and both have been successfully concluded.
We also provided senior financing for the purchase of residential mortgage portfolios in Europe by a large private equity firm. Over time, the private equity firm will re-package the portfolios into marketable securities.
These opportunities have arisen as a result of regulatory change in Europe which has made it less economic for banks to provide financing for certain products. They are attractive to us because they are senior obligations (lower risk), provide attractive margins, diversify our portfolio and are generally short term in nature.
What is a CLO?A CLO is a security backed by a pool of loans. In a CLO the investor receives scheduled debt payments from the underlying loans in return for assuming the risk that the borrowers default. Banks sell CLOs with various tranches that reflect different levels of seniority to match investors’ risk/return profiles.
Secondary market sales and mandate terminations
The Fund sold two private equity investments on the secondary market during the year: stakes in Apax Europe VII and Astorg V FCPR.
The Guardians also terminated the following investment mandates during 2013/14: Blenheim Capital Management; Gladius Capital Management and Vermillion Asset Management. The terminations reflect the Guardians’ changing view of the investment opportunity that each manager was accessing.
Investing globally – selected mandate activity during 2013/14
Through external investment managers, the Fund is invested in a large number of companies and projects around the world. A selection of case studies is provided below.
INVESTING IN EUROPEAN REAL ESTATE
One of our external managers is Orion Capital Managers (‘Orion’, www.orioncapitalmanagers.com), a leading European real estate investment firm whose business covers the full spectrum of commercial real estate in Europe, including direct assests, listed companies, private companies and real estate debt on behalf of major global institutional investors.
We have been invested in Orion’s European Real Estate Fund III since 2009. Investments include 100 Cheapside, London, and Qwartz, Villeneuve la Garenne, Paris. 100 Cheapside (www.100cheapside.com) is an office building situated in the heart of the City of London between the Bank of England and St Paul’s Cathedral. The original developer had been placed into
administration and the building was vacant when it was purchased by Orion in a joint venture with CarVal Investors in 2012.
Orion and CarVal are redeveloping the building with a focus on improving sustainability and energy efficiency; the building will achieve LEED (Core and Shell) Platinum and BREEAM Excellent ratings. The 100,000- square-foot development will be completed in 2014.
Overlooking the river Seine, the Qwartz shopping centre site was acquired by Orion as part of a large corporate transaction. It comprises almost 700,000 square feet and was developed by Orion in partnership with Altarea, a French retail real estate investment trust. The shopping centre (www.qwartz-92.com) was fully leased when it opened in April 2014.
The Qwartz shopping centre opening in April 2014.
| NEW ZEALAND SUPERANNUATION FUND | ANNUAL REPORT 201452

INVESTING IN UNITED STATES REAL ESTATE
We also invest in United States real estate through private equity firm and asset management company Savanna. We made a 2010 investment in its Savanna Real Estate Fund II.
Savanna’s strategy is to redevelop ageing buildings in the New York City market, repositioning them in the market. This year it completed a major renovation project at 245 & 249 West 17th Street in New York, overhauling of two turn-of-the-century buildings. Both buildings have now obtained LEED (Core and Shell) Gold Certification. The two main tenants are Twitter and Room & Board.
Savanna has performed similar upgrades throughout its portfolio on a more incremental basis, achieving efficiency improvements and reducing consumption of energy and water in its buildings.
LEED, or Leadership in Energy & Environmental Design, is a green building certification programme that recognises best-in-class building strategies and practices.
BREEAM is the world’s foremost environmental assessment method and rating system for buildings.
INVESTING IN GLOBAL ENERGY INFRASTRUCTURE
New Zealand-based global infrastructure manager Morrison & Co built a stake in Drax Group (www.drax.com) during the year. Drax, which is listed on the London Stock Exchange, is principally a power- generation business responsible for meeting typically 7–8% of the United Kingdom’s electricity demand.
Drax is currently transforming itself into a predominantly biomass-fuelled generator through the burning of sustainable biomass in place of coal at the UK’s largest power station. This transformation will see what is the UK’s single largest source of carbon dioxide emissions become one of the largest renewable generators in Europe. Drax’s aim is to provide low-carbon, cost-effective and reliable renewable power well into the future. As at 30 June 2014, the Fund held a NZD33.8 million investment in Drax.
CHINA INFRASTRUCTURE PARTNERS UPDATE
In 2011, the Fund committed USD100 million to China Infrastructure Partners, an investment fund sponsored by BOC International, a wholly owned subsidiary of Bank of China, and Temasek, an investment company based in Singapore.
China Infrastructure Partners targets long-term capital appreciation in companies primarily engaged in the development, ownership or operation of infrastructure and related businesses in greater China.
The infrastructure sector is a good fit for the Fund’s long-term investment horizon. We also see China as having better long-term growth prospects than do many more-developed markets.
The economic environment in China over the last couple of years has been challenging and the fund has been disciplined in deploying capital.
China Infrastructure Partners has made a number of investments, however, with the largest to date being in the Tangshan TangSteel Gas Company. This company is involved in the manufacturing and sale of industrial gas (oxygen, nitrogen, argon and hydrogen) in China.
The investment period of the fund ends in 2016 and we expect further investments to be made during 2014/15.
249 West 17th Street - before.
249 West 17th Street - after.
www.breeam.org
www.usgbc.org/leed
NEW ZEALAND SUPERANNUATION FUND | ANNUAL REPORT 2014 | 53

CASE STUDY INVESTMENT REPORT
We explained in ‘How we Invest’ on page 46 that a large proportion of the Fund is invested passively, in line with the Reference Portfolio (a combination of global share market and fixed income benchmarks).
We aim to invest these passive exposures as cheaply and flexibly as possible. Managing fees and costs, and ensuring efficient implementation, can add value to the Fund.
As markets move over time, the Fund’s passive exposures change accordingly. Every month, therefore, we rebalance the Fund’s actual passive exposures back in line with the Reference Portfolio. Minimising the costs of this rebalancing is, therefore, an important objective.
Our passive exposures are managed by the Portfolio Completion team of eight, led by General Manager Portfolio Completion Mark Fennell. The team, which was formed in 2009, has expertise in:
• foreign exchange trading;
• equity trading;
• fixed income trading; and
• derivative trading.
ACCESS POINTS
There are a number of ways (or access points) in which we can achieve the Fund’s passive exposure to global equity markets:
• physically owning shares in a company, via an external investment manager;
• using derivative instruments (e.g. equity futures or equity total return swaps) which replicate the performance of particular subsets of the market, such as country or global share market indices; or
• using exchange traded funds.
It is important to have multiple access points so that we can obtain our passive exposure as cheaply and efficiently as possible, and avoid being locked into one potentially expensive option.
When choosing between the different access points, the Portfolio Completion team looks closely at the total cost of ownership for each access point option at the time. The different types of costs and risks that we factor in to our decisions include:
• entry and exit costs such as broker commission and securities transaction taxes;
• opportunity costs;
• counterparty credit risk hedging costs;
• funding costs of a derivative e.g. financing paid to counterparty banks;
• external investment management costs;
• internal Guardians costs e.g. IT operations and legal costs;
• whether the passive exposure may be a temporary one, e.g. caused by a rebalancing; and
• costs paid to our custodian for assets or derivatives they hold on our behalf.
If we decide the best option is to physically own the shares, then we have three external passive equity managers to choose from: BlackRock, Northern Trust and State Street Global Investors. We choose whichever manager is offering the most cost-effective solution for the particular market in which we are investing at the time. See page 51 for more information on Northern Trust’s appointment.
Cheap, flexible access to global share markets
What is a derivative?Derivatives are financial instruments that replicate the behaviour and performance of certain types of investments. Typically, they are linked to:
• individual securities such as equities;
• indexes on bonds and equities; and
• reference rates (such as an exchange rate or interest rate).
What is a counterparty?A counterparty is a term used to describe a legal entity to which an exposure to financial risk might exist. The Fund’s counterparties are typically banks. We work to best practice criteria and standards for the appointment and ongoing use of counterparties.
| NEW ZEALAND SUPERANNUATION FUND | ANNUAL REPORT 201454

What is a future?A financial contract obligating the buyer to purchase an asset (or the seller to sell an asset), such as a physical commodity or a financial instrument, at a predetermined future date and price.
What is a Total Return Swap?A bilateral financing agreement where the counterparties swap the total return of a single asset or index in exchange for periodic cash flows, typically a floating rate such as LIBOR plus an agreed financing spread.
This graph shows the changing access point mix of our passive global equity investments between 1 July 2009 and 30 June 2014.
100%
80%
60%
40%
20%
0%
PRO
POR
TIO
N
Physicals Derivatives
Jul-
09
Oct
-09
Feb
-10
Jun
-10
Oct
-10
Feb
-11
Jun
-11
Oct
-11
Feb
-12
Jun
-12
Oct
-12
Feb
-13
Jun
-13
Oct
-13
Feb
-14
Jun
-14
ACCESSING OUR PASSIVE GLOBAL EQUITY INVESTMENTS
100%
80%
60%
40%
20%
0%
ACCESSING OUR PASSIVE GLOBAL FIXED INCOME INVESTMENTS
PRO
POR
TIO
N
Physicals Derivatives
Jul-
09
Oct
-09
Feb
-10
Jun
-10
Oct
-10
Feb
-11
Jun
-11
Oct
-11
Feb
-12
Jun
-12
Oct
-12
Feb
-13
Jun
-13
-Oct
-13
Feb
-14
Jun
-14
USING DERIVATIVES
Where there is a good business case to do so, we make judicious use of derivatives to achieve our passive equity and fixed income exposure. In recent years holding securities physically has become more cost-effective and we have decreased our use of derivatives to obtain passive exposures accordingly. If pricing dynamics change in favour of derivatives, we will make greater use of them again, subject to managing the risks of using derivatives.
Derivatives introduce complexity and different operational and counterparty risks to the Fund compared to holding physical securities. We manage these risks through a range of counterparty and liquidity management risk limits and monitoring processes. We also have extensive management and Board reporting of our derivatives positions.
Over 2013/14, the Portfolio Completion team’s management of our passive exposures added value of 0.54% or NZD140 million to the Fund.
This graph shows the changing access point mix of our passive global fixed-income investments between 1 July 2009 and 30 June 2014. We first used derivatives to achieve this fixed income exposure in 2010.
NEW ZEALAND SUPERANNUATION FUND | ANNUAL REPORT 2014 | 55

NZ Super Fund and KKR – a strategic partnership
2014 KKR ENERGY MANDATE
New KKR energy private equity investments in North American natural gas exploration and production, midstream, downstream and/or energy infrastructure and services.
Up to USD175 million (flexible allocation)
KKR Energy Income and Growth Fund, a USD2.0 billion KKR fund focused primarily on investing in the development of unconventional gas and oil resources in North America.
USD75 million
In 2014, the Fund announced its third investment with global investment firm KKR (www.kkr.com), a commitment of up to USD250 million to North American shale gas and oil opportunities.
The Fund also has investments in the KKR Asian Fund, which invests in private equity in Asia, including Australasia, and the KKR 2006 Fund, which invests in large private equity buyouts, predominantly in the United States, but also in Europe and Asia Pacific.
Companies in which the Fund is invested through KKR include Capsugel (provider of empty two-piece hard capsules to the global pharmaceutical and dietary supplement industries), Big Heart Pet Brands (producer, distributor and marketer of premium pet food to the US retail market) and Santanol (an Australian sandalwood plantation manager).
The total size of the Fund’s relationship with KKR is more than NZD370 million of committed capital, making it one of our largest active investment manager relationships.
CASE STUDY INVESTMENT REPORT
KKR invests in capsule provider Capsugel.
Consistent with our desire to have fewer, deeper relationships with external managers, we view KKR as a strategic partner. We aim to gain added value from the relationship, over and above investment returns. This includes knowledge-sharing about investment trends and opportunities for staff secondments to enhance our in-house investment capability and expertise.
ENERGY MANDATE
Our energy mandate with KKR is designed to broaden and diversify the Fund’s current exposure to energy, in line with what is a changing global energy sector.
The KKR mandate complements recent alternative energy sector investments by the Fund, such as those in Bloom Energy and Ogin Inc., and moves by other Fund managers such as Morrison & Co to invest in energy infrastructure (see page 53 for more information).
Long term, we see attractive returns in the energy sector. There is increasing long-term demand for energy globally and constraints on its supply.
Significant changes are also occurring in the energy market, including the rapid development of natural gas. In the United States, for example, there is a large and ongoing decline in the burning of coal, as energy utilities transition towards gas supplies. Access to these opportunities is, however, difficult to achieve solely through listed markets.
For these reasons, appointing a private equity manager and benefiting from KKR’s expertise and North American relationships makes sense. KKR has been investing in the energy sector for more than 20 years and its global energy business covers the full energy supply chain. The company has been at the forefront of shifts in investor interest from conventional to unconventional natural gas resources.
KKR’s management of ESG factors was central to our due diligence on the investment. As a fellow signatory of the UNPRI, KKR is committed to the integration of ESG factors into the ongoing management of its investments.
For more information, including background information on the energy sector and a KKR paper on the oil and gas market opportunity in North America, search for ‘KKR’ on www.nzsuperfund.co.nz. See also our Responsible Investment Report at page 66.
| NEW ZEALAND SUPERANNUATION FUND | ANNUAL REPORT 201456

INVESTMENT REPORT
Investment Activity Report - New Zealand
WORLD CLASS NEW ZEALAND INVESTMENTS
Our ApproachWe are always looking to obtain the best return we can for the Fund’s investment portfolio, and to ensure that we have the right mix of investments in the Fund.
While we believe the Fund has a competitive advantage when investing domestically, in a global context, New Zealand is a very small investment market.
Before making an investment in New Zealand, therefore, we ensure that it is the best possible use of our capital at that point in time: i.e. the investment needs to stack up against all other global investment opportunities.
With this in mind, we take a rigorous approach to identifying and transacting suitable domestic investment opportunities.
We take a reasonably conservative approach to forecasting the cash flows of the transactions we review. In order to invest, we have to have confidence
that the investment will deliver returns that will compensate us sufficiently for the risk of concentrating too much of the Fund’s portfolio in New Zealand. As one of only a few investors of scale in the country, we also maintain a high level of price discipline.
As a long-term investor, we have the ability to pick our investing horizon and may choose to take advantage of favourable market conditions to sell New Zealand assets, or hold them for long periods.
For more information on our approach, see the Investing in NZ section on www.nzsuperfund.co.nz, which includes a short video by our Head of NZ Direct Investment, Michael Gleissner.
Value of NZ Investments
The following graph illustrates the growth and changes in composition in our New Zealand investments since 2009, when we received the Minister of Finance’s direction on New Zealand investment.
In the five years since 30 June 2009, the value of the Fund’s New Zealand investments has risen from NZD2.4 billion to NZD3.7 billion as at 30 June 2014.
Datacom Rural land and associated assets Listed Equities
*included in Listed Equities from 2013
Metlifecare Property Timber
Private Equity/Expansion Capital Auckland Airport*
Fixed Income Z Energy
4.0
3.5
3.0
2.5
2.0
1.5
1.0
0.5
–2009 2010 2011 2012 2013 2014
VALUE OF NEW ZEALAND INVESTMENTS 2009-2014
NZD
BIL
LIO
N
NEW ZEALAND SUPERANNUATION FUND | ANNUAL REPORT 2014 | 57

INVESTMENT REPORT
Investment Activity Report - New Zealand (continued)
Proportion of NZ InvestmentsIn the five years since 30 June 2009, the proportion of the overall Fund that is invested in New Zealand (in value terms) has reduced from 21.3% to 16.0% (20.8% in 2013).
In contrast to the exposure analysis provided in the ‘Where We Invest’ section on page 48, this figure is calculated based on the value of our New Zealand investments, as a proportion of the value of our ‘investments’ figure in our financial statements. This calculation includes investments in rural and forest land, but excludes foreign exchange hedging instruments such as FX contracts and cross-currency swaps.
The proportional drop reflects the strong performance of global equities in recent years. We have also taken advantage of favourable market conditions in New Zealand to reduce our domestic holdings in Auckland Airport, Z Energy and timber.
Highlights over 2013/14The value of the Fund’s New Zealand investments increased to NZD3.7 billion in 2013/14 (NZD3.4 billion in 2012/13).
During the year we established a dedicated NZ Direct Investment team, increasing our resource in this area with the addition of two new analyst roles.
Our objective in 2014/15 is to increase the number of deals on which we undertake due diligence.
In total, 26 New Zealand investment opportunities were reviewed in detail during the year, with a number still under active consideration as at 30 June 2014.
Notable investment activities during the year included:
• lifting our stake in dual-listed company Metlifecare to 19.9%. See the case study on page 59 for more information;
• selling 2.5% of Kaingaroa Forest to Kakano, a group of six North Island iwi. See the case study on page 60 for more information;
• successfully listing transport energy company Z Energy on the New Zealand and Australian stock exchanges. Through this transaction, we reduced our 50% stake in the company to 20%, realising NZD420 million for the Fund; and
• purchasing a further 0.3% of technology services company Datacom (www.datacom.co.nz), taking our total holding to 37.6%.
NZ ACTIVE EQUITIES
Good progress was also made on the establishment of our internal NZ Active Equities team, with the research base now well established. We are working through the top-50 listed companies on a sector-by-sector basis, and forming a view on specific companies. We expect the portfolio, which was formerly under passive management, to be completely transitioned to active management by the end of 2014/15.
We continue to work with three local listed equity managers: AMP Capital, Devon Funds Management and Milford Asset Management. Our global passive managers, BlackRock, State Street, Northern Trust and QS Investors, also have investments in listed New Zealand equities. In total, the Fund has around NZD1.7 billion invested in the New Zealand sharemarket, representing around 6% of the total Fund.
See the profile on page 80 for more information about the NZ Active Equities team members.
As well as evolving demand patterns, we also look for investments which will benefit from the other investment themes we have identified – resource sustainability and emerging markets segmentation. For more information seewww.superfund.co.nz
| NEW ZEALAND SUPERANNUATION FUND | ANNUAL REPORT 201458
Minister of Finance’s Directive 14 May 2009 “… I direct the Guardians to note that it is the Government’s expectation, in relation to the Fund’s performance, that opportunities that would enable the Guardians to increase the allocation of New Zealand assets in the Fund should be appropriately identified and considered by the Guardians.
This direction is not considered to be inconsistent with the Guardians’ duty to invest the Fund on a prudent, commercial basis, in accordance with section 58 of the Act, and the above paragraph is subject to that duty.”
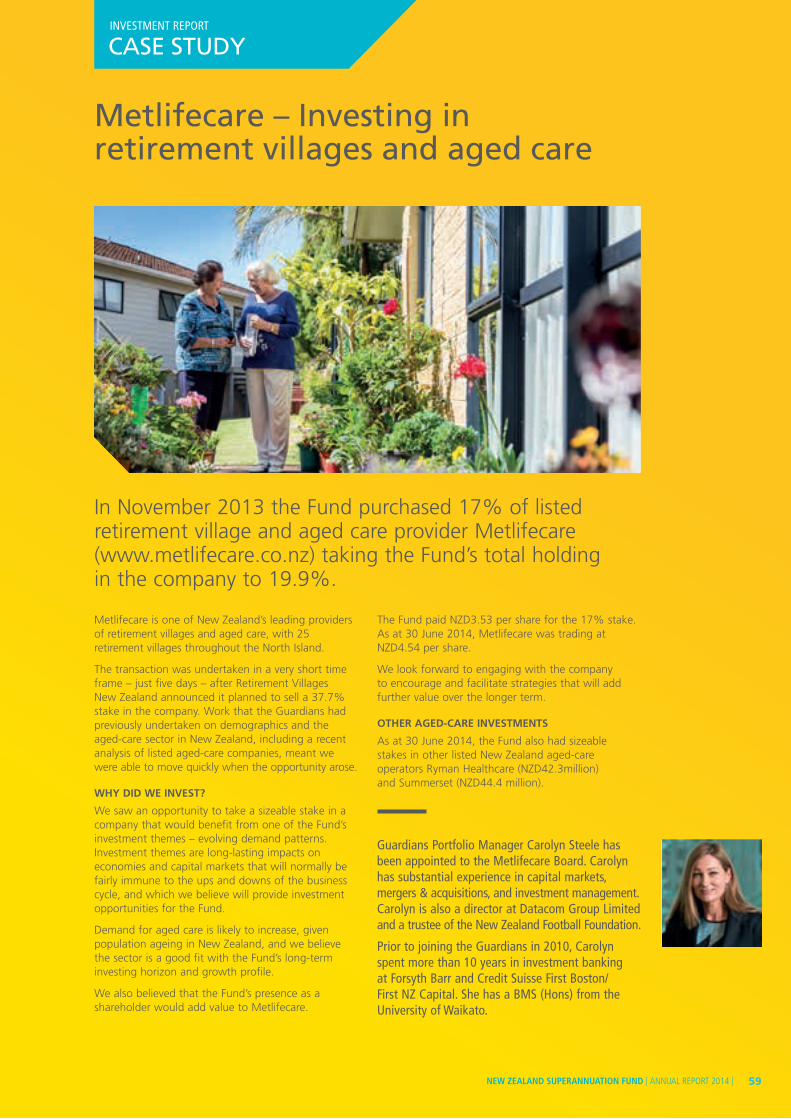
In November 2013 the Fund purchased 17% of listed retirement village and aged care provider Metlifecare (www.metlifecare.co.nz) taking the Fund’s total holding in the company to 19.9%.
CASE STUDY INVESTMENT REPORT
Metlifecare – Investing in retirement villages and aged care
Metlifecare is one of New Zealand’s leading providers of retirement villages and aged care, with 25 retirement villages throughout the North Island.
The transaction was undertaken in a very short time frame – just five days – after Retirement Villages New Zealand announced it planned to sell a 37.7% stake in the company. Work that the Guardians had previously undertaken on demographics and the aged-care sector in New Zealand, including a recent analysis of listed aged-care companies, meant we were able to move quickly when the opportunity arose.
WHY DID WE INVEST?
We saw an opportunity to take a sizeable stake in a company that would benefit from one of the Fund’s investment themes – evolving demand patterns. Investment themes are long-lasting impacts on economies and capital markets that will normally be fairly immune to the ups and downs of the business cycle, and which we believe will provide investment opportunities for the Fund.
Demand for aged care is likely to increase, given population ageing in New Zealand, and we believe the sector is a good fit with the Fund’s long-term investing horizon and growth profile.
We also believed that the Fund’s presence as a shareholder would add value to Metlifecare.
The Fund paid NZD3.53 per share for the 17% stake. As at 30 June 2014, Metlifecare was trading at NZD4.54 per share.
We look forward to engaging with the company to encourage and facilitate strategies that will add further value over the longer term.
OTHER AGED-CARE INVESTMENTS
As at 30 June 2014, the Fund also had sizeable stakes in other listed New Zealand aged-care operators Ryman Healthcare (NZD42.3million) and Summerset (NZD44.4 million).
Guardians Portfolio Manager Carolyn Steele has been appointed to the Metlifecare Board. Carolyn has substantial experience in capital markets, mergers & acquisitions, and investment management. Carolyn is also a director at Datacom Group Limited and a trustee of the New Zealand Football Foundation.
Prior to joining the Guardians in 2010, Carolyn spent more than 10 years in investment banking at Forsyth Barr and Credit Suisse First Boston/First NZ Capital. She has a BMS (Hons) from the University of Waikato.
NEW ZEALAND SUPERANNUATION FUND | ANNUAL REPORT 2014 | 59
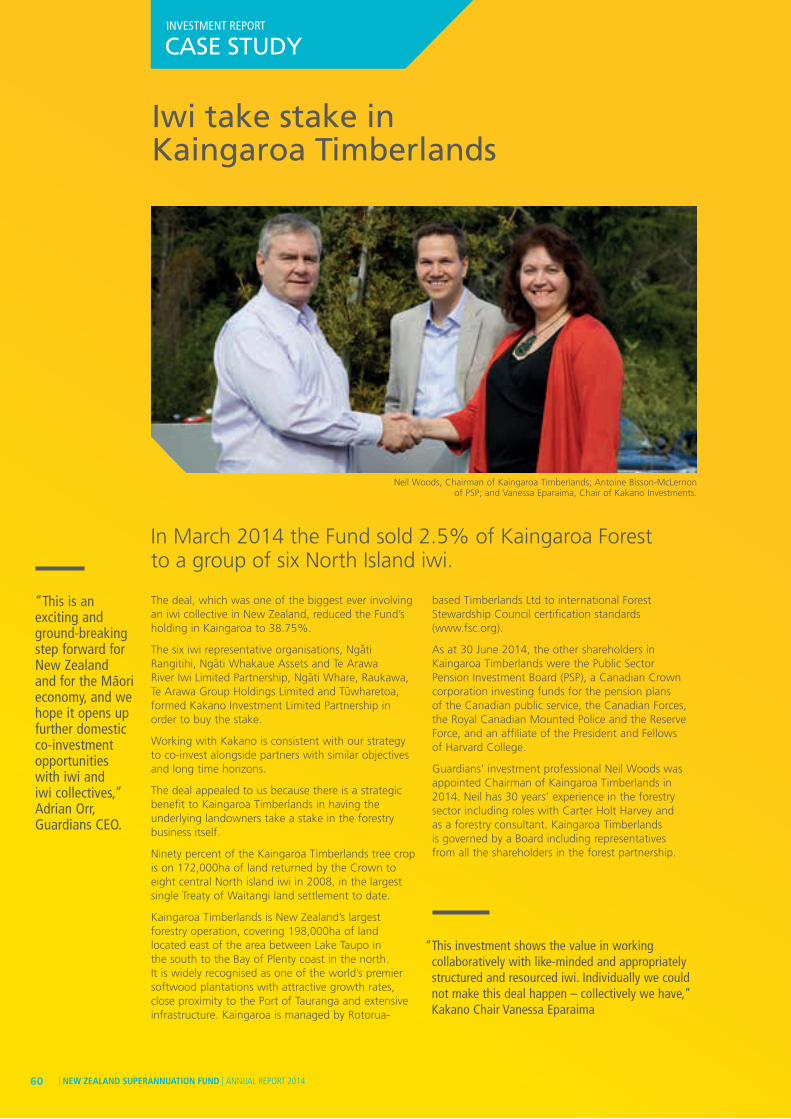
Neil Woods, Chairman of Kaingaroa Timberlands; Antoine Bisson-McLernon of PSP; and Vanessa Eparaima, Chair of Kakano Investments.
CASE STUDY INVESTMENT REPORT
Iwi take stake in Kaingaroa Timberlands
In March 2014 the Fund sold 2.5% of Kaingaroa Forest to a group of six North Island iwi.
The deal, which was one of the biggest ever involving an iwi collective in New Zealand, reduced the Fund’s holding in Kaingaroa to 38.75%.
The six iwi representative organisations, Nga-ti Rangitihi, Nga-ti Whakaue Assets and Te Arawa River Iwi Limited Partnership, Nga-ti Whare, Raukawa, Te Arawa Group Holdings Limited and Tu-wharetoa, formed Kakano Investment Limited Partnership in order to buy the stake.
Working with Kakano is consistent with our strategy to co-invest alongside partners with similar objectives and long time horizons.
The deal appealed to us because there is a strategic benefit to Kaingaroa Timberlands in having the underlying landowners take a stake in the forestry business itself.
Ninety percent of the Kaingaroa Timberlands tree crop is on 172,000ha of land returned by the Crown to eight central North island iwi in 2008, in the largest single Treaty of Waitangi land settlement to date.
Kaingaroa Timberlands is New Zealand’s largest forestry operation, covering 198,000ha of land located east of the area between Lake Taupo in the south to the Bay of Plenty coast in the north. It is widely recognised as one of the world’s premier softwood plantations with attractive growth rates, close proximity to the Port of Tauranga and extensive infrastructure. Kaingaroa is managed by Rotorua-
based Timberlands Ltd to international Forest Stewardship Council certification standards (www.fsc.org).
As at 30 June 2014, the other shareholders in Kaingaroa Timberlands were the Public Sector Pension Investment Board (PSP), a Canadian Crown corporation investing funds for the pension plans of the Canadian public service, the Canadian Forces, the Royal Canadian Mounted Police and the Reserve Force, and an affiliate of the President and Fellows of Harvard College.
Guardians’ investment professional Neil Woods was appointed Chairman of Kaingaroa Timberlands in 2014. Neil has 30 years’ experience in the forestry sector including roles with Carter Holt Harvey and as a forestry consultant. Kaingaroa Timberlands is governed by a Board including representatives from all the shareholders in the forest partnership.
“This is an exciting and ground-breaking step forward for New Zealand and for the Ma-ori economy, and we hope it opens up further domestic co-investment opportunities with iwi and iwi collectives,” Adrian Orr, Guardians CEO.
“ This investment shows the value in working collaboratively with like-minded and appropriately structured and resourced iwi. Individually we could not make this deal happen – collectively we have,” Kakano Chair Vanessa Eparaima
| NEW ZEALAND SUPERANNUATION FUND | ANNUAL REPORT 201460

Responsible Investment ReportINVESTMENT REPORT
The Guardians has a long-standing commitment to Responsible Investment (RI). We believe that environmental, social and governance (ESG) factors are material to long-term returns. Our governing legislation also requires us to have an ethical policy and to avoid prejudice to New Zealand’s reputation in the world community.
Therefore, as part of good governance of the Fund, we aim to actively manage the long-term risks and opportunities ESG concerns present now and into the future.
INTEGRATION
ESG considerations are integrated into all of the Fund’s investment activities. For example, ESG factors are considered when we identify investment opportunities, assess investment risk, undertake due diligence and make decisions as an asset owner and shareholder. We work closely with our investment managers to ensure the votes they make on our behalf are appropriate, and we aim to use our voting rights to promote best-practice corporate governance both in New Zealand and overseas.
BENCHMARKING
International standards and initiatives against which we are measured include the following:
• International Forum of Sovereign Wealth Funds’ Santiago Principles;
• Sovereign Wealth Fund Institute Transparency Index; and
• UNPRI Principles.
The UNPRI is the internationally accepted benchmark for how institutional investors should manage environmental, social and governance issues, and our RI work programme is closely aligned to its principles and priorities.
We also participate in relevant international investor groups where we believe working collaboratively will help deliver better ESG outcomes. These groups include the following:
• Carbon Disclosure Project;
• Investor Group on Climate Change Australia/ New Zealand;
• International Corporate Governance Network;
• Responsible Investment Association Australasia; and
• Australian Council of Superannuation Investors.
In 2014/15, we are also participating in Mercer’s Climate Change and Strategic Asset Allocation Project II. This global collaboration project, which updates and enhances a 2011 Mercer study, aims to help investors implement strategies that factor in both a near and a long-term view of climate risk. It includes detailed risk-analysis modelling to help develop robust, transparent and relevant climate change scenarios.
Global Reporting InitiativeThe Global Reporting Initiative (GRI) sustainability reporting guidelines have been developed to assist organisations around the world to report economic, governance, environmental and social performance in a consistent and comparable manner.
This is the third year in which we have reported against the GRI framework. We publish a GRI Index on our website at www.nzsuperfund.co.nz, including indicators for the financial services sector. Given the nature of the Guardians and Fund, some disclosures are not applicable (for example, we do not undertake marketing). Other disclosures we have reported against, partially or in full; in some areas, we have yet to begin reporting.
Currently, we are reporting against GRI’s 3.1 Guidelines, which were issued in 2011. These guidelines will continue to be accepted by the GRI until the end of 2015.
More information about the GRI framework and guidelines can be found at www.globalreporting.org.
NEW ZEALAND SUPERANNUATION FUND | ANNUAL REPORT 2014 | 61

AP• implementing our revamped engagement
programme;
• an active focus on New Zealand corporate governance alongside other local institutional investors;
• further integration of responsible investment considerations into the Guardians’ risk assessment process and portfolio analysis;
• reviewing investment opportunities with high ESG performance;
• building ESG skills in investment teams; and
• climate change scenario analysis.
• completing a review of our internal governance capability, to support our representation on the Boards of investee companies and on the Advisory Boards of external funds;
• incorporating ESG into company analysis and stock selection as part of the Fund’s new internal New Zealand active equities mandate;
• education, including RI Academy (www.riacademy.org), for investment personnel, and the development of an intranet-based staff education module on responsible investment;
• analysing methods to enhance the equity portfolio by building in ESG factors;
• assisting investment teams to develop their own ESG guidelines for their areas of responsibility; and
• a review of our engagement programme to improve its efficiency and effectiveness.
ACHIEVEMENTSDURING 2013/14 INCLUDED:
PRIORITIESFOR THE UPCOMING YEAR INCLUDE:
Responsible Investment Report (continued)
INVESTMENT REPORT
| NEW ZEALAND SUPERANNUATION FUND | ANNUAL REPORT 201462

INTEGRATION
UNPRI Principles: Principle 1 – We will incorporate ESG issues into investment analysis and decision-making processes
What we do – overview: • Integrate ESG considerations and guidelines across different types of investments, asset classes and also
in the search and selection of external managers
• Engage on ESG issues with investment managers, and the companies in which we invest
• Consider investments which provide environmental and social benefits in addition to the required financial return
• Carry out investment manager due diligence, monitoring and conviction
Highlights / key achievements for 2013/14: • integration of RI responsibilities into investment teams, including development of RI guidelines specific
to their areas of expertise and comprehensive training through the RI Academy and education tool kits;
• a review of empirical evidence about the impact of ESG factors and revised ESG beliefs on investment returns;
• ESG due diligence on seven new investment opportunities;
• analysis of ESG themes including alternative energy, water sector and social investment bonds;
• integration of RI manager reviews into our manager conviction review process;
• Forestry Stewardship Council certification in forestry, and health and safety monitoring across our direct investments.
OWNERSHIP
UNPRI Principles: Principle 2 – We will be active owners and incorporate ESG issues into our ownership policies and practices
What we do – overview: • Undertake direct and collaborative engagements with companies
• Apply exclusions
• Monitor our portfolio to ensure compliance with our exclusion list
• Monitor companies where we have completed our analysis and/or engagement
• Maintain a robust analytical and decision making process in responding to investee companies breaching our RI standards
• Exercise our voting rights on securities in which we invest
• Actively promote and engage on good practice corporate governance issues (especially in NZ)
Highlights / key achievements for 2013/14: • completion of an analysis of the state of corporate governance in New Zealand, including consultation
with key stakeholders;
• completion of a review of the structure and resourcing of our engagement programme;
• participation in eight collaborative engagements and five direct engagements with six companies during the year;
• implementation of a swap ensuring there is no exposure to excluded stocks within our large-cap derivative portfolio.
Each year, we report on our performance against the six UNPRI Principles: Integration, Ownership, Disclosure (Company Reporting), Best Practice, Collaboration and Communication
NEW ZEALAND SUPERANNUATION FUND | ANNUAL REPORT 2014 | 63
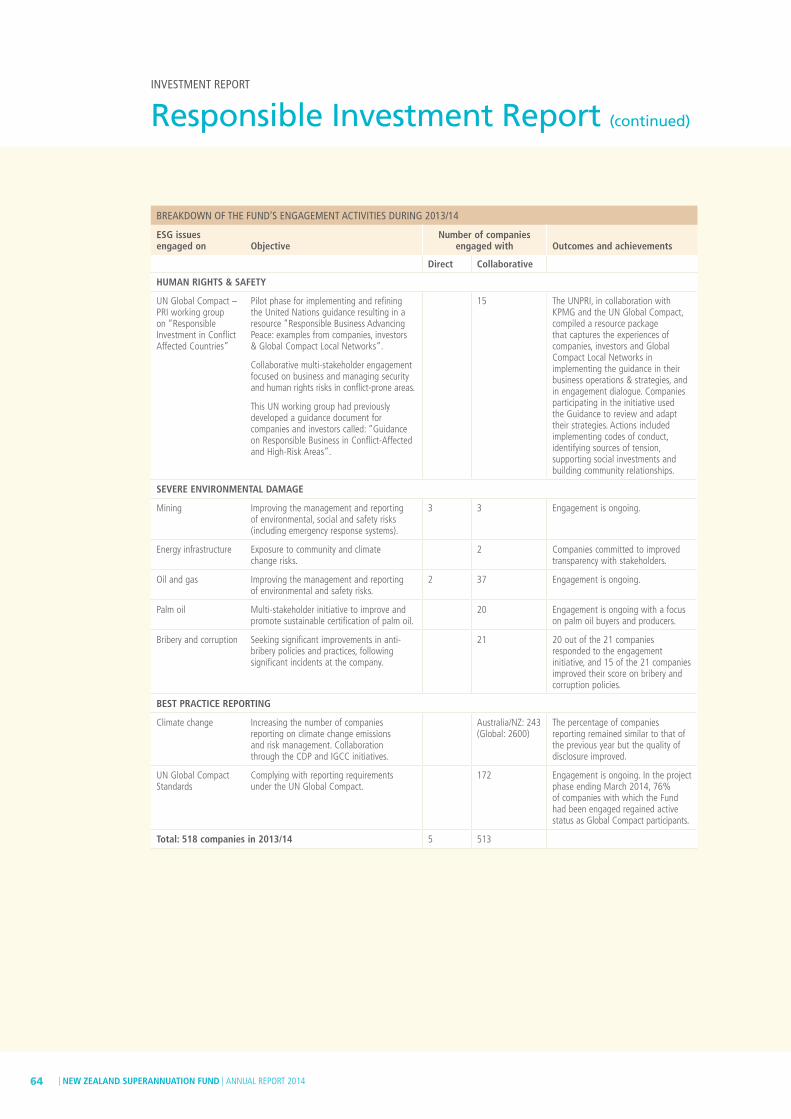
BREAKDOWN OF THE FUND’S ENGAGEMENT ACTIVITIES DURING 2013/14
ESG issues engaged on Objective
Number of companies engaged with Outcomes and achievements
Direct Collaborative
HUMAN RIGHTS & SAFETY
UN Global Compact –PRI working group on “Responsible Investment in Conflict Affected Countries”
Pilot phase for implementing and refining the United Nations guidance resulting in a resource “Responsible Business Advancing Peace: examples from companies, investors & Global Compact Local Networks”.
Collaborative multi-stakeholder engagement focused on business and managing security and human rights risks in conflict-prone areas.
This UN working group had previously developed a guidance document for companies and investors called: “Guidance on Responsible Business in Conflict-Affected and High-Risk Areas”.
15 The UNPRI, in collaboration with KPMG and the UN Global Compact, compiled a resource package that captures the experiences of companies, investors and Global Compact Local Networks in implementing the guidance in their business operations & strategies, and in engagement dialogue. Companies participating in the initiative used the Guidance to review and adapt their strategies. Actions included implementing codes of conduct, identifying sources of tension, supporting social investments and building community relationships.
SEVERE ENVIRONMENTAL DAMAGE
Mining Improving the management and reporting of environmental, social and safety risks (including emergency response systems).
3 3 Engagement is ongoing.
Energy infrastructure Exposure to community and climate change risks.
2 Companies committed to improved transparency with stakeholders.
Oil and gas Improving the management and reporting of environmental and safety risks.
2 37 Engagement is ongoing.
Palm oil Multi-stakeholder initiative to improve and promote sustainable certification of palm oil.
20 Engagement is ongoing with a focus on palm oil buyers and producers.
Bribery and corruption Seeking significant improvements in anti-bribery policies and practices, following significant incidents at the company.
21 20 out of the 21 companies responded to the engagement initiative, and 15 of the 21 companies improved their score on bribery and corruption policies.
BEST PRACTICE REPORTING
Climate change Increasing the number of companies reporting on climate change emissions and risk management. Collaboration through the CDP and IGCC initiatives.
Australia/NZ: 243(Global: 2600)
The percentage of companies reporting remained similar to that of the previous year but the quality of disclosure improved.
UN Global Compact Standards
Complying with reporting requirements under the UN Global Compact.
172 Engagement is ongoing. In the project phase ending March 2014, 76% of companies with which the Fund had been engaged regained active status as Global Compact participants.
Total: 518 companies in 2013/14 5 513
Responsible Investment Report (continued)
INVESTMENT REPORT
| NEW ZEALAND SUPERANNUATION FUND | ANNUAL REPORT 201464

DISCLOSURE
UNPRI Principles: Principle 3 – We will seek appropriate disclosure on ESG issues by the entities in which we invest
What we do – overview: • Work to raise investee companies’ awareness of good-practice public reporting standards and encourage
their own efforts in this regard
• Establish and monitor internal ESG reporting standards for our investment managers and direct investments
• Encourage good-practice reporting by NZ companies
Highlights / key achievements for 2013/14: • increased internal ESG reporting from managers, including from Indian real estate manager Red Fort Capital;
and reporting templates put in place for KKR energy mandate;
• participated in Carbon Disclosure Project;
• engaged with UN Global Compact companies on communication of progress reporting; and
• agreed to sponsor ‘Best Annual Report’ in the 2014 WriteMark NZ Plain English Awards.
BEST PRACTICE AND COLLABORATION
UNPRI Principles: Principle 4 – We will promote acceptance and implementation of the Principles within the investment industry
Principle 5 – We will work together to enhance our effectiveness in implementing the Principles
What we do – overview: • Benchmark our performance against the RI standards to which we aspire
• Contribute to the development of best practice: e.g. by participating in forums and working groups (e.g. UNPRI)
• Engage with regulators and advisors
• Collaborate with Crown Financial Institutions and global peers
• Develop asset and co-investment guidelines
Highlights / key achievements for 2013/14: • internal audit of RI integration into investment process and recommendations implemented;
• completed UNPRI Assessment;
• continued to manage the RI secretariat for the following Crown Financial Institutions: Accident Compensation Corporation and Government Superannuation Fund;
• convened forum on New Zealand Corporate Governance for institutional investors;
• sponsored RIAA Benchmarking Report;
• presented at RI NZ and ASFA conferences, RI workshops at Community Trust and ICGN conferences;
• sponsorship of the annual New Zealand RI Conference; and
• Guardians’ staff member on the Board of the Responsible Investment Association Australasia.
COMMUNICATION
UNPRI Principles: Principle 6 – We will each report on our activities and progress towards implementing the Principles
What we do – overview: • Report on our RI policy and activities including the benchmarking of those activities
• Carry out internal reporting
• Engage with stakeholders
Highlights / key achievements for 2013/14: • 2014 UNPRI Transparency Report and 2013 IGCC Climate Change Survey
completed and published;
• RI education sessions held with Treasury stakeholders;
• second report against GRI criteria;
• finalist – 2013 NZICA award for Best Public Sector Annual Report;
• gold award winner and finalist, Sustainability Category – 2014 Australasian Reporting Awards; and
• finalist – 2014 Global RI Reporting Awards.
NEW ZEALAND SUPERANNUATION FUND | ANNUAL REPORT 2014 | 65

CASE STUDIESENGAGING WITH GLOBAL ENERGY COMPANIES
The Guardians is participating in a UNPRI-led engagement project that focuses on global energy companies involved in hydraulic fracturing, including exploration and production, and oilfield service companies, operating in a number of markets including North America, Europe and China.
Hydraulic fracturing or ‘fracking’ can have significant environmental and social impacts on water resources, greenhouse gas emissions and local communities. Bans and moratoriums in several regions around the world have demonstrated that companies can face major risks to their social licences to operate and to their future earnings, if they are unable to manage these issues satisfactorily. The engagement aims to encourage companies to adopt good practice and report on management of these risks.
COLLABORATIVE ENGAGEMENT WITH GLOBAL MINING COMPANY
Over the last four years we have been involved, alongside other investors, in a collaborative engagement with a large global mining company operating in the emerging markets. The objective of the process, which has included intensive engagement with the company’s Chair and Chief Executive Officer, is to gain confidence that the company’s Board and, particularly, its Audit Committee are proactively identifying, assessing and addressing ESG risks.
The engagement has focused on the company’s environmental and social impacts, particularly in relation to waste, pollution and community relations. Specific outcomes have included:
• implementation of independent ESG review recommendations;
• appointment of two independent non-executives with ESG expertise;
• appointment of a Chief Sustainability Officer;
• standardisation and harmonisation of documents and polices on waste management, biodiversity and resettlement management;
• open investor access during several site visits; and
• the company signing the United Nations Global Compact.
While progress has been made, ESG issues and challenges remain. The engagement is ongoing and, for this reason, the name of the company concerned is confidential.
INVESTMENT REPORT
Responsible Investment Report (continued)
WORKING WITH OUR MANAGERS TO ENCOURAGE GOOD ESG PRACTICE
KKR energy mandatePrior to investing in the energy sector with KKR (see the case study on page 56 for more information), the Guardians’ RI team undertook extensive due diligence on the ESG risks relating to the investment.
It is our expectation that KKR, in its integration of ESG factors into the ongoing management of its investments, will encourage investee companies to adopt good practice in areas including:
• well integrity;
• waste and water management;
• air emissions, including methane capture;
• disclosure; and
• community engagement.
In developing templates for KKR to report to us on ESG issues, we paid particular attention to the standards promoted by the Investor Environmental Health Network (IEHN) and the Environmental Defense Fund. We will continue to work with KKR to use our influence to encourage good-practice management of hydraulic fracking operations.
GAW Capital – property developmentThe Fund has a NZD32 million investment in GAW Capital’s Gateway Real Estate Fund III, which focuses on real estate in greater China and South-East Asia.
| NEW ZEALAND SUPERANNUATION FUND | ANNUAL REPORT 201466

AWARD WINS AT FARMRIGHT
Innovation and Business Sustainability AwardFarmRight manages the Fund’s portfolio of 12 New Zealand dairy farms. As part of our relationship we sponsor an annual Innovation and Business Sustainability Award for FarmRight farm managers. This year’s award was won by Peter and Tiffany Lamb, for a project to develop tools to map and report effluent distribution patterns. The project has resulted in effluent application being carried out more efficiently and fertiliser inputs being reduced. The software and systems introduced by Peter and Tiffany will now be rolled out to other Fund farms.
We expect all the Fund’s farms to be operated in compliance with the Sustainable Dairying Water Accord and with all relevant Regional Council environmental rules and standards.
2014 Synlait Environmental AwardAaron and Frances Coles, who contract milk the Fund’s Orari Farm in South Canterbury, near Temuka, were the winners of the 2014 Synlait Environmental Award. This farm has benefited from investment by the Fund (and hard work by Aaron and Frances) to fence stock from waterways, carry out riparian planting and manage water quality. During the year, Ohapi Creek, which runs through the Orari Farm, was chosen by Fish & Game NZ as a location to release 7,000 young salmon; this is part of a community response to boost the numbers of fish in the Rangitata salmon fishery.
We consider property development in emerging markets to be high risk from an ESG perspective, and began engaging with GAW about its ESG practices in 2011.
At our suggestion, GAW appointed an external audit company in 2013 to carry out an independent health and safety assessment at a construction site in Chengdu and investment properties in Shanghai and Beijing. This assessment included interviewing site workers and reviewing available health and safety documentation.
A follow-up audit by the same external company in February 2014 confirmed that corrective actions recommended in the first assessment had been implemented and positive progress made.
We are working with GAW to help the company develop quarterly reporting on key ESG issues and appropriate governance structures across all sites. Guardians staff visited GAW Capital’s management and development sites in 2012 and 2014. We will continue to monitor the investment closely.
Anton Carr, Tru-Test Area Manager; Glen Goad, Farm Manager; Frances Coles; Aaron Coles; Mark Burnside (Synlait Milk Supply Relationship Manager); and Cameron Glass (FarmRight).
A GAW Capital development under construction.
Salmon being released in Ohapi Creek.
NEW ZEALAND SUPERANNUATION FUND | ANNUAL REPORT 2014 | 67

Operational Report
69 Highlights
70 CASE STUDY - Q&A with Head of Tax John Payne
72 Cost Efficiency and Benchmarking
75 Regulatory Update
77 Our People
83 Environmental Performance
68 | NEW ZEALAND SUPERANNUATION FUND | ANNUAL REPORT 2014

HighlightsOPERATIONAL REPORT
CENTRAL CLEARING IMPLEMENTATION
Over the last two years, we have undertaken a major project to preserve the option to trade over-the-counter derivatives with as many counterparties as possible under new regulatory frameworks in the United States and Europe.
The new regulatory frameworks, under the Dodd-Frank Wall Street reform and Consumer Protection Act in the US, and the European Markets Infrastructure Regulation in Europe, aim to improve transparency, mitigate risk in the global financial system and protect against market abuse.
What the changes mean is that some over-the-counter derivatives will need to be cleared through a central clearing counterparty (CCP). For these transactions, the CCP will stand between the Fund and the execution broker with which we are trading, and the CCP will become our counterparty.
In March 2014, we successfully completed our first United States trade using a swap execution facility (SEF), which is a trading platform in which multiple participants can trade over-the-counter derivatives. We are now focused on preparing for mandatory clearing with European counterparties.
NEW PERFORMANCE SYSTEM – PEARL
The introduction of a new performance system, Ortec’s PEARL, was a major focus during the year. While the technology aspects of the project went well, issues with the categorisation and quality of our existing performance data caused some implementation delays as we sought to validate the information. By the end of the financial year, however, the system had been successfully implemented and all the reporting for this Annual Report has been generated from PEARL.
Measuring and attributing the Fund’s performance to specific investments and strategies is extremely important, because it helps shed light on which decisions by the Guardians consistently add value on a risk-adjusted basis and which ones do not. The better an understanding we have of how each investment has contributed to the Fund’s overall performance, the better we can manage the Fund.
PEARL calculates returns for portfolio investments and compares these to a wide range of benchmarks. It also provides information about the overall level of risk in the portfolio.
The new system has significantly improved the depth and granularity of the Fund’s performance reporting. See page 45 for an example of the more granular data which we have been able to provide this year.
SPONSORSHIPS
We undertake a limited number of sponsorships in New Zealand. The intention of the sponsorships is to support activities or events which are consistent with, and which positively raise awareness of, our role and responsibilities in managing the Fund.
Our sponsorship portfolio includes:
• Auckland Centre for Financial Research at AUT – Auckland Finance Meeting;
• WriteMark Plain English Awards; and
• Innovation and Business Sustainability Award for FarmRight staff.
New sponsorships in 2013/14 included:
• 2013 RIAA Responsible Investment Briefing in Auckland; and
• 2014 RIAA Responsible Investment Benchmark Report.
STATEMENT OF INTENTkey strategic plan activityAchieved
STATEMENT
OF INTENT
key strategic
plan activity
Achieved
69NEW ZEALAND SUPERANNUATION FUND | ANNUAL REPORT 2014 |

Case StudyOPERATIONAL REPORT
Q&A with Head of Tax John Payne
John Payne is the Guardians’ Head of Tax, responsible for managing our tax obligations in New Zealand and offshore. He is also the Chair of the New Zealand Corporate Taxpayer Group.
In this Q&A, John explains the Guardians’ approach to tax management in New Zealand and overseas.
Why is New Zealand tax paid included in your reporting of investment returns?As the Fund is a wholly owned Crown asset, we consider tax paid in New Zealand as a return to the Crown.
How much tax does the Fund pay in New Zealand?As a rule of thumb, our effective New Zealand tax rate generally ranges between 22% and 25%. In a good year, the Fund is the largest taxpayer in New Zealand. The Fund’s tax expense for the 2013/14 year was NZD1.09 billion and it has paid NZD4.36 billion since inception.
What factors influence how much tax the Fund pays in New Zealand?Fund performance is the big driver. The specific New Zealand tax regimes associated with types of investments also have an influence.
Given that investment returns are hard to predict, how do you manage your tax payment obligations in New Zealand?We use tax pooling agents, who combine tax payments from various organisations to help us smooth out the peaks and troughs. This is a Government-approved process that helps us minimise interest charges from not paying the right amount of provisional tax due to market movements.
| NEW ZEALAND SUPERANNUATION FUND | ANNUAL REPORT 201470

The fact that the Fund pays income tax in New Zealand makes it unique among other sovereign wealth funds globally – such funds are usually exempt from paying tax in their home countries.
Which taxes apply to overseas investments?As a general rule, earnings from investments outside New Zealand are taxed in the investment’s home country. When we bring these earnings back to New Zealand, they may also be subject to withholding tax. We then pay New Zealand tax on the earnings from the investments.
Which exemptions apply?As a sovereign entity, the Fund is entitled to various exemptions from offshore withholding taxes. In limited circumstances, the Fund may also qualify for offshore income tax exemptions.
How do the Guardians ensure tax management is in line with best practice and meeting global tax obligations?Our approach, which is set out in our Risk Management Policy, was developed with input and sign-off from external tax advisory firms Deloitte and PricewaterhouseCoopers. It requires the Guardians and Fund to:
• comply with tax law and practice;
• pay the correct amount of tax in all jurisdictions;
• undertake conservative tax planning, consistent with the owners’ expectation manual issued by the Crown Ownership Monitoring Unit in July 2012;
• engage professional tax advisors to review and sign off on material tax issues;
• undertake accurate financial reporting for tax.
The Fund does not invest in schemes or arrangements that use secrecy laws to conceal assets and income that are subject to tax, or which create false tax deductions.
Does the Fund invest via tax havens?No – a tax haven is a country with low or no rates of tax, secrecy laws and a regime that restricts the effective exchange of information between government authorities. This is different to tax-neutral jurisdictions, such as Bermuda and the Cayman Islands, in which we do invest. These jurisdictions have low or nil tax rates but do have transparency and allow for the exchange of information between offshore revenue authorities including New Zealand.
Why invest via tax-neutral jurisdictions?The use of investment vehicles that are based in tax-neutral jurisdictions is common, legal and considered best-practice portfolio management by institutional investors. In most cases, investors such as the Fund, that are not resident in the United States, would not be able to access certain investments without using these vehicles.
For example, take a private equity fund that invests in companies in the United States and has investors from all around the world. Any applicable United States federal and state taxes are paid by the companies in the fund. The after-tax earnings from those companies then go into a collective investment vehicle for payment back to investors. Basing the collective investment vehicle in a tax-neutral jurisdiction means these offshore investors do not have to pay a second layer of foreign tax. In the case of the Fund, we also pay New Zealand income tax on the income.
What rules do you have in place regarding your use of tax-neutral jurisdictions? We require collective investment vehicles in which the Fund invests to provide full tax transparency and information exchange for tax purposes, and compliance with all relevant laws.
For more information on our approach to tax structuring, and the relevant disclosures for 2013/14, see Notes 1 and 5 in the Financial Statements for the Fund.
The Guardians has a Cooperative Compliance Agreement with the Inland Revenue Department. Under this agreement we disclose tax positions taken on Fund activities, including the tax treatment of new investments, to the IRD, before we file our tax return. In this way we can be confident that the IRD agrees with our approach before we file our return.
NEW ZEALAND SUPERANNUATION FUND | ANNUAL REPORT 2014 | 71

The net expected return of an investment (return after all costs) is central to all our decisions. We therefore seek to:
• ensure that any fees paid to external managers are in line with market standards and the complexity of the investment;
• include the cost of due diligence in our assessment of whether an investment opportunity is worth pursuing, relative to the potential risk-adjusted value;
• choose cost-effective access points for all investment opportunities; and
• benchmark our costs against those of our peers.
ACTIVITIES DURING 2013/14
During 2013/14, we undertook the following cost control initiatives:
• continued to shift judiciously between physical and derivative methods of accessing investments, in order to achieve the most cost-effective and flexible result (see the case study on pages 54-55 for more information);
• launched and embedded a new Guardians intranet, which is helping to streamline the induction of new staff and facilitate process improvements in our Operations team;
• embedded the use of a cost allocation tool to map resource use and staff time against investment projects, to ensure our efforts are optimally focused; and
• continued with the implementation of a personal efficiency training programme.
Cost control priorities in 2014/15 include developing benchmarking measures and ratios to better understand the impact of new investments on internal resourcing and organisational scalability.
ANNUAL CEM COST-EFFECTIVENESS SURVEY
The annual CEM Cost-Effectiveness Survey provides international benchmarking information for sovereign wealth and pension funds. The most recent survey showed the Fund’s value-add for the 2013 calendar year to be above that of the median for our peers. Costs over the same period, however, when adjusted for asset mix, were slightly above the peer median.
On a five year basis, our value-add was above the peer median and costs were below the median.
Looking forward, our objective is for the Fund to continue to achieve or do better than the median ratings of its peers for value-add and cost.
An executive summary of the survey results is available on www.nzsuperfund.co.nz.
FUND EXPENSES
The Guardians’ and the Fund’s expenses are accounted for separately. Both sets of expenses are met by the Fund, with the exception of a small annual appropriation from Parliament to meet the expenses of the Board of the Guardians and for audit fees.
In dollar terms and as a proportion of funds under management, the Fund’s overall expenses reduced from the prior financial year, driven primarily by a reduction in manager fees and advisor costs, offset by increased performance fees and personnel costs. Excluding performance fees, the Fund’s expenses reduced from 0.41% to 0.32% of funds under management – a result of the reduction in costs in combination with the increased funds under management.
Base manager fees reduced from NZD30.8 million to NZD24.8 million following the removal of several managers over both the prior and current financial years.
Custody fees reduced slightly from NZD4.4 million to NZD4.2 million following ongoing cost saving initiatives.
Personnel costs increased from NZD21.2 million to NZD25.5 million – a function of further increases to the headcount of the Guardians. As a proportion of funds under management, however, these costs remained flat at 0.10%.
Cost Efficiency and BenchmarkingOPERATIONAL REPORT
| NEW ZEALAND SUPERANNUATION FUND | ANNUAL REPORT 201472

Other operating expenses (including trading and brokerage expenses, audit fees and advisor costs) have reduced from NZD29.8 million to NZD24.7 million (or 0.14% to 0.10% of funds under management). This is, in part, due to the reduced trade expenses along with the reduced advisor costs arising from less prospective investment activity during the year.
New Zealand tax expense increased from NZD1,006.3 million to NZD1,094.6 million.
FUND EXPENSES 2014
Base Manager Fees 23%
Performance Fees 26%
Custody Fees 4%
Personnel Costs 24%
Other Expenses 23%
EXPENSE TYPE WHAT IS IT?
Base manager fees The amounts paid to investment managers for their time and expertise in managing specific investments on the Fund’s behalf. Typically, these fees are based on a percentage of the value of the assets under their management
Performance fees The incentive fees paid to investment managers based on the performance of the assets under their management
Custody fees The fees paid to the Fund’s custodian in return for the safekeeping and administration of investments
Personnel costs Comprised of employee remuneration and benefits, and other associated costs
Other operating expenses
These expenses primarily comprise of trade and brokerage expenses (the costs incurred in transacting investments); audit fees (amounts paid to the Fund and Guardians’ auditor for the execution of the statutory audit); and advisor costs (the fees paid to external experts for specific projects such as due diligence on prospective investments)
NEW ZEALAND SUPERANNUATION FUND | ANNUAL REPORT 2014 | 73

35,000
30,000
25,000
20,000
15,000
10,000
5,000
–
EXPENSES ANALYSIS FOR THE YEAR ENDED 30 JUNE 2014
Total expenses 2014: $107.7m 43.6bps (excluding performance fees: $79.3m 32.1bps)Total expenses 2013: $112.8m 53.7bps (excluding performance fees: $86.2m 41.0bps)
NZD
($’
000)
EXPENSES CLASSIFICATION
Base Manager Fees
Performance Fees
Custody Fees
Personnel Fees
Other Expenses
2013 NZD ‘000 2014 NZD ‘000
1.20%
1.00%
0.80%
0.60%
0.40%
0.20%
0.00%
FUND EXPENDITURE AS A PERCENTAGE OF FUNDS UNDER MANAGEMENT
2004 2005 2006 2007 2008 2009 2010 2011 2012 2013 2014
Total Manager Fees – Base & Performance – % of FUM
Other Expenses – % of FUM
Cost Efficiency and Benchmarking (continued)
OPERATIONAL REPORT
| NEW ZEALAND SUPERANNUATION FUND | ANNUAL REPORT 201474

In this section, we provide examples of areas of regulatory change relevant to the activities of the Guardians and Fund, and to the business of our investment managers, counterparties and service providers.
INTERNATIONAL REGULATORY DEVELOPMENTS
OTC derivatives regulationNew rules relating to over-the-counter (OTC) derivatives are currently being implemented around the globe. The rules aim to increase transparency, mitigate systemic risk and protect against market abuse.
As some of the new local and international rules are yet to be finalised, the full impact on the Fund’s operations remain unclear at this stage. For example, mandatory clearing of certain OTC derivative transactions is yet to be implemented in Europe and is unlikely to apply to the Fund until 2016.
We are monitoring these changes closely and are developing clearing, reporting and operational capability in order to comply with the global regulations within the required timeframes. See page 69 for further discussion.
Financial services sector reformBoth the US and Europe are reforming aspects of their financial services sectors. New regulations (such as the Dodd-Frank & Wall Street Reform and Consumer Protection Act and the Alternative Investment Fund Managers Directive) will impact on the Fund. Among other things, fund managers will be subject to increased reporting and conduct requirements. We are monitoring compliance by our investment managers, counterparties and service providers.
Foreign Account Tax Compliance Act (FATCA)This legislation, which passed in the US in March 2010, is designed to reduce tax evasion by US individuals relating to income from financial assets held outside the US. This Act and related guidance requires foreign financial institutions to agree to provide the US Internal Revenue Service with certain information (including any accounts held by US Persons) or face a 30% withholding tax on certain payments received.
In addition, foreign financial institutions will be required to withhold on certain payments made to other Foreign Financial Institutions that have not entered into an Internal Revenue Service agreement.
On 12 June 2014, the Government of New Zealand and the US Government signed an intergovernmental agreement (IGA) for the implementation of FATCA in New Zealand. The Guardians and the Fund are each treated as a Non-Reporting Financial Institution and as an exempt beneficial owner for the purposes of this legislation. This means we are not subject to the reporting requirements and do not expect to suffer a 30% withholding tax on income from our US investments.
NEW ZEALAND REGULATORY DEVELOPMENTS
Proposed changes to the New Zealand Superannuation and Retirement Income Act 2001The New Zealand Superannuation and Retirement Income Amendment Bill was introduced into the New Zealand Parliament on 5 November 2013. The Bill was reported back from Select Committee on 30 July 2014.
The primary purpose of the proposed changes under the Bill is to facilitate the efficient and effective investment of the Fund by allowing the Guardians to control entities (Fund Investment Vehicles) formed for the purpose of holding, facilitating and managing the investments of the Fund.
Regulatory UpdateOPERATIONAL REPORT
As a global investor, the Fund is subject to the laws and regulations of the many and diverse jurisdictions in which it invests. Ensuring that the Guardians and the Fund comply with requirements in all of the jurisdictions in which the Fund invests is an important task.
Cost Efficiency and Benchmarking (continued)
NEW ZEALAND SUPERANNUATION FUND | ANNUAL REPORT 2014 | 75

Like a number of institutional investors, the Guardians prefers to utilise flexible mandates with external investment managers. Flexible mandates give us, among other benefits, the ability to divert committed but undrawn funds away from existing investment opportunities and into new ones, in line with our view of the relative attractiveness of these opportunities over time. Being able to use Fund Investment Vehicles will enable greater use of flexible mandates.
The Guardians and Fund will continue to be prevented from holding or taking substantial controlling interests in any operating entity, such as through takeovers of listed companies or acquisitions of majority interests in unlisted operating entities.
The Bill also includes a number of other less material amendments to facilitate the efficient and effective investment of the Fund.
Financial Markets Conduct ActThe FMCA was enacted on 13 September 2013 and is being implemented in two phases, with the final phase to commence on 1 December 2014. The Act introduces a comprehensive overhaul of New Zealand’s securities and financial markets law and implements a new ‘one-stop-shop’ for securities law in New Zealand. It governs how financial products are created, promoted and sold, and the ongoing responsibilities of those who offer, deal in and trade them.
The Guardians has been ensuring that it understands the new legislation so that it is aware of the new regime applicable to securities and financial markets law in New Zealand.
Financial Reporting ActThe Financial Reporting Act 2013 came into force on 1 April 2014. The Act (together with the Financial Reporting (Amendments to Other Enactments) Act 2013) repeals and replaces the Financial Reporting Act 1993 and amends a number of other statutes containing financial reporting obligations. The Act is aimed at reducing compliance costs for small and medium-sized businesses as well as making financial reporting legislation more user-friendly.
The Act also creates new financial reporting and auditing and assurance requirements. For the Fund,
along with a select number of other entities, this results in accounting records needing to be kept in compliance with both NZ Equivalents to International Financial Reporting Standards (NZ IFRS) and Public Benefit Entity (PBE) standards. While there are limited differences between the two sets of standards at this stage, further divergence may occur over time. See our Financial Statements at page 95 for more information.
Health and Safety ReformThe Health and Safety Reform Bill was introduced into the New Zealand Parliament on 10 March 2014. The Bill is expected to pass into law by the end of 2014 and come into force in April 2015. It is described as the most significant reform in New Zealand health and safety in the past 20 years and will replace the existing occupational health and safety legislation, including the Health and Safety in Employment Act 1992.
The Guardians has been monitoring and will continue to monitor the progress of the Bill to ensure that it understands its obligations under the new reforms and that it is well placed to examine its external investment and asset managers’ readiness for the new laws.
The Guardians undertook a review of its current reporting practices and investment structures in 2012/13, with a particular focus on our farming and direct timber investments in New Zealand. In light of the Bill, the Guardians refreshed this review in 2013/14. This review has not highlighted any significant changes needed in due diligence, appointment terms or monitoring and reporting. We will, however, continue to refine our approach and expectations of our managers in light of our commitment to best practice in the area of health and safety.
OtherOther important regulatory developments in New Zealand that may impact upon the Fund’s business, the business of the Fund’s appointed investment managers, counterparties and service providers or otherwise impact the markets in which the Fund operates include:
• Crown Entities Amendment Act 2013;
• Companies Amendment Act 2014;
• Limited Partnerships Amendment Act 2014; and
• Organised Crime and Anti-corruption Legislation Bill.
Regulatory Update (continued)
OPERATIONAL REPORT
| NEW ZEALAND SUPERANNUATION FUND | ANNUAL REPORT 201476

Being able to attract, retain and develop high calibre people in a global, highly competitive market is vital to the performance of the Fund.
We aim to embed the Guardians’ vision, values and culture; translate business strategies into clear role requirements, accountabilities and competencies; and improve productivity and business performance through compensation, performance management, and leadership and coaching programmes.
We place a high priority on attracting the best candidates, retaining our top talent and building the capability of our team. We strive to be a good employer and are committed to offering equal employment opportunities to prospective and existing staff. Workplace flexibility, investing in professional development and offering staff career progression opportunities are central to our employment offering.
OUR CULTURE
As we are a fairly young organisation that has been growing quickly (staff numbers have increased from 59 full time employees in 2009 to 97 in 2014), developing a common culture has been an important focus for the Guardians. With new staff joining us, some of whom have had extensive careers in companies with very different cultures, we continue to place a strong emphasis on coaching staff about the behaviour and values we are looking for here.
We place a high priority on maintaining a constructive, collaborative and transparent workplace culture.
We believe that having a strong culture and high levels of staff engagement will influence the effectiveness with which we work and ultimately be positive for investment returns.
2013/14 ACHIEVEMENTS
High levels of employee engagement are important to the success of the Guardians and Fund, as is having a constructive and collaborative work culture. We want everyone to have a great experience working here and the Guardians to benefit from the associated employee engagement and goodwill.
Engagement survey In April 2014, the Guardians undertook the Corporate Executive Board (CEB) Employee Engagement Survey, achieving a 98% response rate from staff. This is the first time we have undertaken the survey, and we will repeat it in 2016.
The Guardians had an overall engagement score of 71% compared to CEB’s global benchmark of 61%.
CEB commented that it was one of the best reports they had seen in a long time.
In 2015, we will repeat the Organisational Culture Inventory® (OCI) and the Organisational Effectiveness Inventory® (OEI) surveys we undertook in 2013.
Internal promotionsWe were pleased to be able to confirm internal transfers and promotions to 14 staff members during the year. Being able to offer staff members career progression opportunities and the ability to gain new skills is an important attraction and retention strategy. It also allows us to retain valuable institutional knowledge.
Staff training and secondmentsWe continued the organisation-wide personal efficiency training programme we began in 2012/13, as part of a wider effort to maximise productivity, reduce cost and increase efficiency and effectiveness. A further 21 staff members completed tailored training sessions during the year.
In accordance with our commitment to managing the Fund in line with global best practice, we also continued to make a significant investment in learning and development for individual staff members. Expenditure on training as a percentage of operating expenditure increased from 0.76% to 1.38%. We also appointed a Learning and Development Advisor to coordinate staff training more effectively.
Summer intern programmeThis year we built on the success of previous summer internships at the Guardians, expanding our programme to include 11 interns from a range of academic disciplines including economics, finance and information technology. The interns worked on a full-time basis for the Guardians over the university summer break, completing a range of practical projects and receiving a good overview of the activities of the Guardians and the Fund.
Long term, the programme is intended to support the development of our talent pipeline. As the majority of permanent roles at the Guardians are for more-experienced staff, we do not have a formal graduate programme.
Our PeopleOPERATIONAL REPORT
NEW ZEALAND SUPERANNUATION FUND | ANNUAL REPORT 2014 | 77

Good employer reportingThe Human Rights Commission rated the Guardians 1st out of 91 New Zealand Crown entities in a 2014 review of Annual Reports, giving the Guardians a compliance rating of 100% for its ‘good employer’ reporting. The Human Rights Commission’s report is available on www.nzsuperfund.co.nz.
PRIORITIES FOR 2014/15
Priorities for the coming year include:
• the introduction of changes to the Guardians’ discretionary incentive scheme, in order to improve staff alignment with the Guardians’ strategic objectives and support our focus on workplace culture;
• a review of role sizing across the organisation;
• the simplification of role descriptions; and
• the introduction of a 360º online performance assessment system.
HEALTH AND SAFETY
Our Human Resources Policy, available on www.nzsuperfund.co.nz, sets out our commitment to providing a safe and healthy working environment for all employees and for everyone who visits our place of work. We strive to:
• reduce and, where possible, eliminate any hazards;
• educate employees on health and safety issues;
• prevent injury to people at work; and
• comply with the requirements of the Health and Safety in Employment Act 1992.
Under the Policy, responsibility for maintaining a safe and healthy work environment is the responsibility of all staff.
Being mainly office-based, the Guardians is not a high-risk environment from a safety point of view. Identified potential hazards include overseas travel, occupational overuse syndrome and stress. We are managing our key risk areas constantly and provide a substantial programme of support services to staff.
STAFF PROFILE
CRISTINA BILLETT LEGAL COUNSEL Cristina Billett, a senior member of the Guardians’ in-house legal team, was named the joint winner of the CLANZ-Chapman Tripp Public Sector In-house Lawyer of the Year in June 2014.
Cristina joined the Guardians in 2009 and, over time, has become not just a respected legal advisor but a critical member of its deal teams. In the 2013/14 year, she was the Guardians’ lead legal advisor on transactions including the Z Energy initial public offering, the KKR energy mandate, our direct investment in Ogin Inc. and the sale of 2.5% of Kaingaroa to Kakano Investments.
In her five years with the Guardians, Cristina has made a significant contribution to commercial outcomes on a range of investments and transactions, and has led a series of practice improvements within the Guardians’ legal team.
Her previous roles have included legal counsel at another Auckland-based financial organisation and Senior Associate at Freehills in Melbourne. She began her career at Bell Gully and has a LLB(Hons) degree from the University of Auckland.
“I enjoy working with people who share the same passion as I do for striving for results, innovative thinking and making the Fund as successful as possible.” – Cristina Billett
Our People (continued)
OPERATIONAL REPORT
| NEW ZEALAND SUPERANNUATION FUND | ANNUAL REPORT 201478

We have achieved a primary-level standard in ACC’s Workplace Safety Management Practices Programme. Under this programme, the Guardians receives a discount on the standard ACC Workplace Cover levy in recognition of our establishment of health and safety systems and good practices in injury prevention.
Activities undertaken as part of our wellness programme include:
• annual review of health and safety policy;
• subsidised health insurance;
• workstation assessments for all employees;
• advice on safe travel practices;
• International SOS services provided to travellers;
• first-aid training including CPR and defibrillator training;
• free influenza injections;
• free healthy heart checks; and
• regular occupational health nurse visits.
GOOD EMPLOYER As a Crown entity, the Guardians is committed to being a good employer. This includes offering equal employment opportunities (EEO) to prospective and existing staff, and recognising the employment aims of Ma-ori, ethnic minorities, women and people with disabilities. Staff members are involved in the development of our good employer and EEO programmes and have the opportunity to provide input on our Human Resources Policy and approach.
We believe that being a good employer will help us achieve our long-term business goals. To us, being a good employer means that our people: enjoy and feel safe in their workplace; trust the processes and procedures around their development, recognition, promotion and exit; and are enthused and professionally satisfied by their roles.
Our activities against seven key elements of being a good employer are summarised below.
ELEMENT GUARDIANS ACTIVITY
Leadership, accountability and culture
• Alignment between Strategic Plan objectives, individual objectives and performance measures • Engagement survey completed in April 2014
Employee development, promotion and exit
• Programme in place to identify and develop high-performing talent • Vacancies advertised internally • Secondment programme established • Exit interview process
Recruitment, selection and induction
• Robust recruitment and selection processes • Orientation and induction for all staff including a 12-week review • Summer internship programme
Remuneration, recognition and conditions
• Transparent, equitable and gender-neutral job evaluation practices • Remuneration benchmarked against third-party New Zealand data • New incentive programme into its fourth year
Flexibility and work design • IT systems facilitate working from home • Flexible working arrangements supported where appropriate • 50% return rates from parental leave
Harassment and bullying prevention
• Employee Code of Conduct and relevant policies available and endorsed at all times • Performance management process rewards positive and constructive behaviour
Safe and healthy environment • Strong focus on employee health, safety and well-being through provision of support services (see above) • Primary-level standard in ACC’s Workplace Safety Management Practices Programme
NEW ZEALAND SUPERANNUATION FUND | ANNUAL REPORT 2014 | 79

Tim Koller, Tim Mitchell, Tip Piumsomboon, Brian Bourdôt.
TEAM PROFILE
NZ ACTIVE EQUITIES Over the last year, Tim Mitchell, who was appointed Manager, NZ Equities in 2013, has been building the team that manages the Fund’s in-house New Zealand-listed equities portfolio.
Tim joined the Guardians in 2003, and has held a number of senior roles including General Manager Public Markets and General Manager Corporate Strategy. He was previously a consultant to the Board with responsibility for establishing the Fund’s infrastructure and policies. Prior to joining the Guardians Tim also worked as a principal advisor at The Treasury and as Chief Investment Officer with Colonial First State.
The other NZ Equities team members are Portfolio Manager Brian Bourdôt and Analyst Tip Piumsomboon.
Originally from Christchurch, Brian joined the Guardians in 2013 from London, where he had spent nine years as a sell-side analyst with UBS, Deutsche Bank and Barclays. Prior to that he worked in a series of banking and broking roles in Sydney, and for The Treasury. As well as holding a BSc(Hons) degree from the University of Canterbury and a DipCom degree in Finance from the University of Otago, Brian is a CFA Charterholder and a licensed private pilot.
Tip, who moved to New Zealand from Thailand when she was six, joined the team on a permanent basis in 2014. While at university, she completed summer internships at the Guardians and with the United Nations in Thailand. She has a BCom(Hons) degree from the University of Auckland and is studying for her CFA.
Tim, Brian and Tip work closely with Tim Koller, Portfolio Manager in the Guardians’ Portfolio Completion (Treasury) team – while Tim Mitchell, Brian and Tip research the different companies and sectors, Tim Koller does the actual day-to-day investing of our equity holdings.
“After spending more than ten years overseas as a sell-side research analyst, it was great to have the opportunity to return home: more so as I get to put my skills and experience to work as an investor, helping to look after the interests of all New Zealanders.” – Brian Bourdôt
Our People (continued)
OPERATIONAL REPORT
| NEW ZEALAND SUPERANNUATION FUND | ANNUAL REPORT 201480
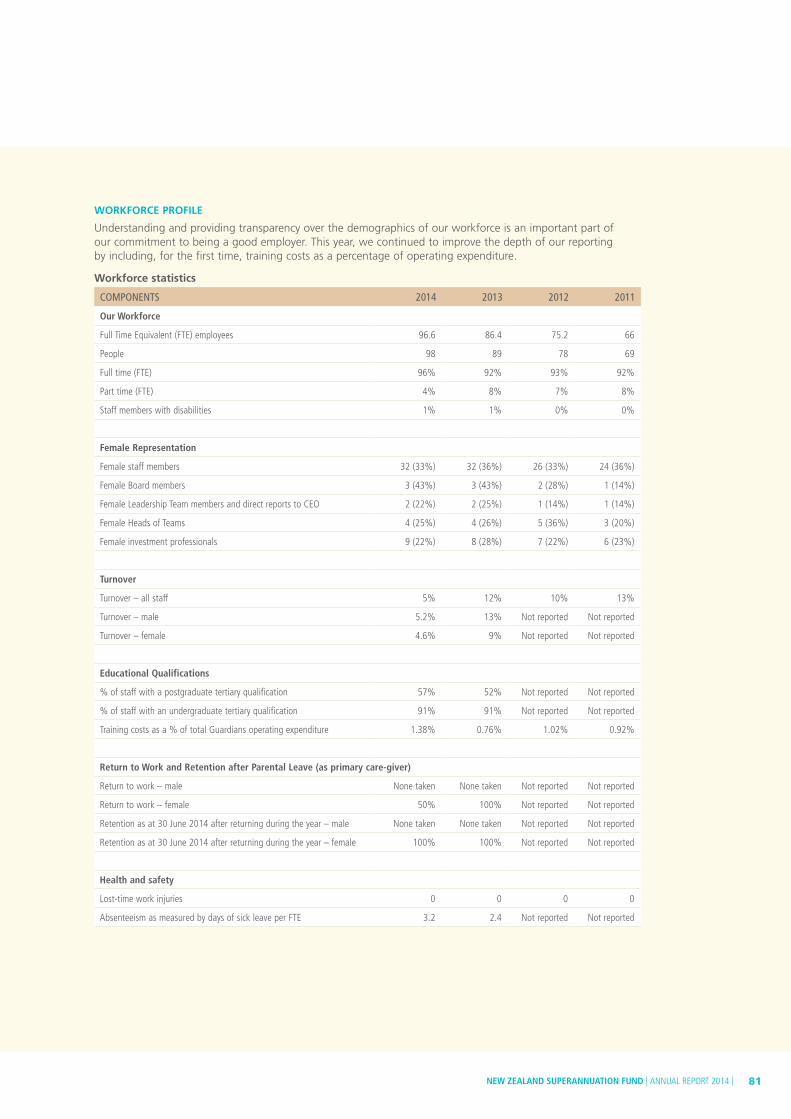
WORKFORCE PROFILE
Understanding and providing transparency over the demographics of our workforce is an important part of our commitment to being a good employer. This year, we continued to improve the depth of our reporting by including, for the first time, training costs as a percentage of operating expenditure.
Workforce statistics
COMPONENTS 2014 2013 2012 2011
Our Workforce
Full Time Equivalent (FTE) employees 96.6 86.4 75.2 66
People 98 89 78 69
Full time (FTE) 96% 92% 93% 92%
Part time (FTE) 4% 8% 7% 8%
Staff members with disabilities 1% 1% 0% 0%
Female Representation
Female staff members 32 (33%) 32 (36%) 26 (33%) 24 (36%)
Female Board members 3 (43%) 3 (43%) 2 (28%) 1 (14%)
Female Leadership Team members and direct reports to CEO 2 (22%) 2 (25%) 1 (14%) 1 (14%)
Female Heads of Teams 4 (25%) 4 (26%) 5 (36%) 3 (20%)
Female investment professionals 9 (22%) 8 (28%) 7 (22%) 6 (23%)
Turnover
Turnover – all staff 5% 12% 10% 13%
Turnover – male 5.2% 13% Not reported Not reported
Turnover – female 4.6% 9% Not reported Not reported
Educational Qualifications
% of staff with a postgraduate tertiary qualification 57% 52% Not reported Not reported
% of staff with an undergraduate tertiary qualification 91% 91% Not reported Not reported
Training costs as a % of total Guardians operating expenditure 1.38% 0.76% 1.02% 0.92%
Return to Work and Retention after Parental Leave (as primary care-giver)
Return to work – male None taken None taken Not reported Not reported
Return to work – female 50% 100% Not reported Not reported
Retention as at 30 June 2014 after returning during the year – male None taken None taken Not reported Not reported
Retention as at 30 June 2014 after returning during the year – female 100% 100% Not reported Not reported
Health and safety
Lost-time work injuries 0 0 0 0
Absenteeism as measured by days of sick leave per FTE 3.2 2.4 Not reported Not reported
NEW ZEALAND SUPERANNUATION FUND | ANNUAL REPORT 2014 | 81

ETHNIC PROFILE AS AT 30 JUNE 2014
NZ European 60%
Chinese 12%
Other European 6%
Indian 4%
Pacific Peoples 4%
M-aori 2%
Other Ethnicity 7%
Not stated 5%
GENDER BALANCE AS AT 30 JUNE 2014
Male 67%
Female 33%
Our People (continued)
OPERATIONAL REPORT
45
40
35
30
25
20
15
10
5
0Under 20 21-29 30-39 40-49 50-59 60+
WORKFORCE AGE
NU
MB
ER O
F PE
OPL
E
2012 2013 2014
| NEW ZEALAND SUPERANNUATION FUND | ANNUAL REPORT 201482

Environmental Performance
The Guardians’ Environmental Policy outlines our commitment to monitoring and minimising the environmental footprint of our growing organisation.
Over the past year, we furthered this commitment by expanding the remit of our Health and Safety Committee to include environmental matters. The newly formed Health, Safety and Environmental Committee meets quarterly and aims to improve staff awareness about the environmental impact of our activities and set achievable targets for minimising this impact.
We employ Enviro-Mark Solutions to verify our carbon emissions. This includes measuring our internal energy use, flights taken by staff and use of taxis. As 2013/14 is our second year of measuring emissions using guidance from ISO140641, we are now able to provide year-on-year comparisons for this information (see the following table for a breakdown).
The results for 2013/14 show a decrease (per full-time-equivalent employee) in taxi use, staff mileage claims and kilometres flown during short-haul aeroplane trips. Long-haul travel increased due to greater investment in staff training during the year compared to that in 2012/13.
We have some concerns that the data from our waste collection company is inaccurate, given the large change in volume from year to year. We have, however, continued to implement our comprehensive waste recycling programme, in which food/organic waste, recyclable material such as cans, glass and plastic, and landfill rubbish are separated.
In 2014/15, we will be taking more office space in the Zurich Building to accommodate our growing staff. This will likely result in greater use in total of electricity and greater waste output. However, we are committed to being as efficient as possible. Our building was the first office tower in New Zealand to receive a 5 Star ‘Green’ rating for features like a double-glazed façade which reduces energy consumption such as heating, and full-height glass windows which maximise natural light.
As a responsible investor, we also strive to integrate environmental concerns into our wider activities as an investment manager. See the Responsible Investment Report on pages 61-67 for more information.
PEOPLE AND ENVIRONMENT REPORT
NEW ZEALAND SUPERANNUATION FUND | ANNUAL REPORT 2014 | 83
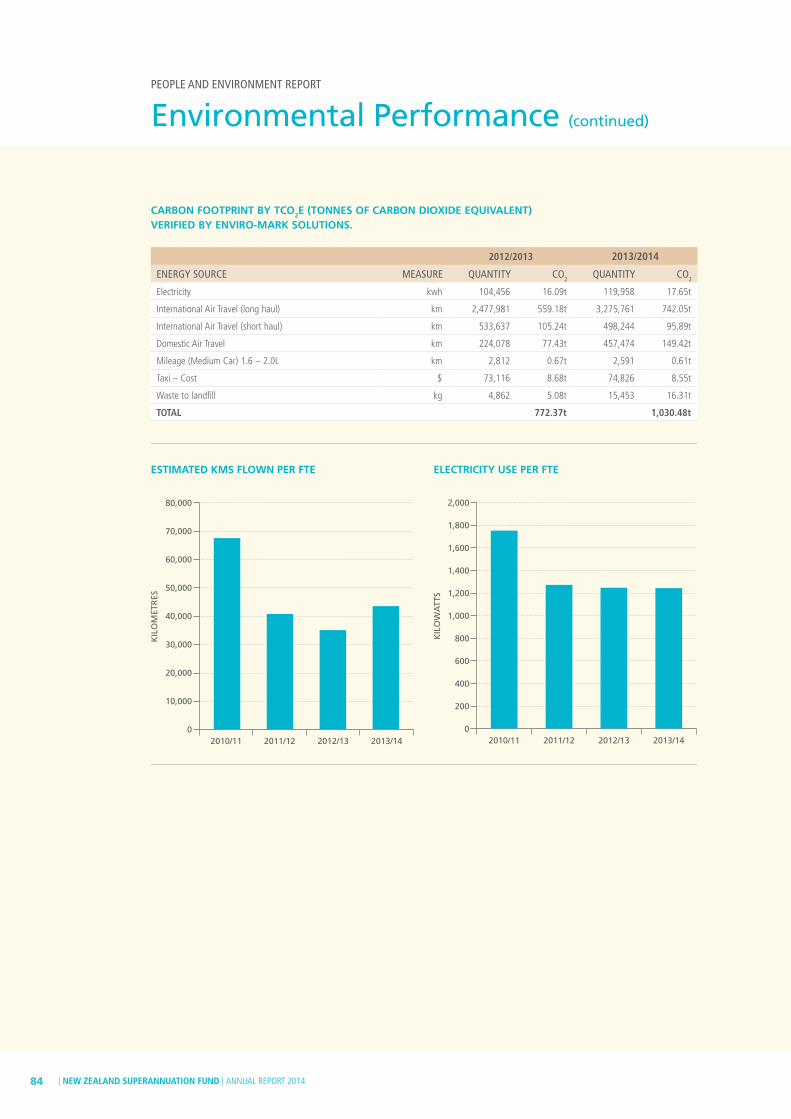
CARBON FOOTPRINT BY TCO2E (TONNES OF CARBON DIOXIDE EQUIVALENT) VERIFIED BY ENVIRO-MARK SOLUTIONS.
2012/2013 2013/2014
ENERGY SOURCE MEASURE QUANTITY CO2 QUANTITY CO2
Electricity kwh 104,456 16.09t 119,958 17.65t
International Air Travel (long haul) km 2,477,981 559.18t 3,275,761 742.05t
International Air Travel (short haul) km 533,637 105.24t 498,244 95.89t
Domestic Air Travel km 224,078 77.43t 457,474 149.42t
Mileage (Medium Car) 1.6 – 2.0L km 2,812 0.67t 2,591 0.61t
Taxi – Cost $ 73,116 8.68t 74,826 8.55t
Waste to landfill kg 4,862 5.08t 15,453 16.31t
TOTAL 772.37t 1,030.48t
80,000
70,000
60,000
50,000
40,000
30,000
20,000
10,000
02010/11 2011/12 2012/13 2013/14
KIL
OM
ETR
ES
ESTIMATED KMS FLOWN PER FTE
2,000
1,800
1,600
1,400
1,200
1,000
800
600
400
200
02010/11 2011/12 2012/13 2013/14
KIL
OW
ATT
S
ELECTRICITY USE PER FTE
Environmental Performance (continued)
PEOPLE AND ENVIRONMENT REPORT
| NEW ZEALAND SUPERANNUATION FUND | ANNUAL REPORT 201484

Compliance Statements
86 Statement of Service Performance
91 Managers and Custodians
94 SIPSP Compliance
85NEW ZEALAND SUPERANNUATION FUND | ANNUAL REPORT 2014 |

Statement of Service Performance
See pages 14-15 for an overview of our performance in 2013/14 against the objectives and activities set out in the Guardians’ 2013-2018 Strategic Plan. This overview supplements the information provided in this Statement of Service Performance.
This Statement of Service Performance (SSP) measures the Guardians’ progress against objectives and measurements set out in the Forecast Statement of Service Performance (FSSP) in our 2013-2018 Statement of Intent
As explained in our Statement of Intent, the single output of the Guardians is managing the Fund. That output comprises five work programmes covering:
• investment;
• risk management;
• cost control;
• governance; and
• organisational capability.
For each work programme, we have set performance measures which, collectively, are performance measures for our output.
Note: while Government cash contributions to the Fund are suspended, we receive no Crown funding other than an appropriation to meet Board costs and audit fees (this appropriation, NZD351,000 in 2013/14, is required by our legislation). All other costs (e.g. manager fees, staff salaries, research costs) are met by the Fund and it is these costs which are the subject of our cost control work programme.
| NEW ZEALAND SUPERANNUATION FUND | ANNUAL REPORT 201486

* Our 2009-2014 Statement of Intent included five-year investment performance measures that are no longer relevant to the Fund, such as benchmarking our performance relative to a Strategic Asset Allocation model. (We no longer use a Strategic Asset Allocation model). In reporting on our investment performance, we have therefore cited the 10-year expected outcomes for Fund performance relative to the Reference Portfolio, Treasury Bill and worst-case downside measures that were set out in our 2013-18 Statement of Intent. The Reference Portfolio was introduced in June 2010.
OUTCOME MEASURES
The Fund’s ultimate outcome is to reduce the tax burden on future New Zealand taxpayers arising from the cost of New Zealand Superannuation. This long-term outcome will begin to be achieved only when the Government starts withdrawals from the Fund in 2029/30 or thereabouts. In the shorter term, we seek to influence that outcome by maximising the Fund’s returns without incurring undue risk.
MEASURE
EXPECTED OUTCOME –
1 YEAR
ACTUAL OUTCOME –
1 YEAR
EXPECTED OUTCOME –
10 YEARS*
ACTUAL OUTCOME –
STARTING JUNE 2010
Reference Portfolio returns relative to Treasury Bills (per annum) +2.5% +16.93% +2.5% p.a. +11.39% p.a.
Actual Portfolio returns relative to Reference Portfolio (after costs) +1.1% -0.11% +1.3% p.a. +3.45% p.a.
Expected worst-case downside return (1st percentile) ≥-31.0% 19.36% ≥-4% p.a. +17.41% p.a.
Our Reference Portfolio and Treasury Bill measures are discussed in full at pages 42-44, and on our website at www.nzsuperfund.co.nz.
The ‘expected worst-case downside return’ is a portfolio volatility measure. It shows the amount of value the Fund could lose in a one-in-100 year event (or, to put it another way, there is a 1% chance of the Fund losing this amount of value or more within the specified time period). If losses of this magnitude were to happen more often than is expected, then either a rarer-than expected event has occurred or we have taken more risk than we assumed we had. For a fuller description of this measure, please refer to page 7 of our 2013-2018 Statement of Intent, which is available on www.nzsuperfund.co.nz.
NEW ZEALAND SUPERANNUATION FUND | ANNUAL REPORT 2014 | 87
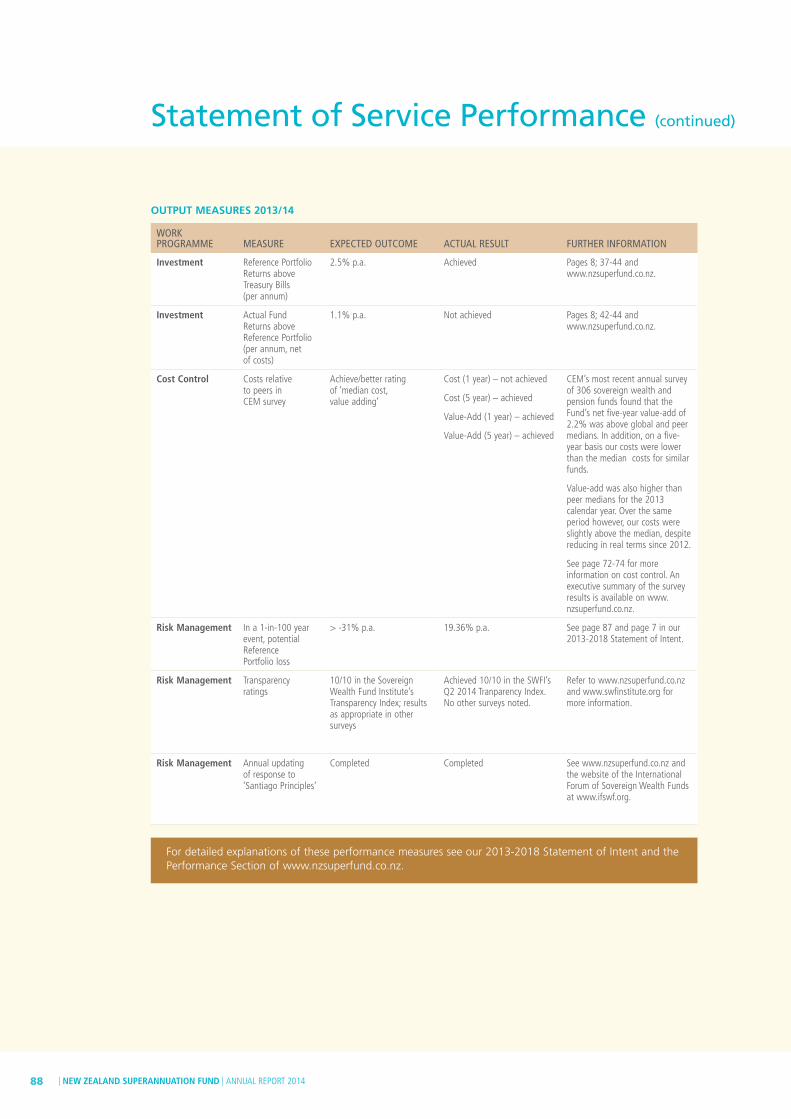
Statement of Service Performance (continued)
OUTPUT MEASURES 2013/14
WORK PROGRAMME MEASURE EXPECTED OUTCOME ACTUAL RESULT FURTHER INFORMATION
Investment Reference Portfolio Returns above Treasury Bills (per annum)
2.5% p.a. Achieved Pages 8; 37-44 and www.nzsuperfund.co.nz.
Investment Actual Fund Returns above Reference Portfolio (per annum, net of costs)
1.1% p.a. Not achieved Pages 8; 42-44 and www.nzsuperfund.co.nz.
Cost Control Costs relative to peers in CEM survey
Achieve/better rating of ‘median cost, value adding’
Cost (1 year) – not achieved
Cost (5 year) – achieved
Value-Add (1 year) – achieved
Value-Add (5 year) – achieved
CEM’s most recent annual survey of 306 sovereign wealth and pension funds found that the Fund’s net five-year value-add of 2.2% was above global and peer medians. In addition, on a five-year basis our costs were lower than the median costs for similar funds.
Value-add was also higher than peer medians for the 2013 calendar year. Over the same period however, our costs were slightly above the median, despite reducing in real terms since 2012.
See page 72-74 for more information on cost control. An executive summary of the survey results is available on www.nzsuperfund.co.nz.
Risk Management In a 1-in-100 year event, potential Reference Portfolio loss
> -31% p.a. 19.36% p.a. See page 87 and page 7 in our 2013-2018 Statement of Intent.
Risk Management Transparency ratings
10/10 in the Sovereign Wealth Fund Institute’s Transparency Index; results as appropriate in other surveys
Achieved 10/10 in the SWFI’s Q2 2014 Tranparency Index. No other surveys noted.
Refer to www.nzsuperfund.co.nz and www.swfinstitute.org for more information.
Risk Management Annual updating of response to ‘Santiago Principles’
Completed Completed See www.nzsuperfund.co.nz and the website of the International Forum of Sovereign Wealth Funds at www.ifswf.org.
For detailed explanations of these performance measures see our 2013-2018 Statement of Intent and the Performance Section of www.nzsuperfund.co.nz.
| NEW ZEALAND SUPERANNUATION FUND | ANNUAL REPORT 201488

WORK PROGRAMME MEASURE EXPECTED OUTCOME ACTUAL RESULT FURTHER INFORMATION
Risk Management UNPRI Assessment over time
Participate in pilot of new UNPRI assessment; establish performance measures for future years
We completed the pilot self-assessment and our RI transparency report is publicly available. As at 30 June 2014, however, the UNPRI had not released benchmarking data from the pilot. This means we have been unable to establish performance measures for future years. We expect to be able to do this in 2014/15.
See www.unpri.org. and www.nzsuperfund.co.nz for more information.
Risk Management Published records of voting, Responsible Investment in Practice Report
Published Six-monthly voting reports to 31/12/13 and 30/6/14 published. RI Report published.
See www.nzsuperfund.co.nz and the Responsible Investment Report at pages 61-67.
Governance Outcome of independent reviews
Ongoing good reviews with the review and our response published
N/A (five-yearly independent review)
The Guardians worked closely over May and June 2014 with the independent reviewer appointed by Treasury. The reviewer’s report and our response were published after balance date and will be reported on in the 2014/15 Statement of Performance. See page 30 for more information.
Organisational capability
Key person risks identified and covered; 3 – 6 month cover in place for all critical roles
Board approval received for our assessment of our key person risks and our plans to mitigate that risk
Achieved See pages 77-79.
Organisational capability
Key performance indicators (KPIs) achieved
Staff members achieve their personal key performance indicators, with the average % achieved and trends from year to year reported in each year’s Annual Report. Any key Strategic Plan activities for the financial year that are not achieved as planned are also reported in the Annual Report.
79% achieved See pages 34-35 for further information on KPI achievement. Note: bonuses are discretionary and involve a mixture of project delivery and behavioural measures.
See page 90 for information on achievement against the key Strategic Plan activities for the year. A broader summary of progress is available at pages 14-15.
NEW ZEALAND SUPERANNUATION FUND | ANNUAL REPORT 2014 | 89

LAUNCH INTERNAL ACTIVE NZ EQUITIES MANDATE
Work programme: Investment; Organisational CapabilityStrategic Plan objective: Best Portfolio
Good progress in transitioning our passive portfolio of listed New Zealand equities to active in-house management was made over the year. The NZ active equities team was appointed; work building the research base was substantially progressed and responsible investment beliefs and processes were integrated into the mandate. See page 80 for more information.
BOARD AND STAFF EDUCATION PROGRAMME
Work programme: Organisational CapabilityStrategic Plan objective: Building and maintaining a great team; Efficiency, Scalability & Innovation
A series of education modules was delivered via a redeveloped Guardians intranet in early 2013/14. Nine further Board education sessions were held. Four of the sessions had external presenters and the balance were presented by management. Six of the seven Board members also attended one or more offshore conferences as part of the Board education programme.
CENTRAL CLEARING IMPLEMENTATION
Work programme: Risk ManagementStrategic Plan objective: Efficiency, Scalability & Innovation
A major project to ensure we can successfully execute trades under the new regulatory framework was successfully completed during the year. See page 69 for more information.
KEY 2013/14 STRATEGIC PLAN ACTIVITIES
In this section, we report on the Guardians’ progress against five specific activities that were highlighted in our 2013-2018 Statement of Intent, and which were key to our Strategic Plan for the 2014/15 year.
RISK ALLOCATION PROCESS REFINEMENT AND ALIGNMENT
Work programme: InvestmentStrategic Plan objective: Best Portfolio
The Risk Allocation Process allows us to rank investment opportunities by attractiveness (expected return, adjusted for confidence and risk) and consistency with the Fund’s investment style (consistency with what is important to us: e.g. our long-term investment horizon, desire to invest as ‘directly’ as possible). In 2013/14, we continued the development of the Risk Allocation Process via the introduction of Risk Budgets, which are discussed further on page 47. Over the course of the year the Fund’s actual portfolio has become more aligned with the way the Risk Allocation Process suggests it should look.
PERFORMANCE SYSTEM IMPLEMENTATION
Work programme: Cost control; RiskStrategic Plan objective: Efficiency, scalability and innovation
The introduction of a new investment performance system, Ortec’s PEARL, was completed during the year. For more information, see page 69.
1 3
245
Statement of Service Performance (continued)
| NEW ZEALAND SUPERANNUATION FUND | ANNUAL REPORT 201490
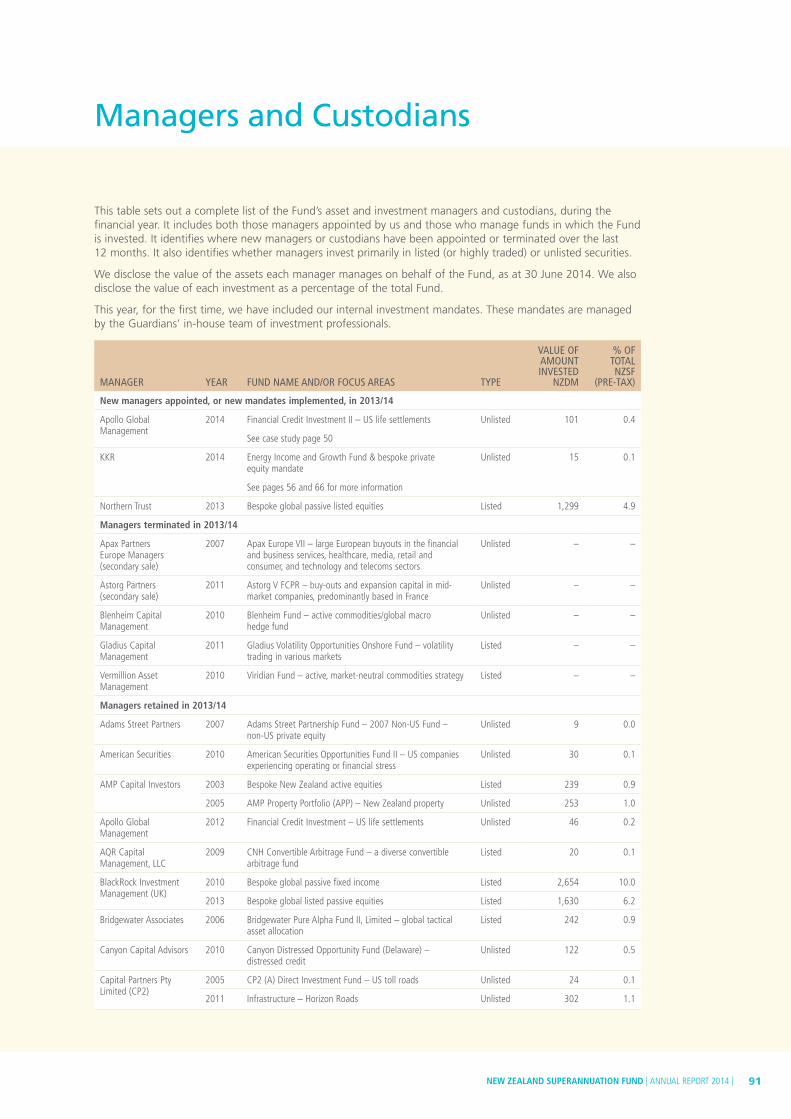
Managers and Custodians
This table sets out a complete list of the Fund’s asset and investment managers and custodians, during the financial year. It includes both those managers appointed by us and those who manage funds in which the Fund is invested. It identifies where new managers or custodians have been appointed or terminated over the last 12 months. It also identifies whether managers invest primarily in listed (or highly traded) or unlisted securities.
We disclose the value of the assets each manager manages on behalf of the Fund, as at 30 June 2014. We also disclose the value of each investment as a percentage of the total Fund.
This year, for the first time, we have included our internal investment mandates. These mandates are managed by the Guardians’ in-house team of investment professionals.
MANAGER YEAR FUND NAME AND/OR FOCUS AREAS TYPE
VALUE OF AMOUNT INVESTED
NZDM
% OF TOTAL NZSF
(PRE-TAX)
New managers appointed, or new mandates implemented, in 2013/14
Apollo Global Management
2014 Financial Credit Investment II – US life settlements
See case study page 50
Unlisted 101 0.4
KKR 2014 Energy Income and Growth Fund & bespoke private equity mandate
See pages 56 and 66 for more information
Unlisted 15 0.1
Northern Trust 2013 Bespoke global passive listed equities Listed 1,299 4.9
Managers terminated in 2013/14
Apax Partners Europe Managers (secondary sale)
2007 Apax Europe VII – large European buyouts in the financial and business services, healthcare, media, retail and consumer, and technology and telecoms sectors
Unlisted – –
Astorg Partners (secondary sale)
2011 Astorg V FCPR – buy-outs and expansion capital in mid-market companies, predominantly based in France
Unlisted – –
Blenheim Capital Management
2010 Blenheim Fund – active commodities/global macro hedge fund
Unlisted – –
Gladius Capital Management
2011 Gladius Volatility Opportunities Onshore Fund – volatility trading in various markets
Listed – –
Vermillion Asset Management
2010 Viridian Fund – active, market-neutral commodities strategy Listed – –
Managers retained in 2013/14
Adams Street Partners 2007 Adams Street Partnership Fund – 2007 Non-US Fund – non-US private equity
Unlisted 9 0.0
American Securities 2010 American Securities Opportunities Fund II – US companies experiencing operating or financial stress
Unlisted 30 0.1
AMP Capital Investors 2003 Bespoke New Zealand active equities Listed 239 0.9
2005 AMP Property Portfolio (APP) – New Zealand property Unlisted 253 1.0
Apollo Global Management
2012 Financial Credit Investment – US life settlements Unlisted 46 0.2
AQR Capital Management, LLC
2009 CNH Convertible Arbitrage Fund – a diverse convertible arbitrage fund
Listed 20 0.1
BlackRock Investment Management (UK)
2010 Bespoke global passive fixed income Listed 2,654 10.0
2013 Bespoke global listed passive equities Listed 1,630 6.2
Bridgewater Associates 2006 Bridgewater Pure Alpha Fund II, Limited – global tactical asset allocation
Listed 242 0.9
Canyon Capital Advisors 2010 Canyon Distressed Opportunity Fund (Delaware) – distressed credit
Unlisted 122 0.5
Capital Partners Pty Limited (CP2)
2005 CP2 (A) Direct Investment Fund – US toll roads Unlisted 24 0.1
2011 Infrastructure – Horizon Roads Unlisted 302 1.1
NEW ZEALAND SUPERANNUATION FUND | ANNUAL REPORT 2014 | 91

MANAGER YEAR FUND NAME AND/OR FOCUS AREAS TYPE
VALUE OF AMOUNT INVESTED
NZDM
% OF TOTAL NZSF
(PRE-TAX)
CITP 2011 China Infrastructure Partners – companies primarily engaged in the development, ownership or operation of infrastructure and related businesses and projects in mainland China, Hong Kong and Macau
Unlisted 32 0.1
Coller Investment Management
2007 Coller International Partners V Fund – global private equity secondaries
Unlisted 10 0.0
Devon Funds Management
2011 Bespoke New Zealand active equities Listed 250 0.9
D.E. Shaw & Co 2012 D.E. Shaw Heliant International Fund – global macro hedge fund
Listed 269 1.0
Direct Capital 2005 Direct Capital Partners III – mid-sized private equity in New Zealand and Australia
Unlisted 7 0.0
2009 Direct Capital Partners IV – mid-sized private New Zealand companies that typically require further capital to continue growing their businesses, expand into Australia, or to assist with ownership succession
Unlisted 26 0.1
2011 Scales Corporation co-investment Listed July 2014
24 0.1
2014 George H Limited co-investment Unlisted 12 0.0
Elementum Advisors 2010 Catastrophe-linked securities Unlisted 57 0.2
FarmRight 2010 Rural land in New Zealand Unlisted 171 0.6
GAW Capital 2010 Gateway Real Estate Fund III – real estate investments in greater China and South-East Asia
Unlisted 41 0.2
Global Forest Partners 2007 Global Timber Investors 8 – timber assets in Australia, New Zealand and South America
Unlisted 83 0.3
2009 & 2012
AIF Properties – Australian timber Unlisted 118 0.4
2010 Global Timber Investors 9 – timber assets in New Zealand, Australia, Asia, Africa and South America
Unlisted 28 0.1
GMO Renewable Resources
2005 Timber assets in New Zealand Unlisted 7 0.0
Hancock Natural Resource Group, Inc
2005 Timber assets in the United States Unlisted 32 0.1
2005 Timber assets in New Zealand Unlisted 5 0.0
HarbourVest Partners 2006 HarbourVest International Private Equity Partnership V Fund – non-US private equity opportunities
Unlisted 48 0.2
Hellman & Friedman 2009 Hellman & Friedman Capital Partners VII (Parallel) – private equity in media, financial services, professional services, software and information services in developed markets
Unlisted 26 0.1
H.I.G. Capital 2010 H.I.G. Bayside Loan Opportunity Fund II (Bayside II) – stressed/distressed senior debt obligations of US and European small-cap companies
Unlisted 25 0.1
JMI Equity 2010 JMI Equity Fund VII – private equity focused on software, internet, business services and healthcare IT companies, predominantly based in US
Unlisted 22 0.1
Kohlberg Kravis Roberts (KKR)
2007 KKR Asian Fund – private equity in Asia, including Australasia Unlisted 27 0.1
2008 KKR 2006 Fund – large and predominantly US private equity buyouts with scope to invest in Europe and Asia-Pacific
Unlisted 55 0.2
Leadenhall Capital Partners
2013 Natural catastrophe reinsurance Unlisted 171 0.6
LSV Asset Management 2005 Emerging markets equities Listed 328 1.2
Managers and Custodians (continued)
| NEW ZEALAND SUPERANNUATION FUND | ANNUAL REPORT 201492
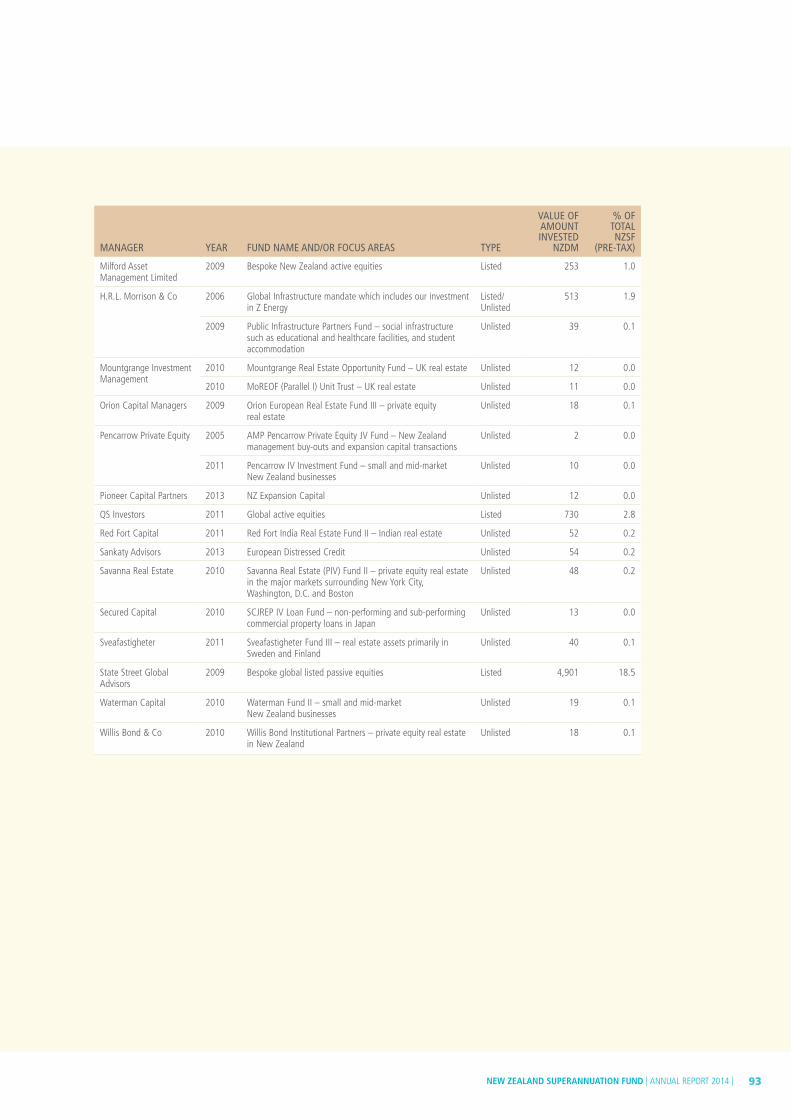
MANAGER YEAR FUND NAME AND/OR FOCUS AREAS TYPE
VALUE OF AMOUNT INVESTED
NZDM
% OF TOTAL NZSF
(PRE-TAX)
Milford Asset Management Limited
2009 Bespoke New Zealand active equities Listed 253 1.0
H.R.L. Morrison & Co 2006 Global Infrastructure mandate which includes our investment in Z Energy
Listed/Unlisted
513 1.9
2009 Public Infrastructure Partners Fund – social infrastructure such as educational and healthcare facilities, and student accommodation
Unlisted 39 0.1
Mountgrange Investment Management
2010 Mountgrange Real Estate Opportunity Fund – UK real estate Unlisted 12 0.0
2010 MoREOF (Parallel I) Unit Trust – UK real estate Unlisted 11 0.0
Orion Capital Managers 2009 Orion European Real Estate Fund III – private equity real estate
Unlisted 18 0.1
Pencarrow Private Equity 2005 AMP Pencarrow Private Equity JV Fund – New Zealand management buy-outs and expansion capital transactions
Unlisted 2 0.0
2011 Pencarrow IV Investment Fund – small and mid-market New Zealand businesses
Unlisted 10 0.0
Pioneer Capital Partners 2013 NZ Expansion Capital Unlisted 12 0.0
QS Investors 2011 Global active equities Listed 730 2.8
Red Fort Capital 2011 Red Fort India Real Estate Fund II – Indian real estate Unlisted 52 0.2
Sankaty Advisors 2013 European Distressed Credit Unlisted 54 0.2
Savanna Real Estate 2010 Savanna Real Estate (PIV) Fund II – private equity real estate in the major markets surrounding New York City, Washington, D.C. and Boston
Unlisted 48 0.2
Secured Capital 2010 SCJREP IV Loan Fund – non-performing and sub-performing commercial property loans in Japan
Unlisted 13 0.0
Sveafastigheter 2011 Sveafastigheter Fund III – real estate assets primarily in Sweden and Finland
Unlisted 40 0.1
State Street Global Advisors
2009 Bespoke global listed passive equities Listed 4,901 18.5
Waterman Capital 2010 Waterman Fund II – small and mid-market New Zealand businesses
Unlisted 19 0.1
Willis Bond & Co 2010 Willis Bond Institutional Partners – private equity real estate in New Zealand
Unlisted 18 0.1
NEW ZEALAND SUPERANNUATION FUND | ANNUAL REPORT 2014 | 93

CUSTODIAN ROLE
Custodians during the financial year
Direct Capital Holding shares in Scales Corporation Limited as custodian
Northern Trust Global Master Custodian for the Fund’s assets
Custodians appointed for a specific purpose during the financial year
Wells Fargo and Bank of New York Mellon Holding collateral associated with our investment in catastrophe-linked securities (including catastrophe bonds)
Euroclear Bank NA/SV Holding collateral required under sale and repurchase (repo) transactions
The New Zealand Guardian Trust Company of New Zealand, the Public Trust and Foundation Corporate Trust
Trustees for holding money relevant to tax pooling arrangements
Managers and Custodians (continued)
SIPSP ComplianceThe Guardians’ Statement of Investment Policies, Standards and Procedures (SIPSP) is published on our website www.nzsuperfund.co.nz. On behalf of the Board and Management of the Guardians of New Zealand Superannuation, we hereby certify that, to the best of our knowledge, the SIPSP has been complied with during the 2013/14 financial year.
GAVIN WALKER, CHAIR
Investment Mandates managed by the Guardians’ in-house team of investment professionals include:
• Active Collateral
• Active NZ Equities
• Cash
• Currency Management
• Direct Arbitrage
• Global Inflation Linked Bonds
• Infrastructure Transition Assets
• Life Settlements
• Portfolio Completion
• Strategic Tilting
• US Transition Assets
• Volatility
ADRIAN ORR, CEO
| NEW ZEALAND SUPERANNUATION FUND | ANNUAL REPORT 201494

Financial Statements
NEW ZEALAND SUPERANNUATION FUND
Statement of Responsibility 96
Statement of Comprehensive Income 97
Statement of Financial Position 98
Statement of Changes in Public Equity 99
Statement of Cash Flows 100
Notes to the Financial Statements 101
Independent Auditor’s Report 171

| NEW ZEALAND SUPERANNUATION FUND | ANNUAL REPORT 201496
NEW ZEALAND SUPERANNUATION FUND
Statement of Responsibility
The Board and management of the Guardians of New Zealand Superannuation accept responsibility for the preparation of the annual financial statements of the New Zealand Superannuation Fund and the judgements used in them.
The Board and management of the Guardians of New Zealand Superannuation accept responsibility for establishing and maintaining a system of internal controls designed to provide reasonable assurance as to the integrity and reliability of financial and non-financial reporting of the New Zealand Superannuation Fund.
In the opinion of the Board and management of the Guardians of New Zealand Superannuation, the annual financial statements for the year ended 30 June 2014 fairly reflect the financial position, operations and cash flows of the New Zealand Superannuation Fund.
GAVIN WALKER, CHAIRMAN ADRIAN ORR, CHIEF EXECUTIVE OFFICER
17 September 2014 17 September 2014

NEW ZEALAND SUPERANNUATION FUND | ANNUAL REPORT 2014 | 97
Statement of Comprehensive Income
For the year ended 30 June 2014 FUND ACTUAL BUDGET
(UNAUDITED)
2014 2013
(RESTATED) 2014
NOTE NZD’000 NZD’000 NZD’000
Interest income 2(a) 234,580 250,565 521,233
Dividend income 399,784 276,102 229,792
Timber sales 58,779 60,441 22,577
Milk sales 29,053 12,935 3,401
Livestock sales 1,170 780 –
Fair value changes in investments held at fair value through profit or loss 3 3,988,299 3,871,071 1,286,041
Net foreign exchange gain/(loss) (207,418) 532,242 –
Fair value changes in forests (35,418) (6,608) –
Fair value changes in livestock 3,411 (2,152) –
Share of profit of investments accounted for using the equity method 6(f) – – 72,222
Net gain on sale of available-for-sale assets – 1,564 –
Other income 8,563 328 –
Net operating income 4,480,803 4,997,268 2,135,266
Operating expenses 2(b) 134,352 168,264 143,616
Profit for the year before income tax expense 4,346,451 4,829,004 1,991,650
Income tax expense 5 1,094,556 1,006,280 483,779
Profit for the year after income tax expense 3,251,895 3,822,724 1,507,871
Other comprehensive income – reclassifiable to profit or loss in subsequent periods
Net fair value gains/(losses) on available-for-sale financial assets (7,369) 15,384 8,316
Other comprehensive income – not reclassifiable to profit or loss in subsequent periods
Gain on revaluation of assets 17,392 526 13,348
Income tax on items of other comprehensive income 5 (372) 2,840 –
Other comprehensive income for the year, net of tax 9,651 18,750 21,664
Total comprehensive income for the year 3,261,546 3,841,474 1,529,535
The attached notes form part of, and should be read in conjunction with, these financial statements.
FINA
NC
IAL STA
TEMEN
TS N
EW ZEA
LAN
D SU
PERA
NN
UA
TION
FUN
D A
ND
GR
OU
P

| NEW ZEALAND SUPERANNUATION FUND | ANNUAL REPORT 201498
NEW ZEALAND SUPERANNUATION FUND
Statement of Financial Position
As at 30 June 2014 FUND ACTUAL BUDGET
(UNAUDITED)
2014 2013
(RESTATED)1 JULY 2012
(RESTATED) 2014
NOTE NZD’000 NZD’000 NZD’000 NZD’000
ASSETS
Cash and cash equivalents 19 3,759,673 5,625,397 2,716,586 2,599,231
Cash pledged as collateral 22 171,204 597,844 502,171 –
Trade and other receivables 8 258,205 114,599 116,727 875,180
Other assets 9 1,143 1,083 1,312 490
Investments
Investments – derivative financial instrument assets 6 1,172,054 713,963 902,769 1,280,288
Investments – other financial assets 6 22,183,319 17,051,534 15,103,045 17,794,435
Other financial assets pledged as collateral 6, 22 57,831 81,935 199,018 –
Investments accounted for using the equity method 6 – – – 935,027
Investments in unconsolidated subsidiaries 6 229,191 100,567 – –
Agricultural assets 6 24,121 55,147 77,877 39,271
Total investments 23,666,516 18,003,146 16,282,709 20,049,021
Assets held for sale 7 – 750 91,075 –
Property, plant and equipment 10 128,449 109,670 83,592 156,911
Intangible assets 11 4,730 3,162 1,239 998
Total assets 27,989,920 24,455,651 19,795,411 23,681,831
LIABILITIES
Cash collateral received 22 577,976 81,419 162,646 –
Trade and other payables 12 781,833 728,183 183,151 109,386
Investments – derivative financial instrument liabilities 6 179,386 653,914 434,646 –
Taxation payable 409,162 248,741 133,326 95,540
Provisions 13 13,613 499 – 26,744
Deferred tax liability 5 203,242 179,733 159,954 168,796
Total liabilities 2,165,212 1,892,489 1,073,723 400,466
Net assets 25,824,708 22,563,162 18,721,688 23,281,365
PUBLIC EQUITY
Retained surplus 10,904,117 7,652,222 3,819,463 8,350,530
Available-for-sale reserve 15,759 23,128 7,744 18,040
Asset revaluation reserve 22,753 5,733 12,402 30,716
Contributed capital 15 14,882,079 14,882,079 14,882,079 14,882,079
Total public equity 25,824,708 22,563,162 18,721,688 23,281,365
The attached notes form part of, and should be read in conjunction with, these financial statements.
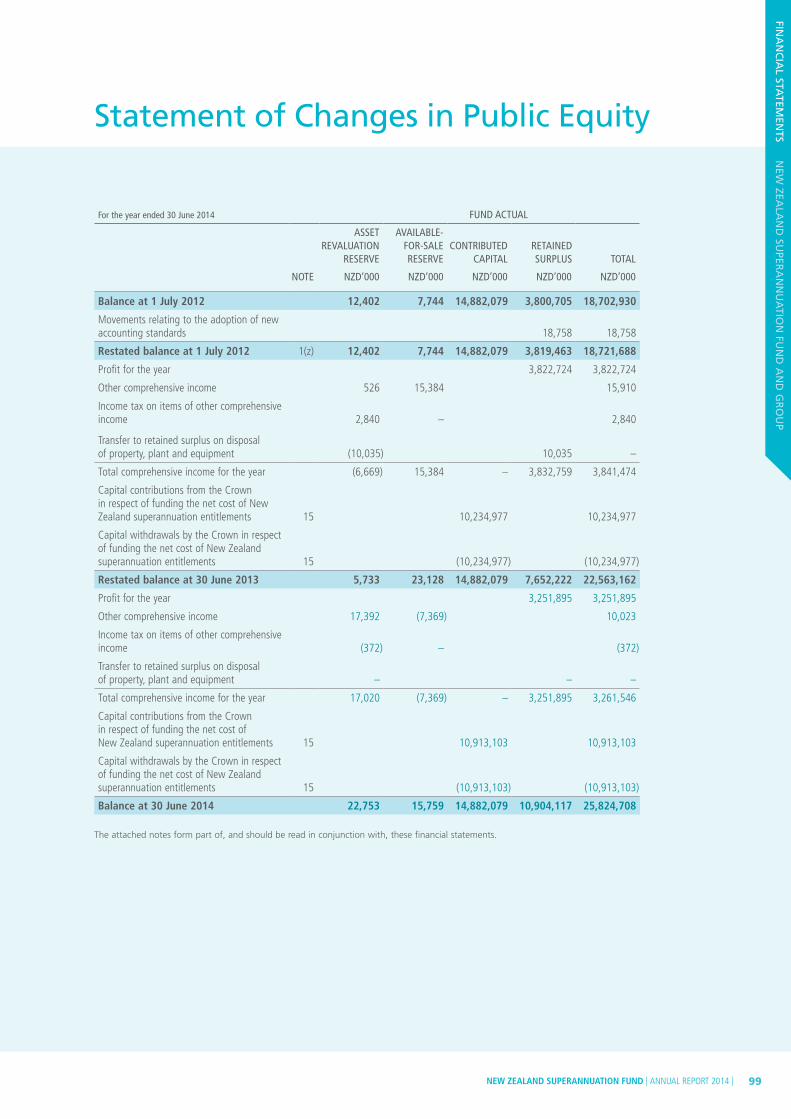
NEW ZEALAND SUPERANNUATION FUND | ANNUAL REPORT 2014 | 99
Statement of Changes in Public Equity
For the year ended 30 June 2014 FUND ACTUAL
ASSET REVALU ATION
RESERVE
AVAILABLE-FOR-SALE RESERVE
CONTRIB UTED CAPITAL
RETAINED SURPLUS TOTAL
NOTE NZD’000 NZD’000 NZD’000 NZD’000 NZD’000
Balance at 1 July 2012 12,402 7,744 14,882,079 3,800,705 18,702,930
Movements relating to the adoption of new accounting standards 18,758 18,758
Restated balance at 1 July 2012 1(z) 12,402 7,744 14,882,079 3,819,463 18,721,688
Profit for the year 3,822,724 3,822,724
Other comprehensive income 526 15,384 15,910
Income tax on items of other comprehensive income 2,840 – 2,840
Transfer to retained surplus on disposal of property, plant and equipment
(10,035) 10,035 –
Total comprehensive income for the year (6,669) 15,384 – 3,832,759 3,841,474
Capital contributions from the Crown in respect of funding the net cost of New Zealand superannuation entitlements 15 10,234,977 10,234,977
Capital withdrawals by the Crown in respect of funding the net cost of New Zealand superannuation entitlements 15 (10,234,977) (10,234,977)
Restated balance at 30 June 2013 5,733 23,128 14,882,079 7,652,222 22,563,162
Profit for the year 3,251,895 3,251,895
Other comprehensive income 17,392 (7,369) 10,023
Income tax on items of other comprehensive income (372) – (372)
Transfer to retained surplus on disposal of property, plant and equipment – – –
Total comprehensive income for the year 17,020 (7,369) – 3,251,895 3,261,546
Capital contributions from the Crown in respect of funding the net cost of New Zealand superannuation entitlements 15 10,913,103 10,913,103
Capital withdrawals by the Crown in respect of funding the net cost of New Zealand superannuation entitlements 15 (10,913,103) (10,913,103)
Balance at 30 June 2014 22,753 15,759 14,882,079 10,904,117 25,824,708
The attached notes form part of, and should be read in conjunction with, these financial statements.
FINA
NC
IAL STA
TEMEN
TS N
EW ZEA
LAN
D SU
PERA
NN
UA
TION
FUN
D A
ND
GR
OU
P

| NEW ZEALAND SUPERANNUATION FUND | ANNUAL REPORT 2014100
NEW ZEALAND SUPERANNUATION FUND
Statement of Cash Flows
For the year ended 30 June 2014 FUND ACTUAL BUDGET
(UNAUDITED)
2014 2013
(RESTATED) 2014
NOTE NZD’000 NZD’000 NZD’000
CASH FLOWS FROM OPERATING ACTIVITIES
Cash was provided from:
Proceeds from sale of investments 21,833,666 26,051,639 42,497,382
Cash collateral received 7,272,432 6,416,211 –
Proceeds from sale of forests – 66,049 –
Proceeds from sale of livestock 1,332 901 –
Dividends received 387,732 271,015 396,163
Interest received 224,804 244,214 492,968
Receipts from customers 95,915 84,398 30,157
Other income 75 23 –
Total cash inflow from operating activities 29,815,956 33,134,450 43,416,670
Cash was applied to:
Purchases of investments (24,008,540) (22,621,787) (42,571,207)
Cash collateral paid (6,573,404) (6,694,166) –
Purchases of forests (954) – –
Purchases of livestock (34) (6,095) –
Managers’ fees (53,365) (33,573) (38,275)
Payments to suppliers (75,317) (82,605) (84,846)
Income tax paid (903,101) (861,156) (748,442)
Goods and Services Tax (4,917) (3,567) –
Total cash outflow from operating activities (31,619,632) (30,302,949) (43,442,770)
Net cash provided by/(used in) operating activities 19(c) (1,803,676) 2,831,501 (26,100)
CASH FLOWS FROM INVESTING ACTIVITIES
Cash was provided from:
Proceeds from sale of property, plant and equipment – 23,505 –
Total cash inflow from investing activities – 23,505 –
Cash was applied to:
Purchases of property, plant and equipment (2,525) (30,094) (56,105)
Purchases of intangible assets (1,154) (1,067) (1,195)
Total cash outflow from investing activities (3,679) (31,161) (57,300)
Net cash provided by/(used in) investing activities (3,679) (7,656) (57,300)
Net increase/(decrease) in cash and cash equivalents (1,807,355) 2,823,845 (83,400)
Cash and cash equivalents at the beginning of the financial year 5,625,397 2,716,586 2,682,631
Effects of exchange rate changes on the balance of cash held in foreign currencies (58,369) 84,966 –
Cash and cash equivalents at the end of the financial year 19(a) 3,759,673 5,625,397 2,599,231
The attached notes form part of, and should be read in conjunction with, these financial statements.

NEW ZEALAND SUPERANNUATION FUND | ANNUAL REPORT 2014 | 101
Notes to the Financial Statements
For the year ended 30 June 2014
1. SUMMARY OF SIGNIFICANT ACCOUNTING POLICIES
GENERAL INFORMATION
These are the financial statements of the New Zealand Superannuation Fund (Fund), a fund created under Section 37 of the New Zealand Superannuation and Retirement Income Act 2001 (Act). This Act commenced on 11 October 2001.
The objective of the Fund is to reduce the tax burden of the cost of New Zealand superannuation for future New Zealand taxpayers.
The Fund is managed and administered by the Guardians of New Zealand Superannuation (Guardians). The Guardians was established as a Crown entity by Section 48 of the Act and became operative from 30 August 2002. The Guardians is expected to manage the Fund in a commercial, prudent fashion comprising:
• best-practice portfolio management;• maximising return without undue risk; and• avoiding prejudice to New Zealand’s reputation
as a responsible member of the world community.
The Fund’s master custodian is the Northern Trust Company.
Under Section 43 of the Act, the Crown is required to make capital contributions to the Fund for investment based on a percentage of Gross Domestic Product (GDP) as set out in the Act. Capital contributions are made by the Crown into the Fund on a fortnightly basis for the purpose of investment and funding the net cost of New Zealand superannuation entitlements. Under Section 44 of the Act, the Crown is entitled to contribute lesser amounts than calculated using the formula under Section 43 of the Act. No capital contributions were received during the current year, other than for superannuation entitlement payments.
The Fund is domiciled in New Zealand and the address of its principal place of business is set out in the Corporate Directory on page 205.
STATEMENT OF COMPLIANCE
The Fund is a profit-oriented entity. The financial statements of the Fund have been prepared in accordance with Generally Accepted Accounting Practice in New Zealand (NZ GAAP). They comply with the New Zealand Equivalents to International Financial Reporting Standards (NZ IFRS), as appropriate for profit-oriented entities. The financial statements also comply with International Financial Reporting Standards (IFRS).
The financial statements for the year ended 30 June 2014 were authorised for issue in accordance with a resolution of the Board of the Guardians of New Zealand Superannuation on 17 September 2014.
BASIS OF PREPARATION
The financial statements have been prepared in accordance with the Act.
The financial statements have been prepared on a fair value basis, except for certain items as detailed in the policies below.
The financial statements are presented in New Zealand dollars and all values are rounded to the nearest thousand dollars (NZD’000), unless stated otherwise.
Accounting policies are selected and applied in a manner which ensures that the resulting financial information satisfies the concepts of relevance and reliability, thereby ensuring that the substance of the underlying transactions or other events is reported.
The Fund meets the definition of an investment entity as defined by NZ IFRS 10 and therefore has applied the exception to not consolidate subsidiaries. As a result, its investments in subsidiaries are measured at fair value through profit and loss.
These separate financial statements are the only financial statements presented by the Fund.
The budget was approved by the Board of the Guardians of New Zealand Superannuation for the year ended 30 June 2014. The budget figures are unaudited.
The Fund has adopted the following new and amended NZ IFRS and interpretations as of 1 July 2013:
(i) NZ IFRS 10 Consolidated Financial Statements;
(ii) NZ IFRS 11 Joint Arrangements;
(iii) NZ IFRS 12 Disclosure of Interests in Other Entities;
(iv) NZ IAS 27 (as amended in 2011) Separate Financial Statements;
(v) NZ IAS 28 (as amended in 2011) Associates and Joint Ventures;
(vi) Amendments to NZ IFRS 10, NZ IFRS 11 and NZ IFRS 12 – Transition Guidance;
(vii) Investment Entities (Amendments to NZ IFRS 10, NZ IFRS 11, NZ IFRS 12 and NZ IAS 27) (early adopted);
(viii) Amendments to NZ IAS 32 Presentation: Offsetting Financial Assets and Financial Liabilities;
(ix) Amendments to NZ IFRS 7 Financial Instruments: Disclosures – Offsetting Financial Assets and Financial Liabilities;
(x) Amendments to NZ IFRS 7 Financial Instruments: Disclosures – Transition Disclosures;
(xi) NZ IFRS 13 Fair Value Measurement;
(xii) Amendments to NZ IFRS’s arising from the Annual Improvements Project (2009-2011).
FINA
NC
IAL STA
TEMEN
TS N
EW ZEA
LAN
D SU
PERA
NN
UA
TION
FUN
D A
ND
GR
OU
P

| NEW ZEALAND SUPERANNUATION FUND | ANNUAL REPORT 2014102
NEW ZEALAND SUPERANNUATION FUND
1. SUMMARY OF SIGNIFICANT ACCOUNTING POLICIES (continued)
NZ IFRS 10 replaces the guidance on control and consolidation contained in NZ IAS 27 Consolidated and Separate Financial Statements and NZ SIC-12 Consolidation – Special Purpose Entities. The objective of NZ IFRS 10 is to establish the principles for the presentation and preparation of consolidated financial statements. It establishes a new control model that applies to all entities and sets out how to apply the principle of control to identify whether an investor controls an investee and therefore must consolidate the investee. It also sets out the accounting requirements for the preparation of consolidated financial statements. The amendments to NZ IFRS 10 define an investment entity and introduce an exception from the consolidation requirements for investment entities.
NZ IFRS 11 replaces NZ IAS 31 Interests in Joint Ventures and introduces a principle based approach for reporting by entities that have an interest in joint arrangements. The focus is no longer on the legal structure of joint arrangements, but rather on the nature of rights and obligations arising from the arrangement when determining how such an arrangement should be classified. Based on the assessment of rights and obligations, a joint arrangement will be classified as either a joint venture or joint operation. Joint ventures are accounted for using the equity method, and the choice to proportionately consolidate is no longer permitted. Parties to a joint operation will account for their share of revenues, expenses, assets and liabilities in much the same way as under NZ IAS 31.
NZ IFRS 12 sets out the disclosure requirements for investments in subsidiaries, associates, joint arrangements and structured entities. It requires entities to disclose significant judgments and assumptions made in determining whether the entity controls, jointly controls, significantly influences or has some other interests in other entities. Entities are also required to provide more disclosures around certain ‘structured entities’. The investment entities’ amendments also introduce new disclosure requirements related to investment entities.
NZ IAS 27 (as amended in 2011) is renamed Separate Financial Statements and is a standard now dealing solely with separate financial statements. The objective of the standard is to prescribe the accounting and disclosure requirements when an entity prepares separate financial statements. The investment entities’ amendments require an investment entity as defined in NZ IFRS 10 to present separate financial statements as its only financial statements in the case where it measures all of its subsidiaries at fair value through profit or loss and to disclose that fact.
NZ IAS 28 (as amended in 2011) prescribes the accounting for investments in associates and joint ventures and sets out the requirements for the application of the equity method when accounting for investments in associates and joint ventures.
On adoption of the above standards and amendments, the Fund has determined that it meets the definition of an investment entity and as a result, it has changed its accounting policy with respect to its investments in subsidiaries, associates and joint ventures. Subsidiaries that were previously consolidated are now accounted for at fair value through profit and loss. In addition associates that were previously equity accounted are now accounted for at fair value through profit and loss. The Fund no longer presents Group financial statements. These changes in accounting policies have been applied retrospectively in accordance with the transition provisions and amendments to NZ IFRS 10 and have resulted in measurement differences in the Statement of Comprehensive Income and Statement of Financial Position.
Amendments to NZ IAS 32 Financial Instruments: Presentation – Offsetting Financial Assets and Financial Liabilities is effective for annual periods beginning on or after 1 January 2014, and these amendments have been early adopted by the Fund. These amendments clarify the offsetting criteria in NZ IAS 32 and address inconsistencies in their application. This includes clarifying the meaning of ‘currently has a legally enforceable right of set-off’ and that some gross settlement systems may be considered equivalent to net settlement. The amendments did not have any impact on the Fund’s financial position or performance.
Amendments to NZ IFRS 7 and the changes made to NZ IFRS’s by the Annual Improvements Project (2009-2011) affect disclosure only.
NZ IFRS 13 establishes a single source of guidance under NZ IFRS for determining the fair value of assets and liabilities. NZ IFRS 13 does not change when an entity is required to use fair value, but rather, provides guidance on how to determine fair value under NZ IFRS when fair value is required or permitted. NZ IFRS 13 also expands the disclosure requirement for all assets and liabilities carried at fair value. As a result of the guidance in NZ IFRS 13, the Fund has re-assessed its policies for measuring fair values. Application of NZ IFRS 13 has not materially impacted the fair value measurements of the Fund. Additional disclosures, where required, are provided in the individual notes relating to the assets and liabilities whose fair values were determined. The adoption of NZ IFRS 13 has not resulted in any significant recognition or measurement differences.
Adoption of these standards and amendments have also impacted on the level of disclosures in the financial statements.
Notes to the Financial Statements (continued)
For the year ended 30 June 2014
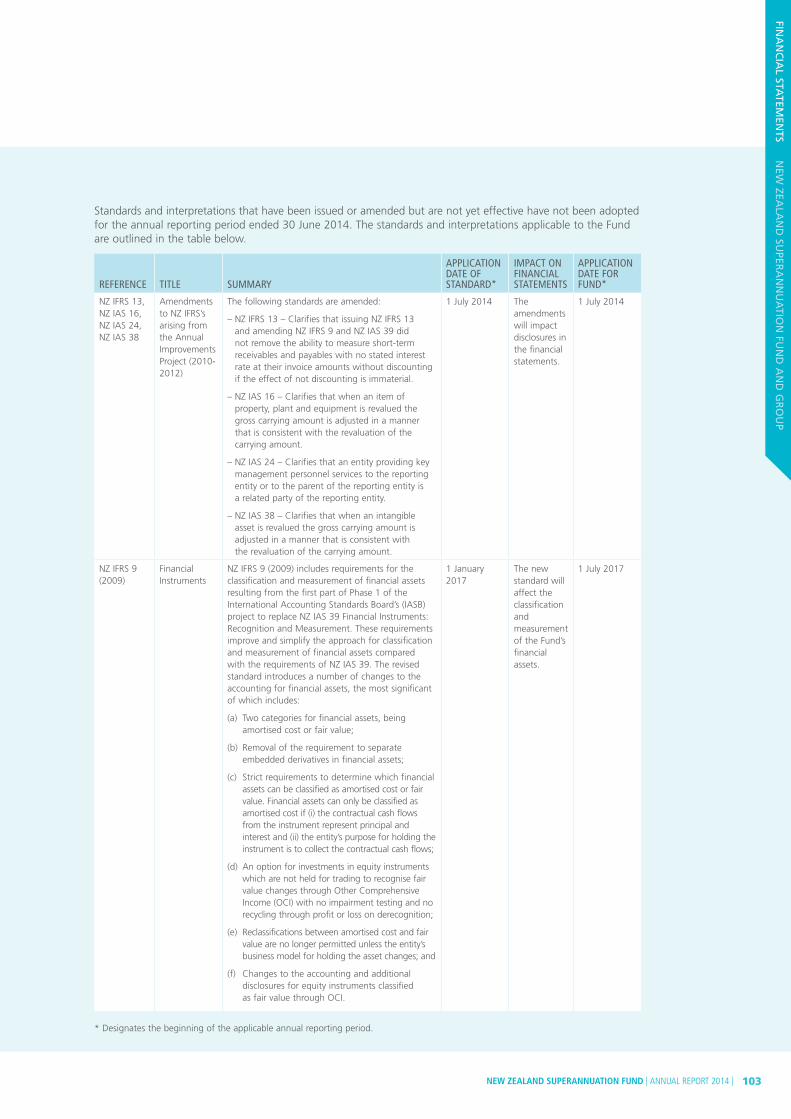
NEW ZEALAND SUPERANNUATION FUND | ANNUAL REPORT 2014 | 103
Standards and interpretations that have been issued or amended but are not yet effective have not been adopted for the annual reporting period ended 30 June 2014. The standards and interpretations applicable to the Fund are outlined in the table below.
REFERENCE TITLE SUMMARY
APPLICATION DATE OF STANDARD*
IMPACT ON FINANCIAL STATEMENTS
APPLICATION DATE FOR FUND*
NZ IFRS 13, NZ IAS 16, NZ IAS 24, NZ IAS 38
Amendments to NZ IFRS’s arising from the Annual Improvements Project (2010-2012)
The following standards are amended:
– NZ IFRS 13 – Clarifies that issuing NZ IFRS 13 and amending NZ IFRS 9 and NZ IAS 39 did not remove the ability to measure short-term receivables and payables with no stated interest rate at their invoice amounts without discounting if the effect of not discounting is immaterial.
– NZ IAS 16 – Clarifies that when an item of property, plant and equipment is revalued the gross carrying amount is adjusted in a manner that is consistent with the revaluation of the carrying amount.
– NZ IAS 24 – Clarifies that an entity providing key management personnel services to the reporting entity or to the parent of the reporting entity is a related party of the reporting entity.
– NZ IAS 38 – Clarifies that when an intangible asset is revalued the gross carrying amount is adjusted in a manner that is consistent with the revaluation of the carrying amount.
1 July 2014 The amendments will impact disclosures in the financial statements.
1 July 2014
NZ IFRS 9 (2009)
Financial Instruments
NZ IFRS 9 (2009) includes requirements for the classification and measurement of financial assets resulting from the first part of Phase 1 of the International Accounting Standards Board’s (IASB) project to replace NZ IAS 39 Financial Instruments: Recognition and Measurement. These requirements improve and simplify the approach for classification and measurement of financial assets compared with the requirements of NZ IAS 39. The revised standard introduces a number of changes to the accounting for financial assets, the most significant of which includes:
(a) Two categories for financial assets, being amortised cost or fair value;
(b) Removal of the requirement to separate embedded derivatives in financial assets;
(c) Strict requirements to determine which financial assets can be classified as amortised cost or fair value. Financial assets can only be classified as amortised cost if (i) the contractual cash flows from the instrument represent principal and interest and (ii) the entity’s purpose for holding the instrument is to collect the contractual cash flows;
(d) An option for investments in equity instruments which are not held for trading to recognise fair value changes through Other Comprehensive Income (OCI) with no impairment testing and no recycling through profit or loss on derecognition;
(e) Reclassifications between amortised cost and fair value are no longer permitted unless the entity’s business model for holding the asset changes; and
(f) Changes to the accounting and additional disclosures for equity instruments classified as fair value through OCI.
1 January 2017
The new standard will affect the classification and measurement of the Fund’s financial assets.
1 July 2017
* Designates the beginning of the applicable annual reporting period.
FINA
NC
IAL STA
TEMEN
TS N
EW ZEA
LAN
D SU
PERA
NN
UA
TION
FUN
D A
ND
GR
OU
P
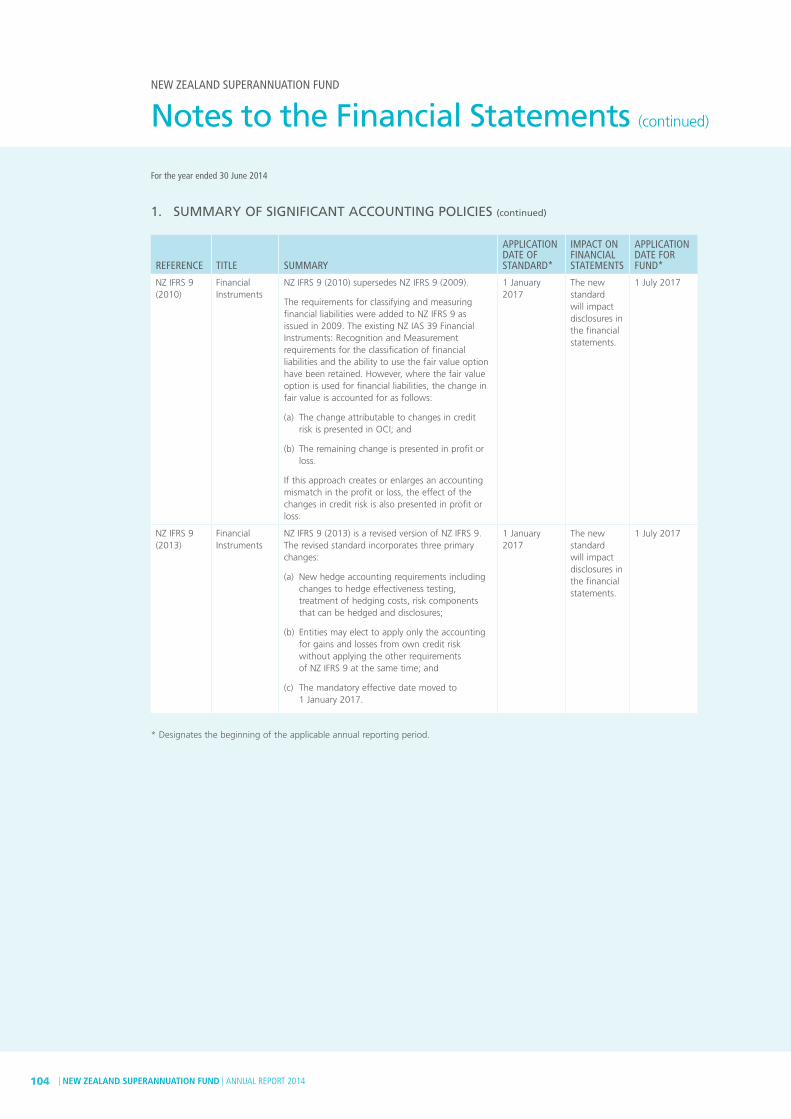
| NEW ZEALAND SUPERANNUATION FUND | ANNUAL REPORT 2014104
NEW ZEALAND SUPERANNUATION FUND
REFERENCE TITLE SUMMARY
APPLICATION DATE OF STANDARD*
IMPACT ON FINANCIAL STATEMENTS
APPLICATION DATE FOR FUND*
NZ IFRS 9 (2010)
Financial Instruments
NZ IFRS 9 (2010) supersedes NZ IFRS 9 (2009).
The requirements for classifying and measuring financial liabilities were added to NZ IFRS 9 as issued in 2009. The existing NZ IAS 39 Financial Instruments: Recognition and Measurement requirements for the classification of financial liabilities and the ability to use the fair value option have been retained. However, where the fair value option is used for financial liabilities, the change in fair value is accounted for as follows:
(a) The change attributable to changes in credit risk is presented in OCI; and
(b) The remaining change is presented in profit or loss.
If this approach creates or enlarges an accounting mismatch in the profit or loss, the effect of the changes in credit risk is also presented in profit or loss.
1 January 2017
The new standard will impact disclosures in the financial statements.
1 July 2017
NZ IFRS 9 (2013)
Financial Instruments
NZ IFRS 9 (2013) is a revised version of NZ IFRS 9. The revised standard incorporates three primary changes:
(a) New hedge accounting requirements including changes to hedge effectiveness testing, treatment of hedging costs, risk components that can be hedged and disclosures;
(b) Entities may elect to apply only the accounting for gains and losses from own credit risk without applying the other requirements of NZ IFRS 9 at the same time; and
(c) The mandatory effective date moved to 1 January 2017.
1 January 2017
The new standard will impact disclosures in the financial statements.
1 July 2017
* Designates the beginning of the applicable annual reporting period.
1. SUMMARY OF SIGNIFICANT ACCOUNTING POLICIES (continued)
Notes to the Financial Statements (continued)
For the year ended 30 June 2014

NEW ZEALAND SUPERANNUATION FUND | ANNUAL REPORT 2014 | 105
The following particular accounting policies which materially affect the preparation of the financial statements have been applied:
(a) Capital contributions
FUND CAPITAL CONTRIBUTIONS
The Crown is required to make capital contributions to the Fund in accordance with Sections 42 to 44 inclusive of the Act. Capital contributions are made by the Crown to the Fund for investment and for the purpose of contribution to the net cost of paying superannuation entitlements after 2020. These capital contributions are recorded in the Statement of Changes in Public Equity.
SUPERANNUATION ENTITLEMENT PAYMENTS
The Minister of Finance, under Section 45 of the Act, must ensure that sufficient money is transferred to the Fund in each year to meet the net cost of superannuation entitlements. These transfers are treated as capital contributions from the Crown in respect of funding the net cost of superannuation entitlements and are offset by capital withdrawals and recorded in the Statement of Changes in Public Equity.
(b) Capital withdrawals
FUND CAPITAL WITHDRAWALS
In terms of Section 47 of the Act, no withdrawals of Fund capital contributions are permitted prior to 30 June 2020.
SUPERANNUATION ENTITLEMENT PAYMENTS
The net cost of superannuation entitlements is treated as capital withdrawals by the Crown in respect of funding the net cost of superannuation entitlements and is recorded in the Statement of Changes in Public Equity. These amounts equate to the associated capital contributions.
The payment of superannuation entitlements is an expense of the Crown and is recorded separately in the Crown’s financial statements.
(c) Income tax In accordance with Section HR 4B of the Income
Tax Act 2007, the income derived by the Fund is subject to New Zealand tax determined by using the rules applying to companies.
The income tax expense recognised for the year is based on the accounting surplus, adjusted for permanent differences between accounting and tax rules.
Current tax is calculated by reference to the amount of taxes payable or recoverable in respect of the taxable profit or tax loss for the year. It is calculated using tax rates and tax laws that have been enacted or substantively enacted at balance date. Current tax for current and prior periods is recognised as a liability (or asset) to the extent that it is unpaid (or refundable).
Deferred income tax is provided on all temporary differences at balance date between the tax bases of assets and liabilities and their carrying amounts for financial reporting purposes.
Deferred income tax liabilities are recognised for all taxable temporary differences:
(i) except for a deferred income tax liability arising from the initial recognition of goodwill;
(ii) except where the deferred income tax liability arises from the initial recognition of an asset or liability in a transaction that is not a business combination and, at the time of the transaction, affects neither the accounting profit or loss nor taxable profit or loss; and
(iii) in respect of taxable temporary differences associated with investments in subsidiaries, associates and interests in joint ventures, except where the timing of the reversal of the temporary differences can be controlled and it is probable that the temporary differences will not reverse in the foreseeable future.
Deferred income tax assets are recognised for all deductible temporary differences, carry-forward of unused tax assets and unused tax losses to the extent that it is probable that taxable profit will be available against which the deductible temporary differences, the carry-forward of unused tax assets and unused tax losses can be utilised:
(i) except where the deferred income tax asset relating to the deductible temporary difference arises from the initial recognition of an asset or liability in a transaction that is not a business combination and, at the time of the transaction, affects neither the accounting profit or loss nor taxable profit or loss; and
FINA
NC
IAL STA
TEMEN
TS N
EW ZEA
LAN
D SU
PERA
NN
UA
TION
FUN
D A
ND
GR
OU
P

| NEW ZEALAND SUPERANNUATION FUND | ANNUAL REPORT 2014106
NEW ZEALAND SUPERANNUATION FUND
1. SUMMARY OF SIGNIFICANT ACCOUNTING POLICIES (continued)
(c) Income tax (continued)
(ii) in respect of deductible temporary differences associated with investments in subsidiaries, associates and interests in joint ventures, except that deferred tax assets are only recognised to the extent which it is probable that the temporary differences will reverse in the foreseeable future and taxable profit will be available against which the temporary differences can be utilised.
The carrying amount of deferred income tax assets is reviewed at each balance sheet date and reduced to the extent that it is no longer probable that sufficient taxable profit will be available to allow all or part of the deferred income tax asset to be utilised.
Deferred income tax assets and liabilities are measured at the tax rates that are expected to apply to the year when the asset is realised or the liability is settled, based on tax rates (and tax laws) which have been enacted or substantively enacted at balance date. The measurement of deferred tax liabilities and assets reflects the tax consequences that would follow from the manner in which the Fund expects, at the reporting date, to recover or settle the carrying amount of its assets and liabilities.
Deferred tax assets and liabilities are offset when they relate to income taxes levied by the same taxation authority and the Fund intends to settle its current tax assets and liabilities on a net basis.
Income tax relating to items of other comprehensive income is recognised in other comprehensive income.
(d) Financial instruments The Fund is party to financial instruments as
part of its normal operations. These financial instruments include cash and cash equivalents, derivatives, investments (excluding agricultural assets), receivables and payables. All financial instruments are recognised in the Statement of Financial Position and all revenues and expenses in relation to financial instruments are recognised in the Statement of Comprehensive Income.
Financial assets and financial liabilities are recognised in the Statement of Financial Position when the Fund becomes a party to the contractual provisions of the instrument. Purchases or sales of financial instruments that require delivery within the time frame generally established by regulation or convention in the marketplace are recognised on the trade date, i.e. the date which the Fund commits to purchase or sell the instrument. Derivatives are recognised on a trade date basis. The Fund offsets financial assets and financial liabilities when it has a current legally enforceable right to set off the recognised amounts and interests and intends to settle on a net basis.
Financial assets are derecognised when the rights to receive cash flows from the investments have expired or the Fund has transferred substantially all of the risks and rewards or ownership. The Fund derecognises a financial liability when the obligation under the liability is discharged, cancelled or has expired.
The Fund classifies its financial assets and financial liabilities into the following categories:
FINANCIAL ASSETS AND FINANCIAL LIABILITIES AT FAIR VALUE THROUGH PROFIT OR LOSS
Held for trading All derivatives are classified as held for trading.
Fair value through profit or loss upon initial recognition
These include equity securities, other equity interests and debt instruments. These financial assets are designated upon initial recognition on the basis that they are part of a group of financial assets which are managed and have their performance evaluated on a fair value basis, in accordance with the risk management and investment strategies of the Fund.
AVAILABLE-FOR-SALE
These are unquoted equity instruments where fair value cannot be reliably measured, or where the instrument is not managed on a fair value basis.
LOANS AND RECEIVABLES
Loans and receivables are non-derivative financial assets with fixed or determinable payments that are not quoted in an active market. The Fund includes in this category amounts relating to cash, reverse repurchase agreements, cash pledged as collateral, unquoted debt instruments and other short-term receivables.
Notes to the Financial Statements (continued)
For the year ended 30 June 2014
NEW ZEALAND SUPERANNUATION FUND | ANNUAL REPORT 2014 | 107
FINANCIAL LIABILITIES AT AMORTISED COST
This category includes all non-derivative financial liabilities. The Fund includes in this category amounts relating to cash collateral received, repurchase agreements and other short-term payables.
(e) Investments Investments are represented by the following:
• Financial instruments at fair value through KEY profit or loss (either designated at fair value through profit or loss or held for trading):
– Equities (i)
– Fixed income securities (ii)
– Derivatives (iii)
– Collective investment funds (iv)
– Certain private equity investments (v)
– Unlisted unit trusts (vi)
– Insurance-linked investments (vii)
– Unlisted debt instruments (viii)
• Available-for-sale financial instruments:
– Certain private equity investments (ix)
– Other available-for-sale investments (x)
• Loans and receivables: unlisted debt (xi) instruments
• Agricultural assets – forests and livestock (refer accounting policies (k) and (l))
FINANCIAL INSTRUMENTS AT FAIR VALUE THROUGH PROFIT OR LOSS
Initial recording Financial instrument investments at fair value
through profit or loss are initially recognised at fair value on a trade date basis. Transaction costs, e.g. trading commission, are expensed immediately in the Statement of Comprehensive Income.
Subsequent measurement Subsequent to initial recognition, these
investments are recorded at fair value and are classified into the category ‘at fair value through profit or loss’. The Guardians manages and evaluates the performance of these investments on a fair value basis in accordance with the Fund’s investment strategy and information about the investments is provided internally on this basis to the Guardians’ key management personnel. Changes in fair value are recognised in profit or loss in the Statement of Comprehensive Income.
Determination of fair value Fair value is an estimate of the price that
would be received to sell an asset in an orderly transaction between market participants at the measurement date. Fair value is determined as follows:
(i) Listed equities are valued at the last quoted bid price on the relevant exchange as of the close of business at balance date. The bid price is representative of fair value.
(ii) Highly liquid fixed income securities and equity-linked notes are valued at the last quoted bid price by a reputable pricing vendor or broker as of the close of business at balance date. The bid price is representative of fair value. Where the market for fixed income securities is illiquid, prices are determined by a reputable pricing vendor who uses models to value these securities. The models can utilise a variety of inputs including loan level data, prepayment and default assumptions and benchmark prices for similar securities. Because of the inherent uncertainty of valuation, it is possible that those values estimated for the illiquid securities may differ from those which would have been used had a ready market for those securities existed and those differences may be significant.
(iii) Fair value for derivatives is outlined under ‘Derivatives’ below.
(iv) Investments in collective investment funds (unlisted investment funds) are valued at the last price of the unit or security as provided by the administrators at balance date. The price is based on the fair value of the underlying net assets or securities of the relevant collective investment fund.
(v) Certain private equity investments (unlisted investment funds and unlisted equity investments), which are designated at fair value through profit or loss, are valued at the last quoted price of the unit or security as provided by the investment managers or administrators at balance date. The price is based on the fair value of underlying net assets of the private equity investment. Fair value is determined using a variety of methods, including independent valuations, valuation models based on the price of recent investments, earnings multiples or discounted cash flows. Certain private equity investments are classified as available-for-sale. The accounting policy for these investments is outlined under (ix).
FINA
NC
IAL STA
TEMEN
TS N
EW ZEA
LAN
D SU
PERA
NN
UA
TION
FUN
D A
ND
GR
OU
P

| NEW ZEALAND SUPERANNUATION FUND | ANNUAL REPORT 2014108
NEW ZEALAND SUPERANNUATION FUND
1. SUMMARY OF SIGNIFICANT ACCOUNTING POLICIES (continued)
(e) Investments (continued)
(vi) Investments in unlisted unit trusts are valued at the last bid price of the unit or security as provided by the administrators at balance date. The bid price is representative of fair value. The price is based on the fair value of the underlying net assets or securities of the relevant unlisted unit trust.
(vii) Insurance-linked investments which are catastrophe bonds are valued using prices provided by reputable pricing vendors or brokers.
(viii) Unlisted debt instruments including fixed and floating rate instruments that form part of an investment into a private equity investment may be designated at fair value through profit or loss. These assets are valued by a suitably qualified independent valuer who ascribes an enterprise value to the entire private equity investment and apportions that value across the instruments held, including the debt instruments. Any unlisted debt instruments that are not designated at fair value through profit or loss are classified as loans and receivables and are carried at amortised cost. Refer to (xi) below.
AVAILABLE-FOR-SALE FINANCIAL INSTRUMENTS
(ix) Certain private equity investments that do not have a quoted market price in an active market and whose fair value cannot be reliably measured using the valuation methods outlined in (v) above are classified as available-for-sale and are measured at cost less impairment. Transaction costs are included in the cost of the investment. Management has determined that fair value for these investments cannot be reliably measured where the entity’s financial statements have not been prepared under either IFRS or a recognised and reliable accounting basis such as US GAAP. Subsequently, where the fair value of these investments becomes able to be reliably measured, the investment will be measured at fair value with gains or losses being recognised in other comprehensive income (reserves) until the investment is derecognised or until the investment is determined to be impaired, at which time the cumulative gain or loss previously reported in reserves is reclassified to profit or loss in the Statement of Comprehensive Income.
(x) Other available-for-sale investments include investments in cooperative and processing companies. The Fund is required to hold these investments to facilitate farming investment operations. As such, the Fund is normally unable to sell these investments without disrupting farming investment operations. These available-for-sale investments are valued at fair value with gains or losses being recognised in other comprehensive income (reserves) until the investment is derecognised or until the investment is determined to be impaired, at which time the cumulative gain or loss previously reported in reserves is reclassified to profit or loss in the Statement of Comprehensive Income.
LOANS AND RECEIVABLES (xi) Unlisted debt instruments, including fixed
and floating rate notes and redeemable preference shares, are non-derivative financial assets with fixed or determinable payments that are not quoted on an active market. Where such assets are not designated at fair value through profit or loss, these assets are carried at amortised cost using the effective interest rate method. Gains and losses are recognised in profit or loss when the loans and receivables are derecognised or impaired.
IMPAIRMENT OF FINANCIAL INSTRUMENTS The Fund assesses, at each reporting date,
whether there is any objective evidence that a financial asset or a group of financial assets is impaired. A financial asset or a group of financial assets is deemed to be impaired if, and only if, there is objective evidence of impairment as a result of one or more events that have occurred after the initial recognition of the asset (an ‘incurred loss event’) and that loss event (or events) has an impact on the estimated future cash flows of the financial asset or the group of financial assets that can be reliably estimated.
DERIVATIVES The Fund enters into a variety of derivative
financial instruments to manage its exposure to foreign currency risk and interest rate risk and to achieve exposure to assets and asset classes. The use of derivatives is governed by the Fund’s Statement of Investment Policies, Standards and Procedures as approved by the Guardians, which provides written principles on the use of derivatives by the Fund.
Notes to the Financial Statements (continued)
For the year ended 30 June 2014
NEW ZEALAND SUPERANNUATION FUND | ANNUAL REPORT 2014 | 109
The fair value of forward foreign exchange contracts is calculated by reference to current forward exchange rates for contracts with similar maturity profiles.
The fair value of cross currency swaps is determined using a discounted cash flow model.
The fair value of asset swaps is determined using a model, with the key inputs being interest rates and the pricing of inflation futures.
The fair value of interest rate swaps is determined using a model, with the key input being interest rates.
The fair value of credit default swaps is determined using a discounted cash flow model that incorporates default rate and credit spread assumptions for the reference entity or index.
The fair value of volatility swaps is determined using a discounted cash flow model with the key input being the volatility curve.
The fair value of futures contracts is calculated as the present value of the difference between the contract price and the closing price reported on the primary exchange of the futures contract.
The fair value of index or total return swaps (commodity, equity, bond, real estate and longevity contingent swaps) is provided by the counterparty and is calculated by reference to the movement in the underlying index or basket of securities or other contracts. Index swaps are settled net in cash.
The fair value of insurance-linked swaps is calculated using a model that incorporates the premium paid or received and a price provided by reputable pricing vendors or brokers. Premiums are recognised based on a risk dissipation schedule, derived from third party catastrophe models.
The fair value of exchange-traded insurance-linked options is the closing price as reported by the primary exchange of the contract.
The fair value of other ‘over-the-counter’ (OTC) swaps is determined using a model, with the key inputs being the expected future cash flows under the swap contract.
The fair value of options is calculated using a Black-Scholes option valuation model or, where the option is traded on an exchange, the exchange price is used to value the option.
‘DAY 1’ GAINS AND LOSSES When the transaction price is different to the
fair value from other observable current market transactions in the same instrument or based on a valuation technique whose variables include only data from observable markets, the Fund immediately recognises the difference between the transaction price and fair value (a ‘day 1’ gain or loss) in profit or loss in the Statement of Comprehensive Income. In cases where the fair value is determined using data that is not observable, the difference between the transaction price and the model value is recognised on a systematic basis over the expected life of the instrument.
(f) Repurchase and reverse repurchase agreements
Securities sold under agreement to repurchase at a fixed price or at the sale price plus a lender’s return at a specified future date are not derecognised from the Statement of Financial Position as the Fund retains substantially all the risks and rewards of ownership. The corresponding cash received is recognised in the Statement of Financial Position as an asset with a corresponding obligation to return it, including accrued interest as a liability, reflecting the transaction’s economic substance as a loan to the Fund. The difference between the sale and repurchase prices is treated as interest expense and is accrued over the life of the agreement using the effective interest rate.
Conversely, securities purchased under agreements to resell at a specified future date are not recognised in the Statement of Financial Position. The consideration paid, including accrued interest, is recorded separately in the Statement of Financial Position as an investment, reflecting the transaction’s economic substance as a loan by the Fund. The difference between the purchase and resale prices is recorded in interest income and is accrued over the life of the agreement using the effective interest rate.
FINA
NC
IAL STA
TEMEN
TS N
EW ZEA
LAN
D SU
PERA
NN
UA
TION
FUN
D A
ND
GR
OU
P

| NEW ZEALAND SUPERANNUATION FUND | ANNUAL REPORT 2014110
NEW ZEALAND SUPERANNUATION FUND
1. SUMMARY OF SIGNIFICANT ACCOUNTING POLICIES (continued)
(g) Investment entity The Fund meets the definition of an investment
entity as the following conditions exist:
• The Fund obtains and manages funds for the purpose of providing its investor with investment management services;
• The Fund has committed to its investor that its business purpose is to invest funds solely for returns from capital appreciation and investment income;
• The Fund measures and evaluates the performance of substantially all of its investments on a fair value basis;
• The Fund has more than one investment; and• The Fund has documented exit strategies for
its investments.
Although the Fund does not meet all of the typical characteristics of an investment entity (namely, the Fund does not have multiple investors, its investor is not an unrelated party and it does not have ownership interests in the form of equity), management believe the Fund is an investment entity because it has been specifically established as an investment vehicle; it has a diversified investment portfolio with best practice investment policies and procedures in place; it invests funds for the purpose of maximising returns; and has elected to fair value the majority of its investments where feasible for the purposes of its financial statements.
(h) Subsidiaries Subsidiaries are those entities (including
structured entities) that are controlled by the Fund. The Fund controls an entity when it is exposed to, or has rights to, variable returns from its involvement with the entity and has the ability to affect those returns through its power to direct the activities of the entity. The Fund re-assesses whether or not it controls an entity if facts and circumstances indicate that there are changes to one or more of the elements of control.
The Fund’s subsidiaries are measured at fair value through profit and loss in accordance with NZ IAS 39 Financial Instruments: Recognition and Measurement.
(i) Investments in associates An associate is an entity over which the Fund is
in a position to exercise significant influence, but not control or joint control, through participation in the financial and operating policy decisions of the entity.
The Fund’s investments in associates are measured at fair value through profit and loss in accordance with NZ IAS 39 Financial Instruments: Recognition and Measurement.
(j) Investments in joint arrangements A joint arrangement is a contractual arrangement
whereby the Guardians and other parties undertake an economic activity that is subject to joint control. Joint control is the contractually agreed sharing of control of an arrangement, which exists only when decisions about the relevant activities require the unanimous consent of the parties sharing control.
A joint operation is a type of joint arrangement whereby the parties that have joint control of the arrangement have rights to the assets, and obligations for the liabilities, relating to the arrangement. The Fund does not have any interests in joint operations.
A joint venture is a type of joint arrangement whereby the parties that have joint control of the arrangement have rights to the net assets of the joint venture.
The considerations made in determining joint control are similar to those necessary to determine control over subsidiaries.
The Fund’s investments in joint ventures are measured at fair value through profit and loss in accordance with NZ IAS 39: Financial Instruments: Recognition and Measurement.
(k) Forests Forest assets are predominantly standing trees.
These are recognised in the Statement of Financial Position at fair value less estimated point-of-sale costs. The costs to establish and maintain the forest assets are included in profit or loss in the Statement of Comprehensive Income, together with the change in fair value for each accounting period.
The valuation of forest assets is based on discounted cash flow models. The annual harvest from forecast tree growth is multiplied by expected wood prices and the costs associated with forest management, harvesting and distribution are then deducted to derive annual cash flows.
The fair value of the forest assets is measured as the present value of cash flows from one growth cycle based on productive forest land, taking into consideration environmental, operational and market restrictions. Forests are valued separately from the underlying freehold land. Further details on the valuation basis are set out in note 6(g).
Notes to the Financial Statements (continued)
For the year ended 30 June 2014

NEW ZEALAND SUPERANNUATION FUND | ANNUAL REPORT 2014 | 111
(l) Livestock Livestock is recorded at fair value less estimated
point-of-sale costs.
Changes in the value of livestock are recognised in profit or loss in the Statement of Comprehensive Income.
Further details on the valuation basis are set out in note 6(h).
(m) Inventory All inventory items are stated at the lower of cost
or net realisable value at balance date. The cost of agricultural produce transferred into inventory is measured at its fair value less estimated point-of-sale costs at the date of harvest. The net realisable value represents the estimated selling price of inventories less all estimated costs of completion and costs necessary to make the sale.
(n) Receivables Short-term receivables are initially recorded at fair
value, then subsequently at amortised cost using the effective interest rate less any impairment.
(o) Property, plant and equipment
INITIAL RECORDING All items of property, plant and equipment are
initially recognised at cost. Cost includes the value of consideration exchanged and those expenses directly attributable to bringing the item to working condition for its intended use.
SUBSEQUENT MEASUREMENT Subsequent to initial recognition, plant and
machinery, office equipment, computer equipment, motor vehicles and office fit-outs are stated at cost less accumulated depreciation and any impairment in value.
Land, land improvements and buildings are measured at fair value less accumulated depreciation on land improvements and buildings and any impairment losses recognised after the date of revaluation. Fair value is determined on the basis of an independent valuation prepared by external valuation experts, based on discounted cash flows or capitalisation of net income (as appropriate).
Any revaluation increase arising on the revaluation of land, land improvements and buildings is credited to the asset revaluation reserve, except to the extent that it reverses a revaluation decrease for the same asset previously recognised as an expense in profit or loss, in which case the increase is credited to profit or loss to the extent of the decrease previously charged.
A decrease in carrying amount arising on the revaluation of land, land improvements and buildings is charged as an expense in profit or loss to the extent that it exceeds the balance, if any, held in the asset revaluation reserve relating to a previous revaluation of that asset.
Independent valuations of land, land improvements and buildings are performed with sufficient regularity (at least every three years) to ensure that the carrying amount does not differ materially from the asset’s fair value at balance date.
DISPOSAL An item of property, plant and equipment is
derecognised upon disposal or when no future economic benefits are expected to arise from the continued use of the asset.
Upon disposal, any revaluation reserve relating to the particular asset being sold is transferred to retained surplus.
Any gain or loss arising on derecognition of the asset (calculated as the difference between the net disposal proceeds and the carrying amount of an item) is included in profit or loss in the year in which the item is derecognised.
IMPAIRMENT All items of property, plant and equipment are
assessed for indicators of impairment at each balance date. If any indication of impairment exists, an estimate of the asset’s recoverable amount is calculated.
Where the carrying amount is assessed to be greater than its recoverable amount, the item is written down to its recoverable amount. The write-down is recognised in profit or loss in the Statement of Comprehensive Income unless it relates to land and buildings, in which case it is treated as a revaluation decrease.
Where an impairment loss subsequently reverses, the carrying amount of the item is increased to the revised estimate of its recoverable amount, but only to the extent that the increased carrying amount does not exceed the carrying amount which would have been determined had no impairment loss been recognised for the item in prior years. A reversal of an impairment loss is recognised in the Statement of Comprehensive Income immediately unless it relates to land and buildings, in which case it is treated as a revaluation increase.
FINA
NC
IAL STA
TEMEN
TS N
EW ZEA
LAN
D SU
PERA
NN
UA
TION
FUN
D A
ND
GR
OU
P
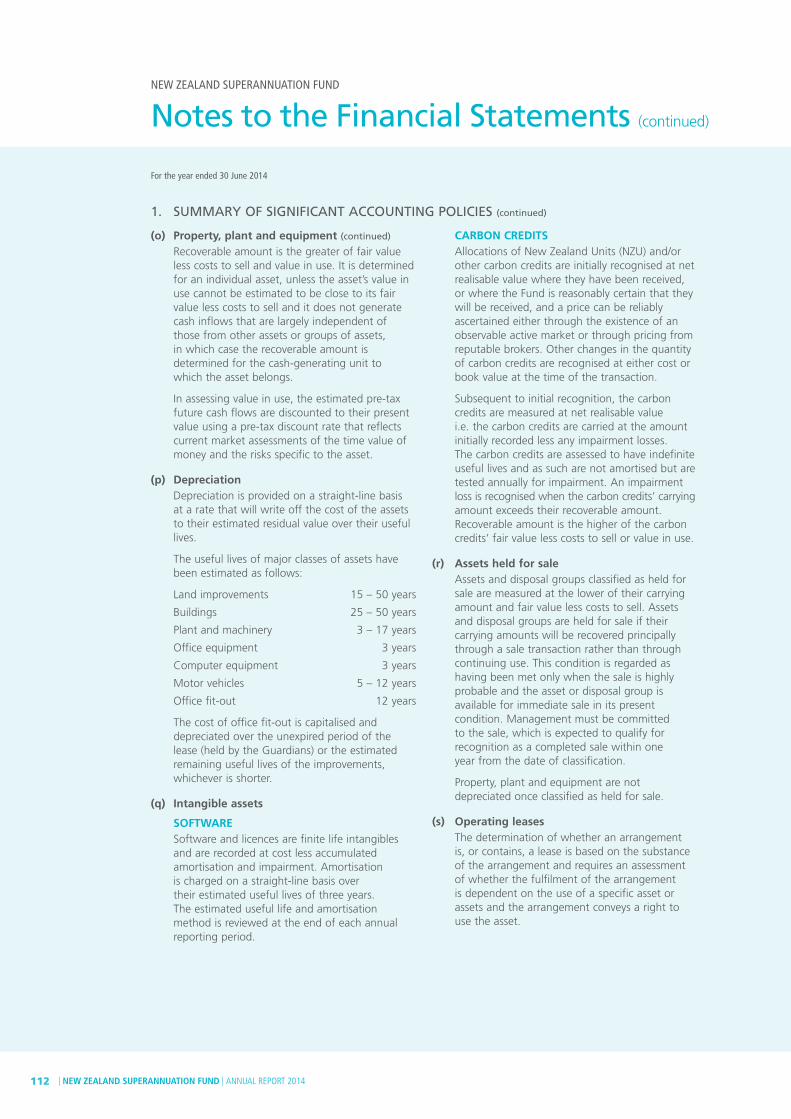
| NEW ZEALAND SUPERANNUATION FUND | ANNUAL REPORT 2014112
NEW ZEALAND SUPERANNUATION FUND
1. SUMMARY OF SIGNIFICANT ACCOUNTING POLICIES (continued)
(o) Property, plant and equipment (continued)
Recoverable amount is the greater of fair value less costs to sell and value in use. It is determined for an individual asset, unless the asset’s value in use cannot be estimated to be close to its fair value less costs to sell and it does not generate cash inflows that are largely independent of those from other assets or groups of assets, in which case the recoverable amount is determined for the cash-generating unit to which the asset belongs.
In assessing value in use, the estimated pre-tax future cash flows are discounted to their present value using a pre-tax discount rate that reflects current market assessments of the time value of money and the risks specific to the asset.
(p) Depreciation Depreciation is provided on a straight-line basis
at a rate that will write off the cost of the assets to their estimated residual value over their useful lives.
The useful lives of major classes of assets have been estimated as follows:
Land improvements 15 – 50 years
Buildings 25 – 50 years
Plant and machinery 3 – 17 years
Office equipment 3 years
Computer equipment 3 years
Motor vehicles 5 – 12 years
Office fit-out 12 years
The cost of office fit-out is capitalised and depreciated over the unexpired period of the lease (held by the Guardians) or the estimated remaining useful lives of the improvements, whichever is shorter.
(q) Intangible assets
SOFTWARE Software and licences are finite life intangibles
and are recorded at cost less accumulated amortisation and impairment. Amortisation is charged on a straight-line basis over their estimated useful lives of three years. The estimated useful life and amortisation method is reviewed at the end of each annual reporting period.
CARBON CREDITS Allocations of New Zealand Units (NZU) and/or
other carbon credits are initially recognised at net realisable value where they have been received, or where the Fund is reasonably certain that they will be received, and a price can be reliably ascertained either through the existence of an observable active market or through pricing from reputable brokers. Other changes in the quantity of carbon credits are recognised at either cost or book value at the time of the transaction.
Subsequent to initial recognition, the carbon credits are measured at net realisable value i.e. the carbon credits are carried at the amount initially recorded less any impairment losses. The carbon credits are assessed to have indefinite useful lives and as such are not amortised but are tested annually for impairment. An impairment loss is recognised when the carbon credits’ carrying amount exceeds their recoverable amount. Recoverable amount is the higher of the carbon credits’ fair value less costs to sell or value in use.
(r) Assets held for sale Assets and disposal groups classified as held for
sale are measured at the lower of their carrying amount and fair value less costs to sell. Assets and disposal groups are held for sale if their carrying amounts will be recovered principally through a sale transaction rather than through continuing use. This condition is regarded as having been met only when the sale is highly probable and the asset or disposal group is available for immediate sale in its present condition. Management must be committed to the sale, which is expected to qualify for recognition as a completed sale within one year from the date of classification.
Property, plant and equipment are not depreciated once classified as held for sale.
(s) Operating leases The determination of whether an arrangement
is, or contains, a lease is based on the substance of the arrangement and requires an assessment of whether the fulfilment of the arrangement is dependent on the use of a specific asset or assets and the arrangement conveys a right to use the asset.
Notes to the Financial Statements (continued)
For the year ended 30 June 2014

NEW ZEALAND SUPERANNUATION FUND | ANNUAL REPORT 2014 | 113
Leases where the lessor effectively retains substantially all the risks and benefits of ownership of the leased items are classified as operating leases. Operating lease expenses are recognised on a straight-line basis over the period of the lease.
Where there are contingent lease payments, which are assessed to be closely related to the host lease contract, they are recognised as an expense as they arise.
In the event that lease incentives are received to enter into operating leases, such incentives are recognised as deferred income in the Statement of Financial Position. The aggregate benefits of incentives are recognised as a reduction of rental expense on a straight-line basis over the period of the lease.
(t) Payables Short-term payables are not interest bearing.
They are initially recognised at fair value and subsequently at amortised cost.
(u) Provisions Provisions are recognised when the Fund has a
present obligation as a result of a past event, the future sacrifice of economic benefits is probable and when the amount of the provision can be measured reliably.
The amount recognised as a provision is the best estimate of the consideration required to settle the present obligation at reporting date, taking into account the risks and uncertainties surrounding the obligation. Where a provision is measured using the cash flows estimated to settle the present obligation, its carrying amount is the present value of those cash flows.
When some or all of the economic benefits required to settle a provision are expected to be recovered from a third party, the receivable is recognised as an asset if it is virtually certain that recovery will be received and the amount of the receivable can be measured reliably.
(v) Income recognition Revenue is recognised to the extent which it is
probable that the economic benefits will flow to the Fund and the revenue can be reliably measured. The following specific recognition criteria must also be met before revenue is recognised:
INTEREST For financial instruments measured at fair value,
interest income is recognised on an accruals basis, either daily or on a yield-to-maturity basis. Interest earned on cash balances is accrued at the effective interest rate.
DIVIDENDS Dividend income is recognised when the
shareholder’s rights to receive payment has been established, normally the ex-dividend date. Where the Fund has elected to receive dividends in the form of additional shares rather than cash, the amount of the cash dividend foregone is recognised as income. Any excess in the value of shares received over the amount of cash dividend foregone is recognised as a gain in profit or loss in the Statement of Comprehensive Income.
SALE OF GOODS Revenue from the sale of goods is recognised
when the Fund has transferred to the buyer the significant risks and rewards of ownership of the goods.
(w) Foreign currency transactions Transactions denominated in a foreign
currency are converted to New Zealand dollars at the exchange rate in effect at the date of the transaction.
Monetary assets and liabilities denominated in a foreign currency at balance date are translated at the rate of exchange ruling as at that date. The resulting exchange differences are recognised separately in profit or loss in the Statement of Comprehensive Income.
(x) Statement of Cash Flows The following are the definitions of the terms
used in the Statement of Cash Flows:
Operating activities include all transactions and other events that are not investing or financing activities.
Investing activities are those activities relating to the acquisition, holding and disposal of property, plant and equipment and intangible assets.
Financing activities are those activities relating to capital contributions and to payments of superannuation entitlements (from 2020). As the current funding by the Crown of superannuation entitlements flows directly from the Treasury to the Ministry of Social Development it is not considered cash flow of the Fund and is accordingly not recorded in the Statement of Cash Flows.
Cash and cash equivalents includes cash balances on hand, cash held in bank accounts, demand deposits and other highly liquid investments with an original maturity of three months or less, which have an insignificant risk of change in fair value.
FINA
NC
IAL STA
TEMEN
TS N
EW ZEA
LAN
D SU
PERA
NN
UA
TION
FUN
D A
ND
GR
OU
P

| NEW ZEALAND SUPERANNUATION FUND | ANNUAL REPORT 2014114
NEW ZEALAND SUPERANNUATION FUND
1. SUMMARY OF SIGNIFICANT ACCOUNTING POLICIES (continued)
(y) Goods and Services Tax (GST) Revenues, expenses, assets and liabilities are
recognised exclusive of GST, with the exception of receivables and payables which are stated with GST included. Where GST is irrecoverable as an input tax, it is recognised as part of the related asset or expense.
Cash flows are included in the Statement of Cash Flows on a gross basis. The GST component of cash flows arising from investing and financing activities, which is recoverable from, or payable to, the taxation authority, is classified as operating cash flows.
(z) Changes in accounting policies The Fund has applied, for the first time,
certain standards and amendments that require restatement of previous financial statements. These include NZ IFRS 10 Consolidated Financial Statements and NZ IFRS 11 Joint Arrangements. In addition, the application of NZ IFRS 12 Disclosure of Interests in Other Entities has resulted in additional disclosures in the financial statements.
Also, the Fund has determined that it meets the definition of an investment entity. As a result, it has early adopted the Investment Entities amendments to NZ IFRS 10 Consolidated Financial Statements, NZ IFRS 12 Disclosure of Interests in Other Entities and NZ IAS 27 Separate Financial Statements (as amended in 2011) with a date of initial application of 1 July 2013.
As a result of the adoption of these standards and amendments, the Fund has changed its accounting policy with respect to accounting for its investments in subsidiaries, associates and joint ventures.
The nature and impact of the new standards and amendments are described below.
NZ IFRS 10 CONSOLIDATED FINANCIAL STATEMENTS AND NZ IAS 27 SEPARATE FINANCIAL STATEMENTS (AS AMENDED IN 2011)
NZ IFRS 10 introduces a new control model that is applicable to all entities and ordinarily requires the consolidation of subsidiaries where control is established. However an exception exists where an entity meets the definition of an investment entity. As a result, subsidiaries that were previously consolidated by the Fund are now accounted for at fair value through profit or loss.
This change in accounting policy has been applied retrospectively in accordance with the transition provisions of NZ IFRS 10. The transition provisions require retrospective application in accordance with NZ IAS 8 Accounting Policies, Changes in Accounting Estimates and Errors. Comparative amounts have been restated in accordance with the transition guidance.
The amendments to NZ IAS 27 (as amended in 2011) require an investment entity to present separate financial statements as its only financial statements in the case where it measures all its subsidiaries at fair value through profit or loss. As a consequence, the Fund is no longer required to present consolidated financial statements.
NZ IFRS 11 JOINT ARRANGEMENTS AND NZ IAS 28 INVESTMENT IN ASSOCIATES AND JOINT VENTURES (AS AMENDED IN 2011)
As a result of NZ IFRS 11, the Fund has changed its accounting policy for its interests in joint arrangements. Under NZ IFRS 11, the Fund classifies its interests in joint arrangements as either joint operations or joint ventures. When making this assessment, the Fund considers the structure of the arrangements, the legal form of any separate vehicles, the contractual terms of the arrangements and other facts and circumstances. Previously, the structure of the arrangement was the sole focus of classification.
Because the Fund has determined it is an investment entity, it has also elected the exemption from applying the equity method prescribed in NZ IAS 28 (as amended in 2011) for all its investments in associates and joint ventures. As a consequence, associates and joint ventures that were previously equity accounted are now accounted for at fair value through profit or loss with retrospective application.
NZ IFRS 12 DISCLOSURE OF INTERESTS IN OTHER ENTITIES
The adoption of NZ IFRS 12 and the investment entity amendments has resulted in the introduction of new disclosure requirements for the Fund’s investments in subsidiaries, associates, joint ventures and structured entities. Adoption of this standard has impacted the Fund’s level of disclosures in respect of its investments and its investment entity status but has not impacted the Fund’s financial position or results from operations.
Notes to the Financial Statements (continued)
For the year ended 30 June 2014

NEW ZEALAND SUPERANNUATION FUND | ANNUAL REPORT 2014 | 115
As a result of the adoption of the Investment Entities’ amendments, the following adjustments were made to the financial statements:
1 JULY 2012
(GROUP ACTUAL)
ADJUSTMENTS 1 JULY 2012
(FUND RESTATED)
IMPACT ON STATEMENT OF FINANCIAL POSITION NZD’000 NZD’000 NZD’000
Assets
Investments accounted for using the equity method 953,989 (953,989) –
Investments – other financial assets 14,130,298 972,747 15,103,045
15,084,287 18,758 15,103,045
Public equity
Retained surplus 3,800,705 18,758 3,819,463
3,800,705 18,758 3,819,463
30 JUNE 2013
(GROUP ACTUAL)
ADJUSTMENTS 30 JUNE 2013
(FUND RESTATED)
IMPACT ON STATEMENT OF FINANCIAL POSITION NZD’000 NZD’000 NZD’000
Assets
Cash and cash equivalents 5,630,533 (5,136) 5,625,397
Cash pledged as collateral 682,745 (84,901) 597,844
Trade and other receivables 133,599 (19,000) 114,599
Investments – other financial assets 16,008,936 1,042,598 17,051,534
Investments accounted for using the equity method 1,036,941 (1,036,941) –
Investments in unconsolidated subsidiaries – 100,567 100,567
Insurance assets 746 (746) –
23,493,500 (3,559) 23,489,941
Liabilities
Trade and other payables 732,423 (4,240) 728,183
Investments – derivative financial instrument liabilities 653,960 (46) 653,914
Insurance liabilities 20,097 (20,097) –
Taxation payable 248,742 (1) 248,741
Deferred tax liability 173,903 5,830 179,733
1,829,125 (18,554) 1,810,571
Total equity
Retained surplus 7,632,888 19,334 7,652,222
Foreign currency translation reserve 4,324 (4,324) –
Non-controlling interest 15 (15) –
7,637,227 14,995 7,652,222
FINA
NC
IAL STA
TEMEN
TS N
EW ZEA
LAN
D SU
PERA
NN
UA
TION
FUN
D A
ND
GR
OU
P

| NEW ZEALAND SUPERANNUATION FUND | ANNUAL REPORT 2014116
NEW ZEALAND SUPERANNUATION FUND
30 JUNE 2013
(GROUP ACTUAL)
ADJUSTMENTS 30 JUNE 2013
(FUND RESTATED)
IMPACT ON STATEMENT OF COMPREHENSIVE INCOME NZD’000 NZD’000 NZD’000
Interest income 250,628 (63) 250,565
Dividend income 276,123 (21) 276,102
Net insurance premiums 1,715 (1,715) –
Fair value changes in investments held at fair value through profit or loss 3,721,618 149,453 3,871,071
Net foreign exchange gain/(loss) 526,805 5,437 532,242
Share of profit of investments accounted for using the equity method 145,796 (145,796) –
Operating expenses 168,451 (187) 168,264
Translation of foreign operations 5,401 (5,401) –
Income tax on items of other comprehensive income (1,077) 1,077 –
Income tax expense 999,374 6,906 1,006,280
6,094,834 9,690 6,104,524
IMPACT ON STATEMENT OF CASH FLOWS
Proceeds from sale of investments 25,914,783 136,856 26,051,639
Cash collateral received 6,486,578 (70,367) 6,416,211
Proceeds from sale of associates 62,875 (62,875) –
Interest received 244,235 (21) 244,214
Premiums received 3,613 (3,613) –
Purchases of investments (22,537,182) (84,605) (22,621,787)
Cash collateral paid (6,774,579) 80,413 (6,694,166)
Payments to suppliers (82,646) 41 (82,605)
Effects of exchange rate changes on the balance of cash held in foreign currencies 85,931 (965) 84,966
3,403,608 (5,136) 3,398,472
1. SUMMARY OF SIGNIFICANT ACCOUNTING POLICIES (continued)
(z) Changes in accounting policies (continued)
The adoption of the amendments to NZ IFRS10 Consolidated Financial Statements has resulted in the Fund’s subsidiaries, which were previously consolidated, being classified as a single line in the Statement of Financial Position: “Investments in unconsolidated subsidiaries” and accounted for at fair value through profit or loss. Non-consolidation of these subsidiaries has consequently impacted multiple lines throughout the Statement of Financial Position, Statement of Comprehensive Income and Statement of Cashflows and has been applied retrospectively.
The adoption of NZ IAS 28 Investment in Associates has resulted in the Fund’s “Investments accounted for using the equity method” being fair valued, rather than equity accounted and reclassified to “Investments – other financial assets” in the Statement of Financial Position. The impact of this has been an uplift in the value of these assets. The uplift has been applied restrospectively.
Other than those disclosed above, there have been no other changes in accounting policies. All other accounting policies have been applied consistently throughout these financial statements.
Certain prior year comparatives have been restated to conform with current year presentation.
(aa) Significant estimates and judgementsIn preparing these financial statements, estimates and judgements have been made concerning the future. These estimates and judgements may differ from the subsequent actual results. Estimates and judgements are continually evaluated and are based on historical experience and other factors, including expectations of future events that are believed to be reasonable under the circumstances. The estimates and judgements that have a significant risk of causing a material adjustment to the carrying amounts of assets and liabilities are:
Notes to the Financial Statements (continued)
For the year ended 30 June 2014

NEW ZEALAND SUPERANNUATION FUND | ANNUAL REPORT 2014 | 117
ASSESSMENT AS AN INVESTMENT ENTITY
Management has concluded that the Fund meets the definition of an Investment Entity as outlined in the Summary of Significant Accounting Policies. These conclusions will be reassessed on an annual basis, if any of the criteria or characteristics change.
ASSESSMENT OF CONTROL, JOINT CONTROL OR SIGNIFICANT INFLUENCE
Management have undertaken a review of the Fund’s investments in light of the new control model established under NZ IFRS 10 Consolidated Financial Statements to ensure the correct classification and disclosure of investments in subsidiaries.
The Fund holds investments in a number of entities that are not considered subsidiaries even though its ownership interest exceeds 50%. Management has concluded that the Fund has no power to direct the relevant activities of these entities and therefore it does not have control of these entities.
The Fund also holds investments in a number of entities that are not considered associates even though its ownership interest exceeds 20%. Management have concluded that the Fund has no power to participate in the financial and operating policy decisions of these entities and therefore it does not have significant influence over these entities.
The Fund holds a 37.3% interest in Datacom Group Limited. Under a Shareholder’s Agreement, there are a number of key operating and financial activities that require approval in writing by the Fund, as well as the majority shareholder. As a consequence, it is management’s view that the Fund and the major shareholder have collective or joint control of Datacom Group Limited and therefore the investment in Datacom Group Limited is treated by the Fund as a joint arrangement.
The Fund classifies its joint arrangements as joint ventures because the contractual agreements provide the parties with rights to the net assets of the joint arrangements. Investments in joint ventures are accounted for at fair value through profit or loss as outlined in note 1(z).
ASSESSMENT OF INVESTMENTS IN STRUCTURED ENTITIES
The Fund has assessed which of its investments should be classified as investments in structured entities. In doing so, the Fund has considered voting rights and other similar rights afforded to investors as well as any contractual arrangements in place with these investments.
Management have concluded that certain of the Fund’s investments meet the definition of a structured entity because:
• The voting rights in the investments are not the dominant factor in deciding who controls the investment;
• The investments have narrow and well-defined objectives to provide investment opportunities to investors.
DETERMINATION OF FAIR VALUE OF INVESTMENTS
Fixed income securities where the fair value is determined by a pricing vendor. The vendor uses models that utilise inputs including loan level data, prepayment and default assumptions and benchmark prices for similar securities. Management mitigates the risk of pricing errors by only selecting reputable pricing vendors and by periodically calibrating prices against observed market data. Further disclosures regarding valuation inputs and sensitivity analysis of Level 3 instruments is contained in note 21.
Private equity, collective investment funds and unlisted unit trust investments. Managers and administrators may either use their own models or may engage independent valuers who use models to obtain the fair value of these investments. In addition management may also directly appoint independent valuers to obtain the fair value of certain investments where this information is unable to be provided by a manager or administrator. Model inputs may include the price of recent transactions, earnings multiples or discounted cash flows. Further disclosures regarding valuation inputs and sensitivity analysis of Level 3 instruments is contained in note 21.
Derivatives where the fair value is determined by a pricing vendor, broker or counterparty.The pricing vendor, broker or counterparty uses models to price derivatives where the inputs may include current and forward exchange rates, estimates of cash flows, interest rates, futures prices, default rates, credit spreads, volatility curves, indicative prices for similar assets and discount rates. Management mitigates the risk of pricing errors by only selecting reputable vendors, brokers and counterparties and by periodically calibrating prices against observed market data. Further disclosures regarding valuation inputs and sensitivity analysis of Level 3 instruments is contained in note 21.
DETERMINATION OF FAIR VALUE OF LAND, LAND IMPROVEMENTS AND BUILDINGS
Valuations of land, land improvements and buildings are provided by an independent valuer who uses a discounted cash flow model, recent transactions or capitalisation of net income model (as appropriate). Further disclosures of valuation inputs is contained in note 10.
FINA
NC
IAL STA
TEMEN
TS N
EW ZEA
LAN
D SU
PERA
NN
UA
TION
FUN
D A
ND
GR
OU
P
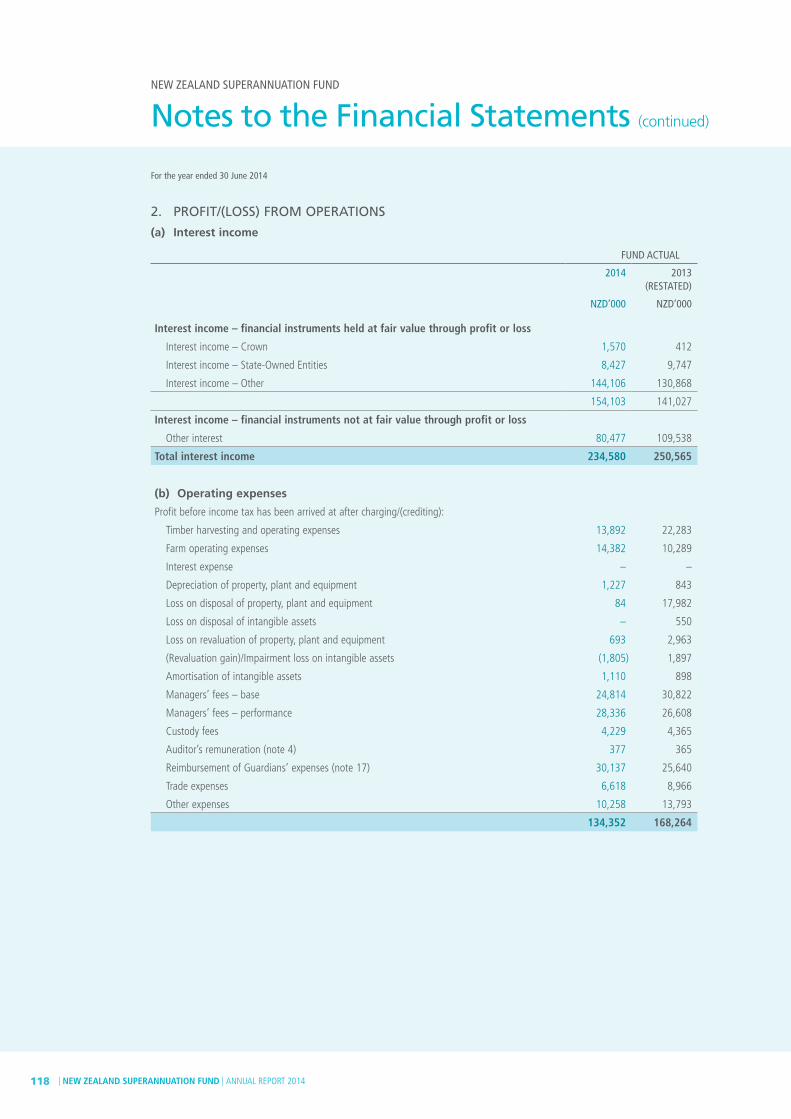
| NEW ZEALAND SUPERANNUATION FUND | ANNUAL REPORT 2014118
NEW ZEALAND SUPERANNUATION FUND
2. PROFIT/(LOSS) FROM OPERATIONS
(a) Interest income
FUND ACTUAL
2014 2013 (RESTATED)
NZD’000 NZD’000
Interest income – financial instruments held at fair value through profit or loss
Interest income – Crown 1,570 412
Interest income – State-Owned Entities 8,427 9,747
Interest income – Other 144,106 130,868
154,103 141,027
Interest income – financial instruments not at fair value through profit or loss
Other interest 80,477 109,538
Total interest income 234,580 250,565
(b) Operating expenses
Profit before income tax has been arrived at after charging/(crediting):
Timber harvesting and operating expenses 13,892 22,283
Farm operating expenses 14,382 10,289
Interest expense – –
Depreciation of property, plant and equipment 1,227 843
Loss on disposal of property, plant and equipment 84 17,982
Loss on disposal of intangible assets – 550
Loss on revaluation of property, plant and equipment 693 2,963
(Revaluation gain)/Impairment loss on intangible assets (1,805) 1,897
Amortisation of intangible assets 1,110 898
Managers’ fees – base 24,814 30,822
Managers’ fees – performance 28,336 26,608
Custody fees 4,229 4,365
Auditor’s remuneration (note 4) 377 365
Reimbursement of Guardians’ expenses (note 17) 30,137 25,640
Trade expenses 6,618 8,966
Other expenses 10,258 13,793
134,352 168,264
Notes to the Financial Statements (continued)
For the year ended 30 June 2014

NEW ZEALAND SUPERANNUATION FUND | ANNUAL REPORT 2014 | 119
3. FAIR VALUE CHANGES IN INVESTMENTS AT FAIR VALUE THROUGH PROFIT OR LOSS
FUND ACTUAL
2014 2013 (RESTATED)
NZD’000 NZD’000
Financial assets or liabilities designated at fair value through profit or loss 1,826,363 1,478,741
Financial assets or liabilities held for trading recognised at fair value through profit or loss 2,161,936 2,392,330
3,988,299 3,871,071
4. REMUNERATION OF AUDITOR
FUND ACTUAL
2014 2013
NZD’000 NZD’000
Auditor of the Fund
Audit of the financial statements – Attest 354 349
Audit of the Fund’s and Guardians’ subsidiaries 18 16
Other fees paid to auditor 5 –
377 365
The auditor of the Fund and its subsidiaries and the Guardians’ subsidiaries is Brent Penrose of Ernst & Young, on behalf of the Auditor-General.
The other fees paid to the auditor of the Fund were for an assurance review over the calculation of Fund performance.
The Fund meets the cost of the audit of the Guardians’ subsidiaries as it holds beneficial ownership of the assets of these entities and, as such, accounts for them within these financial statements.
FINA
NC
IAL STA
TEMEN
TS N
EW ZEA
LAN
D SU
PERA
NN
UA
TION
FUN
D A
ND
GR
OU
P
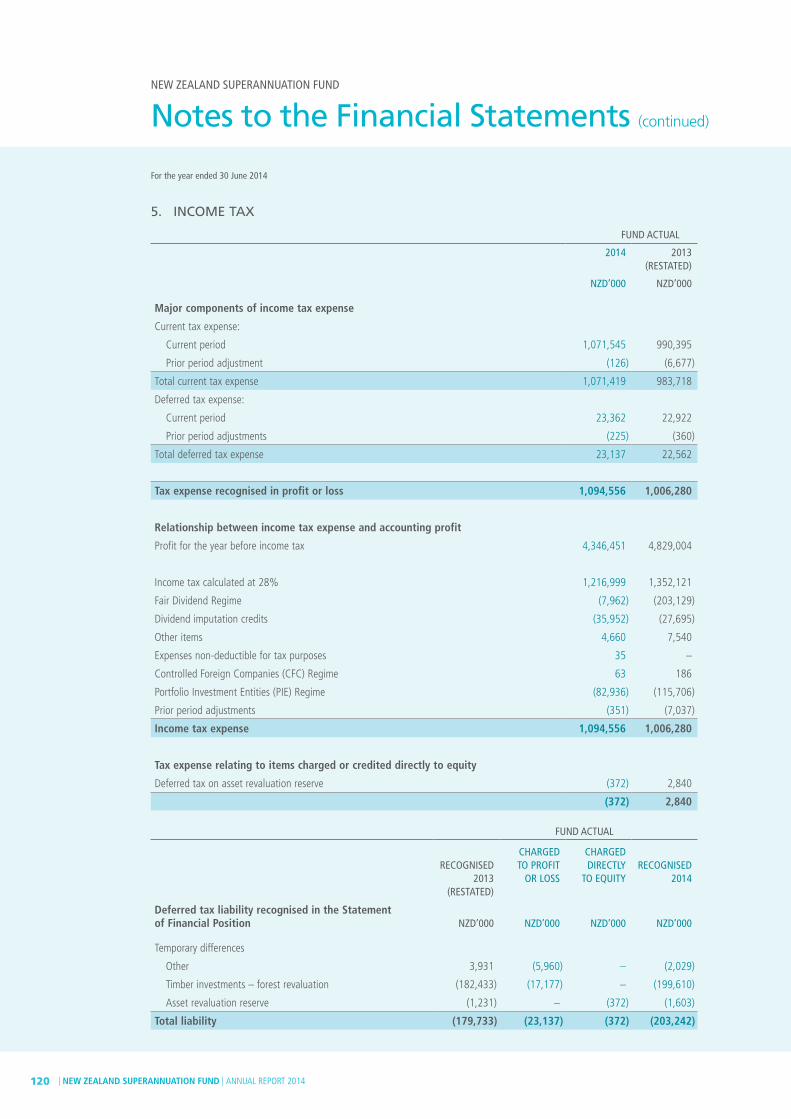
| NEW ZEALAND SUPERANNUATION FUND | ANNUAL REPORT 2014120
NEW ZEALAND SUPERANNUATION FUND
5. INCOME TAX
FUND ACTUAL
2014 2013 (RESTATED)
NZD’000 NZD’000
Major components of income tax expense
Current tax expense:
Current period 1,071,545 990,395
Prior period adjustment (126) (6,677)
Total current tax expense 1,071,419 983,718
Deferred tax expense:
Current period 23,362 22,922
Prior period adjustments (225) (360)
Total deferred tax expense 23,137 22,562
Tax expense recognised in profit or loss 1,094,556 1,006,280
Relationship between income tax expense and accounting profit
Profit for the year before income tax 4,346,451 4,829,004
Income tax calculated at 28% 1,216,999 1,352,121
Fair Dividend Regime (7,962) (203,129)
Dividend imputation credits (35,952) (27,695)
Other items 4,660 7,540
Expenses non-deductible for tax purposes 35 –
Controlled Foreign Companies (CFC) Regime 63 186
Portfolio Investment Entities (PIE) Regime (82,936) (115,706)
Prior period adjustments (351) (7,037)
Income tax expense 1,094,556 1,006,280
Tax expense relating to items charged or credited directly to equity
Deferred tax on asset revaluation reserve (372) 2,840
(372) 2,840
FUND ACTUAL
RECOGNISED 2013
(RESTATED)
CHARGED TO PROFIT
OR LOSS
CHARGED DIRECTLY
TO EQUITY
RECOGNISED
2014
Deferred tax liability recognised in the Statement of Financial Position NZD’000 NZD’000 NZD’000 NZD’000
Temporary differences
Other 3,931 (5,960) – (2,029)
Timber investments – forest revaluation (182,433) (17,177) – (199,610)
Asset revaluation reserve (1,231) – (372) (1,603)
Total liability (179,733) (23,137) (372) (203,242)
Notes to the Financial Statements (continued)
For the year ended 30 June 2014

NEW ZEALAND SUPERANNUATION FUND | ANNUAL REPORT 2014 | 121
6. INVESTMENTS
(a) Investments by asset type
FUND ACTUAL
2014 2013 (RESTATED)
NZD’000 NZD’000
Financial assets
Derivative financial instrument assets:
Forward foreign exchange contracts 151,251 208,639
Cross currency swaps 419,423 340,868
Volatility swaps – 6,036
Longevity contingent swaps 85,368 92,696
Futures contracts – –
Total return swaps – equity 302,188 47,704
Total return swaps – bonds 3,760 –
Credit default swaps 204,272 9,167
Insurance-linked swaps 690 1,698
Interest rate swaps 5,031 7,105
Other OTC swaps 71 50
Total derivative financial instrument assets 1,172,054 713,963
Other financial assets:
New Zealand equities – State-Owned Entities 128,569 50,878
New Zealand equities – Other 1,565,214 1,018,391
Global equities 9,251,816 5,691,553
Total equities 10,945,599 6,760,822
Other fixed income 7,180,704 4,383,971
Total fixed income 7,180,704 4,383,971
Collective investment funds 925,432 1,563,838
Reverse repurchase agreements 171,321 831,701
Insurance-linked investments – catastrophe bonds 55,811 232,698
Private equity (i) 2,658,757 2,992,115
Redeemable preference shares – 57,500
Unlisted unit trusts 245,695 228,889
Total other financial assets 22,183,319 17,051,534
Investments in unconsolidated subsidiaries 229,191 100,567
Other financial assets pledged as collateral 57,831 81,935
Total financial assets 23,642,395 17,947,999
(i) Includes unlisted investment funds; unlisted equity investments; investments in joint ventures; and investments in associates.
FINA
NC
IAL STA
TEMEN
TS N
EW ZEA
LAN
D SU
PERA
NN
UA
TION
FUN
D A
ND
GR
OU
P

| NEW ZEALAND SUPERANNUATION FUND | ANNUAL REPORT 2014122
NEW ZEALAND SUPERANNUATION FUND
6. INVESTMENTS (continued)
(a) Investments by asset type (continued)
FUND ACTUAL
2014 2013 (RESTATED)
NZD’000 NZD’000
Agricultural assets
Forests 2,442 36,979
Livestock 21,366 17,921
Crops 313 247
Total agricultural assets 24,121 55,147
Total investments 23,666,516 18,003,146
Financial liabilities
Derivative financial instrument liabilities:
Forward foreign exchange contracts 17,497 281,873
Cross currency swaps 2,513 34,462
Asset swaps 90,516 107,882
Futures contracts – –
Total return swaps – equity 25,975 200,493
Total return swaps – bonds – 4,997
Credit default swaps 24,279 13,020
Options – 3,541
Interest rate swaps 18,606 7,646
Total derivative financial instrument liabilities 179,386 653,914
Net investments 23,487,130 17,349,232
(b) Restrictions For restrictions on those investment balances pledged as collateral, refer to note 22.
(c) Fair values The basis of the fair value determination is set out in the summary of significant accounting policies
(note 1 and note 21).
(d) Illiquid securities The Fund holds asset-backed securities for which the market is illiquid. The fair value of these securities
is $30,140,000 (2013: $38,322,000), which is included in the other fixed income asset category.
Notes to the Financial Statements (continued)
For the year ended 30 June 2014

NEW ZEALAND SUPERANNUATION FUND | ANNUAL REPORT 2014 | 123
(e) Investments in unconsolidated subsidiariesIn accordance with the transitional provisions of NZ IFRS 10, the Fund has reassessed the control conclusion for its subsidiaries as at 1 July 2012 and taken advantage of the investment entity consolidation relief. As a consequence, it is now accounting for its investments in subsidiaries at fair value through profit and loss.
The Fund has interests in the following significant unconsolidated subsidiaries:
NAME OF SUBISIDIARY NOTE BALANCE DATECOUNTRY OF
INCORPORATION
OWNERSHIP INTEREST
2014 %
2013 %
CNI Timber Operating Company Limited (i) 30 June New Zealand 0 0
Sankaty Managed Account (NZSF) Limited Partnership (iv) 31 March Cayman Islands 99.9 99.9
KKR NZSF Energy Investor Limited Partnership (iii),(iv) 31 December Cayman Islands 100 0
In addition, the Fund has 100% ownership interest in 3 Segregated Accounts of Bermudan-domiciled Segregated Account Company Horseshoe Re Limited (2013: 8 Segregated Accounts) and 100% ownership interest in 93 Segregated Accounts of Bermudan-domiciled Segregated Account Company Horseshoe Re II Limited (2013: 47 Segregated Accounts)(ii). All Segregated Accounts have a balance date of 31 December.
(i) All of the shares in CNI Timber Operating Company Limited are legally owned by the Guardians. However, beneficial ownership of the shares remains with the Fund, and as such this company has been accounted for as an unconsolidated subsidiary in these financial statements. Section 59 of the New Zealand Superannuation and Retirement Income Act 2001 (Act) restricts the Fund from taking a controlling interest in any other entity. From time to time, opportunities to purchase privately traded assets carry associated obligations to take over operating entities specific to that asset. There may be a need to balance the benefit to the Fund of progressing with the transaction against the restriction on taking control of the operating entity. The acquisition of CNI Timber Operating Company Limited arose during the purchase of timberland estate. The Group has been restructured so that legal ownership of this entity sits with the Guardians. However, due to certain performance guarantee contracts that exist within the company which have not been transferred, the beneficial ownership of the shares has been retained by the Fund.
(ii) Horseshoe Re Limited and Horseshoe Re II Limited, acting for, and for the benefit of, the Segregated Accounts, enter into agreements relating to the Fund’s investments in insurance-linked products. These companies are domiciled in Bermuda as Bermuda is a large, well regulated centre for reinsurance business. Section 59 of the Act restricts the Fund from taking an enduring controlling interest in any other entity. As a matter of Bermudan law, a Segregated Account is not a ‘legal person’ and has no existence separate from the Segregated Account company. In addition, the Fund does not control the Segregated Account company. Therefore, even though the Segregated Accounts are treated as unconsolidated subsidiaries in these financial statements, they are not ‘entities’ for the purposes of Section 59 of the Act and accordingly the interest held does not constitute a breach of that section. On 1 August 2013, the Fund redeemed all of its interests in 5 Segregated Accounts of Horseshoe Re Limited. During the year, the Fund established a further 46 Segregated Accounts in the Bermudan Segregated Account company Horseshoe Re II Limited.
(iii) During the year the Fund subscribed for an interest in KKR NZSF Energy Investor Limited Partnership. The net assets of the Fund did not change as a result of the subscription of this interest.
(iv) Section 59 of the Act restricts the Fund from taking an enduring controlling interest in any other entity. As a matter of Cayman Islands law, an exempted limited partnership is not a ‘legal person’. Even though limited partnerships are treated as unconsolidated subsidiaries, they are not entities for the purposes of Section 59 of the Act and accordingly the interests held do not constitute a breach of that section.
FINA
NC
IAL STA
TEMEN
TS N
EW ZEA
LAN
D SU
PERA
NN
UA
TION
FUN
D A
ND
GR
OU
P

| NEW ZEALAND SUPERANNUATION FUND | ANNUAL REPORT 2014124
NEW ZEALAND SUPERANNUATION FUND
The Fund seeks to maximise after-tax returns. In some cases, this includes the use of holding vehicles that are subsidiaries for accounting purposes. All investment opportunities are diligently evaluated to ensure they generate an adequate pre-tax return to the Fund. Full transparency and information exchange for tax purposes and compliance with all relevant laws is required.
As at 30 June, there are no significant restrictions on the ability of these unconsolidated subsidiaries to transfer funds to the Fund.
As at 30 June the Fund had outstanding commitments to provide capital to Sankaty Managed Account (NZSF) Limited Partnership and KKR NZSF Energy Investor Limited Partnership. These outstanding commitments total $462,762,000 (2013: $243,920,000). The subsidiaries are able to request capital by providing the Fund with not less than 10 business days notice.
(f) Investments in associates The Fund has the following investments in associates that are measured at fair value through profit and loss
and classified as private equity investments:
NAME OF ASSOCIATEBALANCE
DATECOUNTRY OF
INCORPORATION
OWNERSHIP INTEREST
2014 %
2013 %
Kaingaroa Timberlands Partnership 30 June New Zealand 38.75% 41.25%
On 28 February 2014, the Fund sold 2.5% of its investment in Kaingaroa Timberlands Partnership, reducing its shareholding to 38.75%.
(g) Agricultural assets – forests Forests are accounted for under NZ IAS 41 Agriculture and are carried at fair value less estimated point-of-
sale costs.
FUND ACTUAL
2014 2013
NZD’000 NZD’000
Gross carrying amount – forests
Carrying amount at beginning of the year 36,979 63,770
Additions – –
Disposals – –
Fair value changes due to harvesting (16,870) (17,824)
Other fair value changes (17,667) (12,172)
Other changes – –
Transfer from assets held for sale – 3,205
Carrying amount at end of the year 2,442 36,979
6. INVESTMENTS (continued)
(e) Investments in unconsolidated subsidiaries (continued)
Notes to the Financial Statements (continued)
For the year ended 30 June 2014

NEW ZEALAND SUPERANNUATION FUND | ANNUAL REPORT 2014 | 125
At 30 June 2014, the Fund’s forests measured approximately 226 hectares (ha) (2013: 1,195 ha). During the year ended 30 June 2014, the Fund harvested a total of 0.63 million cubic metres (m3) (2013: 0.74 million m3).
All forests are categorised within Level 3 of the fair value hierarchy (as set out in note 21).
The forests have been measured at fair value based on a net present value or discounted cash flow approach. The following methodology and assumptions were applied:
An estate-based approach was employed whereby the net cash flows for each geographically distinct area were forecast and discounted to provide a forest value. These cash flows reflect management’s future harvesting and silvicultural intentions for the forests.
(i) The forests have been valued on the basis of a going concern and capture the value of the existing crop on a single rotation basis.
(ii) Notional land rental costs have been included for freehold land based on current government valuations.
(iii) The cash flows do not take into account income tax.
(iv) The impact of movement in prices is estimated by adjusting the starting prices for price forecasting by the quarter-on-quarter movement in market prices and maintaining a consistent price path to the long-run averages by grade category.
(v) Costs are current average costs. No allowance has been made for cost improvements in future operations.
(vi) The net change in value arising from harvest, growth and change in prices by log grade category is taken as the change in fair market value of the crop and is included in profit or loss in the Statement of Comprehensive Income.
FOREST RISK MANAGEMENTThe Fund is exposed to financial risks in respect of its forestry activities. The primary financial risk that these activities expose the Fund to are pricing risks due to the global volatility of log prices, exchange rates and transportation costs. Management monitors these movements and adjusts harvest levels and marketing efforts to minimise the impacts of these changes.
FINA
NC
IAL STA
TEMEN
TS N
EW ZEA
LAN
D SU
PERA
NN
UA
TION
FUN
D A
ND
GR
OU
P

| NEW ZEALAND SUPERANNUATION FUND | ANNUAL REPORT 2014126
NEW ZEALAND SUPERANNUATION FUND
6. INVESTMENTS (continued)
(h) Agricultural assets – livestock Livestock are accounted for under NZ IAS 41 Agriculture and carried at fair value less estimated
point-of-sale costs.
Livestock are valued by an independent valuer at balance date who uses recent observable livestock sales (adjusted for condition and location of livestock where necessary) to determine the fair value of livestock.
The Fund owns dairy cattle primarily held to produce milk. Young stock are held for replacement purposes. The quantity of livestock owned by the Fund at 30 June is shown below.
FUND ACTUAL
2014 2013
HEAD HEAD
Livestock class
R1 heifers 2,610 2,484
R2 heifers 2,280 2,140
Mixed-age cows 8,485 8,621
Total head of cattle 13,375 13,245
The change in the value of livestock owned by the Fund during the year was due to:
FUND ACTUAL
2014 2013
NZD’000 NZD’000
Livestock reconciliation
Carrying amount at beginning of the year 17,921 14,009
Purchases 34 6,095
Fair value changes in livestock – price changes 3,989 (1,165)
Growth of animals 2,033 977
Birth of animals 4,821 3,396
Livestock losses (1,121) (841)
Book value of livestock sold (6,311) (4,550)
Carrying amount at end of the year 21,366 17,921
During the year ended 30 June 2014, the Fund produced 3,718,055 kilograms (kg) of milk solids (2013: 2,399,802 kg).
All livestock is classified within Level 2 of the fair value hierarchy (as set out in note 21).
LIVESTOCK RISK MANAGEMENT The Fund is exposed to financial risks in respect of its farming activities. The primary financial risk that
these activities expose the Fund to are pricing risks due to the global volatility of milk prices and the price of key inputs e.g. feed and fertiliser. Historically, movements in dairy prices have tended to correlate to a reasonable degree with key inputs, and movements are monitored so that management can adapt operations as required. There are procedures in place to minimise and manage the risks which the land and livestock assets are exposed to that could lead to financial loss. All rural land investments, livestock and physical assets are inspected at least twice monthly to assess the condition of these assets, and to manage any identified risks.
Notes to the Financial Statements (continued)
For the year ended 30 June 2014

NEW ZEALAND SUPERANNUATION FUND | ANNUAL REPORT 2014 | 127
(i) Investments in joint ventures Investments in joint ventures that have been designated as at fair value through profit or loss are classified
as private equity investments.
NAME OF JOINTLY CONTROLLED ENTITY BALANCE DATECOUNTRY OF
INCORPORATION
OWNERSHIP INTEREST
2014 %
2013 %
Aotea Energy Holdings Limited 31 March New Zealand 0 50
Datacom Group Limited 31 March New Zealand 37.6 37.3
As at 30 June 2013 the Fund held a 50% shareholding in Aotea Energy Holdings Limited, being the holding company for it’s investment in Z Energy Limited, a New Zealand fuel company. On 19 August 2013, Z Energy Limited listed on the New Zealand and Australian stock exchanges. In the listing, 60% of the shares in Z Energy Limited were sold, reducing the ownership interest of Aotea Energy Holdings Limited in Z Energy to a 40% holding and the Fund’s indirect interest to a 20% holding.
On 28 February 2014, the Fund sold its 50% shareholding in Aotea Energy Holdings Limited and simultaneously purchased 50% of the shares held by Aotea Energy Holdings Limited in Z Energy Limited. This transaction has resulted in the Fund having a 20% direct interest in Z Energy Limited rather than through a holding company structure.
(j) ‘Day 1’ gains and losses
FUND ACTUAL
2014 2013
NZD’000 NZD’000
Other OTC swaps reconciliation of ‘day 1’ gains
‘Day 1’ gain at beginning of the year 7,335 9,190
‘Day 1’ gain arising during the year 2,397 –
Unwinding and discount rate adjustment 55 36
Effect of movement in foreign exchange rates (880) 262
Gain recognised during the year (2,117) (2,153)
Remaining ‘day 1’ gain at end of the year 6,790 7,335
The closing balance of the ‘day 1’ gain has not been recognised in the Statement of Financial Position. It will be recognised on a systematic basis over the life of the instrument to which it relates.
FINA
NC
IAL STA
TEMEN
TS N
EW ZEA
LAN
D SU
PERA
NN
UA
TION
FUN
D A
ND
GR
OU
P

| NEW ZEALAND SUPERANNUATION FUND | ANNUAL REPORT 2014128
NEW ZEALAND SUPERANNUATION FUND
6. INVESTMENTS (continued)
(k) Investments in structured entities
STRUCTURED ENTITIES
A structured entity is an entity that has been designed so that voting or similar rights are not the dominant factor in deciding who controls the entity, such as when any voting rights relate to administrative tasks only and the relevant activities are directed by means of contractual arrangements. A structured entity often has some or all of the following features or attributes; (a) restricted activities, (b) a narrow and well-defined objective, such as to provide investment opportunities for investors by passing on risks and rewards associated with the assets of the structured entity to investors, (c) insufficient equity to permit the structured entity to finance its activities without subordinated financial support and (d) financing in the form of multiple contractually linked instruments to investors that create concentrations of credit or other risks.
The Fund is principally involved with structured entities through investments in private equity investment funds, collective investment vehicles, unlisted unit trusts, insurance-linked investments – catastrophe bonds, shareholder loans, unconsolidated subsidiaries, to be announced (TBA) securities and asset-backed securities that are issued by structured entities. The Fund invests in structured entities to assist with the implementation of its overall investment strategy. The Fund does not sponsor any structured entities.
Structured entities have the following business activities:
Private equity investment funds and unconsolidated subsidiaries
Private equity investment funds and unconsolidated subsidiaries provide a mechanism to share exposure with other investors and may take various legal forms (e.g. limited liability companies, limited partnerships, trusts). The Fund makes commitments to, and investments in, these legal structures and in return is issued with rights to a proportional stake in their net assets. They have a broad range of investment objectives and are managed by unrelated asset managers who apply various investment strategies to accomplish their respective investment objectives. The change in fair value of these investments is included in the Statement of Comprehensive Income in “fair value changes in investments held at fair value through profit or loss”.
Collective investment funds and unlisted unit trusts
Collective investment funds and unit trusts finance their operations by way of subscription, in which case, the Fund subscribes and is issued with redeemable shares that entitle it to a proportional stake in the net assets of the investment fund. The change in fair value of each investment fund is included in the Statement of Comprehensive Income in “fair value changes in investments held at fair value through profit or loss”.
Asset-backed securities The Fund invests in a variety of asset-backed
securities which have, to date, senior tranches of debt issued by a structured entity. The debt is usually collateralised by an underlying pool of assets. The asset-backed securities take the form of mortgage-backed securities (collateralised by both commercial and residential mortgages), asset-backed securities (collateralised by consumer loans, small business loans and auto loans) collateralised debt obligations (CDO) and collateralised loan obligations (CLO).
Insurance-linked investments – catastrophe bonds
The Fund invests in catastrophe bonds which are issued by structured entities. Each bond is linked to an insurance event such as a natural disaster. The bonds transfer particular risks from the sponsor to the bond holder.
Shareholder loans The Fund may make investments in private equity
funds, or other private equity types of investment via shareholder loans. The borrower in the arrangement may be a structured entity.
To Be Announced securities (TBA’s) TBA’s are forward mortgage-backed securities
trades. Pass-through securities issued by Freddie Mac, Fannie Mae and Ginnie Mae trade in the TBA market. The term TBA is derived from the fact that the actual mortgage-backed security that will be delivered to fulfill a TBA trade is not designated at the time the trade is made. The securities are “to be announced” 48 hours prior to the established trade settlement date.
Notes to the Financial Statements (continued)
For the year ended 30 June 2014
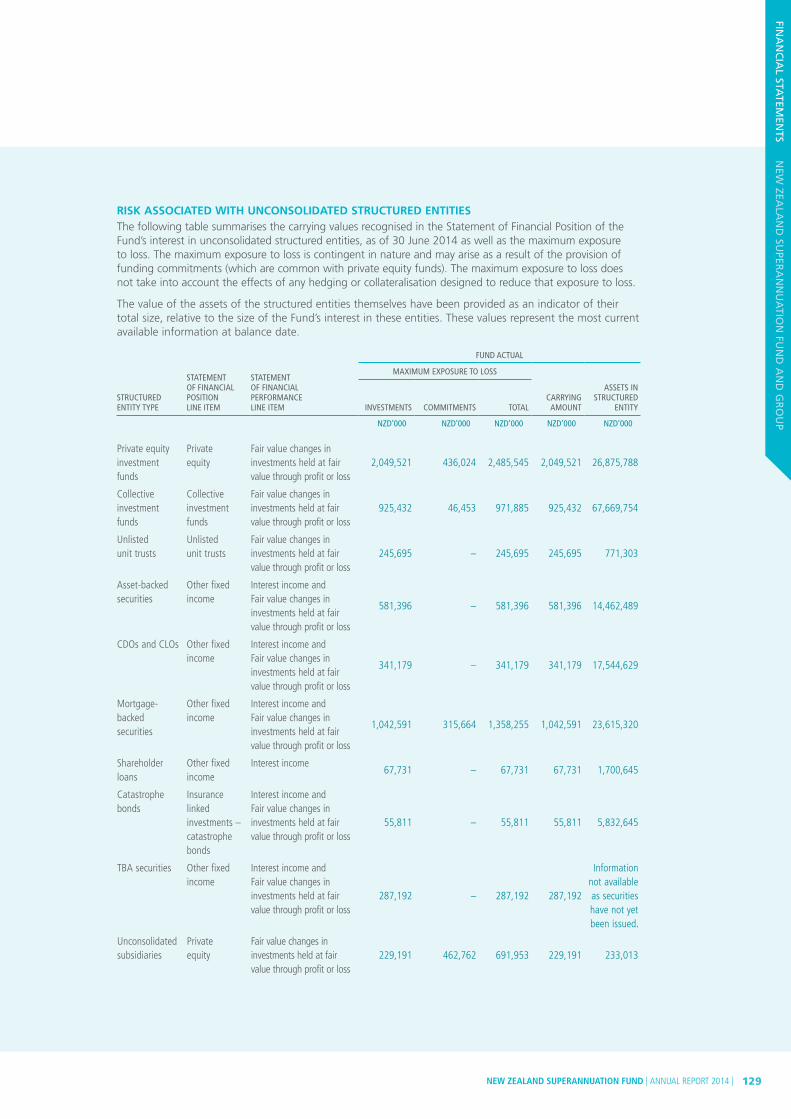
NEW ZEALAND SUPERANNUATION FUND | ANNUAL REPORT 2014 | 129
RISK ASSOCIATED WITH UNCONSOLIDATED STRUCTURED ENTITIES The following table summarises the carrying values recognised in the Statement of Financial Position of the
Fund’s interest in unconsolidated structured entities, as of 30 June 2014 as well as the maximum exposure to loss. The maximum exposure to loss is contingent in nature and may arise as a result of the provision of funding commitments (which are common with private equity funds). The maximum exposure to loss does not take into account the effects of any hedging or collateralisation designed to reduce that exposure to loss.
The value of the assets of the structured entities themselves have been provided as an indicator of their total size, relative to the size of the Fund’s interest in these entities. These values represent the most current available information at balance date.
STRUCTURED ENTITY TYPE
STATEMENT OF FINANCIAL POSITION LINE ITEM
STATEMENT OF FINANCIAL PERFORMANCE LINE ITEM
FUND ACTUAL
MAXIMUM EXPOSURE TO LOSS
INVESTMENTS COMMITMENTS TOTALCARRYING AMOUNT
ASSETS IN STRUCTURED
ENTITY
NZD’000 NZD’000 NZD’000 NZD’000 NZD’000
Private equity investment funds
Private equity
Fair value changes in investments held at fair value through profit or loss
2,049,521 436,024 2,485,545 2,049,521 26,875,788
Collective investment funds
Collective investment funds
Fair value changes in investments held at fair value through profit or loss
925,432 46,453 971,885 925,432 67,669,754
Unlisted unit trusts
Unlisted unit trusts
Fair value changes in investments held at fair value through profit or loss
245,695 – 245,695 245,695 771,303
Asset-backed securities
Other fixed income
Interest income and Fair value changes in investments held at fair value through profit or loss
581,396 – 581,396 581,396 14,462,489
CDOs and CLOs Other fixed income
Interest income and Fair value changes in investments held at fair value through profit or loss
341,179 – 341,179 341,179 17,544,629
Mortgage-backed securities
Other fixed income
Interest income and Fair value changes in investments held at fair value through profit or loss
1,042,591 315,664 1,358,255 1,042,591 23,615,320
Shareholder loans
Other fixed income
Interest income67,731 – 67,731 67,731 1,700,645
Catastrophe bonds
Insurance linked investments – catastrophe bonds
Interest income and Fair value changes in investments held at fair value through profit or loss
55,811 – 55,811 55,811 5,832,645
TBA securities Other fixed income
Interest income and Fair value changes in investments held at fair value through profit or loss
287,192 – 287,192 287,192
Information not available as securities have not yet been issued.
Unconsolidated subsidiaries
Private equity
Fair value changes in investments held at fair value through profit or loss
229,191 462,762 691,953 229,191 233,013
FINA
NC
IAL STA
TEMEN
TS N
EW ZEA
LAN
D SU
PERA
NN
UA
TION
FUN
D A
ND
GR
OU
P
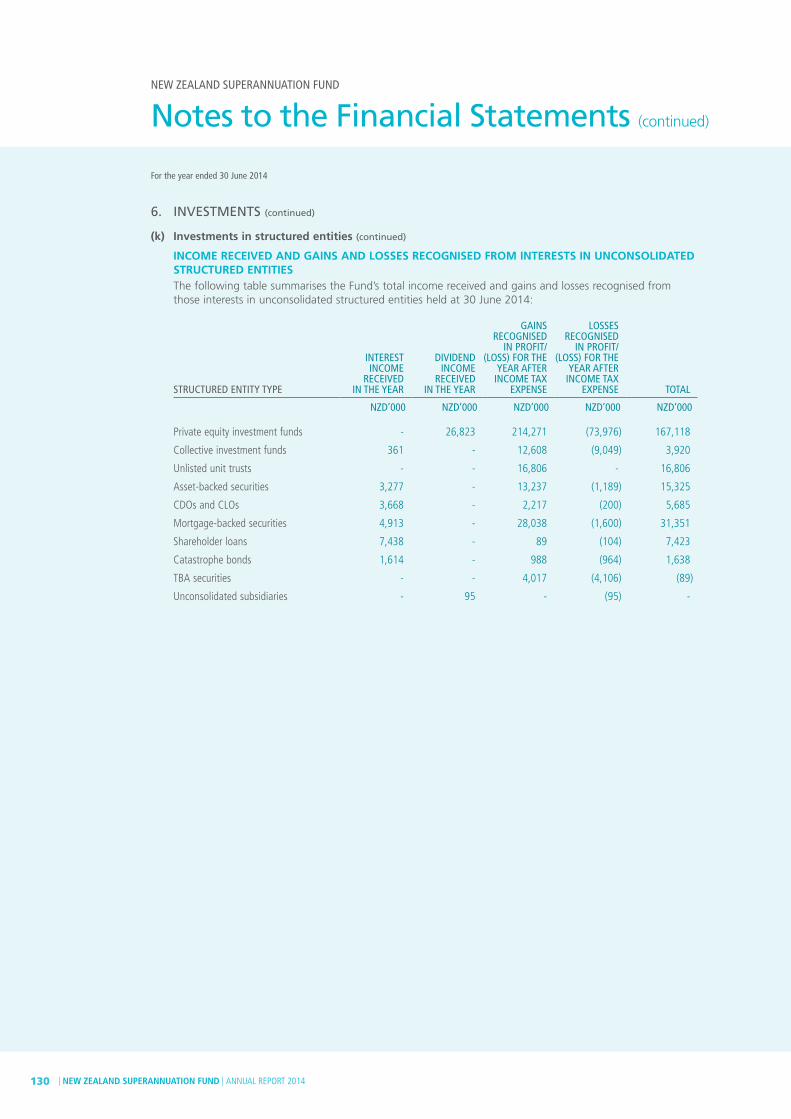
| NEW ZEALAND SUPERANNUATION FUND | ANNUAL REPORT 2014130
NEW ZEALAND SUPERANNUATION FUND
6. INVESTMENTS (continued)
(k) Investments in structured entities (continued)
INCOME RECEIVED AND GAINS AND LOSSES RECOGNISED FROM INTERESTS IN UNCONSOLIDATED STRUCTURED ENTITIESThe following table summarises the Fund’s total income received and gains and losses recognised from those interests in unconsolidated structured entities held at 30 June 2014:
STRUCTURED ENTITY TYPE
INTEREST INCOME
RECEIVED IN THE YEAR
DIVIDEND INCOME
RECEIVED IN THE YEAR
GAINS RECOGNISED
IN PROFIT/(LOSS) FOR THE
YEAR AFTER INCOME TAX
EXPENSE
LOSSES RECOGNISED
IN PROFIT/(LOSS) FOR THE
YEAR AFTER INCOME TAX
EXPENSE TOTAL
NZD’000 NZD’000 NZD’000 NZD’000 NZD’000
Private equity investment funds - 26,823 214,271 (73,976) 167,118
Collective investment funds 361 - 12,608 (9,049) 3,920
Unlisted unit trusts - - 16,806 - 16,806
Asset-backed securities 3,277 - 13,237 (1,189) 15,325
CDOs and CLOs 3,668 - 2,217 (200) 5,685
Mortgage-backed securities 4,913 - 28,038 (1,600) 31,351
Shareholder loans 7,438 - 89 (104) 7,423
Catastrophe bonds 1,614 - 988 (964) 1,638
TBA securities - - 4,017 (4,106) (89)
Unconsolidated subsidiaries - 95 - (95) -
Notes to the Financial Statements (continued)
For the year ended 30 June 2014

NEW ZEALAND SUPERANNUATION FUND | ANNUAL REPORT 2014 | 131
7. ASSETS HELD FOR SALE
The major class of assets classified as held for sale as at 30 June 2014 is as follows:
FUND ACTUAL
2014 2013
NZD’000 NZD’000
Assets
Property, plant and equipment – 750
Assets held for sale – 750
No gains or losses have been recognised on reclassification of these assets.
8. TRADE AND OTHER RECEIVABLES
FUND ACTUAL
2014 2013 (RESTATED)
NZD’000 NZD’000
Trade receivables 18,279 6,937
Allowance for impairment (210) –
Accrued interest 51,254 53,676
Dividends receivable 21,358 21,406
Unsettled sales 167,372 31,748
GST receivable 152 832
258,205 114,599
Trade receivables have standard 30-day credit terms.
The timing and amount of expected cash flows for accrued interest, dividends receivable and unsettled sales are certain as they are based on contractual terms and corporate actions. All receivables are expected to be settled within one year.
9. OTHER ASSETS
FUND ACTUAL
2014 2013
NZD’000 NZD’000
Inventory (agricultural produce) 1,139 1,026
Prepayments 4 57
1,143 1,083
FINA
NC
IAL STA
TEMEN
TS N
EW ZEA
LAN
D SU
PERA
NN
UA
TION
FUN
D A
ND
GR
OU
P

| NEW ZEALAND SUPERANNUATION FUND | ANNUAL REPORT 2014132
NEW ZEALAND SUPERANNUATION FUND
10. PROPERTY, PLANT AND EQUIPMENT
FUND ACTUAL
LAND AND LAND IMPROVEMENTS BUILDINGS
PLANT AND MACHINERY
OFFICE EQUIPMENT
COMPUTER EQUIPMENT
MOTOR VEHICLES
OFFICE FIT-OUT TOTAL
NZD’000 NZD’000 NZD’000 NZD’000 NZD’000 NZD’000 NZD’000 NZD’000
Gross carrying amount
Balance at 1 July 2012 71,461 8,171 2,174 101 775 740 1,322 84,744
Additions 25,146 2,859 892 – 78 311 12 29,298
Disposals – (6) (10) – – (104) – (120)
Transfer (to)/from assets held for sale 724 – – – – – – 724
Net revaluation increments/(decrements) (5,467) 2,229 – – – – – (3,238)
Balance at 30 June 2013 91,864 13,253 3,056 101 853 947 1,334 111,408
Additions 588 1,005 620 – 97 159 149 2,618
Disposals (2) – (37) – (158) (87) – (284)
Transfer (to)/from assets held for sale 750 – – – – – – 750
Transfer between categories (710) 710 – – – – – –
Net revaluation increments/(decrements) 16,050 218 – – – – – 16,268
Balance at 30 June 2014 108,540 15,186 3,639 101 792 1,019 1,483 130,760
Accumulated depreciation
Balance at 1 July 2012 – – 209 66 621 47 209 1,152
Depreciation expense 2 243 269 10 106 83 130 843
Depreciation recovered – – (2) – – (10) – (12)
Depreciation reversed on revaluation (2) (243) – – – – – (245)
Balance at 30 June 2013 – – 476 76 727 120 339 1,738
Depreciation expense 12 458 393 10 115 102 137 1,227
Depreciation recovered – – (6) – (158) (20) – (184)
Depreciation reversed on revaluation (12) (458) – – – – – (470)
Balance at 30 June 2014 – – 863 86 684 202 476 2,311
Net book value
As at 30 June 2013 91,864 13,253 2,580 25 126 827 995 109,670
As at 30 June 2014 108,540 15,186 2,776 15 108 817 1,007 128,449
FAIR VALUE MEASUREMENTLand and land improvements and buildings are measured at fair value. The revalued land and land improvements and buildings consist of farm properties in New Zealand. Management have determined that these constitute one class of asset under NZ IFRS 13, based on the nature, characteristics and risks of the property. All revalued land and land improvements and buildings are categorised within Level 3 of the fair value hierarchy, as set out in note 21.
Notes to the Financial Statements (continued)
For the year ended 30 June 2014

NEW ZEALAND SUPERANNUATION FUND | ANNUAL REPORT 2014 | 133
Land and land improvements and buildings have been valued by Property Advisory Limited, an independent registered valuer. The valuer uses New Zealand Valuation and Property Standards as a reference, to determine the fair value of the land and land improvements and buildings. Fair value is an estimate of the price that would be received to sell an asset in an orderly transaction between market participants at the measurement date. Fair value is determined by direct reference to recent market transactions for land and land improvements and buildings of comparable size and location as those held by the Fund, significantly adjusted for difference in the nature, location or condition of the specific property. The effective date for the valuation was 30 June 2014.
Significant unobservable valuation input:
– Price per square metre $19,400 – $56,700
Land and land improvements and buildings purchased during the year have not been independently valued at balance date. The Fund believes the purchase price paid reflects fair value at balance date.
The carrying amount of land and land improvements and buildings that would have been recognised under the cost model is $102,220,000 (2013: $101,055,000).
Refer to note 21 for further fair value disclosures.
11. INTANGIBLE ASSETS
FUND ACTUAL
COMPUTER SOFTWARE
CARBON CREDITS TOTAL
NZD’000 NZD’000 NZD’000
Gross carrying amount
Balance at 1 July 2012 3,240 – 3,240
Additions 1,426 720 2,146
Impairment loss – (1,897) (1,897)
Transfer (to)/from assets held for sale – 2,572 2,572
Balance at 30 June 2013 4,666 1,395 6,061
Additions 882 – 882
Disposals (5) (9) (14)
Net revaluation increments/(decrements) – 1,805 1,805
Balance at 30 June 2014 5,543 3,191 8,734
Accumulated amortisation
Balance at 1 July 2012 2,001 – 2,001
Amortisation expense 898 – 898
Balance at 30 June 2013 2,899 – 2,899
Amortisation expense 1,110 – 1,110
Amortisation recovered (5) – (5)
Balance at 30 June 2014 4,004 – 4,004
Net book value
As at 30 June 2013 1,767 1,395 3,162
As at 30 June 2014 1,539 3,191 4,730
Carbon credits are New Zealand Units (NZU’s) under the New Zealand Emissions Trading Scheme (ETS). The Fund owns NZU’s in relation to its forestry operations.
Carbon credits have been revalued to their estimated fair value of $4.15 per unit (2013: $1.80).
FINA
NC
IAL STA
TEMEN
TS N
EW ZEA
LAN
D SU
PERA
NN
UA
TION
FUN
D A
ND
GR
OU
P

| NEW ZEALAND SUPERANNUATION FUND | ANNUAL REPORT 2014134
NEW ZEALAND SUPERANNUATION FUND
12. TRADE AND OTHER PAYABLES
FUND ACTUAL
2014 2013 (RESTATED)
NZD’000 NZD’000
Trade payables 1,409 1,083
Accrued expenses 26,053 42,917
Unsettled purchases 746,949 677,939
Related party payable to the Guardians – current 6,831 6,108
Related party payable to the Guardians – non-current 591 136
781,833 728,183
The average credit period on trade payables is 30 days. No interest is charged on overdue balances. The Fund has financial risk management policies in place to ensure that all payables are paid within the credit time frame.
The timing and amount of expected cash flows for unsettled purchases are certain as they are based on contractual terms and corporate actions. Other than the non-current portion of the related party payable, all payables are expected to settle within one year. The related party payable will settle progressively over a four-year period.
13. PROVISION FOR PERFORMANCE-BASED FEES
FUND ACTUAL
2014 2013
NZD’000 NZD’000
Balance brought forward 499 –
New provision during the year 13,613 499
Unused provision released during the year – –
Current portion transferred to accrued expenses (499) –
Closing provision 13,613 499
Represented by:
Current – –
Non-current 13,613 499
13,613 499
Certain external investment managers earn performance-based fees once agreed hurdles have been reached. For some investment managers, the pay-out of the current year’s fee is capped, with the remainder of the fee being held by the Fund for possible pay-out in future periods. For those managers, poor performance in the following years may lead to a reduction in the entitlement that is being held. Thus, the amount and timing of the eventual pay-out is uncertain. The current portion of the performance-based fees is included in accrued expenses.
Notes to the Financial Statements (continued)
For the year ended 30 June 2014

NEW ZEALAND SUPERANNUATION FUND | ANNUAL REPORT 2014 | 135
14. AMOUNTS EXPECTED TO BE RECOVERED OR SETTLED AFTER MORE THAN 12 MONTHS
The Fund’s Statement of Financial Position is presented on a liquidity basis. Accordingly, certain line items combine amounts expected to be recovered or settled no more than 12 months after balance date and amounts expected to be recovered or settled more than 12 months after balance date. The following table sets out the amounts expected to be recovered or settled after more than 12 months:
FUND ACTUAL
2014 2013 (RESTATED)
NZD’000 NZD’000
ASSETS
Investments
Investments – derivative financial instrument assets 527,700 345,131
Investments – other financial assets 1,188,845 1,764,614
Agricultural assets 23,665 20,484
Total investments 1,740,210 2,130,229
Property, plant and equipment 128,449 109,670
Intangible assets 4,730 3,162
Total assets 1,873,389 2,243,061
LIABILITIES
Trade and other payables 591 136
Investments – derivative financial instrument liabilities 132,161 159,399
Provisions 13,613 499
Deferred tax liability 203,242 179,733
Total liabilities 349,607 339,767
Net assets 1,523,782 1,903,294
FINA
NC
IAL STA
TEMEN
TS N
EW ZEA
LAN
D SU
PERA
NN
UA
TION
FUN
D A
ND
GR
OU
P

| NEW ZEALAND SUPERANNUATION FUND | ANNUAL REPORT 2014136
NEW ZEALAND SUPERANNUATION FUND
15. MANAGEMENT OF FUND CAPITAL AND RESERVES
OBJECTIVES, POLICIES AND PROCESSES FOR MANAGING THE FUND’S CAPITALThe Fund’s ‘capital’ comprises the investments and all other assets of the Fund less any liabilities.
FUNDING – INVESTMENT CAPITALThe Fund is the property of the Crown. Its purpose is to build a portfolio of financial assets to help reduce the impact of providing retirement income, in the form of New Zealand superannuation, to an ageing population. The Crown is required to make capital contributions to the Fund in accordance with Sections 42 to 44 inclusive of the New Zealand Superannuation and Retirement Income Act 2001 (Act). The Government announced in the 2009 Budget a reduction in contributions to the Fund. Full capital contributions are projected to resume from 2020/21 under current Treasury modelling, however this may change based on future Fiscal and Economic Updates.
FUNDING – NET COST OF SUPERANNUATION ENTITLEMENTSUnder Section 45 of the Act, the Minister of Finance must ensure that sufficient money is transferred into the Fund in each financial year to meet the net cost of the superannuation entitlements that are payable out of the Fund. As no capital withdrawals are permitted from the Fund in any financial year commencing before 1 July 2020, the Minister of Finance is obliged to provide funding to meet ongoing superannuation entitlements in addition to the capital contributions paid under Section 42 of the Act. The Treasury, through the New Zealand Debt Management Office, has facilitated the flow of funding for superannuation entitlements from the Minister of Finance to the Ministry of Social Development on behalf of the Fund. The Guardians has had no control over these transfers, with The Treasury acting as agent for the Fund.
MANAGEMENT OF THE FUND’S CAPITALThe Fund is a profit-oriented entity, managed by the Guardians. The Guardians’ mandate is to invest the Fund on a prudent, commercial basis and, in doing so, ensure that the Fund is managed and administered in a manner consistent with best-practice portfolio management, maximising return without undue risk to the Fund as a whole, and avoiding prejudice to New Zealand’s reputation as a responsible member of the world community. The Fund invests the contributions from the Crown, in accordance with the Statement of Investments Policies, Standards and Procedures, which is available at www.nzsuperfund.co.nz
NATURE AND PURPOSE OF RESERVES
Asset revaluation reserveThe asset revaluation reserve is used to record increases and decreases in the fair value of land and land improvements and buildings.
Available-for-sale reserveThis reserve records movements in the fair value of available-for-sale financial assets.
Notes to the Financial Statements (continued)
For the year ended 30 June 2014
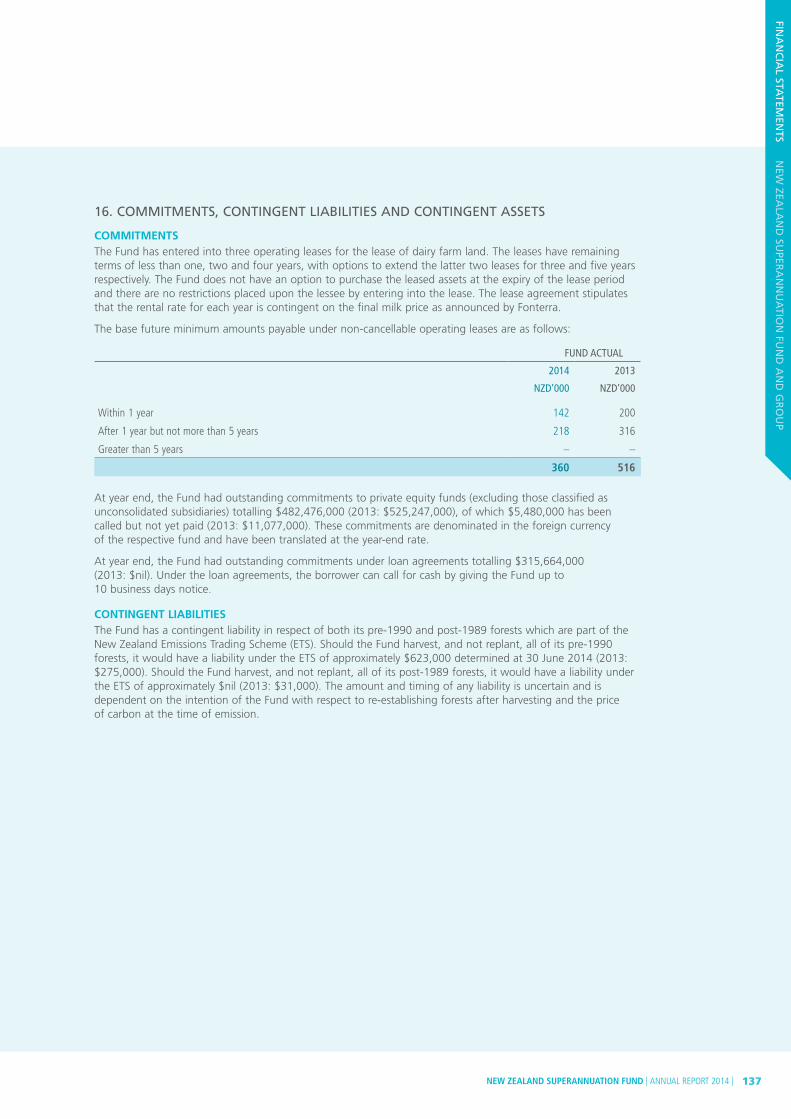
NEW ZEALAND SUPERANNUATION FUND | ANNUAL REPORT 2014 | 137
16. COMMITMENTS, CONTINGENT LIABILITIES AND CONTINGENT ASSETS
COMMITMENTSThe Fund has entered into three operating leases for the lease of dairy farm land. The leases have remaining terms of less than one, two and four years, with options to extend the latter two leases for three and five years respectively. The Fund does not have an option to purchase the leased assets at the expiry of the lease period and there are no restrictions placed upon the lessee by entering into the lease. The lease agreement stipulates that the rental rate for each year is contingent on the final milk price as announced by Fonterra.
The base future minimum amounts payable under non-cancellable operating leases are as follows:
FUND ACTUAL
2014 2013
NZD’000 NZD’000
Within 1 year 142 200
After 1 year but not more than 5 years 218 316
Greater than 5 years – –
360 516
At year end, the Fund had outstanding commitments to private equity funds (excluding those classified as unconsolidated subsidiaries) totalling $482,476,000 (2013: $525,247,000), of which $5,480,000 has been called but not yet paid (2013: $11,077,000). These commitments are denominated in the foreign currency of the respective fund and have been translated at the year-end rate.
At year end, the Fund had outstanding commitments under loan agreements totalling $315,664,000 (2013: $nil). Under the loan agreements, the borrower can call for cash by giving the Fund up to 10 business days notice.
CONTINGENT LIABILITIESThe Fund has a contingent liability in respect of both its pre-1990 and post-1989 forests which are part of the New Zealand Emissions Trading Scheme (ETS). Should the Fund harvest, and not replant, all of its pre-1990 forests, it would have a liability under the ETS of approximately $623,000 determined at 30 June 2014 (2013: $275,000). Should the Fund harvest, and not replant, all of its post-1989 forests, it would have a liability under the ETS of approximately $nil (2013: $31,000). The amount and timing of any liability is uncertain and is dependent on the intention of the Fund with respect to re-establishing forests after harvesting and the price of carbon at the time of emission.
FINA
NC
IAL STA
TEMEN
TS N
EW ZEA
LAN
D SU
PERA
NN
UA
TION
FUN
D A
ND
GR
OU
P
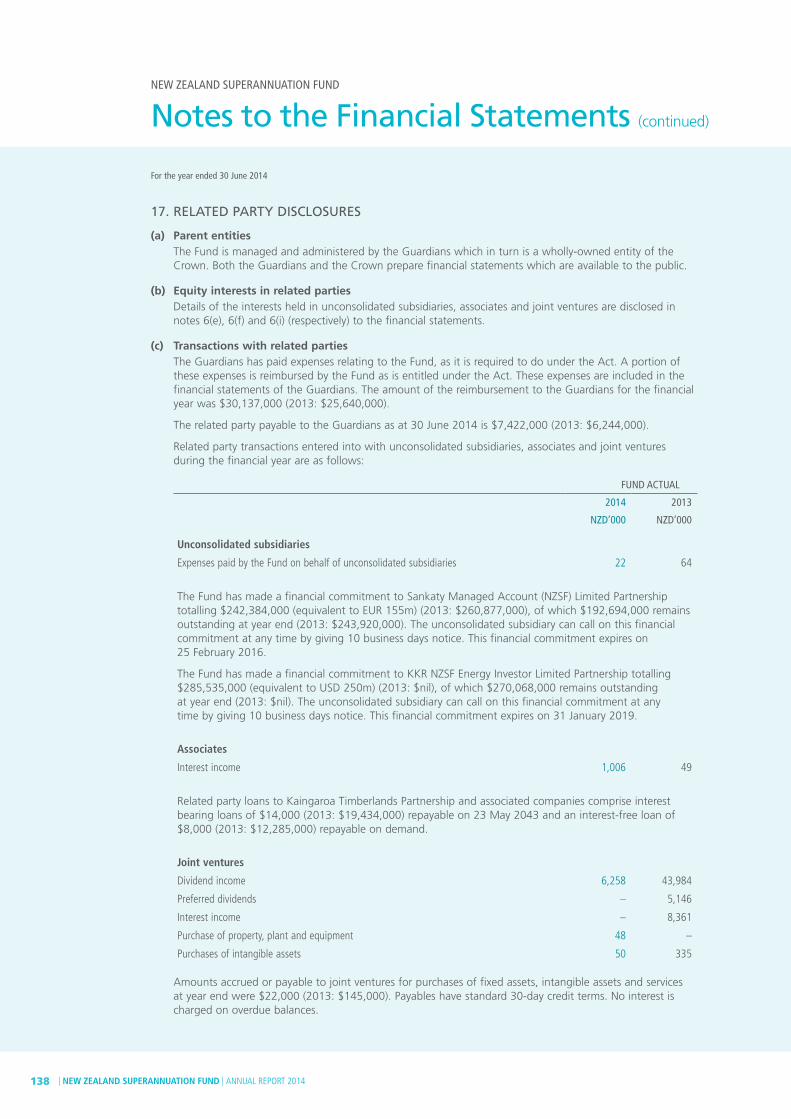
| NEW ZEALAND SUPERANNUATION FUND | ANNUAL REPORT 2014138
NEW ZEALAND SUPERANNUATION FUND
17. RELATED PARTY DISCLOSURES
(a) Parent entities The Fund is managed and administered by the Guardians which in turn is a wholly-owned entity of the
Crown. Both the Guardians and the Crown prepare financial statements which are available to the public.
(b) Equity interests in related parties Details of the interests held in unconsolidated subsidiaries, associates and joint ventures are disclosed in
notes 6(e), 6(f) and 6(i) (respectively) to the financial statements.
(c) Transactions with related parties The Guardians has paid expenses relating to the Fund, as it is required to do under the Act. A portion of
these expenses is reimbursed by the Fund as is entitled under the Act. These expenses are included in the financial statements of the Guardians. The amount of the reimbursement to the Guardians for the financial year was $30,137,000 (2013: $25,640,000).
The related party payable to the Guardians as at 30 June 2014 is $7,422,000 (2013: $6,244,000).
Related party transactions entered into with unconsolidated subsidiaries, associates and joint ventures during the financial year are as follows:
FUND ACTUAL
2014 2013
NZD’000 NZD’000
Unconsolidated subsidiaries
Expenses paid by the Fund on behalf of unconsolidated subsidiaries 22 64
The Fund has made a financial commitment to Sankaty Managed Account (NZSF) Limited Partnership totalling $242,384,000 (equivalent to EUR 155m) (2013: $260,877,000), of which $192,694,000 remains outstanding at year end (2013: $243,920,000). The unconsolidated subsidiary can call on this financial commitment at any time by giving 10 business days notice. This financial commitment expires on 25 February 2016.
The Fund has made a financial commitment to KKR NZSF Energy Investor Limited Partnership totalling $285,535,000 (equivalent to USD 250m) (2013: $nil), of which $270,068,000 remains outstanding at year end (2013: $nil). The unconsolidated subsidiary can call on this financial commitment at any time by giving 10 business days notice. This financial commitment expires on 31 January 2019.
Associates
Interest income 1,006 49
Related party loans to Kaingaroa Timberlands Partnership and associated companies comprise interest bearing loans of $14,000 (2013: $19,434,000) repayable on 23 May 2043 and an interest-free loan of $8,000 (2013: $12,285,000) repayable on demand.
Joint ventures
Dividend income 6,258 43,984
Preferred dividends – 5,146
Interest income – 8,361
Purchase of property, plant and equipment 48 –
Purchases of intangible assets 50 335
Amounts accrued or payable to joint ventures for purchases of fixed assets, intangible assets and services at year end were $22,000 (2013: $145,000). Payables have standard 30-day credit terms. No interest is charged on overdue balances.
Notes to the Financial Statements (continued)
For the year ended 30 June 2014

NEW ZEALAND SUPERANNUATION FUND | ANNUAL REPORT 2014 | 139
Transactions with Government-related entities The Fund transacts with the New Zealand Debt Management Office (NZDMO) for a portion of its foreign
exchange contracts and cross currency swaps. The rates at which the Fund transacts are negotiated with the NZDMO. The fair value of outstanding contracts at year end was an asset of $387,407,000 (2013: asset $324,373,000). Gains on contracts with the NZDMO recognised as profit in the Statement of Comprehensive Income for the year were $253,248,000 (2013: gains $16,697,000).
The Fund has invested a proportion of its assets in fixed income securities issued by the New Zealand Government. These are detailed in note 6. Interest income earned from these investments for the year was $1,570,000 (2013: $412,000).
On 30 October 2013 the Fund purchased 20,785,000 newly issued shares in Meridian Energy Limited, a state-owned entity, for $20,785,000. As at the year end, the Fund held 50,869,000 shares in Meridian Energy Limited, valued at $63,078,000. Dividend income earned during the year from holdings in this entity amounted to $1,747,000.
On 25 November 2013 the Fund purchased 11,057,000 shares in Air New Zealand from the Crown for $18,244,000. As at the year end, the Fund held 7,732,000 shares in Air New Zealand, valued at $16,082,000. Dividend income earned during the year from holdings in this entity amounted to $1,298,000 (2013: $649,000).
On 16 April 2014 the Fund purchased 6,295,000 newly issued shares in Genesis Energy Limited, a state-owned entity, for $9,757,000. As at the year end, the Fund held 7,665,000 shares in Genesis Energy Limited, valued at $13,798,000.
As at the year end, the Fund held 15,933,000 (2013: 15,144,000) shares in Mighty River Power Limited, a state-owned entity, valued at $35,611,000 (2013: $33,478,000). Dividend income earned during the year from holdings in this entity amounted to $1,860,000 (2013: $nil).
The Fund places cash on deposit with Kiwibank Limited, a Government-related entity. The balance on deposit at year end was $225,000,000 (2013: $250,000,000). Interest income earned on Kiwibank deposits for the year was $8,427,000 (2013: $9,671,000).
18. SUBSEQUENT EVENTS
There were no reportable events subsequent to year end.
19. NOTES TO THE STATEMENT OF CASH FLOWS
(a) Reconciliation of cash and cash equivalents
For the purposes of the Statement of Cash Flows, cash and cash equivalents includes cash balances on hand, held in bank accounts, demand deposits and other highly liquid investments. Cash and cash equivalents at the end of the financial year as shown in the Statement of Cash Flows is reconciled to the related items in the Statement of Financial Position as follows:
FUND ACTUAL
2014 2013 (RESTATED)
NZD’000 NZD’000
Cash and cash equivalents 3,759,673 5,625,397
At balance date, cash of $149,660,000 (2013: $335,109,000) had been allocated and was held in Northern Trust’s (the Fund’s Global Master Custodian) custody awaiting investment by investment managers.
(b) Restrictions
For restrictions on cash balances pledged as collateral, refer to note 22.
FINA
NC
IAL STA
TEMEN
TS N
EW ZEA
LAN
D SU
PERA
NN
UA
TION
FUN
D A
ND
GR
OU
P

| NEW ZEALAND SUPERANNUATION FUND | ANNUAL REPORT 2014140
NEW ZEALAND SUPERANNUATION FUND
19. NOTES TO THE STATEMENT OF CASH FLOWS (continued)
(c) Reconciliation of profit for the year to net cash flows from operating activities
FUND ACTUAL
2014
2013 (RESTATED)
NZD’000 NZD’000
Profit for the year after income tax expense 3,251,895 3,822,724
Add/(Deduct) non-cash items:
Depreciation and amortisation of non-current assets 2,337 1,741
Loss on revaluation of property, plant and equipment 693 2,963
Impairment loss on intangible assets (1,805) 1,897
Fair value changes in forests 35,418 6,608
Fair value changes in livestock (3,411) 2,152
Fair value changes in investments (3,988,299) (3,871,071)
Net foreign exchange (gain)/loss 207,418 (532,242)
Increase in deferred tax balances 23,509 19,779
Other non-cash items (1,228) 9,654
Add items classified as investing activities:
Loss on disposal of property, plant and equipment 84 17,982
Changes in working capital:
(Increase)/Decrease in assets:
Trade and other receivables (143,606) 2,128
Other assets (60) 229
Increase in liabilities:
Trade and other payables 53,650 545,032
Provisions 13,114 499
Increase in current tax balances 160,421 115,415
Add/(Deduct) changes in net assets and liabilities related to operating cash flows not included in net profit:
Unsettled sales 135,624 3,416
Unsettled purchases (69,010) (526,593)
Add net operating cash flows not included in net profit (i) (1,480,420) 3,209,188
Net cash provided by/(used in) operating activities (1,803,676) 2,831,501
(i) Net operating cash flows not included in net profit is primarily comprised of the cash flows arising from the sale and purchase of investments and the net movement in cash collateral.
Notes to the Financial Statements (continued)
For the year ended 30 June 2014

NEW ZEALAND SUPERANNUATION FUND | ANNUAL REPORT 2014 | 141
20. FINANCIAL INSTRUMENTS
(a) Financial assets and financial liabilities by categoryKey: H4T: At fair value through profit or loss – Held for trading A4S: Available-for-sale Designated at FVTPL: Designated at fair value through profit or loss AC: Amortised cost L&R: Loans and receivables
FUND ACTUAL
2014 H4TDESIGNATED
AT FVTPL L&R A4S AC TOTAL
NZD’000 NZD’000 NZD’000 NZD’000 NZD’000 NZD’000
Financial assets
Cash and cash equivalents 3,759,673 3,759,673
Cash pledged as collateral 171,204 171,204
Trade and other receivables 258,205 258,205
– – 4,189,082 – – 4,189,082
Investments
Investments – derivative financial instrument assets:
Forward foreign exchange contracts 151,251 151,251
Cross currency swaps 419,423 419,423
Volatility swaps – –
Longevity contingent swaps 85,368 85,368
Futures contracts – –
Total return swaps – equity 302,188 302,188
Total return swaps – bonds 3,760 3,760
Credit default swaps 204,272 204,272
Insurance-linked swaps 690 690
Interest rate swaps 5,031 5,031
Other OTC swaps 71 71
Total derivative financial instrument assets 1,172,054 – – – – 1,172,054
Investments – other financial assets:
Equities
New Zealand equities – State-Owned Entities 128,569 128,569
New Zealand equities – Other 1,565,214 1,565,214
Global equities 9,251,816 9,251,816
Total equities – 10,945,599 – – – 10,945,599
Fixed income
Other fixed income 6,657,979 522,725 7,180,704
Total fixed income – 6,657,979 522,725 – – 7,180,704
Collective investment funds 925,432 925,432
Reverse repurchase agreements 171,321 171,321
Insurance-linked investments – catastrophe bonds 55,811 55,811
Private equity 2,577,330 81,427 2,658,757
Unlisted unit trusts 245,695 245,695
– 3,804,268 171,321 81,427 – 4,057,016
Total investments 1,172,054 21,407,846 694,046 81,427 – 23,355,373
Investments in unconsolidated subsidiaries 229,191 229,191
Other financial assets pledged as collateral 57,831 57,831
Total financial assets 1,172,054 21,694,868 4,883,128 81,427 – 27,831,477
FINA
NC
IAL STA
TEMEN
TS N
EW ZEA
LAN
D SU
PERA
NN
UA
TION
FUN
D A
ND
GR
OU
P
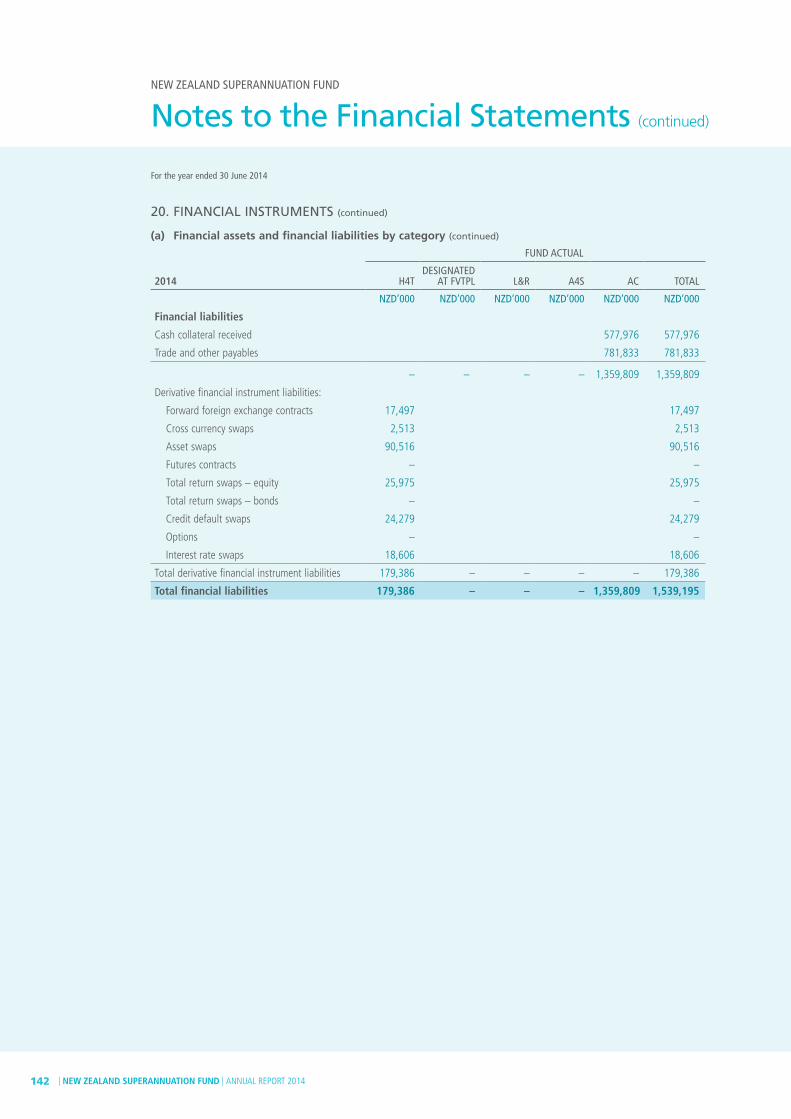
| NEW ZEALAND SUPERANNUATION FUND | ANNUAL REPORT 2014142
NEW ZEALAND SUPERANNUATION FUND
FUND ACTUAL
2014 H4TDESIGNATED
AT FVTPL L&R A4S AC TOTAL
NZD’000 NZD’000 NZD’000 NZD’000 NZD’000 NZD’000
Financial liabilities
Cash collateral received 577,976 577,976
Trade and other payables 781,833 781,833
– – – – 1,359,809 1,359,809
Derivative financial instrument liabilities:
Forward foreign exchange contracts 17,497 17,497
Cross currency swaps 2,513 2,513
Asset swaps 90,516 90,516
Futures contracts – –
Total return swaps – equity 25,975 25,975
Total return swaps – bonds – –
Credit default swaps 24,279 24,279
Options – –
Interest rate swaps 18,606 18,606
Total derivative financial instrument liabilities 179,386 – – – – 179,386
Total financial liabilities 179,386 – – – 1,359,809 1,539,195
20. FINANCIAL INSTRUMENTS (continued)
(a) Financial assets and financial liabilities by category (continued)
Notes to the Financial Statements (continued)
For the year ended 30 June 2014
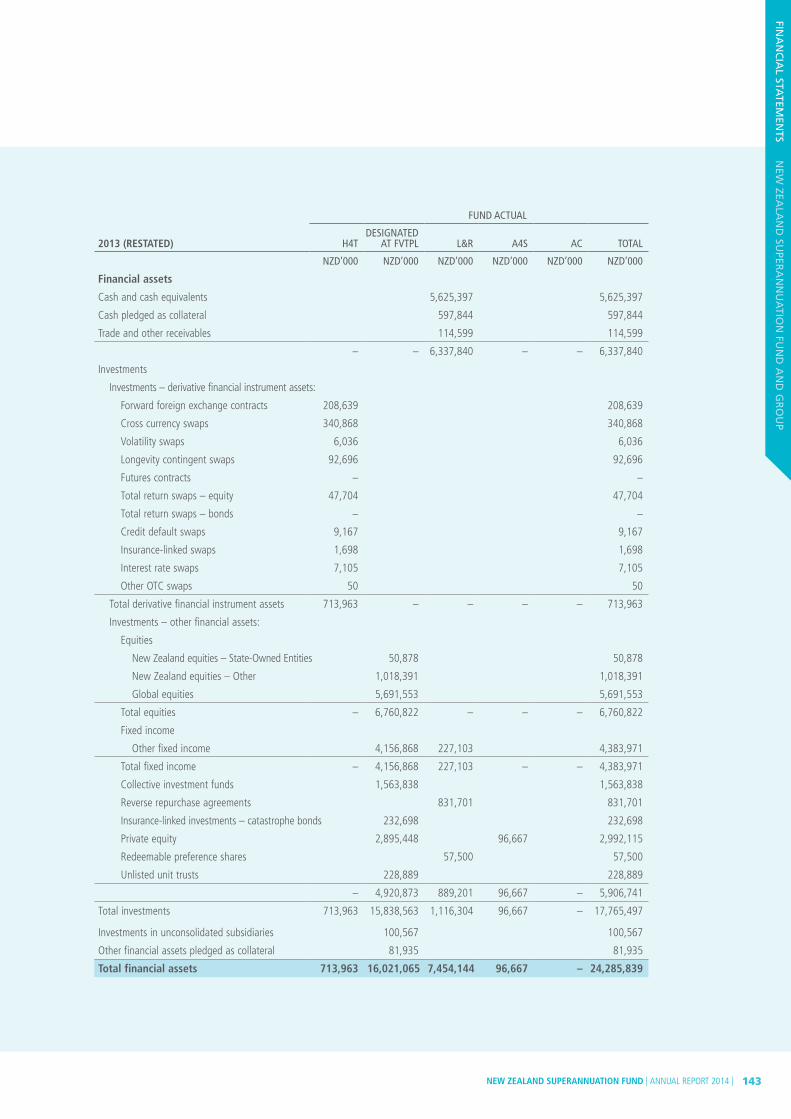
NEW ZEALAND SUPERANNUATION FUND | ANNUAL REPORT 2014 | 143
FUND ACTUAL
2013 (RESTATED) H4TDESIGNATED
AT FVTPL L&R A4S AC TOTAL
NZD’000 NZD’000 NZD’000 NZD’000 NZD’000 NZD’000
Financial assets
Cash and cash equivalents 5,625,397 5,625,397
Cash pledged as collateral 597,844 597,844
Trade and other receivables 114,599 114,599
– – 6,337,840 – – 6,337,840
Investments
Investments – derivative financial instrument assets:
Forward foreign exchange contracts 208,639 208,639
Cross currency swaps 340,868 340,868
Volatility swaps 6,036 6,036
Longevity contingent swaps 92,696 92,696
Futures contracts – –
Total return swaps – equity 47,704 47,704
Total return swaps – bonds – –
Credit default swaps 9,167 9,167
Insurance-linked swaps 1,698 1,698
Interest rate swaps 7,105 7,105
Other OTC swaps 50 50
Total derivative financial instrument assets 713,963 – – – – 713,963
Investments – other financial assets:
Equities
New Zealand equities – State-Owned Entities 50,878 50,878
New Zealand equities – Other 1,018,391 1,018,391
Global equities 5,691,553 5,691,553
Total equities – 6,760,822 – – – 6,760,822
Fixed income
Other fixed income 4,156,868 227,103 4,383,971
Total fixed income – 4,156,868 227,103 – – 4,383,971
Collective investment funds 1,563,838 1,563,838
Reverse repurchase agreements 831,701 831,701
Insurance-linked investments – catastrophe bonds 232,698 232,698
Private equity 2,895,448 96,667 2,992,115
Redeemable preference shares 57,500 57,500
Unlisted unit trusts 228,889 228,889
– 4,920,873 889,201 96,667 – 5,906,741
Total investments 713,963 15,838,563 1,116,304 96,667 – 17,765,497
Investments in unconsolidated subsidiaries 100,567 100,567
Other financial assets pledged as collateral 81,935 81,935
Total financial assets 713,963 16,021,065 7,454,144 96,667 – 24,285,839
FINA
NC
IAL STA
TEMEN
TS N
EW ZEA
LAN
D SU
PERA
NN
UA
TION
FUN
D A
ND
GR
OU
P

| NEW ZEALAND SUPERANNUATION FUND | ANNUAL REPORT 2014144
NEW ZEALAND SUPERANNUATION FUND
FUND ACTUAL
2013 (RESTATED) H4TDESIGNATED
AT FVTPL L&R A4S AC TOTAL
NZD’000 NZD’000 NZD’000 NZD’000 NZD’000 NZD’000
Financial liabilities
Cash collateral received 81,419 81,419
Trade and other payables 728,183 728,183
– – – – 809,602 809,602
Derivative financial instrument liabilities:
Forward foreign exchange contracts 281,873 281,873
Cross currency swaps 34,462 34,462
Asset swaps 107,882 107,882
Future contracts – –
Total return swaps – equity 200,493 200,493
Total return swaps – bonds 4,997 4,997
Credit default swaps 13,020 13,020
Options 3,541 3,541
Interest rate swaps 7,646 7,646
Total derivative financial instrument liabilities 653,914 – – – – 653,914
Total financial liabilities 653,914 – – – 809,602 1,463,516
(b) Financial risk management objectives Through its activities, the Fund is exposed to
the financial risks of market risk, credit risk and liquidity risk.
The Guardians has established investment policies, standards and procedures to manage the Fund’s exposure to financial risks. The Guardians manages the risks by adopting an appropriate risk profile that is commensurate with the return objective and time horizon of the Fund, avoiding concentration of risk by: ensuring there is adequate diversification between and within asset classes and geographically; careful selection and monitoring of managers to ensure the Guardians has sufficient conviction that each manager will maximise the probability that return expectations for each asset class will be met and to ensure that there are no unintended biases away from the intended investment strategy; and rigorous measurement and management of market risk.
In addition, the Guardians has imposed constraints on the portfolio which specify a minimum level of liquidity to be held and limit the amount of capital that can be allocated to a single asset, a single investment manager, and to each active investment opportunity.
Management monitors and manages the financial risks relating to the Fund’s operations through internal risk reports that analyse exposures by degree and magnitude of risks. These risks include market risk (which includes currency risk, interest rate risk, and equity price risk), credit risk and liquidity risk. Management reports regularly to the Board of the Guardians and the Audit Committee.
The Fund is also exposed to operational risks such as custody risk. Custody risk is the risk of loss of securities held in custody occasioned by the insolvency or negligence of the custodian. Although an appropriate legal framework is in place that reduces the risk of loss of value of the securities held by the custodian, in event of its failure, the ability of the Fund to transfer securities might be temporarily impaired.
20. FINANCIAL INSTRUMENTS (continued)
(a) Financial assets and financial liabilities by category (continued)
Notes to the Financial Statements (continued)
For the year ended 30 June 2014

NEW ZEALAND SUPERANNUATION FUND | ANNUAL REPORT 2014 | 145
(c) Derivatives The use of derivatives is governed by the
Guardians’ investment policies, which provide written principles on the use of derivatives. Compliance with policies and exposure limits is reviewed by the Guardians on a continuous basis.
Derivatives may be used to: manage risk or hedge against movements in interest rates, values or prices in relation to permitted investments and movements in foreign currency exposures held within the Fund; achieve or reduce exposure to assets, all or part of any asset class and foreign currency; and ensure transactional efficiency or reduce the transactional cost of achieving required exposures.
At balance date, the Fund has positions in the following types of derivatives:
Forwards and futures Forward and futures contracts are contractual
agreements to buy or sell a specified financial instrument at a specific price and date in the future. Forwards are customised contracts transacted in the Over-The-Counter (OTC) market. Futures contracts are transacted in standardised amounts on regulated exchanges and are subject to daily cash margin requirements.
The main differences in the risk associated with forward and futures contracts are credit risk and liquidity risk. The Fund has credit exposure to the counterparties of forward contracts. The credit risk related to futures contracts is considered minimal because the exchange reduces credit risk by daily margining. Forward contracts are settled gross and, therefore, considered to bear a higher liquidity risk than the futures contracts which are settled on a net basis. Both types of contracts result in market risk exposure.
Swaps Swaps are contractual agreements between two
parties to exchange streams of payments over time based on specified notional amounts. Where swap contracts are settled net, the payment flows are usually netted against each other, with the difference being paid by one party to the other. All swaps other than cross currency swaps are settled net. In a cross currency swap, the Fund pays a specified amount in one currency and receives a specified amount in another currency. Swap contracts expose the Fund to counterparty credit risk, market risk and liquidity risk.
Options Options are contractual agreements that
convey the right, but not the obligation, for the purchaser either to buy or sell a specific amount of a financial instrument at a fixed price, either at a fixed future date or at any time within a specified period.
The Fund purchases and sells put and call options through regulated exchanges and OTC markets. The Fund is exposed to credit risk on purchased options only to the extent of their carrying amount, which is their fair value. Options are generally settled on a net basis.
FINA
NC
IAL STA
TEMEN
TS N
EW ZEA
LAN
D SU
PERA
NN
UA
TION
FUN
D A
ND
GR
OU
P
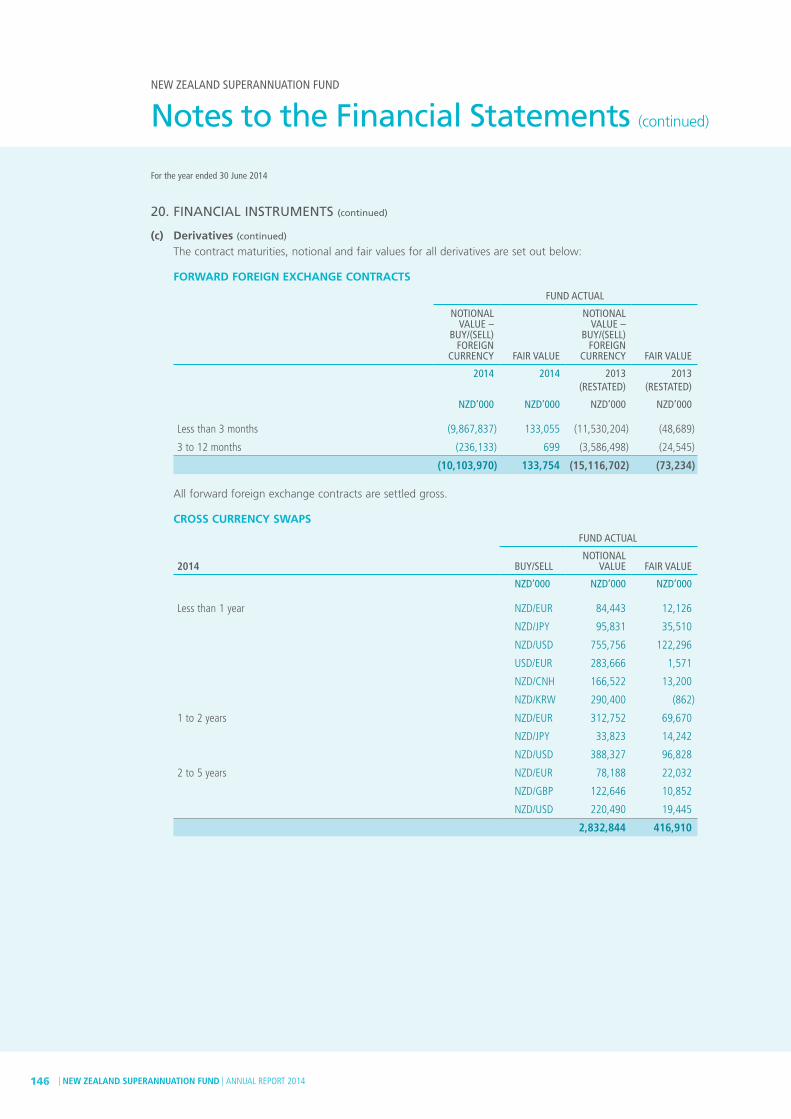
| NEW ZEALAND SUPERANNUATION FUND | ANNUAL REPORT 2014146
NEW ZEALAND SUPERANNUATION FUND
20. FINANCIAL INSTRUMENTS (continued)
(c) Derivatives (continued)
The contract maturities, notional and fair values for all derivatives are set out below:
FORWARD FOREIGN EXCHANGE CONTRACTS
FUND ACTUAL
NOTIONALVALUE –
BUY/(SELL) FOREIGN
CURRENCY FAIR VALUE
NOTIONALVALUE –
BUY/(SELL) FOREIGN
CURRENCY FAIR VALUE
2014 2014 2013 (RESTATED)
2013 (RESTATED)
NZD’000 NZD’000 NZD’000 NZD’000
Less than 3 months (9,867,837) 133,055 (11,530,204) (48,689)
3 to 12 months (236,133) 699 (3,586,498) (24,545)
(10,103,970) 133,754 (15,116,702) (73,234)
All forward foreign exchange contracts are settled gross.
CROSS CURRENCY SWAPS
FUND ACTUAL
2014 BUY/SELLNOTIONAL
VALUE FAIR VALUE
NZD’000 NZD’000 NZD’000
Less than 1 year NZD/EUR 84,443 12,126
NZD/JPY 95,831 35,510
NZD/USD 755,756 122,296
USD/EUR 283,666 1,571
NZD/CNH 166,522 13,200
NZD/KRW 290,400 (862)
1 to 2 years NZD/EUR 312,752 69,670
NZD/JPY 33,823 14,242
NZD/USD 388,327 96,828
2 to 5 years NZD/EUR 78,188 22,032
NZD/GBP 122,646 10,852
NZD/USD 220,490 19,445
2,832,844 416,910
Notes to the Financial Statements (continued)
For the year ended 30 June 2014

NEW ZEALAND SUPERANNUATION FUND | ANNUAL REPORT 2014 | 147
FUND ACTUAL
2013 BUY/SELLNOTIONAL
VALUE FAIR VALUE
NZD’000 NZD’000 NZD’000
Less than 1 year NZD/AUD 136,299 12,729
NZD/EUR 168,309 32,305
NZD/GBP 155,971 22,126
NZD/USD 332,270 43,321
1 to 2 years NZD/EUR 90,887 5,727
NZD/JPY 110,798 20,336
NZD/USD 842,810 34,162
USD/JPY 912,451 910
USD/EUR 305,312 1,477
2 to 5 years NZD/EUR 420,772 60,123
NZD/GBP 123,336 9,682
NZD/JPY 39,105 8,839
NZD/USD 581,380 55,459
USD/EUR 388,248 (790)
4,607,948 306,406
All cross currency swaps are settled gross. Notional value is derived from the buy legs of these contracts.
ASSET SWAPS
FUND ACTUAL
NOTIONALVALUE FAIR VALUE
NOTIONALVALUE FAIR VALUE
2014 2014 2013 2013
NZD’000 NZD’000 NZD’000 NZD’000
Less than 1 year 60,442 (445) 78,555 (2,115)
1 to 2 years 80,851 (462) 65,382 (652)
2 to 5 years 78,188 (15,351) 372,953 (32,015)
5 to 10 years 156,376 (70,524) 168,309 (73,100)
Over 10 years 26,950 (3,734) – –
402,807 (90,516) 685,199 (107,882)
All asset swaps are settled net.
VOLATILITY SWAPS
FUND ACTUAL
VEGA NOTIONAL
VALUE FAIR VALUE
VEGA NOTIONAL
VALUE FAIR VALUE
2014 2014 2013 2013
NZD’000 NZD’000 NZD’000 NZD’000
5 to 10 years – – 1,295 6,036
– – 1,295 6,036
All volatility swaps are settled net.
FINA
NC
IAL STA
TEMEN
TS N
EW ZEA
LAN
D SU
PERA
NN
UA
TION
FUN
D A
ND
GR
OU
P
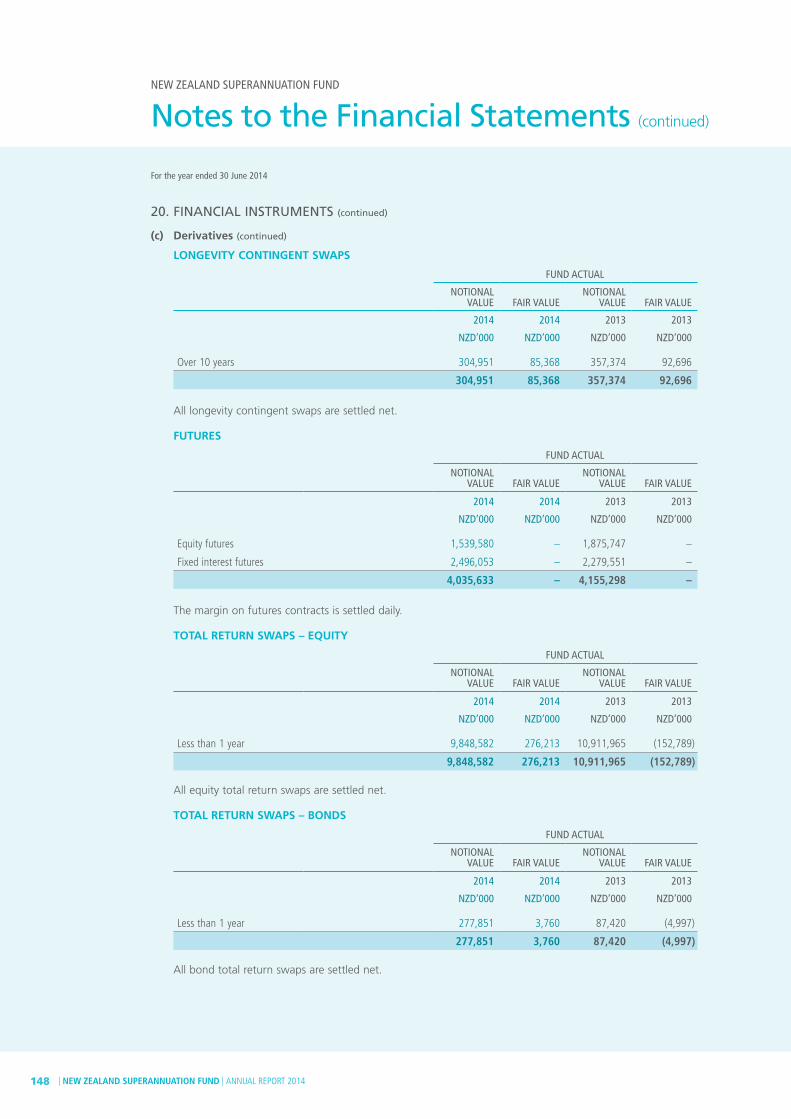
| NEW ZEALAND SUPERANNUATION FUND | ANNUAL REPORT 2014148
NEW ZEALAND SUPERANNUATION FUND
20. FINANCIAL INSTRUMENTS (continued)
(c) Derivatives (continued)
LONGEVITY CONTINGENT SWAPS
FUND ACTUAL
NOTIONALVALUE FAIR VALUE
NOTIONALVALUE FAIR VALUE
2014 2014 2013 2013
NZD’000 NZD’000 NZD’000 NZD’000
Over 10 years 304,951 85,368 357,374 92,696
304,951 85,368 357,374 92,696
All longevity contingent swaps are settled net.
FUTURES
FUND ACTUAL
NOTIONALVALUE FAIR VALUE
NOTIONALVALUE FAIR VALUE
2014 2014 2013 2013
NZD’000 NZD’000 NZD’000 NZD’000
Equity futures 1,539,580 – 1,875,747 –
Fixed interest futures 2,496,053 – 2,279,551 –
4,035,633 – 4,155,298 –
The margin on futures contracts is settled daily.
TOTAL RETURN SWAPS – EQUITY
FUND ACTUAL
NOTIONALVALUE FAIR VALUE
NOTIONALVALUE FAIR VALUE
2014 2014 2013 2013
NZD’000 NZD’000 NZD’000 NZD’000
Less than 1 year 9,848,582 276,213 10,911,965 (152,789)
9,848,582 276,213 10,911,965 (152,789)
All equity total return swaps are settled net.
TOTAL RETURN SWAPS – BONDS
FUND ACTUAL
NOTIONALVALUE FAIR VALUE
NOTIONALVALUE FAIR VALUE
2014 2014 2013 2013
NZD’000 NZD’000 NZD’000 NZD’000
Less than 1 year 277,851 3,760 87,420 (4,997)
277,851 3,760 87,420 (4,997)
All bond total return swaps are settled net.
Notes to the Financial Statements (continued)
For the year ended 30 June 2014
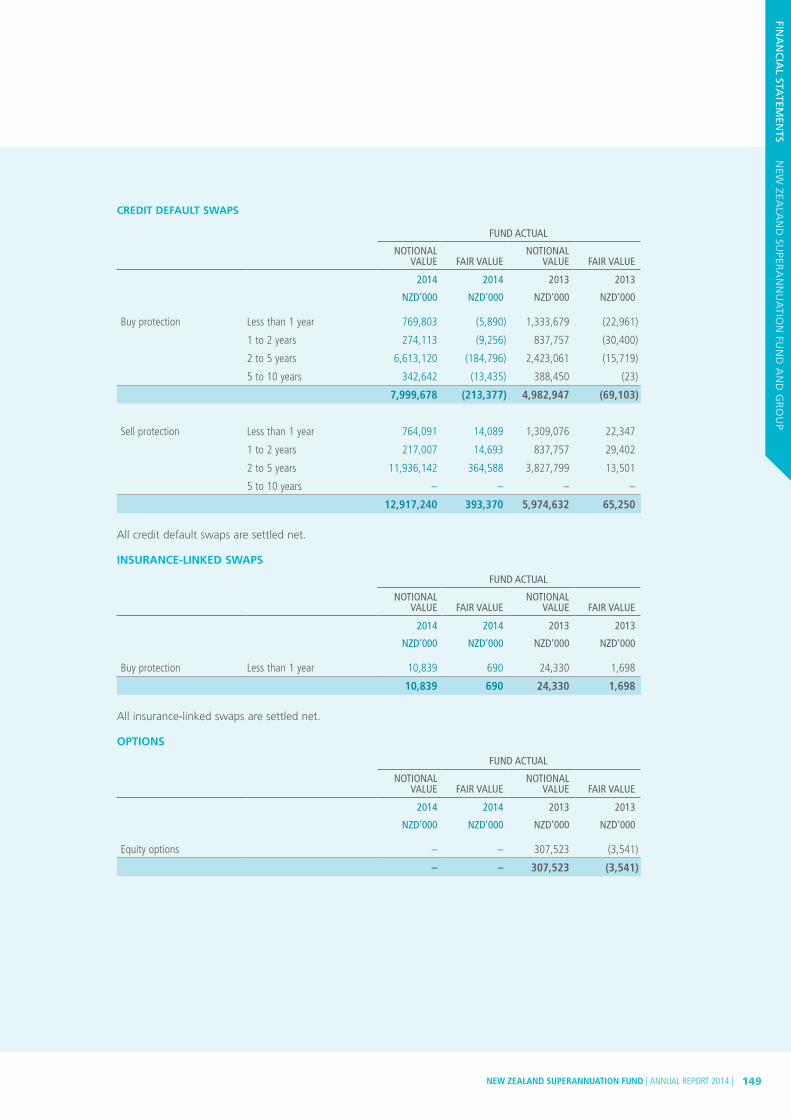
NEW ZEALAND SUPERANNUATION FUND | ANNUAL REPORT 2014 | 149
CREDIT DEFAULT SWAPS
FUND ACTUAL
NOTIONALVALUE FAIR VALUE
NOTIONALVALUE FAIR VALUE
2014 2014 2013 2013
NZD’000 NZD’000 NZD’000 NZD’000
Buy protection Less than 1 year 769,803 (5,890) 1,333,679 (22,961)
1 to 2 years 274,113 (9,256) 837,757 (30,400)
2 to 5 years 6,613,120 (184,796) 2,423,061 (15,719)
5 to 10 years 342,642 (13,435) 388,450 (23)
7,999,678 (213,377) 4,982,947 (69,103)
Sell protection Less than 1 year 764,091 14,089 1,309,076 22,347
1 to 2 years 217,007 14,693 837,757 29,402
2 to 5 years 11,936,142 364,588 3,827,799 13,501
5 to 10 years – – – –
12,917,240 393,370 5,974,632 65,250
All credit default swaps are settled net.
INSURANCE-LINKED SWAPS
FUND ACTUAL
NOTIONALVALUE FAIR VALUE
NOTIONALVALUE FAIR VALUE
2014 2014 2013 2013
NZD’000 NZD’000 NZD’000 NZD’000
Buy protection Less than 1 year 10,839 690 24,330 1,698
10,839 690 24,330 1,698
All insurance-linked swaps are settled net.
OPTIONS
FUND ACTUAL
NOTIONALVALUE FAIR VALUE
NOTIONALVALUE FAIR VALUE
2014 2014 2013 2013
NZD’000 NZD’000 NZD’000 NZD’000
Equity options – – 307,523 (3,541)
– – 307,523 (3,541)
FINA
NC
IAL STA
TEMEN
TS N
EW ZEA
LAN
D SU
PERA
NN
UA
TION
FUN
D A
ND
GR
OU
P

| NEW ZEALAND SUPERANNUATION FUND | ANNUAL REPORT 2014150
NEW ZEALAND SUPERANNUATION FUND
20. FINANCIAL INSTRUMENTS (continued)
(c) Derivatives (continued)
INTEREST RATE SWAPS
FUND ACTUAL
NOTIONALVALUE FAIR VALUE
NOTIONALVALUE FAIR VALUE
2014 2014 2013 2013
NZD’000 NZD’000 NZD’000 NZD’000
Less than 1 year 41,170 (247) 41,483 (573)
1 to 2 years 32,340 (1,672) 42,778 (619)
2 to 5 years 611,987 (8,145) 381,000 (2,417)
5 to 10 years 399,881 (3,511) 171,463 3,068
Over 10 years – – – –
1,085,378 (13,575) 636,724 (541)
All interest rate swaps are settled net.
OTHER OTC SWAPS
FUND ACTUAL
NOTIONALVALUE FAIR VALUE
NOTIONALVALUE FAIR VALUE
2014 2014 2013 2013
NZD’000 NZD’000 NZD’000 NZD’000
Credit default arbitrage swaps 2 to 5 years 79,950 16 – –
Credit default arbitrage swaps 5 to 10 years 114,214 55 129,484 50
194,164 71 129,484 50
All other OTC swaps are settled net.
MATURITY PROFILE OF DERIVATIVE FINANCIAL LIABILITIES
FUND ACTUAL
2014 LESS THAN
1 YEAR 1–2 YEARS 2–5 YEARS 5–10 YEARS 10+ YEARS
NZD’000 NZD’000 NZD’000 NZD’000 NZD’000
Net-settled derivatives (27,215) (3,301) (48,527) (76,599) (3,734)
Gross-settled derivatives – cash inflow 2,516,283 – – – –
Gross-settled derivatives – cash outflow (2,536,293) – – – –
(47,225) (3,301) (48,527) (76,599) (3,734)
2013 (RESTATED)
Net-settled derivatives (212,642) (2,891) (47,807) (74,239) –
Gross-settled derivatives – cash inflow 9,807,942 524,547 4,579 – –
Gross-settled derivatives – cash outflow (10,089,815) (558,219) (5,369) – –
(494,515) (36,563) (48,597) (74,239) –
Notes to the Financial Statements (continued)
For the year ended 30 June 2014
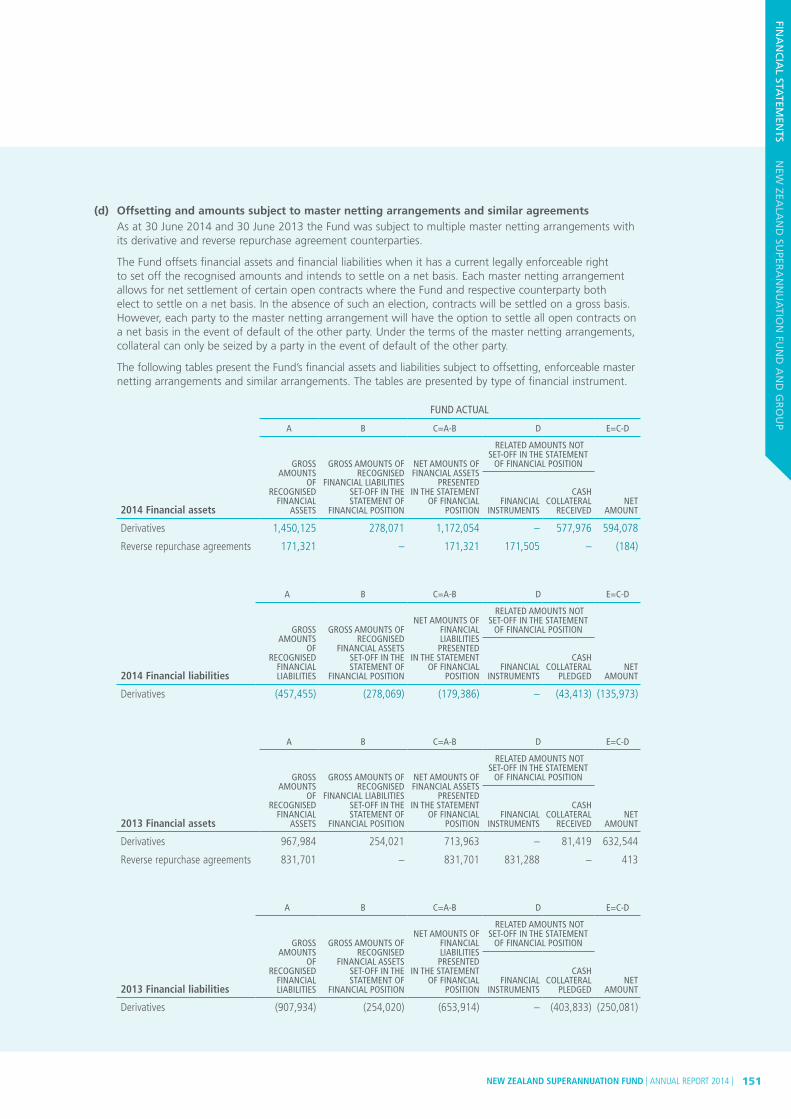
NEW ZEALAND SUPERANNUATION FUND | ANNUAL REPORT 2014 | 151
(d) Offsetting and amounts subject to master netting arrangements and similar agreements As at 30 June 2014 and 30 June 2013 the Fund was subject to multiple master netting arrangements with
its derivative and reverse repurchase agreement counterparties.
The Fund offsets financial assets and financial liabilities when it has a current legally enforceable right to set off the recognised amounts and intends to settle on a net basis. Each master netting arrangement allows for net settlement of certain open contracts where the Fund and respective counterparty both elect to settle on a net basis. In the absence of such an election, contracts will be settled on a gross basis. However, each party to the master netting arrangement will have the option to settle all open contracts on a net basis in the event of default of the other party. Under the terms of the master netting arrangements, collateral can only be seized by a party in the event of default of the other party.
The following tables present the Fund’s financial assets and liabilities subject to offsetting, enforceable master netting arrangements and similar arrangements. The tables are presented by type of financial instrument.
FUND ACTUAL
A B C=A-B D E=C-D
GROSS AMOUNTS
OF RECOGNISED
FINANCIAL ASSETS
GROSS AMOUNTS OF RECOGNISED
FINANCIAL LIABILITIES SET-OFF IN THE STATEMENT OF
FINANCIAL POSITION
NET AMOUNTS OF FINANCIAL ASSETS
PRESENTED IN THE STATEMENT
OF FINANCIAL POSITION
RELATED AMOUNTS NOT SET-OFF IN THE STATEMENT
OF FINANCIAL POSITION
2014 Financial assets FINANCIAL
INSTRUMENTS
CASH COLLATERAL
RECEIVED NET
AMOUNT
Derivatives 1,450,125 278,071 1,172,054 – 577,976 594,078
Reverse repurchase agreements 171,321 – 171,321 171,505 – (184)
A B C=A-B D E=C-D
GROSS AMOUNTS
OF RECOGNISED
FINANCIAL LIABILITIES
GROSS AMOUNTS OF RECOGNISED
FINANCIAL ASSETS SET-OFF IN THE STATEMENT OF
FINANCIAL POSITION
NET AMOUNTS OF FINANCIAL LIABILITIES PRESENTED
IN THE STATEMENT OF FINANCIAL
POSITION
RELATED AMOUNTS NOT SET-OFF IN THE STATEMENT
OF FINANCIAL POSITION
2014 Financial liabilities FINANCIAL
INSTRUMENTS
CASH COLLATERAL
PLEDGED NET
AMOUNT
Derivatives (457,455) (278,069) (179,386) – (43,413) (135,973)
A B C=A-B D E=C-D
GROSS AMOUNTS
OF RECOGNISED
FINANCIAL ASSETS
GROSS AMOUNTS OF RECOGNISED
FINANCIAL LIABILITIES SET-OFF IN THE STATEMENT OF
FINANCIAL POSITION
NET AMOUNTS OF FINANCIAL ASSETS
PRESENTED IN THE STATEMENT
OF FINANCIAL POSITION
RELATED AMOUNTS NOT SET-OFF IN THE STATEMENT
OF FINANCIAL POSITION
2013 Financial assets FINANCIAL
INSTRUMENTS
CASH COLLATERAL
RECEIVED NET
AMOUNT
Derivatives 967,984 254,021 713,963 – 81,419 632,544
Reverse repurchase agreements 831,701 – 831,701 831,288 – 413
A B C=A-B D E=C-D
GROSS AMOUNTS
OF RECOGNISED
FINANCIAL LIABILITIES
GROSS AMOUNTS OF RECOGNISED
FINANCIAL ASSETS SET-OFF IN THE STATEMENT OF
FINANCIAL POSITION
NET AMOUNTS OF FINANCIAL LIABILITIES PRESENTED
IN THE STATEMENT OF FINANCIAL
POSITION
RELATED AMOUNTS NOT SET-OFF IN THE STATEMENT
OF FINANCIAL POSITION
2013 Financial liabilities FINANCIAL
INSTRUMENTS
CASH COLLATERAL
PLEDGED NET
AMOUNT
Derivatives (907,934) (254,020) (653,914) – (403,833) (250,081)
FINA
NC
IAL STA
TEMEN
TS N
EW ZEA
LAN
D SU
PERA
NN
UA
TION
FUN
D A
ND
GR
OU
P

| NEW ZEALAND SUPERANNUATION FUND | ANNUAL REPORT 2014152
NEW ZEALAND SUPERANNUATION FUND
20. FINANCIAL INSTRUMENTS (continued)
(e) Market risk Market risk is the risk that the fair value or future cash flows of financial instruments will fluctuate due
to changes in market variables such as interest rates, foreign exchange rates, credit default swap spreads and equity prices.
The market risks that the Fund is primarily exposed to are: equity price risk, both globally and in New Zealand; interest rate risk (primarily to changes in New Zealand and United States interest rates); and currency risk (primarily to changes in the New Zealand dollar versus the United States dollar).
Market risk is managed for the Fund as a whole as noted in note 20(b) under financial risk management objectives, policies and processes. Market risk is further managed by requiring, where appropriate, investment managers to manage their portfolios by tracking a benchmark index, within a defined tolerance for tracking error. The tolerance for tracking error imposes certain restrictions on the manager. Those restrictions will include: limits on percentage weight of any particular company in the portfolio relative to its benchmark weight; limits on aggregate investment in companies not represented in the benchmark; limits on investment in any individual company not represented in the benchmark; limits on the maximum investment in any individual company; duration limits relative to the duration of the benchmark; and maximum limits on exposure to single entities.
(i) Equity price risk Equity price risk is the risk of unfavourable changes in the fair values of equities.
The Fund is exposed to changes in the price of equities listed on both New Zealand and international stock exchanges, as well as derivatives or unlisted equities where value is determined with reference to an equity market index or comparable transactions in a listed equity market.
Equity price risk is managed by imposing limits on the overall acceptable level of investment risk in the Fund. This is implemented by imposing limits on investment managers within their mandates.
Notes to the Financial Statements (continued)
For the year ended 30 June 2014

NEW ZEALAND SUPERANNUATION FUND | ANNUAL REPORT 2014 | 153
CONCENTRATION OF EQUITY PRICE RISK The following tables analyse the Fund’s concentration of equity price risk by geographical and industrial
distribution. The analyses include all equities and equity-linked derivatives as well as any other securities that have equity price exposure.
BY GEOGRAPHY FUND ACTUAL
2014 2013
% %
New Zealand 13 13
Australia 4 4
United States 43 42
Europe 24 24
Asia 13 14
Other 3 3
100 100
BY INDUSTRY FUND ACTUAL
2014 2013
% %
Basic materials 10 11
Communications 5 6
Consumer – Cyclical 5 6
Consumer – Non-cyclical 16 16
Energy 10 11
Financial 21 21
Funds 3 3
Healthcare 5 2
Industrial 10 10
Technology 7 6
Utilities 6 6
Other 2 2
100 100
FINA
NC
IAL STA
TEMEN
TS N
EW ZEA
LAN
D SU
PERA
NN
UA
TION
FUN
D A
ND
GR
OU
P
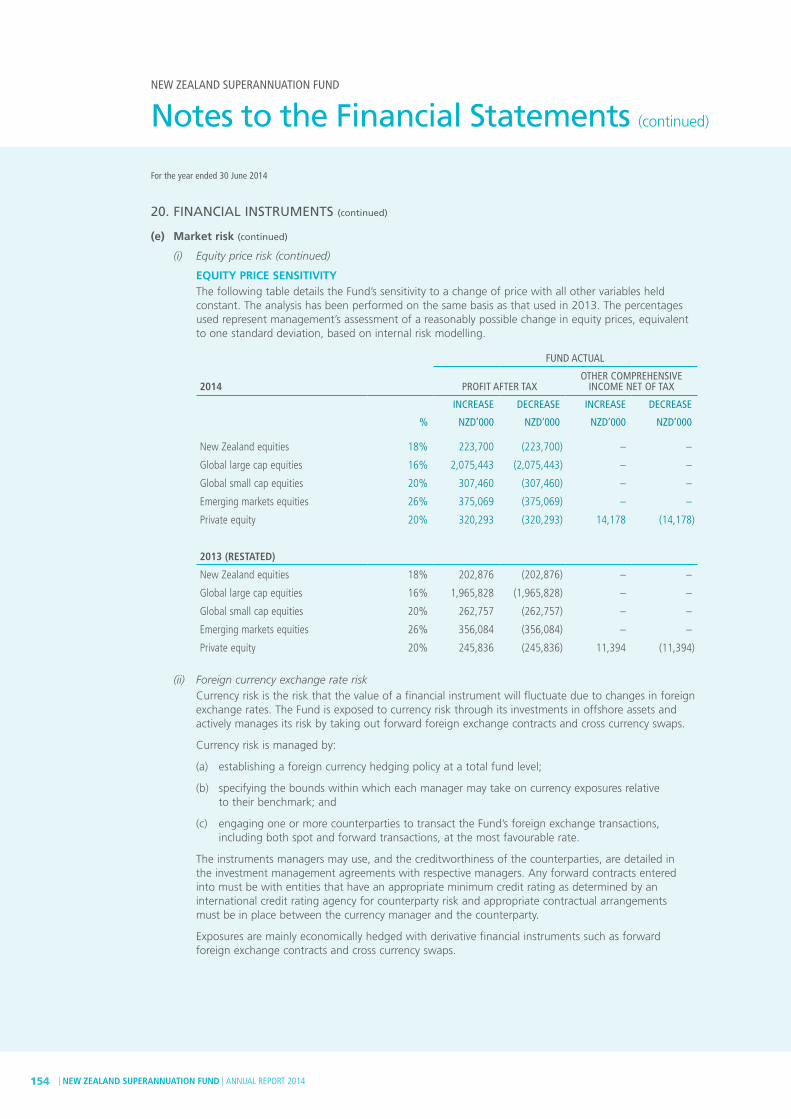
| NEW ZEALAND SUPERANNUATION FUND | ANNUAL REPORT 2014154
NEW ZEALAND SUPERANNUATION FUND
20. FINANCIAL INSTRUMENTS (continued)
(e) Market risk (continued)
(i) Equity price risk (continued)
EQUITY PRICE SENSITIVITY The following table details the Fund’s sensitivity to a change of price with all other variables held
constant. The analysis has been performed on the same basis as that used in 2013. The percentages used represent management’s assessment of a reasonably possible change in equity prices, equivalent to one standard deviation, based on internal risk modelling.
FUND ACTUAL
2014 PROFIT AFTER TAXOTHER COMPREHENSIVE
INCOME NET OF TAX
INCREASE DECREASE INCREASE DECREASE
% NZD’000 NZD’000 NZD’000 NZD’000
New Zealand equities 18% 223,700 (223,700) – –
Global large cap equities 16% 2,075,443 (2,075,443) – –
Global small cap equities 20% 307,460 (307,460) – –
Emerging markets equities 26% 375,069 (375,069) – –
Private equity 20% 320,293 (320,293) 14,178 (14,178)
2013 (RESTATED)
New Zealand equities 18% 202,876 (202,876) – –
Global large cap equities 16% 1,965,828 (1,965,828) – –
Global small cap equities 20% 262,757 (262,757) – –
Emerging markets equities 26% 356,084 (356,084) – –
Private equity 20% 245,836 (245,836) 11,394 (11,394)
(ii) Foreign currency exchange rate risk Currency risk is the risk that the value of a financial instrument will fluctuate due to changes in foreign
exchange rates. The Fund is exposed to currency risk through its investments in offshore assets and actively manages its risk by taking out forward foreign exchange contracts and cross currency swaps.
Currency risk is managed by:
(a) establishing a foreign currency hedging policy at a total fund level;
(b) specifying the bounds within which each manager may take on currency exposures relative to their benchmark; and
(c) engaging one or more counterparties to transact the Fund’s foreign exchange transactions, including both spot and forward transactions, at the most favourable rate.
The instruments managers may use, and the creditworthiness of the counterparties, are detailed in the investment management agreements with respective managers. Any forward contracts entered into must be with entities that have an appropriate minimum credit rating as determined by an international credit rating agency for counterparty risk and appropriate contractual arrangements must be in place between the currency manager and the counterparty.
Exposures are mainly economically hedged with derivative financial instruments such as forward foreign exchange contracts and cross currency swaps.
Notes to the Financial Statements (continued)
For the year ended 30 June 2014

NEW ZEALAND SUPERANNUATION FUND | ANNUAL REPORT 2014 | 155
FUND ACTUAL
FOREIGN CURRENCY EXPOSURE ASSETS ASSETS
2014 2013
NZD’000 NZD’000
Australian Dollars 285,641 5,480
Brazilian Real 190,104 181,938
Canadian Dollars 850,462 180,964
Swiss Francs (134,505) 8,602
Chilean Pesos 26,639 30,915
Colombian Pesos 17,915 18,703
Czech Koruny 7,265 5,498
Danish Kroner 1,631 3,213
Egyptian Pounds 3,361 3,719
European Union Euros (71,997) 20,933
British Pounds 781,717 651,269
Hong Kong Dollars 253,447 247,714
Hungarian Forints 3,926 3,776
Indonesian Rupiahs 42,858 51,241
Israeli New Shekels 38,253 31,695
Indian Rupees 154,476 142,519
Japanese Yen 1,020,353 464,104
South Korean Won – 3,205
Moroccan Dirhams – 1,360
Mexican Pesos 97,947 93,734
Malaysian Ringgits 84,451 78,646
Norwegian Krone 565 –
Peruvian Nuevo Sol 7,516 7,407
Philippines Pesos 17,098 16,773
Polish Zloty 35,549 30,267
Russian Rubles 98,476 92,881
Swedish Kronor – 5,459
Singaporean Dollars – 6,188
Thai Baht 45,273 50,618
Turkish New Lira 33,146 31,278
Taiwanese New Dollars 8,556 4,738
United States of America Dollars 5,708,133 2,233,091
South African Rand 136,154 120,291
9,744,410 4,828,219
This table shows effective foreign currency exposure after forward foreign exchange contracts have been taken into account.
FINA
NC
IAL STA
TEMEN
TS N
EW ZEA
LAN
D SU
PERA
NN
UA
TION
FUN
D A
ND
GR
OU
P

| NEW ZEALAND SUPERANNUATION FUND | ANNUAL REPORT 2014156
NEW ZEALAND SUPERANNUATION FUND
20. FINANCIAL INSTRUMENTS (continued)
(e) Market risk (continued)
(ii) Foreign currency exchange rate risk (continued)
FOREIGN CURRENCY SENSITIVITY The following table details the Fund’s sensitivity to a change in the New Zealand dollar against the
major foreign currencies, with all other variables remaining constant. The analysis has been performed only on the effective foreign currency exposure after allowing for the impact of forward foreign exchange contracts. The analysis has been performed on the same basis as that used in 2013. The percentages used represent management’s assessment of a reasonably possible change in foreign currency rates, equivalent to one standard deviation.
FUND ACTUAL
2014 % PROFIT AFTER TAXOTHER COMPREHENSIVE
INCOME NET OF TAX
INCREASE DECREASE INCREASE DECREASE
NZD’000 NZD’000 NZD’000 NZD’000
NZD / USD 10% (407,052) 407,052 (3,933) 3,933
NZD / EUR 10% 5,184 (5,184) – –
NZD / GBP 10% (56,284) 56,284 – –
NZD / JPY 10% (73,465) 73,465 – –
NZD / Others 10% (167,148) 167,148 – –
2013
NZD / USD 10% (160,811) 160,811 (4,160) 4,160
NZD / EUR 10% (1,507) 1,507 – –
NZD / GBP 10% (46,891) 46,891 – –
NZD / JPY 10% (33,415) 33,415 – –
NZD / Others 10% (105,006) 105,006 – –
Notes to the Financial Statements (continued)
For the year ended 30 June 2014

NEW ZEALAND SUPERANNUATION FUND | ANNUAL REPORT 2014 | 157
(iii) Interest rate risk Interest rate risk is the risk that the value of the Fund’s investments in fixed interest securities and
cash and cash equivalents will fluctuate due to changes in market interest rates. Interest rate swaps are used to manage exposure to interest rates. In addition, interest rate risk management activities are undertaken by investment managers in accordance with the limits imposed in their mandates. The intention of the Fund is not necessarily to hold these assets to maturity, but to realise and purchase similar assets as part of the ongoing management of the investments of the Fund.
The Fund is primarily exposed to changes in New Zealand and United States dollar short-term interest rates.
INTEREST RATE EXPOSURE – MATURITY PROFILE OF FINANCIAL INSTRUMENTS The following tables are based on the earlier of contractual repricing or maturity period and exclude
accrued interest.
FUND ACTUAL
FIXED MATURITY DATES
2014
WEIGHTED AVERAGEEFFECTIVEINTEREST
RATE
VARIABLE INTEREST
RATE
LESS THAN
1 YEAR 1 – 2
YEARS 2 – 5
YEARS 5 – 10 YEARS 10+ YEARS
NON-INTEREST BEARING
% NZD’000 NZD’000 NZD’000 NZD’000 NZD’000 NZD’000 NZD’000
Financial assets
Cash and cash equivalents (i) 2.03% 3,607,350 152,323
Cash pledged as collateral (ii) 0.00% 171,204
Other fixed income investments 2.90% 1,121,568 573,998 1,616,423 1,803,422 2,065,293
3,778,554 1,121,568 573,998 1,616,423 1,803,422 2,065,293 152,323
2013 (RESTATED)
Financial assets
Cash and cash equivalents (i) 1.30% 5,238,445 386,952
Cash pledged as collateral (ii) 0.00% 597,844
Redeemable preference shares 8.95% 57,500
Other fixed income investments 3.33% 542,964 355,002 1,094,265 1,491,613 900,127
5,836,289 600,464 355,002 1,094,265 1,491,613 900,127 386,952
(i) Non-interest bearing cash and cash equivalents is primarily comprised of non-NZD denominated currencies held in custody, the majority of which earn no interest.
(ii) Cash pledged as collateral is held under Credit Support Annexes to ISDA Master Agreements and with futures exchanges. The rate of interest earned on this cash, whilst variable, is minimal and consequently a weighted average effective interest rate of 0.00% has been applied.
FINA
NC
IAL STA
TEMEN
TS N
EW ZEA
LAN
D SU
PERA
NN
UA
TION
FUN
D A
ND
GR
OU
P

| NEW ZEALAND SUPERANNUATION FUND | ANNUAL REPORT 2014158
NEW ZEALAND SUPERANNUATION FUND
20. FINANCIAL INSTRUMENTS (continued)
(e) Market risk (continued)
(iii) Interest rate risk (continued)
INTEREST RATE SENSITIVITY The sensitivity analysis in the table below, showing the effect on profit after tax and other comprehensive
income, has been determined based on the exposure to interest rates at the reporting date and the stipulated change taking place at the beginning of the financial year and held constant throughout the reporting period, with all other variables remaining constant. The analysis has been performed on the same basis as that used in 2013. The percentages used represent management’s assessment of a reasonably possible change in interest rates, equivalent to one standard deviation.
FUND ACTUAL
2014 PROFIT AFTER TAXOTHER COMPREHENSIVE
INCOME NET OF TAX
INCREASE DECREASE INCREASE DECREASE
BASIS POINTS NZD’000 NZD’000 NZD’000 NZD’000
Cash and cash equivalents 50 13,715 (13,715) – –
Fixed income and other interest rate-sensitive instruments 50 13,422 (13,422) – –
2013
Cash and cash equivalents 50 20,270 (20,270) – –
Fixed income and other interest rate-sensitive instruments 50 18,551 (18,551) – –
(f) Credit risk management
Credit risk is the risk that a third party will default on its obligation to the Fund, causing the Fund to incur a loss. Financial instruments which potentially subject the Fund to risk consist principally of cash, investments and receivables.
The Fund invests in a wide range of assets in New Zealand and overseas in accordance with its Statement of Investment Policies, Standards and Procedures. This contains credit and exposure policies to limit credit risk from the Fund’s investments.
SIGNIFICANT CONCENTRATIONS OF CREDIT RISK Concentration of credit risk exists if a single counterparty, or group of counterparties, is engaged in similar
activities, operate within similar industries, geographies, or have similar economic characteristics that would cause their ability to meet contractual obligations to be similarly affected by changes in economic conditions. The maximum amount of credit risk for each class is the carrying amount in the Statement of Financial Position.
The Fund seeks to mitigate credit risk by applying policies as follows:
(i) Any investment that represents exposure to a single sector within one geography or is a listed security that is over 2% of the net asset value of the Fund requires Board approval;
(ii) Total direct exposure to a counterparty is capped at 2% or 5% (for New Zealand counterparties) of the Fund’s net asset value;
(iii) Maximum direct exposure to Australian and New Zealand banks, is capped at 15% of the Fund’s net asset value; and
(iv) Maximum exposure to “BBB” rated counterparties in aggregate, is capped at 6% of the Fund’s net asset value.
Notes to the Financial Statements (continued)
For the year ended 30 June 2014

NEW ZEALAND SUPERANNUATION FUND | ANNUAL REPORT 2014 | 159
(i) Counterparty credit risk It is the Fund’s policy to enter into financial instruments with reputable counterparties. Management
closely monitor the creditworthiness of the Fund’s counterparties by reviewing their credit ratings, credit default swap spreads, equity pricing, news flows and other indicators on a regular basis.
At balance date, the Fund has counterparty exposure in respect of its forward foreign exchange contracts, cross currency swaps, asset swaps, volatility swaps, longevity contingent swaps, total return swaps, credit default swaps, insurance-linked swaps, interest rate swaps and other OTC swaps. The table below sets out the net exposures by individual counterparty (and where applicable, specific branch) where an instrument has a positive fair value and excludes collateral held against these exposures:
FUND ACTUAL
2014 NOTIONAL
VALUE FAIR VALUE
NZD’000 NZD’000
ANZ National Bank Limited 2,292,935 21,606
Bank of New Zealand 2,053,096 45,194
Barclays Bank PLC, London Branch 870,330 25,014
Barclays Bank PLC, New York Branch 429,472 19,495
BNP Paribas, London Branch 122,150 5,662
Citibank N.A., London Branch 662,156 26,999
Citibank N.A., New York Branch 1,321,843 589
Commonwealth Bank of Australia, Sydney Branch 2,474,144 38,115
Credit Suisse Securities (Europe) Limited 1,759,450 131,383
Deutsche Bank AG, London Branch 2,646,683 77,674
Deutsche Bank AG, Seoul Branch 229,444 1,651
Goldman Sachs International 857,931 37,852
Her Majesty the Queen In Right of New Zealand (NZ DMO) 1,464,807 387,407
JP Morgan Chase, London Branch 10,850,323 179,388
Morgan Stanley & Co. International PLC 3,460,230 31,486
Nomura International PLC 1,136,148 19,956
RFIB Group Limited 3,255 235
Societe Generale 601,739 31,022
The Hong Kong and Shanghai Banking Corporation Limited 1,935,022 60,258
The Northern Trust Company 461 1
Toronto-Dominion Bank 10,000 24
UBS AG, London Branch 19,227 140
UBS AG, Singapore Branch 886,819 11,552
Westpac Banking Corporation, Wellington Branch 1,408,680 19,351
37,496,345 1,172,054
FINA
NC
IAL STA
TEMEN
TS N
EW ZEA
LAN
D SU
PERA
NN
UA
TION
FUN
D A
ND
GR
OU
P

| NEW ZEALAND SUPERANNUATION FUND | ANNUAL REPORT 2014160
NEW ZEALAND SUPERANNUATION FUND
FUND ACTUAL
2013 NOTIONAL
VALUE FAIR VALUE
NZD’000 NZD’000
Argo Group International Holdings, Ltd. 7,122 514
ANZ National Bank Limited 1,554,252 63,655
Bank of New Zealand 1,150,460 15,419
Barclays Bank PLC, London Branch 1,856,360 15,728
Barclays Bank PLC, New York Branch 664,894 7,545
BNP Paribas, London Branch 785,082 9,518
Citibank N.A., London Branch 1,098,253 9,889
Citibank N.A., New York Branch 132,073 76
Commonwealth Bank of Australia, Sydney Branch 631,176 25,559
Credit Suisse Securities (Europe) Limited 747,784 102,234
Deutsche Bank AG, London Branch 1,572,257 30,094
Goldman Sachs International 545,125 1,319
Hannover Ruckversicherung, AG 1,230 54
Her Majesty the Queen In Right of New Zealand (NZ DMO) 2,278,825 324,374
JP Morgan Chase Bank N.A., London Branch 371,497 2,711
Leadenhall Capital Partners 1,644 84
Morgan Stanley & Co. International PLC 1,070,363 4,712
National Australia Bank Limited 129 –
Nomura International PLC 1,300,427 28,307
Odyssey Re Holdings Corp 1,644 85
SCOR ILS Fund SA 9,711 804
St Johns Insurance Company, Inc. 12,948 –
The Hong Kong and Shanghai Banking Corporation Limited 1,042,334 11,260
The Northern Trust Company 219 1
The Royal Bank of Scotland Group 11,103 240
Toronto-Dominion Bank 91,483 1,206
UBS AG, London Branch 561,017 2,112
UBS AG, Singapore Branch 2,058,736 38,110
Westpac Banking Corporation, Wellington Branch 1,146,769 18,353
20,704,917 713,963
The Fund restricts the exposure to credit losses on derivative instruments it holds by entering into master-netting arrangements with major counterparties with whom a significant volume of transactions are undertaken. Such an arrangement provides for a single net settlement of all financial instruments covered by the agreement in the event of default on any one contract. Master-netting arrangements do not result in the offset of assets and liabilities in the Statement of Financial Position unless certain conditions for offsetting under NZ IAS 32 apply.
20. FINANCIAL INSTRUMENTS (continued)
(f) Credit risk management (continued)
SIGNIFICANT CONCENTRATIONS OF CREDIT RISK (CONTINUED)
(i) Counterparty credit risk (continued)
Notes to the Financial Statements (continued)
For the year ended 30 June 2014

NEW ZEALAND SUPERANNUATION FUND | ANNUAL REPORT 2014 | 161
(ii) Credit quality of financial assets The following table analyses the Fund’s portfolio of fixed income securities by rating agency category.
Ratings are obtained from Standard & Poor’s, Moody’s and Fitch respectively depending on the availability of data.
FUND ACTUAL
Credit rating % OF FIXED INCOME ASSETS
2014 2013
AAA/Aaa 15 17
AA/aa 37 33
A/A 20 25
BBB/Baa 5 7
Other credit rating 7 7
Not rated 16 11
100 100
(g) Liquidity risk management Liquidity risk is the risk that the Fund will encounter difficulty in meeting the obligations associated with its
financial liabilities that are settled by delivering cash or other financial assets.
The Fund’s liquidity management framework is designed to ensure that the Fund has the ability to generate sufficient cash in a timely manner to meet its financial commitments.
The Fund is long-term by nature (no fund capital withdrawals are permitted prior to 30 June 2020 and, on current assumptions, none are expected before the 2029/30 financial year).
Liquidity risk is managed by:
(i) forecasting liquidity requirements;
(ii) maintaining a buffer of cash and highly liquid securities to meet short-term liquidity requirements;
(iii) regular review of the liquidity available by senior management; and
(iv) periodic ‘stress-tests’ of the liquidity framework using theoretical scenarios.
Information about the contractual maturity periods of financial assets and liabilities is included in notes 20(c) and 20(e)(iii).
21. FAIR VALUE
(a) Fair value hierarchy The Fund uses various methods in estimating fair value. These methods comprise:
Level 1 – fair value is calculated using quoted prices in active markets.
Level 2 – fair value is estimated using inputs other than quoted prices included in Level 1 that are observable for the asset or liability, either directly (as prices) or indirectly (derived from prices).
Level 3 – fair value is estimated using inputs for the asset or liability that are not based on observable market data.
FINA
NC
IAL STA
TEMEN
TS N
EW ZEA
LAN
D SU
PERA
NN
UA
TION
FUN
D A
ND
GR
OU
P
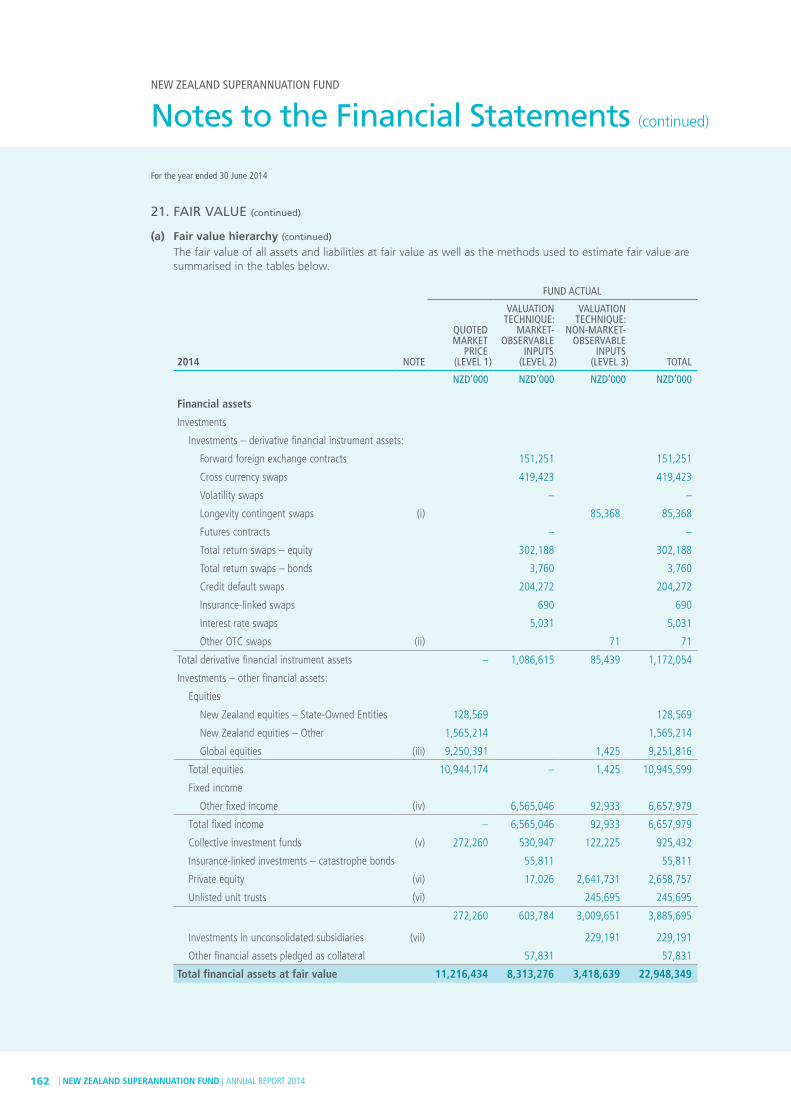
| NEW ZEALAND SUPERANNUATION FUND | ANNUAL REPORT 2014162
NEW ZEALAND SUPERANNUATION FUND
21. FAIR VALUE (continued)
(a) Fair value hierarchy (continued)
The fair value of all assets and liabilities at fair value as well as the methods used to estimate fair value are summarised in the tables below.
FUND ACTUAL
2014 NOTE
QUOTED MARKET PRICE
(LEVEL 1)
VALUATION TECHNIQUE: MARKET- OBSERVABLE INPUTS
(LEVEL 2)
VALUATION TECHNIQUE: NON-MARKET- OBSERVABLE INPUTS
(LEVEL 3) TOTAL
NZD’000 NZD’000 NZD’000 NZD’000
Financial assets
Investments
Investments – derivative financial instrument assets:
Forward foreign exchange contracts 151,251 151,251
Cross currency swaps 419,423 419,423
Volatility swaps – –
Longevity contingent swaps (i) 85,368 85,368
Futures contracts – –
Total return swaps – equity 302,188 302,188
Total return swaps – bonds 3,760 3,760
Credit default swaps 204,272 204,272
Insurance-linked swaps 690 690
Interest rate swaps 5,031 5,031
Other OTC swaps (ii) 71 71
Total derivative financial instrument assets – 1,086,615 85,439 1,172,054
Investments – other financial assets:
Equities
New Zealand equities – State-Owned Entities 128,569 128,569
New Zealand equities – Other 1,565,214 1,565,214
Global equities (iii) 9,250,391 1,425 9,251,816
Total equities 10,944,174 – 1,425 10,945,599
Fixed income
Other fixed income (iv) 6,565,046 92,933 6,657,979
Total fixed income – 6,565,046 92,933 6,657,979
Collective investment funds (v) 272,260 530,947 122,225 925,432
Insurance-linked investments – catastrophe bonds 55,811 55,811
Private equity (vi) 17,026 2,641,731 2,658,757
Unlisted unit trusts (vi) 245,695 245,695
272,260 603,784 3,009,651 3,885,695
Investments in unconsolidated subsidiaries (vii) 229,191 229,191
Other financial assets pledged as collateral 57,831 57,831
Total financial assets at fair value 11,216,434 8,313,276 3,418,639 22,948,349
Notes to the Financial Statements (continued)
For the year ended 30 June 2014

NEW ZEALAND SUPERANNUATION FUND | ANNUAL REPORT 2014 | 163
FUND ACTUAL
2014 NOTE
QUOTED MARKET PRICE
(LEVEL 1)
VALUATION TECHNIQUE: MARKET- OBSERVABLE INPUTS
(LEVEL 2)
VALUATION TECHNIQUE: NON-MARKET- OBSERVABLE INPUTS
(LEVEL 3) TOTAL
NZD’000 NZD’000 NZD’000 NZD’000
Other assets at fair value
Forests 2,442 2,442
Livestock 21,366 21,366
Property, plant and equipment (viii) 123,726 123,726
Total other assets at fair value – 21,366 126,168 147,534
Total assets at fair value 11,216,434 8,334,642 3,544,807 23,095,883
Financial liabilities
Derivative financial instrument liabilities:
Forward foreign exchange contracts 17,497 17,497
Cross currency swaps 2,513 2,513
Asset swaps 90,516 90,516
Futures contracts – –
Total return swaps – equity 25,975 25,975
Total return swaps – bonds – –
Credit default swaps 24,279 24,279
Interest rate swaps 18,606 18,606
Options – –
Total financial liabilities at fair value – 179,386 – 179,386
Total liabilities at fair value – 179,386 – 179,386
(i) The fair value of longevity contingent swaps is provided by the counterparty and is calculated by reference to movements in the underlying basket of contracts. The price provided by the counterparty is a non-binding bid price based on a valuation model, which uses a discount rate of 18%. If a 2% movement in discount rate is applied, the fair value of the swap would increase by $5,550,000 or decrease by $4,919,000.
(ii) For Level 3 other OTC swaps, the fair value is determined using an internally-generated model, with the key input being interest rates. The other OTC swaps are market-neutral, and the interest rate is fixed (0.75%-2.0%). A reasonably likely movement in the fair value in a one-year period has been determined to be 0% based on internal risk modelling, which would increase or decrease the fair value of these securities by $nil.
(iii) The fair value of listed equities is determined based on the last quoted bid price on the relevant exchange as of the close of business at balance date. In some instances, where the market on which the security is traded is not highly liquid (e.g. the security may be listed on an emerging market stock exchange), the price is determined using non-binding broker quotes. These securities have been classified as Level 3. A reasonably likely movement in the fair value in a one-year period has been determined to be 20% based on internal risk modelling, which would increase or decrease the fair value of these securities by $340,000.
FINA
NC
IAL STA
TEMEN
TS N
EW ZEA
LAN
D SU
PERA
NN
UA
TION
FUN
D A
ND
GR
OU
P
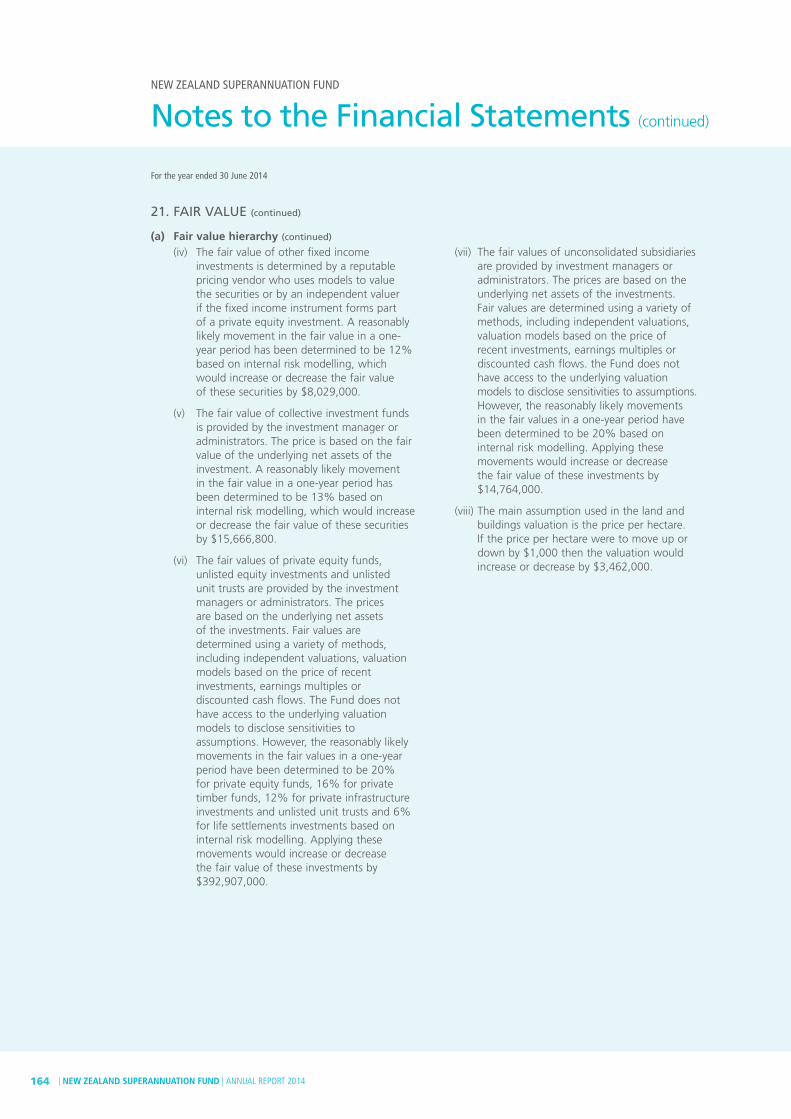
| NEW ZEALAND SUPERANNUATION FUND | ANNUAL REPORT 2014164
NEW ZEALAND SUPERANNUATION FUND
21. FAIR VALUE (continued)
(a) Fair value hierarchy (continued)
(iv) The fair value of other fixed income investments is determined by a reputable pricing vendor who uses models to value the securities or by an independent valuer if the fixed income instrument forms part of a private equity investment. A reasonably likely movement in the fair value in a one-year period has been determined to be 12% based on internal risk modelling, which would increase or decrease the fair value of these securities by $8,029,000.
(v) The fair value of collective investment funds is provided by the investment manager or administrators. The price is based on the fair value of the underlying net assets of the investment. A reasonably likely movement in the fair value in a one-year period has been determined to be 13% based on internal risk modelling, which would increase or decrease the fair value of these securities by $15,666,800.
(vi) The fair values of private equity funds, unlisted equity investments and unlisted unit trusts are provided by the investment managers or administrators. The prices are based on the underlying net assets of the investments. Fair values are determined using a variety of methods, including independent valuations, valuation models based on the price of recent investments, earnings multiples or discounted cash flows. The Fund does not have access to the underlying valuation models to disclose sensitivities to assumptions. However, the reasonably likely movements in the fair values in a one-year period have been determined to be 20% for private equity funds, 16% for private timber funds, 12% for private infrastructure investments and unlisted unit trusts and 6% for life settlements investments based on internal risk modelling. Applying these movements would increase or decrease the fair value of these investments by $392,907,000.
(vii) The fair values of unconsolidated subsidiaries are provided by investment managers or administrators. The prices are based on the underlying net assets of the investments. Fair values are determined using a variety of methods, including independent valuations, valuation models based on the price of recent investments, earnings multiples or discounted cash flows. the Fund does not have access to the underlying valuation models to disclose sensitivities to assumptions. However, the reasonably likely movements in the fair values in a one-year period have been determined to be 20% based on internal risk modelling. Applying these movements would increase or decrease the fair value of these investments by $14,764,000.
(viii) The main assumption used in the land and buildings valuation is the price per hectare. If the price per hectare were to move up or down by $1,000 then the valuation would increase or decrease by $3,462,000.
Notes to the Financial Statements (continued)
For the year ended 30 June 2014

NEW ZEALAND SUPERANNUATION FUND | ANNUAL REPORT 2014 | 165
FUND ACTUAL
2013 (RESTATED) NOTE
QUOTED MARKET PRICE
(LEVEL 1)
VALUATION TECHNIQUE: MARKET- OBSERVABLE INPUTS
(LEVEL 2)
VALUATION TECHNIQUE: NON-MARKET- OBSERVABLE INPUTS
(LEVEL 3) TOTAL
NZD’000 NZD’000 NZD’000 NZD’000
Financial assets
Investments
Investments – derivative financial instrument assets:
Forward foreign exchange contracts 208,639 208,639
Cross currency swaps 340,868 340,868
Volatility swaps 6,036 6,036
Longevity contingent swaps (i) 92,696 92,696
Futures contracts – –
Total return swaps – equity 47,704 47,704
Total return swaps – bonds – –
Credit default swaps 9,167 9,167
Insurance-linked swaps 1,698 1,698
Interest rate swaps 7,105 7,105
Other OTC swaps (ii) 50 50
Total derivative financial instrument assets – 621,217 92,746 713,963
Investments – other financial assets:
Equities
New Zealand equities – State-Owned Entities 50,878 50,878
New Zealand equities – Other 1,018,391 1,018,391
Global equities (iii) 5,691,475 78 5,691,553
Total equities 6,760,744 – 78 6,760,822
Fixed income
Other fixed income (iv) 4,060,161 96,707 4,156,868
Total fixed income – 4,060,161 96,707 4,156,868
Collective investment funds (v) 172,313 1,266,150 125,375 1,563,838
Insurance-linked investments – catastrophe bonds 232,698 232,698
Private equity (vi) 19,525 2,972,590 2,992,115
Unlisted unit trusts (vi) 228,889 228,889
172,313 1,518,373 3,326,854 5,017,540
Investments in unconsolidated subsidiaries (vii) 100,567 100,567
Other financial assets pledged as collateral 81,935 81,935
Total financial assets at fair value 6,933,057 6,281,686 3,616,952 16,831,695
FINA
NC
IAL STA
TEMEN
TS N
EW ZEA
LAN
D SU
PERA
NN
UA
TION
FUN
D A
ND
GR
OU
P

| NEW ZEALAND SUPERANNUATION FUND | ANNUAL REPORT 2014166
NEW ZEALAND SUPERANNUATION FUND
21. FAIR VALUE (continued)
(a) Fair value hierarchy (continued)
FUND ACTUAL
2013 (RESTATED) NOTE
QUOTED MARKET PRICE
(LEVEL 1)
VALUATION TECHNIQUE: MARKET- OBSERVABLE INPUTS
(LEVEL 2)
VALUATION TECHNIQUE: NON-MARKET- OBSERVABLE INPUTS
(LEVEL 3) TOTAL
NZD’000 NZD’000 NZD’000 NZD’000
Other assets at fair value
Forests 36,979 36,979
Livestock 17,921 17,921
Property, plant and equipment (viii) 105,117 105,117
Total other assets at fair value – 17,921 142,096 160,017
Total assets at fair value 6,933,057 6,299,607 3,759,048 16,991,712
Financial liabilities
Derivative financial instrument liabilities:
Forward foreign exchange contracts 281,873 281,873
Cross currency swaps 34,462 34,462
Asset swaps 107,882 107,882
Futures contracts – –
Total return swaps – equity 200,493 200,493
Total return swaps – bonds 4,997 4,997
Credit default swaps 13,020 13,020
Interest rate swaps 7,646 7,646
Options 3,541 3,541
Total financial liabilities at fair value – 653,914 – 653,914
Total liabilities at fair value – 653,914 – 653,914
(i) The fair value of longevity contingent swaps is provided by the counterparty and is calculated by reference to movements in the underlying basket of contracts. The price provided by the counterparty is a non-binding bid price based on a valuation model, which uses a discount rate of 19%. If a 2% movement in discount rate is applied, the fair value of the swap would increase by $7,127,000 or decrease by $6,296,000.
(ii) For Level 3 other OTC swaps, the fair value is determined using an internally-generated model, with the key input being interest rates. The other OTC swaps are market-neutral, and the interest rate is fixed (1.5%-2.0%). A reasonably likely movement in the fair value in a one-year period has been determined to be 0% based on internal risk modelling, which would increase or decrease the fair value of these securities by $nil.
(iii) The fair value of listed equities is determined based on the last quoted bid price on the relevant exchange as of the close of business at balance date. In some instances, where the market on which the security is traded is not highly liquid (e.g. the security may be listed on an emerging market stock exchange), the price is determined using non-binding broker quotes. These securities have been classified as Level 3. A reasonably likely movement in the fair value in a one-year period has been determined to be 20% based on internal risk modelling, which would increase or decrease the fair value of these securities by $15,500.
(iv) The fair value of other fixed income investments is determined by a reputable pricing vendor who uses models to value the securities or by an independent valuer if the fixed income instrument forms part
Notes to the Financial Statements (continued)
For the year ended 30 June 2014
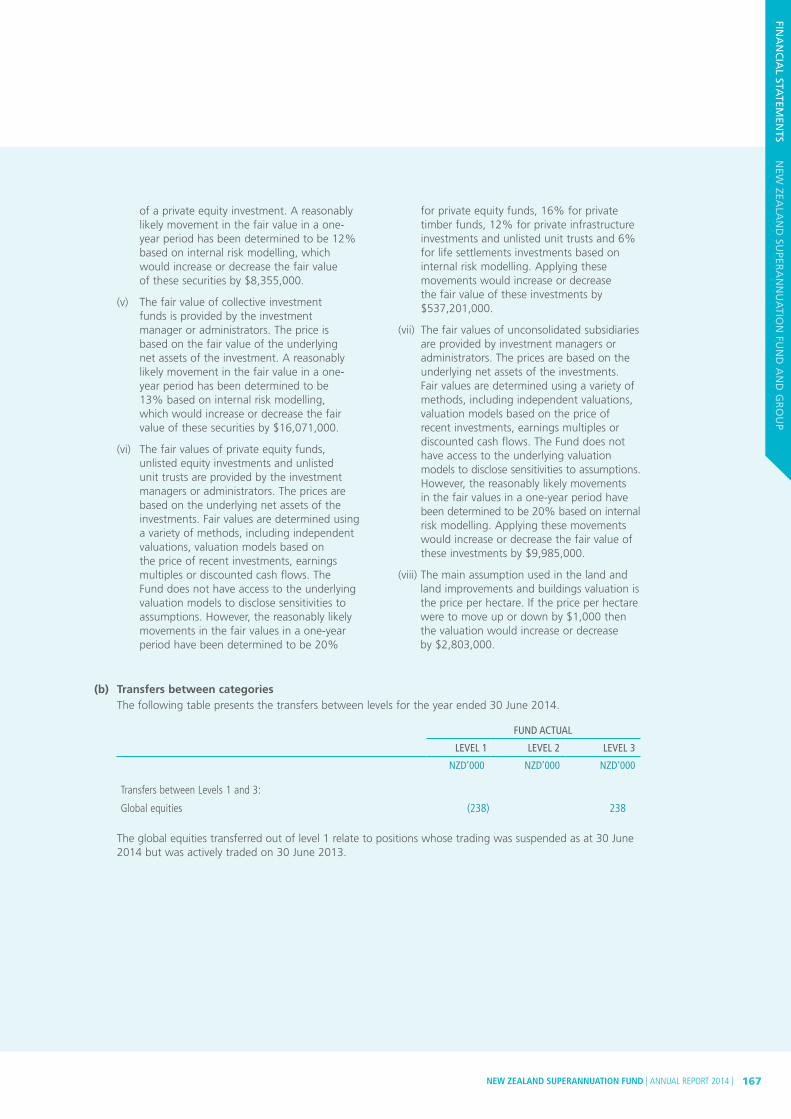
NEW ZEALAND SUPERANNUATION FUND | ANNUAL REPORT 2014 | 167
of a private equity investment. A reasonably likely movement in the fair value in a one-year period has been determined to be 12% based on internal risk modelling, which would increase or decrease the fair value of these securities by $8,355,000.
(v) The fair value of collective investment funds is provided by the investment manager or administrators. The price is based on the fair value of the underlying net assets of the investment. A reasonably likely movement in the fair value in a one-year period has been determined to be 13% based on internal risk modelling, which would increase or decrease the fair value of these securities by $16,071,000.
(vi) The fair values of private equity funds, unlisted equity investments and unlisted unit trusts are provided by the investment managers or administrators. The prices are based on the underlying net assets of the investments. Fair values are determined using a variety of methods, including independent valuations, valuation models based on the price of recent investments, earnings multiples or discounted cash flows. The Fund does not have access to the underlying valuation models to disclose sensitivities to assumptions. However, the reasonably likely movements in the fair values in a one-year period have been determined to be 20%
for private equity funds, 16% for private timber funds, 12% for private infrastructure investments and unlisted unit trusts and 6% for life settlements investments based on internal risk modelling. Applying these movements would increase or decrease the fair value of these investments by $537,201,000.
(vii) The fair values of unconsolidated subsidiaries are provided by investment managers or administrators. The prices are based on the underlying net assets of the investments. Fair values are determined using a variety of methods, including independent valuations, valuation models based on the price of recent investments, earnings multiples or discounted cash flows. The Fund does not have access to the underlying valuation models to disclose sensitivities to assumptions. However, the reasonably likely movements in the fair values in a one-year period have been determined to be 20% based on internal risk modelling. Applying these movements would increase or decrease the fair value of these investments by $9,985,000.
(viii) The main assumption used in the land and land improvements and buildings valuation is the price per hectare. If the price per hectare were to move up or down by $1,000 then the valuation would increase or decrease by $2,803,000.
(b) Transfers between categories The following table presents the transfers between levels for the year ended 30 June 2014.
FUND ACTUAL
LEVEL 1 LEVEL 2 LEVEL 3
NZD’000 NZD’000 NZD’000
Transfers between Levels 1 and 3:
Global equities (238) 238
The global equities transferred out of level 1 relate to positions whose trading was suspended as at 30 June 2014 but was actively traded on 30 June 2013.
FINA
NC
IAL STA
TEMEN
TS N
EW ZEA
LAN
D SU
PERA
NN
UA
TION
FUN
D A
ND
GR
OU
P
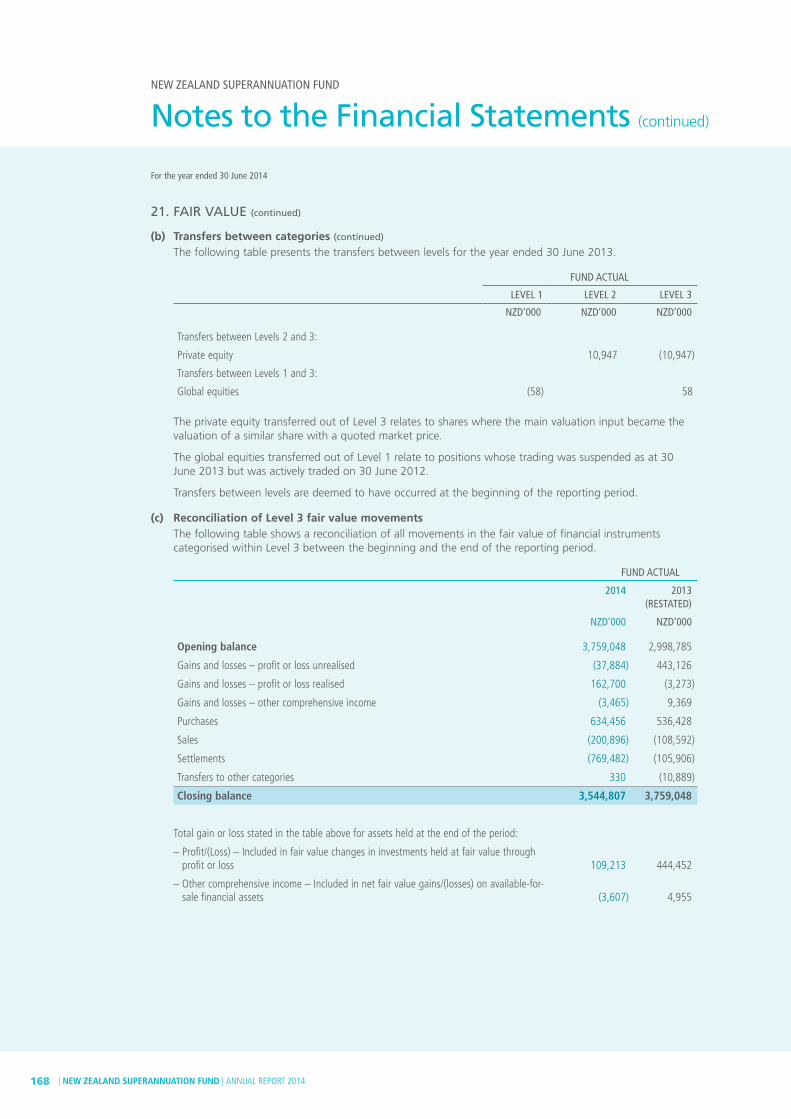
| NEW ZEALAND SUPERANNUATION FUND | ANNUAL REPORT 2014168
NEW ZEALAND SUPERANNUATION FUND
21. FAIR VALUE (continued)
(b) Transfers between categories (continued)
The following table presents the transfers between levels for the year ended 30 June 2013.
FUND ACTUAL
LEVEL 1 LEVEL 2 LEVEL 3
NZD’000 NZD’000 NZD’000
Transfers between Levels 2 and 3:
Private equity 10,947 (10,947)
Transfers between Levels 1 and 3:
Global equities (58) 58
The private equity transferred out of Level 3 relates to shares where the main valuation input became the valuation of a similar share with a quoted market price.
The global equities transferred out of Level 1 relate to positions whose trading was suspended as at 30 June 2013 but was actively traded on 30 June 2012.
Transfers between levels are deemed to have occurred at the beginning of the reporting period.
(c) Reconciliation of Level 3 fair value movements The following table shows a reconciliation of all movements in the fair value of financial instruments
categorised within Level 3 between the beginning and the end of the reporting period.
FUND ACTUAL
2014 2013 (RESTATED)
NZD’000 NZD’000
Opening balance 3,759,048 2,998,785
Gains and losses – profit or loss unrealised (37,884) 443,126
Gains and losses – profit or loss realised 162,700 (3,273)
Gains and losses – other comprehensive income (3,465) 9,369
Purchases 634,456 536,428
Sales (200,896) (108,592)
Settlements (769,482) (105,906)
Transfers to other categories 330 (10,889)
Closing balance 3,544,807 3,759,048
Total gain or loss stated in the table above for assets held at the end of the period:
– Profit/(Loss) – Included in fair value changes in investments held at fair value through profit or loss 109,213 444,452
– Other comprehensive income – Included in net fair value gains/(losses) on available-for-sale financial assets (3,607) 4,955
Notes to the Financial Statements (continued)
For the year ended 30 June 2014

NEW ZEALAND SUPERANNUATION FUND | ANNUAL REPORT 2014 | 169
(d) Assets and liabilities not carried at fair value but for which fair value is disclosed The following tables analyse within the fair value hierarchy the Fund’s assets and liabilities (by class)
not measured at fair value but for which fair value is disclosed. These assets and liabilities are carried at amortised cost; their carrying values are a reasonable approximation of fair value.
FUND ACTUAL
2014 LEVEL 1 LEVEL 2 LEVEL 3 TOTAL
NZD’000 NZD’000 NZD’000 NZD’000
Financial assets
Cash and cash equivalents 3,759,673 3,759,673
Cash pledged as collateral 171,204 171,204
Trade and other receivables 258,205 258,205
Other fixed income 522,725 522,725
Reverse repurchase agreements 171,321 171,321
Crops 313 313
Property, plant and equipment 4,723 4,723
Financial liabilities
Cash collateral received 577,976 577,976
Trade and other payables 781,833 781,833
FUND ACTUAL
2013 LEVEL 1 LEVEL 2 LEVEL 3 TOTAL
NZD’000 NZD’000 NZD’000 NZD’000
Financial assets
Cash and cash equivalents 5,625,397 5,625,397
Cash pledged as collateral 597,844 597,844
Trade and other receivables 114,599 114,599
Other fixed income 227,103 227,103
Reverse repurchase agreements 831,701 831,701
Redeemable preference shares 57,500 57,500
Crops 247 247
Property, plant and equipment 4,553 4,553
Financial liabilities
Cash collateral received 81,419 81,419
Trade and other payables 728,183 728,183
FINA
NC
IAL STA
TEMEN
TS N
EW ZEA
LAN
D SU
PERA
NN
UA
TION
FUN
D A
ND
GR
OU
P
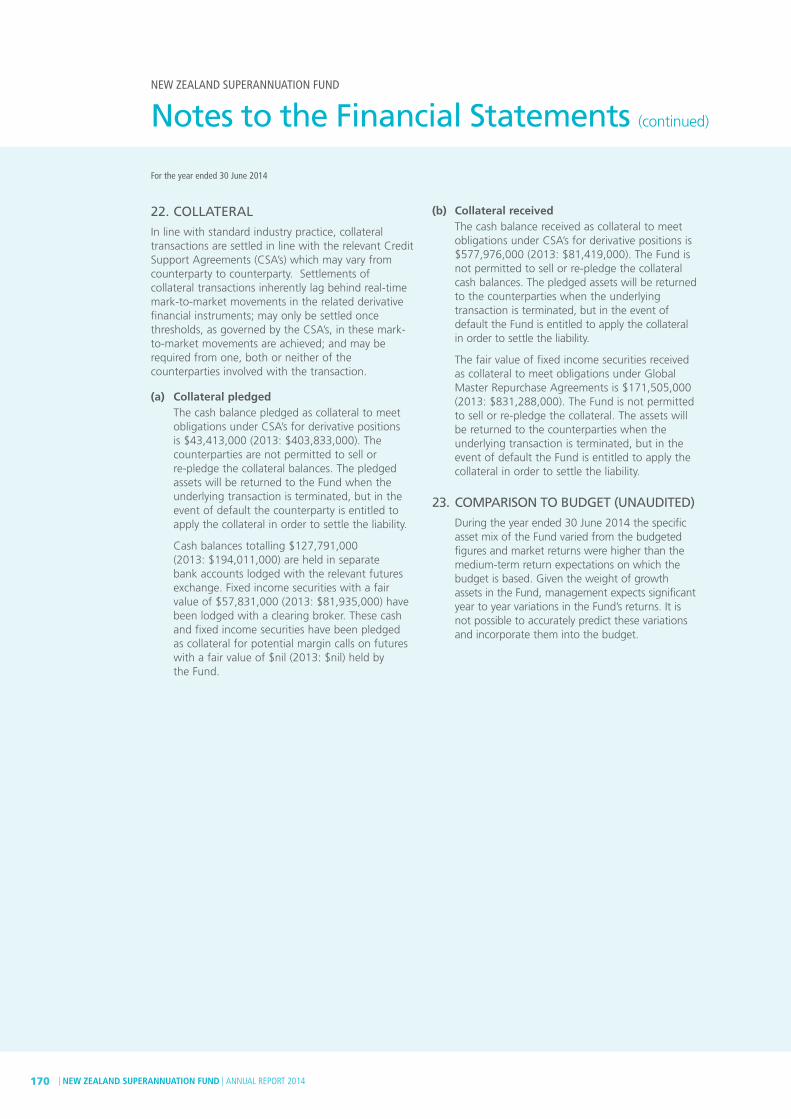
| NEW ZEALAND SUPERANNUATION FUND | ANNUAL REPORT 2014170
NEW ZEALAND SUPERANNUATION FUND
22. COLLATERAL
In line with standard industry practice, collateral transactions are settled in line with the relevant Credit Support Agreements (CSA’s) which may vary from counterparty to counterparty. Settlements of collateral transactions inherently lag behind real-time mark-to-market movements in the related derivative financial instruments; may only be settled once thresholds, as governed by the CSA’s, in these mark-to-market movements are achieved; and may be required from one, both or neither of the counterparties involved with the transaction.
(a) Collateral pledged The cash balance pledged as collateral to meet
obligations under CSA’s for derivative positions is $43,413,000 (2013: $403,833,000). The counterparties are not permitted to sell or re-pledge the collateral balances. The pledged assets will be returned to the Fund when the underlying transaction is terminated, but in the event of default the counterparty is entitled to apply the collateral in order to settle the liability.
Cash balances totalling $127,791,000 (2013: $194,011,000) are held in separate bank accounts lodged with the relevant futures exchange. Fixed income securities with a fair value of $57,831,000 (2013: $81,935,000) have been lodged with a clearing broker. These cash and fixed income securities have been pledged as collateral for potential margin calls on futures with a fair value of $nil (2013: $nil) held by the Fund.
(b) Collateral received The cash balance received as collateral to meet
obligations under CSA’s for derivative positions is $577,976,000 (2013: $81,419,000). The Fund is not permitted to sell or re-pledge the collateral cash balances. The pledged assets will be returned to the counterparties when the underlying transaction is terminated, but in the event of default the Fund is entitled to apply the collateral in order to settle the liability.
The fair value of fixed income securities received as collateral to meet obligations under Global Master Repurchase Agreements is $171,505,000 (2013: $831,288,000). The Fund is not permitted to sell or re-pledge the collateral. The assets will be returned to the counterparties when the underlying transaction is terminated, but in the event of default the Fund is entitled to apply the collateral in order to settle the liability.
23. COMPARISON TO BUDGET (UNAUDITED)
During the year ended 30 June 2014 the specific asset mix of the Fund varied from the budgeted figures and market returns were higher than the medium-term return expectations on which the budget is based. Given the weight of growth assets in the Fund, management expects significant year to year variations in the Fund’s returns. It is not possible to accurately predict these variations and incorporate them into the budget.
Notes to the Financial Statements (continued)
For the year ended 30 June 2014

NEW ZEALAND SUPERANNUATION FUND | ANNUAL REPORT 2014 | 171
Independent Auditor’s Report
TO THE READERS OF THE NEW ZEALAND SUPERANNUATION FUND FINANCIAL STATEMENTS
FOR THE YEAR ENDED 30 JUNE 2014
The Auditor-General is the auditor of the New Zealand Superannuation Fund (the Fund). The Auditor-General has appointed me, Brent Penrose, using the staff and resources of Ernst & Young, to carry out the audit of the financial statements of the Fund on her behalf.
We have audited the financial statements of the Fund on pages 97 to 170, that comprise the Statement of Financial Position as at 30 June 2014, the Statement of Comprehensive Income, Statement of Changes in Public Equity and Statement of Cash Flows for the year ended on that date and the notes to the financial statements that include accounting policies and other explanatory information.
OPINION
In our opinion the financial statements of the Fund on pages 97 to 170:
– comply with generally accepted accounting practice in New Zealand; and
– give a true and fair view of the Fund’s:
• financial position as at 30 June 2014; and
• financial performance and cash flows for the year ended on that date.
Our audit was completed on 17 September 2014. This is the date at which our opinion is expressed.
The basis of our opinion is explained below. In addition, we outline the responsibilities of the Guardians of New Zealand Superannuation (the Guardians) and our responsibilities, and we explain our independence.
BASIS OF OPINION
We carried out our audit in accordance with the Auditor-General’s Auditing Standards, which incorporate the International Standards on Auditing (New Zealand). Those standards require that we comply with ethical requirements and plan and carry out our audit to obtain reasonable assurance about whether the financial statements are free from material misstatement.
Material misstatements are differences or omissions of amounts and disclosures that, in our judgement, are likely to influence readers’ overall understanding of the financial statements. If we had found material misstatements that were not corrected, we would have referred to them in our opinion.
An audit involves carrying out procedures to obtain audit evidence about the amounts and disclosures in the financial statements. The procedures selected depend on our judgement, including our assessment of risks of material misstatement of the financial statements whether due to fraud or error. In making those risk assessments, we consider internal control relevant to the preparation of the Fund’s financial statements that give a true and fair view of the matters to which they relate. We consider internal control in order to design audit procedures that are appropriate in the circumstances but not for the purpose of expressing an opinion on the effectiveness of the Fund’s internal control.
An audit also involves evaluating:
– the appropriateness of accounting policies used and whether they have been consistently applied;
– the reasonableness of the significant accounting estimates and judgements made by the Guardians;
– the adequacy of all disclosures in the financial statements; and
– the overall presentation of the financial statements.
We did not examine every transaction, nor do we guarantee complete accuracy of the financial statements. Also we did not evaluate the security and controls over the electronic publication of the financial statements.
We have obtained all the information and explanations we have required and we believe we have obtained sufficient and appropriate audit evidence to provide a basis for our audit opinion.
FINA
NC
IAL STA
TEMEN
TS N
EW ZEA
LAN
D SU
PERA
NN
UA
TION
FUN
D A
ND
GR
OU
P

| NEW ZEALAND SUPERANNUATION FUND | ANNUAL REPORT 2014172
NEW ZEALAND SUPERANNUATION FUND
Independent Auditor’s Report (continued)
RESPONSIBILITIES OF THE GUARDIANS
The Guardians are responsible for preparing financial statements that:
– comply with generally accepted accounting practice in New Zealand; and
– give a true and fair view of the Fund’s financial position, financial performance and cash flows.
The Guardians are also responsible for such internal control as it determines is necessary to enable the preparation of financial statements that are free from material misstatement, whether due to fraud or error. The Guardians are also responsible for the publication of the financial statements, whether in printed or electronic form.
The Guardians’ responsibilities arise from the New Zealand Superannuation and Retirement Income Act 2001.
RESPONSIBILITIES OF THE AUDITOR
We are responsible for expressing an independent opinion on the financial statements and reporting that opinion to you based on our audit. Our responsibility arises from section 15 of the Public Audit Act 2001 and the New Zealand Superannuation and Retirement Income Act 2001.
INDEPENDENCE
When carrying out the audit we followed the independence requirements of the Auditor-General, which incorporate the independence requirements of the External Reporting Board.
We have performed a limited assurance engagement in respect of Fund performance. Other than this engagement and the audit, we have no relationship with or interests in the Fund or any of its subsidiaries.
Brent PenroseErnst & YoungOn behalf of the Auditor-GeneralAuckland, New Zealand

GUARDIANS OF NEW ZEALAND SUPERANNUATION AND GROUP
Statement of Responsibility 174
Statement of Comprehensive Income 175
Statement of Financial Position 176
Statement of Changes in Public Equity 177
Statement of Cash Flows 178
Statement of Commitments 179
Statement of Contingent Liabilities 179
Notes to the Financial Statements 180
Independent Auditor’s Report 198
Financial Statements

| NEW ZEALAND SUPERANNUATION FUND | ANNUAL REPORT 2014174
The Board and management of the Guardians of New Zealand Superannuation accept responsibility for the preparation of the annual financial statements and the Statement of Service Performance of the Guardians of New Zealand Superannuation and Group and the judgements used in them.
The Board and management of the Guardians of New Zealand Superannuation accept responsibility for establishing and maintaining a system of internal controls designed to provide reasonable assurance as to the integrity and reliability of financial and non-financial reporting of the Guardians of New Zealand Superannuation and Group.
In the opinion of the Board and management of the Guardians of New Zealand Superannuation, the annual financial statements and the Statement of Service Performance for the year ended 30 June 2014 fairly reflect the financial position, operations and cash flows of the Guardians of New Zealand Superannuation and Group.
GAVIN WALKER, CHAIRMAN MARK TUME, BOARD MEMBER
17 September 2014 17 September 2014
Statement of ResponsibilityGUARDIANS OF NEW ZEALAND SUPERANNUATION

NEW ZEALAND SUPERANNUATION FUND | ANNUAL REPORT 2014 | 175
Statement of Comprehensive Income
For the year ended 30 June 2014PARENT AND GROUP
ACTUAL BUDGET
(UNAUDITED)
2014 2013 2014
NOTE NZD’000 NZD’000 NZD’000
Revenue 2(a) 30,661 26,106 34,994
Expenses 2(b) 30,661 26,106 34,994
Profit/(Loss) for the year – – –
Other comprehensive income – – –
Total comprehensive income for the year – – –
The attached notes form part of, and should be read in conjunction with, these financial statements.
FINA
NC
IAL STA
TEMEN
TS G
UA
RD
IAN
S OF N
EW ZEA
LAN
D SU
PERA
NN
UA
TION
AN
D G
RO
UP
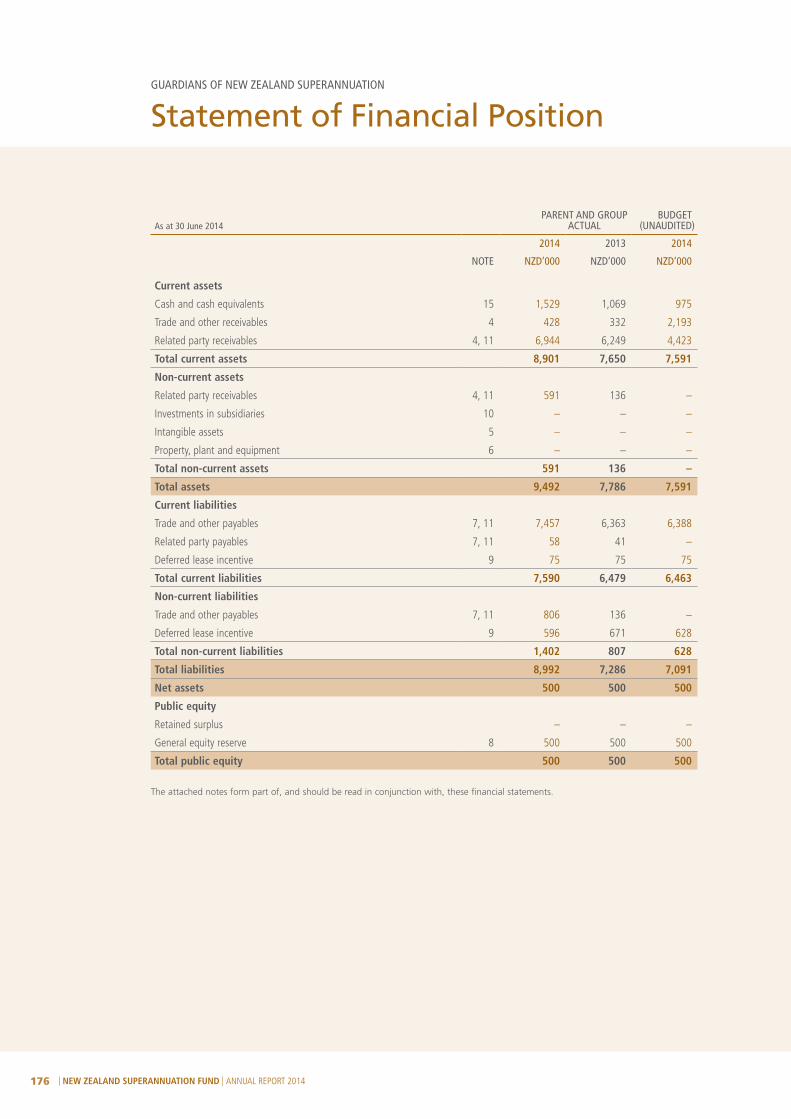
| NEW ZEALAND SUPERANNUATION FUND | ANNUAL REPORT 2014176
Statement of Financial Position
As at 30 June 2014PARENT AND GROUP
ACTUAL BUDGET
(UNAUDITED)
2014 2013 2014
NOTE NZD’000 NZD’000 NZD’000
Current assets
Cash and cash equivalents 15 1,529 1,069 975
Trade and other receivables 4 428 332 2,193
Related party receivables 4, 11 6,944 6,249 4,423
Total current assets 8,901 7,650 7,591
Non-current assets
Related party receivables 4, 11 591 136 –
Investments in subsidiaries 10 – – –
Intangible assets 5 – – –
Property, plant and equipment 6 – – –
Total non-current assets 591 136 –
Total assets 9,492 7,786 7,591
Current liabilities
Trade and other payables 7, 11 7,457 6,363 6,388
Related party payables 7, 11 58 41 –
Deferred lease incentive 9 75 75 75
Total current liabilities 7,590 6,479 6,463
Non-current liabilities
Trade and other payables 7, 11 806 136 –
Deferred lease incentive 9 596 671 628
Total non-current liabilities 1,402 807 628
Total liabilities 8,992 7,286 7,091
Net assets 500 500 500
Public equity
Retained surplus – – –
General equity reserve 8 500 500 500
Total public equity 500 500 500
The attached notes form part of, and should be read in conjunction with, these financial statements.
GUARDIANS OF NEW ZEALAND SUPERANNUATION

NEW ZEALAND SUPERANNUATION FUND | ANNUAL REPORT 2014 | 177
Statement of Changes in Public Equity
For the year ended 30 June 2014 PARENT AND GROUP ACTUAL
GENERAL EQUITY
RESERVE RETAINED SURPLUS TOTAL
NZD’000 NZD’000 NZD’000
Balance at 1 July 2012 500 – 500
Profit/(Loss) for the year – – –
Other comprehensive income for the year – – –
Balance at 30 June 2013 500 – 500
Profit/(Loss) for the year – – –
Other comprehensive income for the year – – –
Balance at 30 June 2014 500 – 500
The attached notes form part of, and should be read in conjunction with, these financial statements.
FINA
NC
IAL STA
TEMEN
TS G
UA
RD
IAN
S OF N
EW ZEA
LAN
D SU
PERA
NN
UA
TION
AN
D G
RO
UP
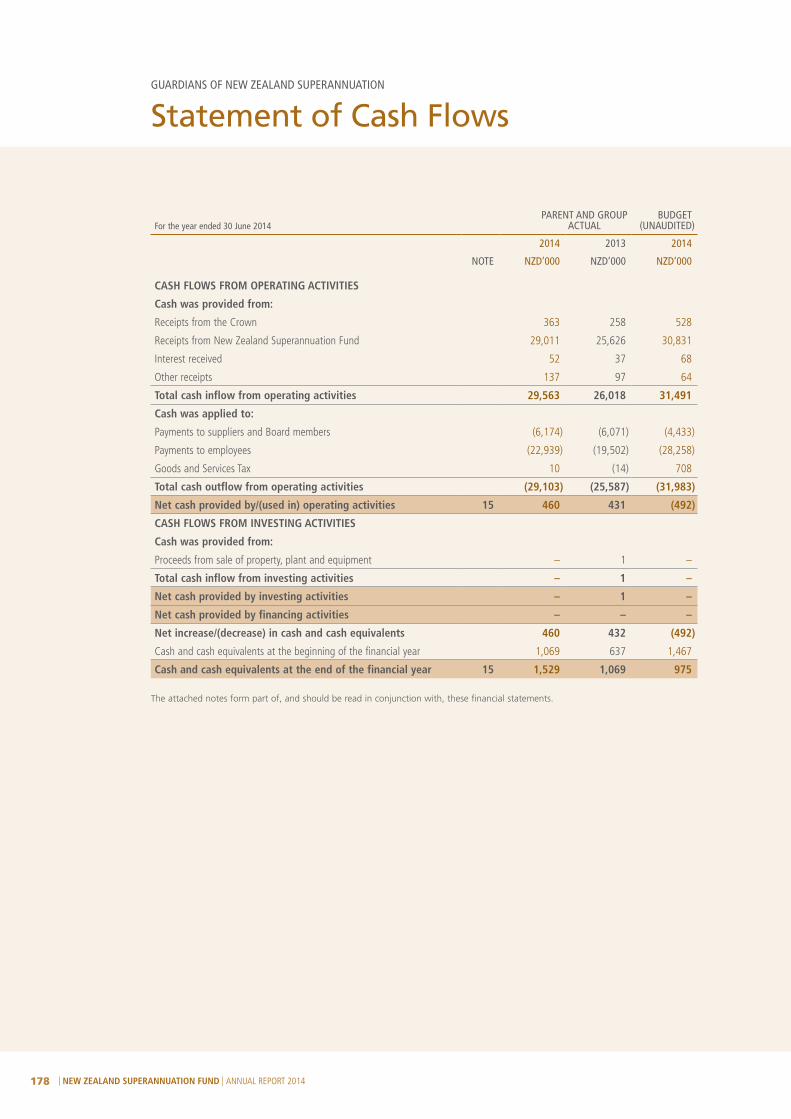
| NEW ZEALAND SUPERANNUATION FUND | ANNUAL REPORT 2014178
Statement of Cash Flows
For the year ended 30 June 2014PARENT AND GROUP
ACTUAL BUDGET
(UNAUDITED)
2014 2013 2014
NOTE NZD’000 NZD’000 NZD’000
CASH FLOWS FROM OPERATING ACTIVITIES
Cash was provided from:
Receipts from the Crown 363 258 528
Receipts from New Zealand Superannuation Fund 29,011 25,626 30,831
Interest received 52 37 68
Other receipts 137 97 64
Total cash inflow from operating activities 29,563 26,018 31,491
Cash was applied to:
Payments to suppliers and Board members (6,174) (6,071) (4,433)
Payments to employees (22,939) (19,502) (28,258)
Goods and Services Tax 10 (14) 708
Total cash outflow from operating activities (29,103) (25,587) (31,983)
Net cash provided by/(used in) operating activities 15 460 431 (492)
CASH FLOWS FROM INVESTING ACTIVITIES
Cash was provided from:
Proceeds from sale of property, plant and equipment – 1 –
Total cash inflow from investing activities – 1 –
Net cash provided by investing activities – 1 –
Net cash provided by financing activities – – –
Net increase/(decrease) in cash and cash equivalents 460 432 (492)
Cash and cash equivalents at the beginning of the financial year 1,069 637 1,467
Cash and cash equivalents at the end of the financial year 15 1,529 1,069 975
The attached notes form part of, and should be read in conjunction with, these financial statements.
GUARDIANS OF NEW ZEALAND SUPERANNUATION

NEW ZEALAND SUPERANNUATION FUND | ANNUAL REPORT 2014 | 179
Statement of Commitments
As at 30 June 2014PARENT AND GROUP
ACTUAL
2014 2013
NZD’000 NZD’000
Non-cancellable operating lease commitments payable
No later than 1 year 579 507
1 – 2 years 579 507
2 – 5 years 1,738 1,522
Later than 5 years 2,317 2,537
5,213 5,073
Statement of Contingent LiabilitiesAs at 30 June 2014
There were no contingent liabilities as at 30 June 2014 (2013: nil).
FINA
NC
IAL STA
TEMEN
TS G
UA
RD
IAN
S OF N
EW ZEA
LAN
D SU
PERA
NN
UA
TION
AN
D G
RO
UP
| NEW ZEALAND SUPERANNUATION FUND | ANNUAL REPORT 2014180
Notes to the Financial Statements
1. SUMMARY OF SIGNIFICANT ACCOUNTING POLICIES
GENERAL INFORMATIONThese are the financial statements of the Guardians of New Zealand Superannuation (the Guardians), a Crown entity in terms of the Crown Entities Act 2004.
The Guardians is domiciled in New Zealand and the address of its principal place of business is set out in the Corporate Directory on page 205.
STATEMENT OF COMPLIANCEThe Guardians is a public benefit entity, as the primary purpose is to manage and administer the New Zealand Superannuation Fund (Fund). The financial statements have been prepared in accordance with Generally Accepted Accounting Practice in New Zealand (NZ GAAP). They comply with the New Zealand Equivalents to International Financial Reporting Standards (NZ IFRS) and other applicable financial reporting standards as appropriate for public benefit entities.
The financial statements of the Guardians of New Zealand Superannuation and Subsidiaries (Group) for the year ended 30 June 2014 were authorised for issue in accordance with a resolution of the Board of Guardians of New Zealand Superannuation on 17 September 2014.
BASIS OF PREPARATIONThe financial statements have been prepared in accordance with the Crown Entities Act 2004 and the Public Finance Act 1989.
The financial statements have been prepared on a historical cost basis, are presented in New Zealand dollars and all values are rounded to the nearest thousand dollars (NZD’000).
Accounting policies are selected and applied in a manner which ensures that the resulting financial information satisfies the concepts of relevance and reliability, thereby ensuring that the substance of the underlying transactions or other events is reported.
In May 2014 the External Reporting Board (XRB) approved, with effect for periods on or after 1 July 2014, a new framework for public sector Public Benefit Entities (PBE’s), including a suite of 39 standards based largely on International Public Sector Accounting Standards (IPSAS). The Guardians will adopt the new framework when it becomes mandatory. In the interim, any new or amended NZ IFRS’s released during the year are not applicable to PBE’s and hence have not been adopted in these financial statements.
The new framework is not expected to result in a material impact on the Guardian’s financial statements.
For the year ended 30 June 2014
GUARDIANS OF NEW ZEALAND SUPERANNUATION

NEW ZEALAND SUPERANNUATION FUND | ANNUAL REPORT 2014 | 181
The following particular accounting policies which materially affect the preparation of the financial statements have been applied:
(a) Budget figures The budget was approved by the Board of the
Guardians of New Zealand Superannuation for the year. The budget figures are unaudited.
(b) Consolidation of subsidiaries The Group financial statements comprise the
Guardians of New Zealand Superannuation and its subsidiaries.
Subsidiaries are those entities that are controlled by the Guardians. The financial statements of subsidiaries are prepared for the same reporting period as the parent entity, using consistent accounting policies.
Adjustments are made to bring into line any dissimilar accounting policies that may exist.
The results of any subsidiaries that become or cease to be part of the Group during the year are consolidated from the date on which control commenced or until the date such control ceased.
All inter-entity transactions, balances and unrealised profits are eliminated on consolidation.
(c) Revenue and income The Group primarily derives revenue through
the provision of outputs to the Crown and to the Fund, and also derives income from its investments. Revenue and income is recognised to the extent which it is probable that the economic benefits will flow to the Group and the revenue can be reliably measured. The following specific recognition criteria must also be met before revenue is recognised:
RENDERING OF SERVICES Revenue from the rendering of services is
recognised by reference to the stage of completion.
New Zealand Superannuation Fund reimbursement of costs:
Stage of completion is measured by the proportion of costs incurred to date, compared to the total costs of the outputs.
Crown appropriations: Revenue is recognised on a straight-line basis
over the period to which the appropriations relate, because the services are performed by an indeterminate number of acts throughout a specified period of time.
Other service revenue: Where outputs cannot be measured reliably,
revenue is recognised only to the extent that the expenses recognised are recoverable.
INTEREST Interest revenue is recognised as the interest
accrues (using the effective interest method which is the rate that exactly discounts estimated future cash receipts through the expected life of the financial instrument to the net carrying amount of the financial asset).
(d) Goods and Services Tax (GST) Revenues, expenses, assets and liabilities are
recognised exclusive of GST, with the exception of receivables and payables which are stated with GST included. Where GST is irrecoverable as an input tax, it is recognised as part of the related asset or expense.
Cash flows are included in the Statement of Cash Flows on a gross basis. The GST components of cash flows arising from investing and financing activities, which are recoverable from, or payable to, the taxation authority, are classified as operating cash flows.
(e) Taxation The Guardians is a public authority in terms of
the Income Tax Act 2007 and consequently is exempt from income tax.
(f) Receivables Short-term receivables are stated at their
estimated realisable value, net of impairment allowance.
Collectability of receivables is reviewed on an ongoing basis. Individual debts that are known to be uncollectible are written off when identified. An impairment provision is recognised when there is objective evidence that the Group will not be able to collect the receivable. Financial difficulties of the debtor, default payments or debts more than 60 days overdue are considered objective evidence of impairment. The amount of the impairment loss is the difference between the carrying amount of the receivable and the present value of estimated future cash flows, discounted at the original effective interest rate.
(g) Subsidiaries Subsequent to initial recognition, investments in
subsidiaries are measured at cost.
FINA
NC
IAL STA
TEMEN
TS G
UA
RD
IAN
S OF N
EW ZEA
LAN
D SU
PERA
NN
UA
TION
AN
D G
RO
UP
| NEW ZEALAND SUPERANNUATION FUND | ANNUAL REPORT 2014182
1. SUMMARY OF SIGNIFICANT ACCOUNTING POLICIES (continued)
(h) Property, plant and equipment
INITIAL RECORDING All items of property, plant and equipment
are initially recognised at cost. Cost includes the value of consideration exchanged, or fair value in the case of donated or subsidised assets, and those expenses directly attributable to bringing the item to working condition for its intended use.
SUBSEQUENT EXPENDITURE Subsequent expenditure relating to an item
of property, plant and equipment is capitalised to the initial cost of the item when the expenditure increases the economic benefits over the life of the item or where that expenditure was necessarily incurred to enable the future economic benefits to be obtained and the expenditure would have been included in the initial cost of the item had the expenditure been incurred at the time of acquisition.
All other subsequent expenditure is expensed in the period in which it is incurred.
SUBSEQUENT MEASUREMENT Subsequent to initial recognition, property, plant
and equipment is stated at cost less accumulated depreciation and any impairment in value.
DISPOSAL An item of property, plant and equipment is
derecognised upon disposal or when no future economic benefits are expected to arise from the continued use of the asset.
Any gain or loss arising on disposal of the asset (calculated as the difference between the net disposal proceeds and the carrying amount of an item) is included in the Statement of Comprehensive Income in the year the item is disposed of.
IMPAIRMENT All items of property, plant and equipment are
assessed for indications of impairment at each balance date. If any indication of impairment exists, an estimate of the asset’s recoverable amount is calculated.
Where the carrying amount is assessed to be greater than its recoverable amount, the item is written down to its recoverable amount. The write-down is recognised in the Statement of Comprehensive Income.
Where an impairment loss subsequently reverses, the carrying amount of the item is increased to the revised estimate of its recoverable amount, but only to the extent that the increased carrying amount does not exceed the carrying amount which would have been determined had no impairment loss been recognised for the item in prior years. A reversal of an impairment loss is recognised in the Statement of Comprehensive Income immediately.
The recoverable amount is the greater of fair value less costs to sell and value in use. The recoverable amount is determined for an individual asset, unless the asset’s value in use cannot be estimated to be close to its fair value less costs to sell and it does not generate cash inflows that are largely independent of those from other assets or groups of assets, in which case the recoverable amount is determined for the cash-generating unit to which the asset belongs.
In assessing value in use, the estimated pre-tax future cash flows are discounted to their present value using a pre-tax discount rate that reflects current market assessments of the time value of money and the risks specific to the asset.
(i) Depreciation Depreciation is provided on a straight-line basis
on all property, plant and equipment at a rate that will write off the cost of the assets to their estimated residual value over their useful lives.
The useful lives of major classes of assets have been estimated as follows:
Office equipment 3 years
Computer equipment 1 – 3 years
Notes to the Financial Statements (continued)
For the year ended 30 June 2014
GUARDIANS OF NEW ZEALAND SUPERANNUATION

NEW ZEALAND SUPERANNUATION FUND | ANNUAL REPORT 2014 | 183
(j) Intangible assets Software and licences are finite life intangibles
and are recorded at cost less accumulated amortisation and impairment. Amortisation is charged on a straight-line basis over their estimated useful lives of three years. The estimated useful life and amortisation method is reviewed at the end of each annual reporting period.
(k) Employee benefits Provision is made for benefits accruing to
employees in respect of wages and salaries, annual leave, long service leave, incentives and sick leave when it is probable that settlement will be required and such benefits are capable of being measured reliably.
Provisions made in respect of employee benefits expected to be settled within 12 months are measured at their nominal values using the remuneration rate expected to apply at the time of settlement.
Provisions made in respect of employee benefits that are not expected to be settled within 12 months are measured at the present value of the estimated future cash outflows to be made by the Group in respect of services provided by employees up to reporting date. The estimated future cash flows are based on likely future entitlements accruing to staff, based on years of service, years to entitlement, the likelihood that staff will reach the point of entitlement, and contractual entitlement information.
(l) Operating leases The determination of whether an arrangement
is, or contains, a lease is based on the substance of the arrangement and requires an assessment of whether the fulfilment of the arrangement is dependent on the use of a specific asset or assets and the arrangement conveys a right to use the asset.
Leases where the lessor effectively retains substantially all the risks and benefits of ownership of the leased items are classified as operating leases. Operating lease expenses are recognised on a straight-line basis over the period of the lease.
In the event that lease incentives are received to enter into operating leases, such incentives are recognised as deferred income in the Statement of Financial Position. The aggregate benefits of incentives are recognised as a reduction of rental expense on a straight-line basis over the period of the lease.
(m) Foreign currency transactions Transactions denominated in a foreign
currency are converted to New Zealand dollars at the exchange rate in effect at the date of the transaction.
Monetary assets and liabilities denominated in a foreign currency at balance date are translated at the rate of exchange ruling as at that date. The resulting exchange differences are recognised in the Statement of Comprehensive Income. Foreign exchange gains and losses for fair value through profit or loss investments are included within the change in their fair value.
(n) Financial instruments The Group is party to financial instruments as
part of its normal operations. These financial instruments include cash and cash equivalents, receivables and payables. All financial instruments are recognised in the Statement of Financial Position and all revenues and expenses in relation to financial instruments are recognised in the Statement of Comprehensive Income.
Financial assets and financial liabilities are recognised in the Statement of Financial Position when the Group becomes a party to the contractual provisions of the instrument. The Group offsets financial assets and financial liabilities when it currently has a legally enforceable right to set off the recognised amounts and interests and intends to settle on a net basis.
Except for items covered by a separate accounting policy, all financial instruments are shown at their amortised cost.
(o) Provisions Provisions are recognised when the Group has a
present obligation as a result of a past event, the future sacrifice of economic benefits is probable and the amount of the provision can be measured reliably.
The amount recognised as a provision is the best estimate of the consideration required to settle the present obligation at the reporting date, taking into account the risks and uncertainties surrounding the obligation. Where a provision is measured using the cash flows estimated to settle the present obligation, its carrying amount is the present value of those cash flows.
FINA
NC
IAL STA
TEMEN
TS G
UA
RD
IAN
S OF N
EW ZEA
LAN
D SU
PERA
NN
UA
TION
AN
D G
RO
UP

| NEW ZEALAND SUPERANNUATION FUND | ANNUAL REPORT 2014184
1. SUMMARY OF SIGNIFICANT ACCOUNTING POLICIES (continued)
(o) Provisions (continued)
When some or all of the economic benefits required to settle a provision are expected to be recovered from a third party, the receivable is recognised as an asset if it is virtually certain that recovery will be received and the amount of the receivable can be measured reliably.
(p) Payables Short-term payables are not interest bearing and
are stated at their nominal value.
(q) Equity Equity is the Crown’s interest in the Guardians
and is measured as the difference between total assets and total liabilities.
(r) Statement of Cash Flows The following are the definitions of the terms
used in the Statement of Cash Flows:
Operating activities include all activities other than investing and financing activities. The cash inflows include all receipts from the sale of goods and services, interest and other sources of revenue that support the Group’s operating activities. Cash outflows include payments made to employees, suppliers and for taxes.
Investing activities are those activities relating to the acquisition, holding and disposal of current and non-current securities and any other non-current assets.
Financing activities are those activities relating to changes in equity and debt capital structure of the Group and those activities relating to the cost of servicing the Group’s equity capital.
Cash and cash equivalents includes cash balances on hand, cash held in bank accounts, demand deposits and other highly liquid investments with an original maturity of three months or less.
(s) Changes in accounting policies There have been no changes in accounting
policies. The accounting policies have been applied consistently throughout these financial statements.
Certain prior year comparatives have been restated to conform with current year presentation. These reclassifications have no impact on the overall financial performance or financial position for the comparable year.
(t) Critical accounting estimates and assumptions
In preparing these financial statements the Group has made estimates and assumptions concerning the future. These estimates and assumptions may differ from the subsequent actual results. Estimates and assumptions are continually evaluated and are based on historical experience and other factors, including expectations of future events that are believed to be reasonable under the circumstances. The estimates and assumptions that have a significant risk of causing a material adjustment to the carrying amount of assets and liabilities within the next financial year are discussed below.
EMPLOYEE ENTITLEMENTS – LONG SERVICE LEAVE
The key assumptions used in calculating the long service leave liability include the discount rate, the likelihood that the employee will reach the required level of service and the salary inflation factor. Any changes in these assumptions will affect the carrying amount of the liability. Expected future payments are discounted using forward rates derived from the yield curve of New Zealand government bonds. The discount rates used have maturities that match, as closely as possible, the estimated future cash outflows. The salary inflation factor has been determined after considering the historical salary inflation patterns.
EMPLOYEE ENTITLEMENTS – LONG-TERM PORTION OF INCENTIVE
A component of the incentive scheme is based on the long-term performance of the Fund. The calculation of this portion of the incentive liability utilises assumptions regarding the future performance of the Fund, the employee’s average salary over the vesting period and the percentage of service rendered. The key variable is the performance of the Fund. Should the performance of the Fund differ from the assumption utilised in the calculation of the long-term portion of the incentive liability, this will impact the employee benefits expense in the Statement of Comprehensive Income and the carrying amount of the incentive liability in the Statement of Financial Position. The Group manages this risk by using a medium-term expectation of Fund performance.
Notes to the Financial Statements (continued)
For the year ended 30 June 2014
GUARDIANS OF NEW ZEALAND SUPERANNUATION

NEW ZEALAND SUPERANNUATION FUND | ANNUAL REPORT 2014 | 185
2. PROFIT/(LOSS) FROM OPERATIONS
PARENT AND GROUP ACTUAL
2014 2013
NZD’000 NZD’000
(a) Revenue
Revenue from operations consisted of the following items:
Appropriations from the Crown 351 318
Cost reimbursement from New Zealand Superannuation Fund 30,137 25,640
Other revenue 121 111
Interest revenue 52 37
30,661 26,106
(b) Expenses
Profit/(Loss) has been arrived at after charging for/(crediting):
Depreciation and amortisation of non-current assets (note 5 and note 6) – –
(Gain)/Loss on disposal of property, plant and equipment – (1)
Auditors’ remuneration (note 3) 42 41
Board members’ fees (note 11) 223 216
Employee benefit expense*:
Employee remuneration and related expenses 19,197 16,398
Employee incentives 5,674 4,419
Employer contributions to KiwiSaver 632 394
Travel and accommodation expenses 1,725 1,625
IT expenses 872 949
Operating lease expenses 436 460
Professional fees 277 316
Other expenses 1,583 1,289
30,661 26,106
* Compensation of key management personnel of the entity is specifically disclosed in note 11.
FINA
NC
IAL STA
TEMEN
TS G
UA
RD
IAN
S OF N
EW ZEA
LAN
D SU
PERA
NN
UA
TION
AN
D G
RO
UP

| NEW ZEALAND SUPERANNUATION FUND | ANNUAL REPORT 2014186
3. REMUNERATION OF AUDITOR
PARENT AND GROUP ACTUAL
2014 2013
NZD’000 NZD’000
Auditor of the parent entity
Audit of the financial statements – Attest current year 42 41
42 41
Auditor of entities in the Group (not including the parent entity)
Audit of the financial statements – –
– –
The audit fees of other entities in the Group are paid by the Fund.
The auditor of all entities in the Group is Brent Penrose of Ernst & Young, on behalf of the Auditor-General.
4. TRADE AND OTHER RECEIVABLES
PARENT AND GROUP ACTUAL
2014 2013
NZD’000 NZD’000
Current receivables
Trade receivables 14 65
Goods and Services Tax (GST) receivable 81 91
Prepayments 333 176
428 332
Related party receivables:
Accident Compensation Corporation (ACC) 13 13
Government Superannuation Fund – 13
The Treasury 100 115
New Zealand Superannuation Fund 6,831 6,108
6,944 6,249
Non-current receivables
Related party receivables:
New Zealand Superannuation Fund 591 136
591 136
Trade receivables have standard 30-day credit terms.
Related party receivables classified as current consist of amounts payable by the Fund or other Crown Entities to the Group on standard 30-day credit terms.
The Group does not have a history of default on receivables. Accordingly, no allowance has been made for impairment.
Notes to the Financial Statements (continued)
For the year ended 30 June 2014
GUARDIANS OF NEW ZEALAND SUPERANNUATION

NEW ZEALAND SUPERANNUATION FUND | ANNUAL REPORT 2014 | 187
5. INTANGIBLE ASSETS
PARENT AND GROUP ACTUAL
2014 2013
NZD’000 NZD’000
Gross carrying amount
Opening balance 21 21
Disposals (19) –
Closing balance 2 21
Accumulated amortisation
Opening balance 21 21
Accumulated amortisation reversed on disposals (19) –
Closing balance 2 21
Net book value – –
Intangible assets are software licences and applications used by the Group in day-to-day operations.
6. PROPERTY, PLANT AND EQUIPMENT
PARENT AND GROUP ACTUAL
OFFICE EQUIPMENT
COMPUTER EQUIPMENT TOTAL
NZD’000 NZD’000 NZD’000
Gross carrying amount
Balance at 1 July 2012 156 46 202
Disposals (8) – (8)
Balance at 30 June 2013 148 46 194
Disposals – (43) (43)
Balance at 30 June 2014 148 3 151
Accumulated depreciation
Balance at 1 July 2012 156 46 202
Accumulated depreciation reversed on disposals (8) – (8)
Balance at 30 June 2013 148 46 194
Accumulated depreciation reversed on disposals – (43) (43)
Balance at 30 June 2014 148 3 151
Net book value
As at 30 June 2013 – – –
As at 30 June 2014 – – –
FINA
NC
IAL STA
TEMEN
TS G
UA
RD
IAN
S OF N
EW ZEA
LAN
D SU
PERA
NN
UA
TION
AN
D G
RO
UP
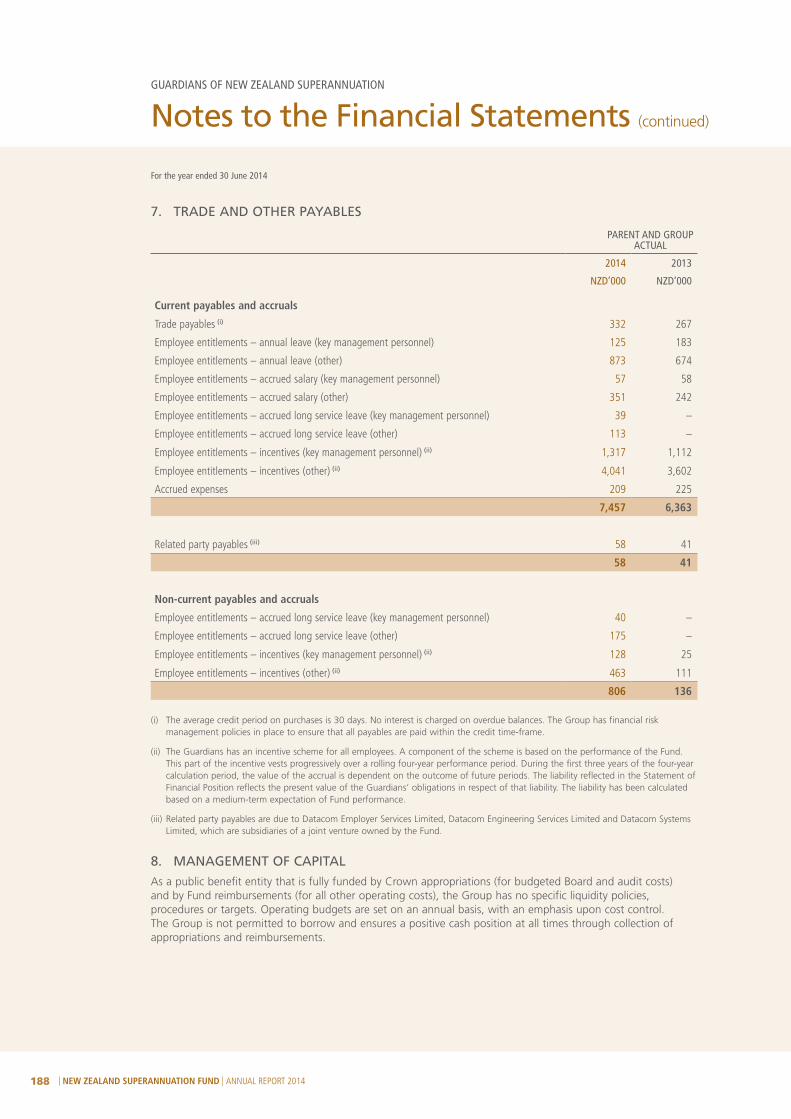
| NEW ZEALAND SUPERANNUATION FUND | ANNUAL REPORT 2014188
7. TRADE AND OTHER PAYABLES
PARENT AND GROUP ACTUAL
2014 2013
NZD’000 NZD’000
Current payables and accruals
Trade payables (i) 332 267
Employee entitlements – annual leave (key management personnel) 125 183
Employee entitlements – annual leave (other) 873 674
Employee entitlements – accrued salary (key management personnel) 57 58
Employee entitlements – accrued salary (other) 351 242
Employee entitlements – accrued long service leave (key management personnel) 39 –
Employee entitlements – accrued long service leave (other) 113 –
Employee entitlements – incentives (key management personnel) (ii) 1,317 1,112
Employee entitlements – incentives (other) (ii) 4,041 3,602
Accrued expenses 209 225
7,457 6,363
Related party payables (iii) 58 41
58 41
Non-current payables and accruals
Employee entitlements – accrued long service leave (key management personnel) 40 –
Employee entitlements – accrued long service leave (other) 175 –
Employee entitlements – incentives (key management personnel) (ii) 128 25
Employee entitlements – incentives (other) (ii) 463 111
806 136
(i) The average credit period on purchases is 30 days. No interest is charged on overdue balances. The Group has financial risk management policies in place to ensure that all payables are paid within the credit time-frame.
(ii) The Guardians has an incentive scheme for all employees. A component of the scheme is based on the performance of the Fund. This part of the incentive vests progressively over a rolling four-year performance period. During the first three years of the four-year calculation period, the value of the accrual is dependent on the outcome of future periods. The liability reflected in the Statement of Financial Position reflects the present value of the Guardians’ obligations in respect of that liability. The liability has been calculated based on a medium-term expectation of Fund performance.
(iii) Related party payables are due to Datacom Employer Services Limited, Datacom Engineering Services Limited and Datacom Systems Limited, which are subsidiaries of a joint venture owned by the Fund.
8. MANAGEMENT OF CAPITAL
As a public benefit entity that is fully funded by Crown appropriations (for budgeted Board and audit costs) and by Fund reimbursements (for all other operating costs), the Group has no specific liquidity policies, procedures or targets. Operating budgets are set on an annual basis, with an emphasis upon cost control. The Group is not permitted to borrow and ensures a positive cash position at all times through collection of appropriations and reimbursements.
Notes to the Financial Statements (continued)
For the year ended 30 June 2014
GUARDIANS OF NEW ZEALAND SUPERANNUATION

NEW ZEALAND SUPERANNUATION FUND | ANNUAL REPORT 2014 | 189
9. LEASES
OPERATING LEASESNon-cancellable operating lease commitments payable have been disclosed under the Statement of Commitments.
Operating leases relate to office premises in one location with a remaining term of 9 years. The Group does not have an option to purchase the leased asset at the expiry of the lease period.
DEFERRED LEASE INCENTIVEThe deferred lease incentive relates to the lease of office premises. The lease incentive is recognised as a reduction of rental expense on a straight-line basis over the period of the lease. The remaining term is 9 years.
10. SUBSIDIARIES
NAME OF SUBSIDIARY BALANCE
DATE COUNTRY OF
INCORPORATION
OWNERSHIP INTEREST AND VOTING RIGHTS
2014
%
2013
%
New Zealand Superannuation Fund Nominees Limited (i) 30 June New Zealand 100 100
NZSF Timber Investments (No. 1) Limited (i) 30 June New Zealand 100 100
NZSF Timber Investments (No. 2) Limited (i) 30 June New Zealand 100 100
NZSF Timber Investments (No. 3) Limited (i) 30 June New Zealand 100 100
NZSF Timber Investments (No. 4) Limited (i) 30 June New Zealand 100 100
NZSF Private Equity Investments (No. 1) Limited (i) 30 June New Zealand 100 100
NZSF Rural Investments (No. 1) Limited (i) 30 June New Zealand 100 100
CNI Timber Operating Company Limited (ii) 30 June New Zealand 100 100
NZSF Aotea Limited (iii) 30 June New Zealand 100 100
(i) The principal activity of each subsidiary is to act as a nominee company, holding assets and liabilities on behalf of the New Zealand Superannuation Fund. These assets and liabilities are recognised in the financial statements of the New Zealand Superannuation Fund and accordingly are not presented in these financial statements. Nominee companies may only act on the direction of the Guardians.
(ii) The share in CNI Timber Operating Company Limited, together with the rights and benefits arising from that share, is held for and on behalf of the New Zealand Superannuation Fund. As such, this company is consolidated into the financial statements of the Fund rather than these financial statements.
(iii) The principal activity of this subsidiary is to hold assets and liabilities on behalf of the New Zealand Superannuation Fund. These assets and liabilities are recognised in the financial statements of the New Zealand Superannuation Fund and accordingly are not presented in these financial statements.
FINA
NC
IAL STA
TEMEN
TS G
UA
RD
IAN
S OF N
EW ZEA
LAN
D SU
PERA
NN
UA
TION
AN
D G
RO
UP

| NEW ZEALAND SUPERANNUATION FUND | ANNUAL REPORT 2014190
11. RELATED PARTY DISCLOSURES
(a) Parent entities The parent entity in the Group is the Guardians, which is 100% owned by the ultimate parent entity, the
Crown.
(b) Equity interests in related parties Details of the interests held in subsidiaries are disclosed in note 10 to these financial statements.
(c) Transactions with related parties The Guardians has paid expenses relating to the Fund during the year, as it is required to do under the Act.
Crown appropriations (for budgeted Board and audit costs) and reimbursement of costs from the Fund are the main sources of revenue.
PARENT AND GROUP ACTUAL
2014 2013
NZD’000 NZD’000
Appropriations from the Crown 351 318
Cost reimbursement from New Zealand Superannuation Fund 30,137 25,640
Other income from related parties:
The Treasury – 23
Accident Compensation Corporation 45 44
Government Superannuation Fund Authority 45 44
30,578 26,069
During the year, the Group purchased services from entities related to a joint venture owned by the Fund. These purchases totalled $557,812 (2013: $170,898).
In conducting its activities, the Group is required to pay various taxes and levies (such as GST, Fringe Benefit Tax (FBT), Pay As You Earn (PAYE), and ACC levies) to the Crown and entities related to the Crown. The payment of these taxes and levies, other than income tax, is based on the standard terms and conditions that apply to all tax and levy payers. The Group is exempt from paying income tax.
The Group has entered into a number of other transactions with other government-related entities. These transactions relate to the purchase of goods and services from Air New Zealand, New Zealand Post and The University of Auckland. In addition, in the prior year, the Group utilised the services of Crown Law. For the year ended 30 June 2014, these purchases totalled $1,074,989 (2013: $1,081,811).
Amounts receivable from or payable to related parties at balance date are disclosed in notes 4 and 7 of these financial statements, along with terms and conditions around settlement. Outstanding balances at year end are unsecured and subordinate to other liabilities. Interest is not charged on outstanding balances. There have been no guarantees provided or received for any related party receivables or payables. For the year ended 30 June 2014, the Group has not recorded any impairment of receivables relating to amounts owed by related parties (2013: $nil).
Notes to the Financial Statements (continued)
For the year ended 30 June 2014
GUARDIANS OF NEW ZEALAND SUPERANNUATION

NEW ZEALAND SUPERANNUATION FUND | ANNUAL REPORT 2014 | 191
(d) Compensation of key management personnel
EMPLOYEE BENEFITS The compensation of the Board, executives and other key management personnel is set out below:
PARENT AND GROUP ACTUAL
2014 2013
NZD’000 NZD’000
Employee benefits (including salaries, holiday pay, long service leave and Board members’ fees) 3,429 3,002
Employee incentive scheme 1,357 1,131
4,786 4,133
Board members’ fees
Board members earned the following fees during the year:
G Walker (Chairman) (i) 54 51
D May (Chairman, Retired) (ii) – 9
C Savage (Deputy Chairman) (iii) 34 32
M Tume 27 27
S Moir 27 27
C Ansley 27 27
P Dunphy 27 27
L Wright (iv) 27 16
223 216
(i) Gavin Walker was appointed Chairman in September 2012.
(ii) David May retired from the Board in August 2012.
(iii) Catherine Savage was appointed Deputy Chairman in September 2012.
(vi) Lindsay Wright was appointed to the Board in December 2012.
BOARD MEMBERS’ AND EMPLOYEES INDEMNITY AND INSURANCE The Guardians has indemnified Board members in respect of any liability incurred where that Board
member has breached one of the individual duties set out in Sections 53 to 57 of the Crown Entities Act 2004 (subject to certain limitations). Liability in respect of a breach of these duties is excluded from the scope of the statutory immunity provided for in Section 121 of the Crown Entities Act 2004. Each Board member is also indemnified in respect of costs incurred by that Board member in defending or settling any claim or proceeding.
The Guardians has also indemnified certain employees (and one former employee) who have been appointed as directors, nominated by the Guardians, or other officers of entities in which the Guardians has invested. These indemnities are given, to the maximum extent permitted by the Crown Entities Act 2004, in respect of any liability connected with acts or omissions carried out as a consequence of the appointment. Each employee is also indemnified in respect of costs incurred by that employee in defending or settling any claim or proceeding.
The Guardians has effected Directors and Officers Liability insurance cover in respect of the liability or costs of Board members, employees and external director appointees.
FINA
NC
IAL STA
TEMEN
TS G
UA
RD
IAN
S OF N
EW ZEA
LAN
D SU
PERA
NN
UA
TION
AN
D G
RO
UP

| NEW ZEALAND SUPERANNUATION FUND | ANNUAL REPORT 2014192
12. EMPLOYEES’ REMUNERATION OVER $100,000 PER ANNUM
For a full discussion of the Guardians’ remuneration framework, please refer to page 34 of the Annual Report.
The total remuneration figures in the following table consist of both an employee’s gross base salary and the proportion of their incentive entitlement that will be paid out after this financial year end.
The remuneration bands and benefits listed below are annual amounts. As some employees commenced part-way through the year, the actual remuneration they received during the year is less than the amount shown. For employees who left during the year, their actual remuneration paid has been reported, rather than their annual remuneration.
The employee incentive has both individual performance and financial performance targets of the Fund. The financial performance component is based on rolling four-year periods of returns against thresholds and benchmarks.
TOTAL REMUNERATION AND BENEFITS
PARENT AND GROUP ACTUAL
BASE REMUNERATION
RANGE NUMBER OF EMPLOYEES
NUMBER OF EMPLOYEES
TOTAL REMUNERATION
RANGE NUMBER OF EMPLOYEES
NUMBER OF EMPLOYEES
NZD’000 2014 2013 NZD’000 2014 2013
100-110 2 1 100-110 4 5
110-120 3 5 110-120 1 3
120-130 6 2 120-130 3 1
130-140 3 5 130-140 2 4
140-150 5 4 140-150 5 2
150-160 1 6 150-160 – 4
160-170 7 4 160-170 5 7
170-180 3 2 170-180 3 –
180-190 4 3 180-190 2 3
190-200 4 3 190-200 2 2
200-210 2 5 200-210 1 1
210-220 6 2 210-220 5 3
220-230 2 1 220-230 2 1
230-240 2 5 230-240 5 2
240-250 7 3 240-250 1 1
250-260 1 3 250-260 1 2
260-270 1 – 260-270 3 4
270-280 – 1 270-280 2 2
280-290 1 2 280-290 5 3
290-300 2 – 290-300 1 3
300-310 2 3 300-310 2 2
310-320 2 – 310-320 3 3
320-330 2 1 320-330 1 –
330-340 1 1 330-340 – –
340-350 – 2 340-350 1 1
350-360 1 – 350-360 4 3
360-370 1 – 360-370 1 2
370-380 1 1 370-380 1 1
Notes to the Financial Statements (continued)
For the year ended 30 June 2014
GUARDIANS OF NEW ZEALAND SUPERANNUATION

NEW ZEALAND SUPERANNUATION FUND | ANNUAL REPORT 2014 | 193
PARENT AND GROUP ACTUAL
BASE REMUNERATION
RANGE NUMBER OF EMPLOYEES
NUMBER OF EMPLOYEES
TOTAL REMUNERATION
RANGE NUMBER OF EMPLOYEES
NUMBER OF EMPLOYEES
NZD’000 2014 2013 NZD’000 2014 2013
390-400 – – 390-400 1 –
400-410 – – 400-410 2 1
420-430 – – 420-430 1 –
430-440 – – 430-440 – 1
440-450 – 2 440-450 – –
450-460 – – 450-460 1 2
470-480 – 1 470-480 2 –
480-490 2 – 480-490 – 1
490-500 – – 490-500 – 1
500-510 – – 500-510 – –
520-530 – – 520-530 1 1
540-550 – – 540-550 2 –
580-590 1 – 580-590 – –
640-650 – – 640-650 – –
660-670 – – 660-670 – 2
670-680 – – 670-680 – 1
700-710 – – 700-710 1 –
740-750 – – 740-750 1 –
790-800 – – 790-800 1 –
75 68 79 75
FINA
NC
IAL STA
TEMEN
TS G
UA
RD
IAN
S OF N
EW ZEA
LAN
D SU
PERA
NN
UA
TION
AN
D G
RO
UP

| NEW ZEALAND SUPERANNUATION FUND | ANNUAL REPORT 2014194
13. REDUNDANCY AND SEVERANCE PAYMENTS
There were no severance payments made in respect of employees who resigned during the year (2013: two severance payments totalling $54,444).
14. SUBSEQUENT EVENTS
There were no reportable events subsequent to year end (2013: nil).
15. NOTES TO THE STATEMENT OF CASH FLOWS
(a) Reconciliation of cash and cash equivalents For the purposes of the Statement of Cash Flows, cash and cash equivalents includes cash on hand and in
banks and investments in money market instruments. Cash and cash equivalents at the end of the financial year, as shown in the Statement of Cash Flows, is reconciled to the related items in the Statement of Financial Position as follows:
PARENT AND GROUP ACTUAL
2014 2013
NZD’000 NZD’000
Cash and cash equivalents 1,529 1,069
1,529 1,069
(b) Reconciliation of profit/(loss) for the year to net cash flows from operating activities
Profit/(Loss) for the year – –
Add/(Deduct) non-cash items:
Gain on disposal of property, plant and equipment – (1)
Changes in working capital:
(Increase)/Decrease in assets:
Receivables (1,246) (111)
Increase/(Decrease) in liabilities:
Payables and accruals 1,781 618
Deferred lease incentive (75) (75)
Net cash provided by/(used in) operating activities 460 431
Notes to the Financial Statements (continued)
For the year ended 30 June 2014
GUARDIANS OF NEW ZEALAND SUPERANNUATION

NEW ZEALAND SUPERANNUATION FUND | ANNUAL REPORT 2014 | 195
16. FINANCIAL INSTRUMENTS
(a) Financial assets and financial liabilities by category Key: L&R: Loans and receivables AC: Amortised cost
PARENT AND GROUP ACTUAL
2014 L&R AC TOTAL
NZD’000 NZD’000 NZD’000
Financial assets
Cash and cash equivalents 1,529 – 1,529
Trade receivables 14 – 14
Related party receivables 7,561 – 7,561
Total financial assets 9,104 – 9,104
Financial liabilities
Trade payables and accruals – 6,699 6,699
Related party payables – 58 58
Total financial liabilities – 6,757 6,757
2013
Financial assets
Cash and cash equivalents 1,069 – 1,069
Trade receivables 65 – 65
Related party receivables 6,385 – 6,385
Total financial assets 7,519 – 7,519
Financial liabilities
Trade payables and accruals – 5,505 5,505
Related party payables – 41 41
Total financial liabilities – 5,546 5,546
(b) Financial risk management objectives Through its activities, the Guardians is exposed to the financial risks of market risk, credit risk and liquidity risk.
The Guardians does not hold significant financial assets or liabilities. Cash and cash equivalents are held with creditworthy institutions. Market risk, credit risk and liquidity risk are not considered significant for these reasons. Policies do not allow any transactions that are speculative in nature to be entered into.
(c) Significant accounting policies Details of the significant accounting policies and methods adopted, including the criteria for recognition
and the basis of measurement applied in respect of each class of financial asset, financial liability and equity instrument, are disclosed in note 1 to these financial statements.
FINA
NC
IAL STA
TEMEN
TS G
UA
RD
IAN
S OF N
EW ZEA
LAN
D SU
PERA
NN
UA
TION
AN
D G
RO
UP
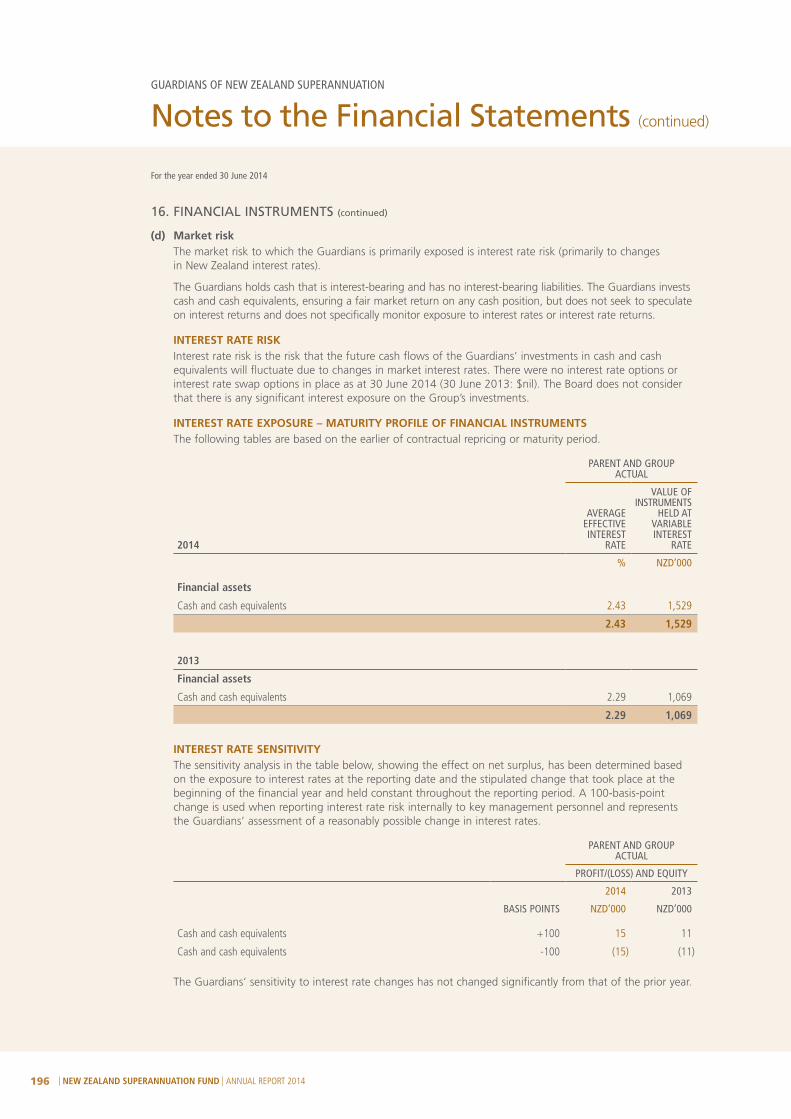
| NEW ZEALAND SUPERANNUATION FUND | ANNUAL REPORT 2014196
16. FINANCIAL INSTRUMENTS (continued)
(d) Market risk The market risk to which the Guardians is primarily exposed is interest rate risk (primarily to changes
in New Zealand interest rates).
The Guardians holds cash that is interest-bearing and has no interest-bearing liabilities. The Guardians invests cash and cash equivalents, ensuring a fair market return on any cash position, but does not seek to speculate on interest returns and does not specifically monitor exposure to interest rates or interest rate returns.
INTEREST RATE RISK Interest rate risk is the risk that the future cash flows of the Guardians’ investments in cash and cash
equivalents will fluctuate due to changes in market interest rates. There were no interest rate options or interest rate swap options in place as at 30 June 2014 (30 June 2013: $nil). The Board does not consider that there is any significant interest exposure on the Group’s investments.
INTEREST RATE EXPOSURE – MATURITY PROFILE OF FINANCIAL INSTRUMENTS The following tables are based on the earlier of contractual repricing or maturity period.
PARENT AND GROUP ACTUAL
2014
AVERAGE EFFECTIVE INTEREST
RATE
VALUE OF INSTRUMENTS
HELD AT VARIABLE INTEREST
RATE
% NZD’000
Financial assets
Cash and cash equivalents 2.43 1,529
2.43 1,529
2013
Financial assets
Cash and cash equivalents 2.29 1,069
2.29 1,069
INTEREST RATE SENSITIVITY The sensitivity analysis in the table below, showing the effect on net surplus, has been determined based
on the exposure to interest rates at the reporting date and the stipulated change that took place at the beginning of the financial year and held constant throughout the reporting period. A 100-basis-point change is used when reporting interest rate risk internally to key management personnel and represents the Guardians’ assessment of a reasonably possible change in interest rates.
PARENT AND GROUP ACTUAL
PROFIT/(LOSS) AND EQUITY
2014 2013
BASIS POINTS NZD’000 NZD’000
Cash and cash equivalents +100 15 11
Cash and cash equivalents -100 (15) (11)
The Guardians’ sensitivity to interest rate changes has not changed significantly from that of the prior year.
Notes to the Financial Statements (continued)
For the year ended 30 June 2014
GUARDIANS OF NEW ZEALAND SUPERANNUATION

NEW ZEALAND SUPERANNUATION FUND | ANNUAL REPORT 2014 | 197
(e) Credit risk management Credit risk is the risk that a third party will default on its obligation to the Group, causing the Group to
incur a loss. Financial instruments which potentially subject the Group to risk consist principally of cash and cash equivalents.
The Group places its investments with institutions that have a high credit rating. The Group believes that this policy reduces the risk of any loss which could arise from its investment activities. The Group does not require any collateral or security to support financial instruments.
SIGNIFICANT CONCENTRATIONS OF CREDIT RISK The Group primarily invests cash balances with ANZ Bank New Zealand Ltd. The maximum amount
of credit risk for each class is the carrying amount in the Statement of Financial Position.
(f) Liquidity risk management Liquidity management is designed to ensure that the Group has the ability to generate sufficient cash
in a timely manner to meet its financial commitments.
Because the Guardians recovers all expenditure from the Crown or the New Zealand Superannuation Fund and, as the Guardians has a positive cash position, no specific liquidity policies have been developed.
Information about the contractual maturity periods of financial assets and financial liabilities is included above.
(g) Fair value The fair value of financial instruments is approximately equivalent to the carrying amount disclosed
in the Statement of Financial Position.
17. COMPARISON TO BUDGET (UNAUDITED)
PARENT AND GROUP ACTUAL
BUDGET (UNAUDITED)
FAVOURABLE/ (UNFAVOURABLE)
VARIANCE
2014 2014 2014
NZD’000 NZD’000 NZD’000
Statement of Comprehensive Income: total expenses incurred(i) 30,661 34,994 4,333
Statement of Changes in Public Equity 500 500 –
Statement of Financial Position 500 500 –
(i) Expenses were lower than budget predominantly due to lower remuneration and travel costs. This was as a result of recruitment activity being slower than was envisaged in the budget.
FINA
NC
IAL STA
TEMEN
TS G
UA
RD
IAN
S OF N
EW ZEA
LAN
D SU
PERA
NN
UA
TION
AN
D G
RO
UP

| NEW ZEALAND SUPERANNUATION FUND | ANNUAL REPORT 2014198
Independent Auditor’s Report
TO THE READERS OF THE GUARDIANS OF NEW ZEALAND SUPERANNUATION AND GROUP’S FINANCIAL STATEMENTS AND NON-FINANCIAL PERFORMANCE INFORMATIONFOR THE YEAR ENDED 30 JUNE 2014
The Auditor-General is the auditor of the Guardians of New Zealand Superannuation (the Guardians) and Group. The Auditor-General has appointed me, Brent Penrose, using the staff and resources of Ernst & Young, to carry out the audit of the financial statements and non-financial performance information of the Guardians and Group on her behalf.
We have audited:
– the financial statements of the Guardians and Group on pages 175 to 197, that comprise the Statement of Financial Position as at 30 June 2014, the Statement of Comprehensive Income, Statement of Changes in Public Equity and Statement of Cash Flows for the year ended on that date and notes to the financial statements that include accounting policies and other explanatory information; and
– the non-financial performance information of the Guardians and Group that comprises the statement of service performance on pages 86 to 90 which includes outcomes.
OPINION
In our opinion:
– the financial statements of the Guardians and Group on pages 175 to 197:
• comply with generally accepted accounting practice in New Zealand; and
• fairly reflect the Guardians and Group’s:
+ financial position as at 30 June 2014; and
+ financial performance and cash flows for the year ended on that date.
– the non-financial performance information of the Guardians and Group on pages 86 to 90:
• complies with generally accepted accounting practice in New Zealand; and
• fairly reflects the Guardians and Group’s service performance and outcomes for the year ended 30 June 2014, including for each class of outputs, the service performance compared with forecasts in the Statement of Forecast Service Performance at the start of the financial year.
Our audit was completed on 17 September 2014. This is the date at which our opinion is expressed.
The basis of our opinion is explained below. In addition, we outline the responsibilities of the Board and our responsibilities, and we explain our independence.
BASIS OF OPINION
We carried out our audit in accordance with the Auditor-General’s Auditing Standards, which incorporate the International Standards on Auditing (New Zealand). Those standards require that we comply with ethical requirements and plan and carry out our audit to obtain reasonable assurance about whether the financial statements and non-financial performance information are free from material misstatement.
Material misstatements are differences or omissions of amounts and disclosures that, in our judgement, are likely to influence readers’ overall understanding of the financial statements and non-financial performance information. If we had found material misstatements that were not corrected, we would have referred to them in our opinion.
An audit involves carrying out procedures to obtain audit evidence about the amounts and disclosures in the financial statements and non-financial performance information. The procedures selected depend on our judgement, including our assessment of risks of material misstatement of the financial statements and non-financial performance information, whether due to fraud or error. In making those risk assessments, we consider internal control relevant to the preparation of the Guardians and Group’s financial statements and non-financial performance information that fairly reflect the matters to which they relate. We consider internal control in order to design audit procedures that are appropriate in the circumstances but not for the purpose of expressing an opinion on the effectiveness of the Guardians’ and Group’s internal control.

NEW ZEALAND SUPERANNUATION FUND | ANNUAL REPORT 2014 | 199
An audit also involves evaluating:
– the appropriateness of accounting policies used and whether they have been consistently applied;
– the reasonableness of the significant accounting estimates and judgements made by the Board;
– the appropriateness of the reported non-financial performance information within the Guardians and Group’s framework for reporting performance;
– the adequacy of all disclosures in the financial statements and non-financial performance information; and
– the overall presentation of the financial statements and non-financial performance information.
We did not examine every transaction, nor do we guarantee complete accuracy of the financial statements and non-financial performance information. Also we did not evaluate the security and controls over the electronic publication of the financial statements and non-financial performance information.
We have obtained all the information and explanations we have required and we believe we have obtained sufficient and appropriate audit evidence to provide a basis for our audit opinion.
RESPONSIBILITIES OF THE BOARD
The Board is responsible for preparing financial statements and non-financial performance information that:
– comply with generally accepted accounting practice in New Zealand;
– fairly reflect the Guardians and Group’s financial position, financial performance and cash flows; and
– fairly reflect the Guardians and Group’s service performance and outcomes.
The Board is also responsible for such internal control as is determined is necessary to enable the preparation of financial statements and non-financial performance information that are free from material misstatement, whether due to fraud or error. The Board is also responsible for the publication of the financial statements and non-financial performance information, whether in printed or electronic form.
The Board’s responsibilities arise from the Crown Entities Act 2004 and the New Zealand Superannuation and Retirement Income Act 2001.
RESPONSIBILITIES OF THE AUDITOR
We are responsible for expressing an independent opinion on the financial statements and non-financial performance information and reporting that opinion to you based on our audit. Our responsibility arises from section 15 of the Public Audit Act 2001 and the Crown Entities Act 2004.
INDEPENDENCE
When carrying out the audit, we followed the independence requirements of the Auditor-General, which incorporate the independence requirements of the External Reporting Board.
Other than the audit, we have no relationship with or interests in the Guardians or any of its subsidiaries.
Brent PenroseErnst & YoungOn behalf of the Auditor-GeneralAuckland, New Zealand
FINA
NC
IAL STA
TEMEN
TS G
UA
RD
IAN
S OF N
EW ZEA
LAN
D SU
PERA
NN
UA
TION
AN
D G
RO
UP

| NEW ZEALAND SUPERANNUATION FUND | ANNUAL REPORT 2014200
ACC Accident Compensation Corporation.
Access point The actual investment the Fund makes to gain exposure to a desired risk (e.g. buying a listed equity). Access points are our way of exploiting opportunities, themes, ‘stress test’ outcomes and manager skill. The access point can be passive, active, synthetic or funded, directly (internally) or externally managed.
Active management
Where a fund’s manager attempts to outperform a market index through various investing strategies and buying/selling decisions. Active managers rely on analytic research, forecasts and their own judgement and experience in making investment decisions. Active investment strategies are more complex and expensive to implement than passive management. See ‘passive management’, below.
Active returns Any return differential between the actual portfolio and the Reference Portfolio. In the context of an investment, the positive return we hope to earn for taking on active risk. Same as value-add.
Active risk Any deviation in risk in the actual portfolio relative to the Reference Portfolio. Active risk is a relative risk concept. The active risk in the portfolio is dominated by activities in our value-adding strategies. Note that the actual portfolio can have the same total or absolute risk as the Reference Portfolio but still have active risk. Technically active risk is expressed as the expected standard deviation of the active returns.
Active strategies
Value-add strategies.
Actual portfolio
The Fund’s portfolio at any point in time reflecting all the positions arising from the Fund’s value adding strategies as well as drift. Conceptually, the actual portfolio equals the Reference Portfolio (cash plus risk premiums) plus drift plus active risk.
Asset class An asset class is a group of securities or assets that share common characteristics.
Belief The Fund’s stated view on some aspect of financial markets and investing.
BREEAM BREEAM (www.breeam.org) is the world’s foremost environmental assessment method and rating system for buildings.
Capability Management’s ability to execute a value-add strategy. Incorporates depth and breath of experience, risk management abilities etc.
Cash Generally taken to mean a very short-term investment earning interest from a highly-rated bank or an equivalent bank bill.
CDP Carbon Disclosure Project (www.cdproject.net).
CEM CEM Global Benchmarking.
Central clearing
Central clearing is a process by which financial transactions are cleared by a single (i.e. central) counterparty, instead of being transacted directly between the two parties involved. This new requirement is designed to reduce risk in the global financial system.
CLO A CLO is a security backed by a pool of debt. In a CLO the investor receives scheduled debt payments from the underlying loans in return for assuming the risk that the borrowers default. Banks sell CLOs with various tranches that reflect different levels of seniority to match investors’ risk/return profiles.
Compensation Return for taking on risk. Often, the compensation is the risk premium, or excess return over cash that the investment offers.
Conviction A measure of the degree of confidence we have in an active manager’s investment skill. The Fund’s approach to rating an active manager. Applicable to both public and private market managers. The conviction rating is a quantitative overall score based on the scores of a number of individual, largely qualitative, factors.
Counterparty A counterparty is a term used to describe a legal entity to which an exposure to financial risk might exist. The Fund’s seventeen counterparties are typically banks. We work to best practice criteria and standards for the appointment and on-going use of counterparties.
Credit risk The risk associated with the variability in the perceived credit quality of a fixed income instrument.
Glossary

NEW ZEALAND SUPERANNUATION FUND | ANNUAL REPORT 2014 | 201
Crown entity A Crown entity is an organisation that forms part of New Zealand’s state sector, as established under the Crown Entities Act 2004, a unique umbrella governance and accountability statute. Crown entities are legal entities in their own right. A decision to assign a government activity or function to a Crown entity indicates that the function should be carried out at ‘arm’s-length’ from the Government. The Crown entity’s board directs the entity’s day-to-day operations. A monitoring department is responsible to a portfolio Minister for monitoring Crown entities within that portfolio on the Minister’s behalf. In the Guardians’ case the monitoring department is the New Zealand Treasury and the portfolio Minister is the Minister of Finance. See ‘Double arm’s-length’ below.
Derivative Derivatives are financial instruments that replicate the behaviour and performance of certain types of investments. Typically, they are linked to:
– individual securities such as equities – indexes on bonds and equities – reference rates (such as an exchange rate or interest rate).
Direct A direct activity is a financial market transaction undertaken by the Fund’s management.
Diversification The potential improvement in a portfolio’s Sharpe Ratio which arises from introducing assets into the portfolio that behave differently to the assets in the Reference Portfolio. Introducing any new asset or asset class into the portfolio will have a diversification benefit. The more diversified a portfolio, the more difficult it is to achieve further diversification gains.
Double arm’s-length
The Guardians is an autonomous Crown entity, meaning it is legally separate from the Crown and operates at ‘double arm’s-length’. The first arm of independence is that the Government does not decide the pool of candidates for the Board of the Guardians (candidates are identified by an independent Nominating Committee). The second arm of independence is that investment decisions are made by the Board and Management of the Guardians. See ‘Crown entity’ above and the diagram on page 7 for more information.
Economic risk exposures
The handful of basic economic drivers that determine the risk and return of all securities, investments and asset classes. Generally unavoidable and undiversifiable. These economic drivers are real growth, inflation, agency risks and ‘other’.
Endowment A characteristic of the Fund that provides the Fund with a natural advantage or edge over the typical investor.
Equilibrium The long-term or steady state. Generally expressed in the context of long-term average expected risks and returns.
Escrow Money held by a third party on behalf of transacting parties.
ESG Environmental, Social and Governance.
Excess return See risk premium, below.
Expansion capital
Also called growth capital, expansion capital is a type of private equity investment, most often a minority investment, in relatively mature companies that are looking for capital to expand without a change of control of the business.
Externally managed
An investment managed by an appointed external manager.
Financial market transaction
A public market transaction relating to individual securities, foreign exchange and derivatives.
Fixed income Assets providing income to investors via a fixed coupon payment. In the context of the Reference Portfolio, fixed income is a very well diversified set of exposures including sovereign bonds, investment grade credit, agency debt, high-yield bonds and emerging market debt. Inflation-linked securities are also included, though an element of the income is variable because it is linked to future inflation outturns.
FMA Financial Markets Authority.
GLO
SSAR
Y
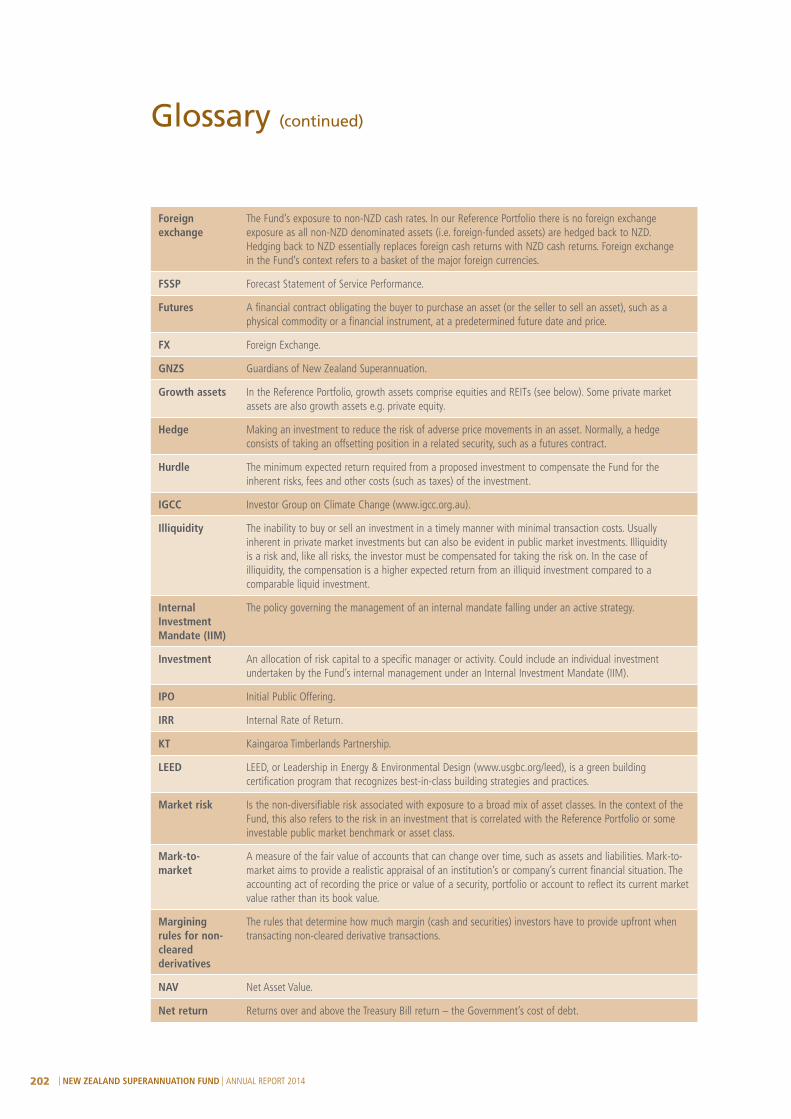
| NEW ZEALAND SUPERANNUATION FUND | ANNUAL REPORT 2014202
Foreign exchange
The Fund’s exposure to non-NZD cash rates. In our Reference Portfolio there is no foreign exchange exposure as all non-NZD denominated assets (i.e. foreign-funded assets) are hedged back to NZD. Hedging back to NZD essentially replaces foreign cash returns with NZD cash returns. Foreign exchange in the Fund’s context refers to a basket of the major foreign currencies.
FSSP Forecast Statement of Service Performance.
Futures A financial contract obligating the buyer to purchase an asset (or the seller to sell an asset), such as a physical commodity or a financial instrument, at a predetermined future date and price.
FX Foreign Exchange.
GNZS Guardians of New Zealand Superannuation.
Growth assets In the Reference Portfolio, growth assets comprise equities and REITs (see below). Some private market assets are also growth assets e.g. private equity.
Hedge Making an investment to reduce the risk of adverse price movements in an asset. Normally, a hedge consists of taking an offsetting position in a related security, such as a futures contract.
Hurdle The minimum expected return required from a proposed investment to compensate the Fund for the inherent risks, fees and other costs (such as taxes) of the investment.
IGCC Investor Group on Climate Change (www.igcc.org.au).
Illiquidity The inability to buy or sell an investment in a timely manner with minimal transaction costs. Usually inherent in private market investments but can also be evident in public market investments. Illiquidity is a risk and, like all risks, the investor must be compensated for taking the risk on. In the case of illiquidity, the compensation is a higher expected return from an illiquid investment compared to a comparable liquid investment.
Internal Investment Mandate (IIM)
The policy governing the management of an internal mandate falling under an active strategy.
Investment An allocation of risk capital to a specific manager or activity. Could include an individual investment undertaken by the Fund’s internal management under an Internal Investment Mandate (IIM).
IPO Initial Public Offering.
IRR Internal Rate of Return.
KT Kaingaroa Timberlands Partnership.
LEED LEED, or Leadership in Energy & Environmental Design (www.usgbc.org/leed), is a green building certification program that recognizes best-in-class building strategies and practices.
Market risk Is the non-diversifiable risk associated with exposure to a broad mix of asset classes. In the context of the Fund, this also refers to the risk in an investment that is correlated with the Reference Portfolio or some investable public market benchmark or asset class.
Mark-to-market
A measure of the fair value of accounts that can change over time, such as assets and liabilities. Mark-to-market aims to provide a realistic appraisal of an institution’s or company’s current financial situation. The accounting act of recording the price or value of a security, portfolio or account to reflect its current market value rather than its book value.
Margining rules for non-cleared derivatives
The rules that determine how much margin (cash and securities) investors have to provide upfront when transacting non-cleared derivative transactions.
NAV Net Asset Value.
Net return Returns over and above the Treasury Bill return – the Government’s cost of debt.
Glossary (continued)

NEW ZEALAND SUPERANNUATION FUND | ANNUAL REPORT 2014 | 203
NZS New Zealand Superannuation.
NZSF New Zealand Superannuation Fund.
Opportunity A feature of the investment environment that is conducive to generating positive risk-adjusted active returns.
OTC A security traded in some context other than on a formal exchange such as the NYSE, TSX, AMEX, etc. The phrase ‘over-the-counter’ (OTC) can be used to refer to stocks that trade via a dealer network as opposed to on a centralized exchange. It also refers to debt securities and other financial instruments such as derivatives, which are traded through a dealer network.
Passive management
Passive management, or ‘index tracking’, is a style of investment management through which a fund’s portfolio mirrors a selected market index. Stocks move in and out of the portfolio according to index inclusion rather than through an active investment decision. See ‘active management’ above.
PE Private Equity.
PERE Private Equity Real Estate.
Physical An investment that is funded with cash to the full notional amount of the investment.
Portfolio construction
The allocation of risk in a portfolio. Generally applied to active management, portfolio construction embraces the broad allocation of risk capital to various value-add strategies as well as the specific allocations of risk capital to individual investments.
Private equity A private equity investment involves investing directly into private (non-listed) companies e.g. buying out the original owner.
Private equity real estate
An asset class consisting of equity and debt investments in property e.g. a property development. Investments are typically actively managed.
Private markets active strategies
Private market value adding strategies.
Public market Public market investments comprise: 1) exchange listed securities; or 2) over-the-counter financial contracts linked to listed securities and/or widely-followed
indices or benchmarks.
Public market investments are generally (but not always) liquid and generally (but not always) have regular and transparent pricing. We prefer to use the term ‘listed’ rather than ‘public market’, although OTC instruments are, by definition, not listed.
Public market active return strategy
Generating active returns through a strategy that focuses on listed securities. This used to be a separate business unit but now comes under the Investments group. An increasingly artificial distinction between the private markets active strategy. Abbreviated to PMAR.
Reference Portfolio
A low cost, passively managed and well diversified portfolio of listed asset classes that is consistent with the Fund achieving its return objectives without undue risk, i.e. fit for purpose. Conceptually, the Reference Portfolio comprises a 100% cash position (NZD) plus a set of risk premiums or excess returns that also sum to 100%. See pages 42-43 for more information.
REIT Real Estate Investment Trust.
Return The return on an investment after manager fees and taxes.
RI Responsible Investment.
Risk The standard deviation of expected returns. The Fund’s risk model uses equilibrium risk (and return) assumptions.
Risk premium The return in excess of cash earned by investors as compensation for taking passive exposure to the market or an asset class. Risk premium and excess return can be used interchangeably.
GLO
SSAR
Y
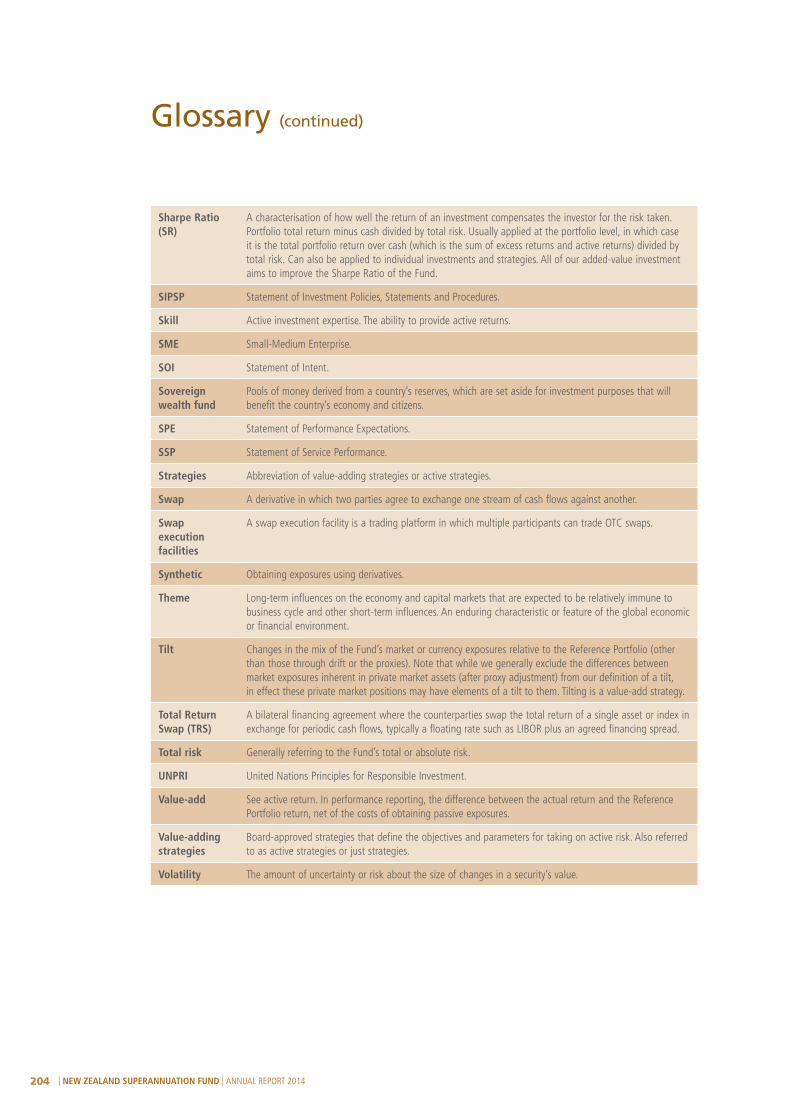
| NEW ZEALAND SUPERANNUATION FUND | ANNUAL REPORT 2014204
Sharpe Ratio (SR)
A characterisation of how well the return of an investment compensates the investor for the risk taken. Portfolio total return minus cash divided by total risk. Usually applied at the portfolio level, in which case it is the total portfolio return over cash (which is the sum of excess returns and active returns) divided by total risk. Can also be applied to individual investments and strategies. All of our added-value investment aims to improve the Sharpe Ratio of the Fund.
SIPSP Statement of Investment Policies, Statements and Procedures.
Skill Active investment expertise. The ability to provide active returns.
SME Small-Medium Enterprise.
SOI Statement of Intent.
Sovereign wealth fund
Pools of money derived from a country’s reserves, which are set aside for investment purposes that will benefit the country’s economy and citizens.
SPE Statement of Performance Expectations.
SSP Statement of Service Performance.
Strategies Abbreviation of value-adding strategies or active strategies.
Swap A derivative in which two parties agree to exchange one stream of cash flows against another.
Swap execution facilities
A swap execution facility is a trading platform in which multiple participants can trade OTC swaps.
Synthetic Obtaining exposures using derivatives.
Theme Long-term influences on the economy and capital markets that are expected to be relatively immune to business cycle and other short-term influences. An enduring characteristic or feature of the global economic or financial environment.
Tilt Changes in the mix of the Fund’s market or currency exposures relative to the Reference Portfolio (other than those through drift or the proxies). Note that while we generally exclude the differences between market exposures inherent in private market assets (after proxy adjustment) from our definition of a tilt, in effect these private market positions may have elements of a tilt to them. Tilting is a value-add strategy.
Total Return Swap (TRS)
A bilateral financing agreement where the counterparties swap the total return of a single asset or index in exchange for periodic cash flows, typically a floating rate such as LIBOR plus an agreed financing spread.
Total risk Generally referring to the Fund’s total or absolute risk.
UNPRI United Nations Principles for Responsible Investment.
Value-add See active return. In performance reporting, the difference between the actual return and the Reference Portfolio return, net of the costs of obtaining passive exposures.
Value-adding strategies
Board-approved strategies that define the objectives and parameters for taking on active risk. Also referred to as active strategies or just strategies.
Volatility The amount of uncertainty or risk about the size of changes in a security’s value.
Glossary (continued)

Corporate Directory
NEW ZEALAND SUPERANNUATION FUND
PO Box 106 607 Level 12, Zurich House 21 Queen Street Auckland 1010
Phone: +64 9 300 6980 Fax: +64 9 300 6981
[email protected] www.nzsuperfund.co.nz
AUDITORS
Ernst & Young (Brent Penrose) On behalf of the Auditor-General 2 Takutai Square Britomart Auckland 1010
BANKERS
Guardians of New Zealand Superannuation
ANZ Bank New Zealand Ltd
New Zealand Superannuation Fund
Westpac Banking Corporation
GLOBAL CUSTODIAN
Northern Trust Company 50 Bank Street Canary Wharf London E14 5NT
This document is printed onto Silk Matt, an environmentally responsible paper produced using an Elemental Chlorine Free process (ECF). The pulp is sourced from third party responsible sources and manufactured under the strict ISO14001 Environmental Management System.
designedbyinsight.com
NZS
034

WWW.NZSUPERFUND.CO.NZ