connecting 9/11 to the financial crisis
TRANSCRIPT

International Journal of Economics, Finance and Management Sciences 2015; 3(4): 367-390 Published online July 21, 2015 (http://www.sciencepublishinggroup.com/j/ijefm) doi: 10.11648/j.ijefm.20150304.16 ISSN: 2326-9553 (Print); ISSN: 2326-9561 (Online)
Connecting 9/11 to the Financial Crisis
David Joel Skandera
Departments of Economics and Management Studies, St. Olaf College, Northfield, United States of America
Email address: [email protected]
To cite this article: David Joel Skandera. Connecting 9/11 to the Financial Crisis. International Journal of Economics, Finance and Management Sciences.
Vol. 3, No. 4, 2015, pp. 367-390. doi: 10.11648/j.ijefm.20150304.16
Abstract: This paper summarizes and analyzes research on the economic impact of United States fiscal and monetary
policy in the wake of the 9/11-terrorist attacks. Therein, it attempts to connect this tragedy to the financial crisis of the late-
2000s, which is still not fully understood. The large number of factors identified by numerous experts as the causes for the
collapse of the financial system makes the crisis a difficult topic to study. This analysis provides a stepping-stone for any
further research in that it helps explain how the factors that led to the crisis were created in the first place. Expert opinions,
academic studies, as well as both a Cobb-Douglas production function and one of the newest specifications of the Taylor
Rule are looked at throughout this paper. While the latter model shows how monetary policy should have been determined
throughout the 2000s, the former helps to analyze the impact of fiscal policy after 9/11 on monetary policy. Based on the
research and analysis presented in this paper, we can conclude that the factors that caused the collapse of the financial
system were largely impacted by government spending in response to the terrorist attacks and monetary policy between
2001 and 2008. This conclusion implies that the crisis could have been minimized if not prevented altogether.
Keywords: Financial Crisis, Fiscal Policy, Monetary Policy, Liquidity Effect, Paradox of Monetary Economics,
Money Supply, Interest Rates, Systemic Risk
1. Introduction
It was just another Tuesday morning, not quite nine
o’clock, the streets of New York City filled with cars and
people heading to work. For about three thousand of them it
would be the last thing they ever did. Between 8:46 and
10:28 AM nineteen terrorists committed a horrific crime
against the United States, one that will remain unforgettable
to the history of mankind. Four airplanes were hijacked and
crashed into the World Trade Center and the Pentagon.
Thankfully, the terrorists missed their third target, the White
House, because the passengers of United Airlines Flight 93
forced them to wreck the plane on a field near Shanksville,
Pennsylvania. It was September 11th, 2001.
As hard as it was to overcome the psychological damage
of these attacks, the “legacy of the disaster has been the
exposure of the vulnerability of the [American] financial
system to both internal and external shocks”1. This paper
examines how the terrorists not only altered the way people
look at national security, but also helped set the stage for
the largest economic crisis in the United States since the
1 Burton (2011). Page 1.
Great Depression. Specifically, this paper analyzes how
government spending on the War on Terror and other steps
to ensure the safety of the American people caused the
conditions that led to the financial crisis in the late 2000s.
The approach the government took to finance these steps
and the impact of fiscal on monetary policy between 2001
and 2008 is also looked at in detail. Lastly, this paper
focuses on interest rates and changes in the money supply,
which significantly “helped spark a historic collapse”2 of
the economy. A large amount of empirical data,
macroeconomic and monetary theory, and several
illustrations of the impact of relevant government policies
are provided to illustrate how the financial crisis relates
directly to the terrorist attacks of 9/11.
Overall, the importance of this work lays in the fact that
the “financial [crisis] is not yet fully understood in its full
complexity”3 because of the sheer number of contributing
factors. In order to ensure that this situation does not repeat
2 Comiskey and Madhogarhia (2009). Page 274.
3 Jickling (2009). Summary.
International Journal of Economics, Finance and Management Sciences 2015; 3(4): 367-390 368
itself, it is essential to understand exactly what happened
and why it happened. This paper discusses the underlying
economic factors, which ought to be considered the root of
the financial collapse. It answers several questions still
surrounding the conditions that led to the financial crisis by
connecting the latter to the government’s response to 9/11
and the Federal Reserve’s subsequent monetary policy.
Therein, a much-needed analysis of the consequences of the
attacks is provided and will hopefully lead to more
informed decision-making by both public and private actors
in the future. Bear in mind that this paper discusses the
causes for the conditions leading up to the financial crisis,
not the conditions themselves. At the end of the day, both
fiscal policy after 9/11 and US monetary policy between
2001 and 2008 led directly to the factors that caused the
financial crisis in the late 2000s.
2. Literature Review
As for previous literature on the topic of 9/11 and the
financial crisis, Jickling (2009) lists and summarizes all
causes of the collapse as identified by the United States
government. In addition, he analyzes the complexity of the
crisis in much detail by incorporating economic phenomena
and government policies in his investigation. The report is
meant to answer questions about the origin of the crisis,
why it escalated to become one of the worst recessions in
United States history, and who is to blame for the fiasco.
Therein, Jickling’s report helps explain the financial crisis
in its full complexity. In his research, the financial
economist found that “the roots of the crisis go back much
further” 4 than 2008, which is when the Federal Reserve
began to worry more about financial stability than inflation.
Other economists including Marc Faber, Michael Comiskey,
Pawan Madhogarhia, and Kimberly Amadeo have taken the
same position in interviews, articles, and academic studies.
The argument that the crisis was initiated long before the
actual collapse relates these studies to this paper in that it
connects the Great Recession to monetary policy and
government borrowing and debt.
Monetary policy, in particular, is viewed as one of the
most important factors in determining the well being of the
United States economy. Nelson (2010), a former professor
of economics at the University of Washington, explains the
variables that make monetary policy work and how it has
evolved over time. He goes back to the 1940s and 1950s
when the Truman administration “emphasized that the Fed
would be responsible for monetary policy”5 and monetary
policy only. This argument helps to explain the institution’s
actions post-9/11. After discussing the liquidity effect and
the paradox of monetary economics, Nelson talks
specifically about the Federal Reserve’s response to the
terrorist attacks. The liquidity effect receives further
support from James D. Hamilton in his 1997 study of the
4 Jickling (2009). Summary.
5 Timberlake (2008).
impact of capital reserve requirements for banks on interest
rates. Hamilton’s goal was to identify how monetary policy
must be used to ensure economic stability in the United
States. Both Hamilton’s and Nelson’s research shows that it
is essential to adhere to a variation of the Taylor Rule to
achieve the Federal Reserve’s main goals of full
employment and low inflation. Furthermore, Nelson
establishes that bad monetary policy is hardly recognizable
in the short run, but will eventually raise inflation and cause
recurrent recessions in the long run. Because he uses the
Federal Reserve’s response to 9/11 to show the
ramifications of improper monetary policy, his text plays a
key role in proving the thesis presented in this paper. He
also connects government spending and debt to interest
rates, which links the economic phenomena referenced
throughout this paper.
John B. Taylor (2009) explains the role interest rates
played in the financial collapse in more detail. The famous
economist draws from in-depth research about the actions
of the Federal Reserve in the early- to mid-2000s. He
discusses how the authorities deviated from sound
principles in regard to monetary policy, which had worked
for many decades prior to the 2000s. Both historical
experience and the author’s very own Taylor Rule
suggested interest rates much better suited to the state of the
economy at the time. According to Larry Elliot (2014), the
International Monetary Fund publicly supports Taylor’s
stance. He found that the housing boom and subsequent
bust would have never happened without loose-fitting
monetary policy, suggesting that the collapse could have
been avoided. Furthermore, Taylor looks at government
saving and investment between 2001 and 2004 to prove that
global factors did not cause the drop in interest rates.
Therein he supports his main argument that government
interventions led to the financial crisis. Taylor’s book
provides the last step in the connection between 9/11 and
the financial crisis. He describes in detail how the boom in
the early-2000s and the subsequent bust were created by
factors that can be traced back to the government’s response
to 9/11. In addition, he convincingly explains that there was
no global saving glut, which is the focal point of the critics’
alternative explanation for the collapse. Joseph Stiglitz
(2014) goes into further detail about excessive global
saving and its negligibility in regard to the financial crisis.
Another issue addressed in this paper is government debt.
Eric Engen and Glenn Hubbard (2005) draw a line between
the increase in national debt and the increase in interest
rates between June 2004 and the financial crisis. The
authors look at several different ways to determine the
impact of the growing government deficit on monetary
policy including a Cobb-Douglas production function, a
Keynesian IS-LM model, and an alternative production
function framework based on the authors’ crowding-out
hypothesis. Therein, Engen and Hubbard supply valuable
evidence for the dependence of interest rates on government
debt. They conclude that an increase in government debt
increases interest rates in the long run. While it may seem
369 David Joel Skandera: Connecting 9/11 to the Financial Crisis
that their work counters John Taylor’s argument, the fact
that “factors other than government debt can influence the
determination of interest rates” 6 shows how the two
frameworks can work together with one dominating
between 9/11 and 2004 and the other dominating between
2005 and the financial crisis. For example, the Federal
Reserve’s purchase of government securities in the early-
2000s offset the impact of an increasing federal deficit. The
extra money supply then depressed interest rates. By the
middle of the decade the Federal Reserve stopped
increasing the money supply, which then led to rising
interest rates. Meanwhile, the government kept operating at
a deficit in part due to tax cuts and, therein, spurred the
crowding-out effect. These tax cuts were contentious
decisions in the first place and are criticized by numerous
experts. Reinhart and Tashiro (2013) provide a helpful and
necessary description of how capital is crowded out. Their
study focuses on the impact of deficits, finding that the
crowding-out effect occurs when a government rolls over
debt for an extended period of time. Engen and Hubbard
theorize that the higher government deficit was a direct
result from government spending on the War on Terror and
national security post-9/11. Therein lays the connection
between the findings of Engen and Hubbard, Reinhart and
Tashiro’s work, and the hypothesis of this paper.
Government spending after the terrorist attacks is more
closely examined by Linda Bilmes (2011). The Harvard
professor looks at the cost of improved homeland security
and the War on Terror as she attempts to explain how these
government actions have contributed to the financial crisis.
Bilmes tries to establish a better understanding of the
connection between the terrorist attacks and the financial
crisis. She found that oil prices spiked substantially
between the invasion of Iraq in 2003 and the first signs of a
financial crisis in 2007. Fact is, the wars in Iraq and
Afghanistan brought instability to the Gulf region, which
contributed to higher oil prices. This, in turn, contributed to
the Federal Reserve loosening its monetary policy
especially in the two years following the initial spike in oil
prices, according to Bilmes. Loose monetary policy, she
says, resulted in the housing bubble and contributed to real
GDP growth in the early-2000s, which is supported by
figure 1 7 . Eventually, however, this led to the financial
collapse. While John Taylor closely examines the
connection between monetary policy and the crisis, Bilmes
adds more details about the way the United States
government financed its response to 9/11 and the
implications of the accumulated debt for the future. Her
work establishes the missing connection between the
terrorist attacks and the financial crisis.
Martin Eichenbaum and Jonas Fisher (2004) provide
another valuable examination of the government’s response
to the 9/11-shocks. Primarily the authors analyze how the
increase in government spending in the early- and mid-
6 Engen and Hubbard (2005). Page 85.
7 Appendix A.
2000s can be attributed to the attacks. Their research covers
empirical data on how the government responded to such
shocks in the past and if the response to 9/11 was justifiable
or rather an act of panic to keep the economy out of a
recession. Eichenbaum and Fisher utilize highly technical
analyses and complex functions to prove their argument
that the increase in government spending is attributable to
the terrorist attacks. From their research, the two
economists conclude that national debt would have behaved
very differently if the government had responded to 9/11 in
the same fashion as it did to previous shocks of similar
magnitude. They also found military expenditures post-9/11
were as significant as those associated with the Korean War,
Vietnam War, and Carter-Reagan defense buildup.
Eichenbaum and Fisher’s research proves that government
spending after the terrorist attacks was significant enough to
influence monetary policy and contribute to the causal
factors of the financial crisis.
As with all research, there are counterarguments.
Maurice Obstfeld and Kenneth Rogoff (2009) suggest that
three distinct global trends became ever less sustainable as
time went on and caused the bust of the credit bubble at the
end of 2007. They argue that real estate values in many
countries rose much too fast, too many countries were
operating under high and rising deficits, and leverage levels
had become far too large in numerous economies across the
globe. The authors emphasize how these factors occurred
on a global scale and, therein, try to provide evidence that
global imbalances were the primary determinant of the
conditions that led to the financial crisis. They conclude
that the willingness of other countries, primarily China, to
lend money helped the United States finance its deficit.
Allegedly the problem is that the authorities underestimated
the implications of excessive borrowing. Obstfeld and
Rogoff argue that the imbalances “both reflected and
magnified the ultimate causal factors behind the… financial
crisis”8. Their paper provides an alternative explanation for
the causes of the financial crisis, but is invalidated
throughout this paper.
Claudio Borio and Piti Disyatat (2011) further examine
the argument that global imbalances, excessive saving in
particular, contributed to the causes of the financial crisis.
The monetary economists analyze previous research, which
states that account surpluses in numerous market economies
encouraged risk-taking and subprime mortgage investments.
According to Borio and Disyatat, these hypotheses display
significant weaknesses. Throughout their paper, the authors
attempt to prove that capital flows between various
countries were insignificant to the financing of the
subprime mortgages. In addition, they argue that an
increase in global saving did not contribute to interest rates
hitting record lows between 2001 and 2004. In their
research, Borio and Disyatat found that the excessive-
savings argument puts far too much emphasis on the role of
current account imbalances across the globe. Although
8 Obstfeld and Rogoff (2009). Page 4.

International Journal of Economics, Finance and Management Sciences 2015; 3(4): 367-390 370
savings might have an impact on interest rates, the
economists found evidence that this was not the case before
the financial collapse in 2008. Joseph Stiglitz supports their
argument and helps Borio and Disyatat support the notion
that monetary economics played a more significant role
than global imbalances to the financial crisis.
3. Government Spending Initiated the
Downfall of the United States
Financial System
As terrible as the terrorist attacks were, the economy did
not give the authorities time to cope with the losses. We
knew before that “an increase in terrorist activity redirects
economic activity from investment to government
spending,”9 and this trend persisted after 9/11. A transition
away from investing is always undesirable because of the
significant impact investments have on the larger economy.
This section examines how “the long-term damage [of the
attacks was] inflicted not by the event itself but by the
response to it,” 10 which led to outrageous levels of
government debt and subsequently to low interest rates and
the financial crisis.
Before we look at the impacts of the response, however,
we must explore how exactly the government responded to
the 9/11-attacks. First and foremost, the government feared
other terrorist groups might launch similar attacks on the
United States, which led to substantial capital flows
towards national defense and improvements to homeland
security. One of the most notable reactions by the
government to 9/11 was a more expansionary fiscal policy.
The repercussions of the new policy approach were “to
destroy any semblance of fiscal discipline in Washington”11.
Seemingly out of anger and grief, the government “rush[ed]
headlong into two, essentially unaffordable wars” 12 in
Afghanistan and Iraq. Both conflicts were justified by the
argument that 9/11 forced our military into a War on Terror.
About fourteen years later, the impact of the two wars on
government debt still affects the economy today.
The way the government decided to finance the conflicts
took an immense financial toll on the United States. Fact is
that “war costs always linger well after the last shot has
been fired”13. As shown in figure 214, in the late-1990s the
Clinton-administration made a conscious effort to reduce
federal debt continuously and smart policy-making put the
nation on the right path. However, when George W. Bush
took office in 2001 the government ceased its debt-control
mindset and went on a spending spree, in particular after
9/11. Specifically, decisions to create the Department of
Homeland Security, attack Afghanistan and Iraq, and
9 Roberts (2009). Page 3.
10 Warner (2011). Page 1.
11 Yardeni, ed. Burton (2011). Page 1.
12 Warner (2011). Page 1f.
13 Bilmes (2011). Page 1.
14 Appendix B.
improve national security systems strained the budget.
When the new administration decided to combine these
expenditures with tax cuts in 2001 and 2003, the trend of
decreasing national debt inevitably reversed, as figure 215
indicates. Furthermore, figure 3 16 reveals how defense
spending alone increased by about $150 billion between
2001 and 2003 and had more than doubled by the end of
2007. Overall, the amount of money the government put
into its Department of Defense increased from a little under
$300 billion in 2000 to over $700 billion in nominal value
terms by 2012. In 2008, when the financial system
collapsed, war expenditures on the conflicts in Afghanistan
and Iraq reached peak levels eating up one-forth of the
entire defense budget. In the first ten years after the
terrorist-attacks, the wars in the Middle East cost the United
States $1.4 trillion overall, as shown in figure 417, with ever
more capital flowing in that direction still today. If we
isolate the War on Terror, including benefit payments to
veterans and expenditures on homeland security, we find
that it had cost the government about $800 billion by the
end of George W. Bush’s term in office, as illustrated by
figure 518. President Barack Obama did not cut down on
these costs either when he took office in January of 2009,
but instead “increased spending for the War on Terror”19.
Between 2009 and 2012, in just three years in office,
President Obama had requested another $477 billion to
fight terror.
Historically, military activity has been a stimulant to the
economy by creating jobs. However, in the 2000s it was “a
primary contributor to ballooning United States government
debt”20. The extra debt accumulated in order to finance the
Afghanistan and Iraq wars, non-war related defense
spending, and homeland security “accounts for well over
one-quarter of the increase in national debt since 2001”21.
The government’s expenditures “would not have been on
anything like this scale had it not been for 9/11” 22 .
Econometric studies about the relationship between the
increased debt and terrorist attacks indeed found that the
rise in federal debt can be attributed to the terrorist attacks23.
That is because the way the government decided to finance
the wars in Afghanistan and Iraq carried the economy into
an unsustainable state. Unlike previous conflicts, such as
the Korean War, Vietnam War, or even World War II, which
were financed at least in part by high tax rates between 70
and 90 percent, as shown in figure 624, tax rates during the
wars in the Middle East were kept below 40 percent. The
government actually cut taxes at the same time as our
military invaded Iraq. The government put the economy on
15 Appendix B.
16 Appendix B.
17 Appendix B.
18 Appendix B.
19 Amadeo (2014). Page 2.
20 Burger (2013). Page 2.
21 Bilmes (2011). Page 1.
22 Coxe, ed. Burton (2011). Page 2.
23 Eichenbaum and Fisher (2004). Page 2.
24 Appendix B.

371 David Joel Skandera: Connecting 9/11 to the Financial Crisis
a downward spiral with its tax policies in the early-2000s.
Not surprisingly, the costs of both the Afghanistan conflict
and Iraq war exceeded the capacity of the federal budget
and “have since pushed [it] into a deep and prolonged
projected deficit”25. From the beginning, there was no other
option but to pay for the entire costs of the wars through
borrowing, primarily from Japan and China, as indicated in
figure 726. The problem with this approach is that some
other country might pay for the expenses now, but
eventually this money must be paid back plus interest.
Although the authorities were able to sustain the illusion of
growing prosperity for half a decade, they failed to
recognize the true state of the economy between 2001 and
2008.
4. The Impact of Government Debt
The most obvious impact of such large amounts of
federal debt is that the government is less inclined to invest
in the economy because the budget is strained. Although
figure 8 27 does not show a large decrease in real net
investment immediately after 9/11, it does show a
significant drop immediately after the government forced
the largest banks of the economy to accept an immense
injection of federal capital in 200828. When the financial
system in the United States collapsed due to the losses
banks incurred from the bust of the credit bubble, the
government had to invest much more into the market than it
was willing to. Fact is, many of the “resources that would
have been spent on” investments to save the economy
“went instead to prevent further attacks” and fight terrorism
on the other side of the planet29. These expenditures simply
“meant that less funds were available for stimulus programs
to boost the country out of the… financial crisis”30 before it
became the largest recession in about seventy years. Neely
(2004) and Amadeo (2014) suggest that the increasing debt
caused the government to look for ways to save money,
consciously or unconsciously. Therefore, although
authorities introduced the Troubled Asset Relief Program
late in 2008 and passed the American Recovery and
Reinvestment Act in 2009, they waited too long to provide
banks with the financial assistance they needed in part due
to their unwillingness to invest further billions of dollars in
the economy. In addition, Giancarlo Corsetti (2013)
suggests a large amount of federal debt has the following
impact:
“It hampers the exercise of sound monetary policy by
making monetary authorities less inclined to use restrictive
monetary policies because of the impact on the interest bill
of the government.”31
25 Santomero (2003). Page 4.
26 Appendix B.
27 Appendix B.
28 Kirk (2009).
29 Neely (2004). Page 30.
30 Amadeo (2014). Page 3.
31 Corsetti (1999). Page 1.
This means that the Federal Reserve will theoretically
keep interest rates low at times of increasing government
debt. At the end of the day, however, high levels of
government debt inevitably have a very specific long-term
impact on interest rates. If we look at a Cobb-Douglas
production function model as introduced by Eric Engen and
Glenn Hubbard:
Y = A∗K^ ∂∗L^(1 − ∂)
where Y is output, A represents a coefficient for
productivity, L depicts labor, and K is capital, we find that
the interest rate depends on shocks to national debt. In order
to make the model as simple as possible, let us assume that
investments are equal to capital. The following equation
models the relationship between the nominal interest rate
and investments, which is subject to the federal deficit:
r = ∂∗(Y/K) = ∂∗A∗(L/I)^(1 − ∂).
Notice how the interest rate (r) increases as investments
(I) decrease 32 . In other words, the model proves that
changes in government debt play a key role in determining
the level of the interest rate. The two variables operate at a
positive relationship, meaning that as debt increases the
interest rate increases as well, as evident in figure 933. Bear
in mind, this phenomenon occurs because a large national
deficit and an increase in federal borrowing crowds out
capital and reduces investments. To clarify, the crowding-
out effect occurs when the government’s “financing needs
are large and when government has to roll over large debts
on a continual basis” 34 . Emphasis is put on the word
“continual” and it is certainly reasonable to argue that the
United States operated on a significant and growing deficit
between 2001 and 2004, as shown in figure 10 35 .
Furthermore, figure 11 36 illustrates how United States
borrowing increased substantially between 2001 and 2006.
The interest rate did not increase until 2004 because the
Federal Reserve artificially kept it at a low-level by
consistently increasing the money supply throughout the
early-2000s. When the growth of money supply was shut
close to zero between 2004 and 2008, as illustrated in figure
1337, the boundaries that held the crowding-out effect in
check were removed.
5. Monetary Policy and the Financial
Crisis – Money Supply and Interest
Rates
Some economists feel that “mistakes by the [Federal
32 Engen and Hubbard (2004). Page 84.
33 Appendix C.
34 Reinhart and Tashiro (2013). Page 23.
35 Appendix C.
36 Appendix C.
37 Appendix C.

International Journal of Economics, Finance and Management Sciences 2015; 3(4): 367-390 372
Reserve] set the stage for the financial crisis”38 in the late-
2000s. Before analyzing the institution’s actions between
9/11 and the financial crisis, an understanding of the way it
creates interest rates on the open market is essential. This is
where the money supply and the federal funds rate come
into play. In order to implement its policy, the Federal
Reserve relies heavily on open market operations.
Specifically, the institution adjusts the value of capital
reserves banks are required to have on hand. Lowering the
requirement, for example, means that banks must withhold
a smaller percentage of deposits from the market and can
lend more money to customers or other banks instead.
Therein, the Federal Reserve controls the money supply in
the economy. Another, more complicated approach is
directly related to financial securities. After the government
increases its spending, such as during the years after 9/11,
the Department of Treasury auctions off bonds and other
government securities to private dealers authorized to trade
them on the open market. If the Federal Reserve determines
the money supply in the economy is insufficient, it “can buy
[these] securities providing banks with greater reserves”39
in that the money used to execute the transactions is
credited to the bank accounts of the dealers. These extra
deposits enable banks to lend out more money, which
results in a greater flow of capital throughout the economy.
A third way in which the Federal Reserve increases the
money supply is by lending directly to banks.
After 9/11, the Federal Reserve substantially revised its
expectations about future economic and financial variables.
It made sure that the shock of the attacks would not have a
significant impact on the economy and provided “an
extraordinary degree of monetary stimulus”40 in the form of
ample liquidity. Specifically, the Federal Reserve directly
“injected over $100 billion per day into the financial
system” 41 on the first three days after 9/11 before
increasing the money supply by another $200 billion
between 2002 and the end of 2004, as shown in figure 1242.
Figure 1343 illustrates how this trend of money growth has
persisted ever since. As the blue line indicates, the amount
of liquidity provided by the Federal Reserve increased
substantially in the early-2000s. In the short-run, this
worked out fine. Between 2002 and 2004 the economy
recovered from the shock of 9/11 as proven by the Gross
Domestic Product (GDP) and unemployment rate, amongst
other indicators. During this period, GDP recovered quickly
from a growth rate of less than 1% to over 4%, as shown in
figure 1 44 . Meanwhile, unemployment decreased slightly
from 6% to about 5%, as illustrated in figure 1445. Other
major indicators, however, including inflation, projected
38 Nelson (2010.). Page 10.
39 Neely (2004). Page 30.
40 Santomero (2003). Page 4.
41 Makinen (2002). Page 10.
42 Appendix C.
43 Appendix C.
44 Appendix A.
45 Appendix C.
that the long-term impact of the growing money supply
would be problematic. Between 2002 and 2004 the inflation
rate rose to a worrisome level of about 3.5%, as shown in
figure 15 46 . Therefore, while some indicators made the
economy look healthy in the aftermath of 9/11, other
measures painted a different picture.
Fact is, the “additional liquidity contributed to the
housing bubble and the financial collapse” 47 in that it
helped drive interest rates down from about 3.8% right
before 9/11 to 1% by the end of 2003. Figures 16 and 1748
prove how an increase in the previously discussed money
supply impacts interest rates. The more money the Federal
Reserve made available to banks, the more loans,
mortgages, and other securities banks were able to sell.
Figure 18 49 indicates a sharp increase in the amount of
loans and leases in 2002, which persisted until the
bankruptcy of Lehman Brothers in 2008. Therein, banks
earned a higher total income from more interest payments.
The relationship between aggregate demand and interest
rates is illustrated in figure 1650, where output (Y) increases
and the interest rate (i) decreases in response to a greater
money supply. In figure 1951 we see how an increase in the
supply of money drives interest rates down and how the
impact of federal debt offsets this trend when money
growth decreases.
6. The Liquidity Effect and the Paradox
of Monetary Economics
As we discuss the impact of money growth on interest
rates we must keep in mind that the two variables “are
negatively related over short periods”52. This means that
interest rates decrease as the money supply increases in the
short-run, which is what happened after 9/11. It might be
important to note that the Federal Reserve was already
aiming for lower “interest rates in January 2001, but
because of 9/11, [it] cut [them] further” 53 . In fact, the
attacks led the authorities to target an interest rate reduction
much larger “than would be expected from levels of output
and inflation”54 at the time. Figure 2055 shows that interest
rates decreased from 3.75% to 1.75% at the end of 2001,
and again from 1.75% to 1% flat between 2002 and 2004.
The decision to lower rates was based on the idea that it is
“useful to maintain lower interest rates than [usual] to keep
banks and other financial institutions healthy” 56 when
uncertainty regarding the future grew within the population.
46 Appendix C.
47 Bilmes (2011). Page 2.
48 Appendix C.
49 Appendix C.
50 Appendix C.
51 Appendix C.
52 Nelson (2010). Page 5.
53 Faber, ed. Burton (2011). Page 2.
54 Neely (2004). Page 27.
55 Appendix D.
56 Neely (2004). Page 29.
373 David Joel Skandera: Connecting 9/11 to the Financial Crisis
Not less important in the decision-making process was the
state of the financial industry and private as well as public
debt. Low interest rates were supposed to help the financial
system restructure after the stock market was shut down for
five whole days after the attacks, the longest shutdown
since 1933. The rate was kept down until the end of 2004 in
order to reduce the cost of financing government debt,
which has increased every year since 9/11. Moreover, the
aforementioned unemployment rate played a role in the
determination of the interest rate target between 2001 and
2004. Last but not least, the rise in the debt-to-GDP ratio,
illustrated in figure 2157, was more tolerable at low interest
rates. This argument is supported by the fact that rates were
cut close to zero when the debt-to-GDP ratio rose to over 80
% between 2008 and 2009.
In addition, the Federal Reserve’s decision to increase the
money supply substantially after 9/11 caused the so-called
liquidity effect to reach unsustainable levels in the United
States. To clarify, this effect implies that a greater supply of
money makes credit more easily available, which results in
greater economic activity as businesses and individuals
borrow more. As the demand for loans increases the price of
borrowing decreases. In other words, an increase in the
money supply puts downward pressure on interest rates
short term58. In the years after 9/11 the Federal Reserve
excessively increased money growth and then technically
shut it down to almost zero, as seen in figure 1559. Notice
how the slope of the blue line for the money supply changes
from $666.67 billion per year between 2001 and 2004 to
$66.67 billion per year between 2004 and 2008. To the
economy, a change of this size over a period this short was
devastating. In turn, the magnitude of the liquidity effect
increased the magnitude of the paradox of monetary
economics, which states that “excessively low interest rates
now will only lead to much higher interest rates later”60.
Evidence for the paradox is given in figure 2061 , which
indicates how interest rates fell substantially in the early-
2000s before they increased just as significantly between
2004 and 2006. In the graph the interest rate is substituted
with the federal funds rate target, which is acceptable
because the two rates have empirically behaved the same
way.
7. Changes in the Interest Rate Helped
Cause the Conditions Which Led to
the Financial Crisis
This leads us to the federal funds rate, which is the rate
banks charge each other for overnight loans needed to meet
the capital reserve requirement. In turn, the federal funds
rate impacts the interest rates banks charge their customers
57 Appendix D.
58 Hamilton (1997). Page 81.
59 Appendix C.
60 Nelson (2010). Page 4.
61 Appendix D.
for all kinds of loans. As the reserve requirement decreases,
so does the federal funds rate because banks will not have
to borrow as much money from each other. Based on a very
basic price-demand-relationship, as shown in figure 2262,
lower demand for funds results in cheaper loans. When it
becomes less expensive to borrow money, banks pass this
change on to their customers in terms of lower interest rates
because they do not have to pay as much interest on their
own loans. Making such credit more readily available has
led to excessive risk-taking in the banking sector and on the
open market, in particular in regards to default swaps and
real estate63. Such risk-taking due to ultra-low interest rates
significantly increases the likelihood of a financial crisis.
At the end of 2001, the Federal Reserve adjusted its
federal funds rate target “to a near-record low of one
percent and kept it under two percent until”64 June 2004.
Per usual, the Federal Reserve accomplished their target
and sparked a drop in the interest rate, which made all kinds
of loans much more attractive to private borrowers. The
lower reserve requirement and decrease in interest rates
“spurred a frenzy in mortgage lending”65 above anything
else. In turn, this increasing demand for mortgages led to
the rapidly increasing values of homes in the United States
between 2001 and 200566, which is known as the housing
bubble. As people sought assistance to pay for the high
housing prices, the policies executed by the Federal
Reserve after 9/11 enabled banks “to entice homebuyers
with adjustable-rate mortgages,” 67 although economic
theory suggested that interest rates were going to increase
eventually. Sure enough, the valuation of real property
increased to a level unsustainable “in relation to incomes
and other indicators of affordability”68. It is reasonable to
assume that the Federal Reserve decided to raise its federal
funds rate target to slow down the evident boom in the
economy. In addition to rising property values, the
aforementioned behavior of the GDP growth and
unemployment rates between 2002 and 2004 likely
impacted this decision, which caused the housing bubble to
burst. Both rates made the Federal Reserve feel comfortable
that the economy could sustain an increase in interest rates.
However, this increase led to the values of houses
decreasing so much that mortgage debt exceeded the worth
of these homes. Therefore, foreclosure rates increased
substantially between 2007 and 2009, as illustrated in figure
2469, leading to struggles within the banking sector. Former
Federal Reserve-chairman Alan Greenspan admitted that
the housing bubble and excessive mortgage lending were
“fundamentally engendered by the decline in… interest
62 Appendix D.
63 Kuttner (2012). Page 6.
64 Comiskey and Madhogarhia (2009). Page 273.
65 Comiskey and Madhogarhia (2009). Page 273.
66 Figure 23. Appendix D.
67 Levy (2011). Page 1.
68 Bianco (2008). Page 3.
69 Appendix D.
International Journal of Economics, Finance and Management Sciences 2015; 3(4): 367-390 374
rates”70.
The large number of foreclosures was influenced by the
behavior of interest rates. After keeping the rate between 1%
and 2% for much of the first half of the 2000s, the Federal
Reserve more than tripled it by the end of 2006 to almost
6%. This decision was not only meant to slow down the
economic boom, but also to contain inflation, which had
increased from about 1% in 2002 to over 4% in 2006, as
shown in figure 15 71 . However, while the increase in
interest rates did drive inflation back down, it also
increased loan rates, including the three-month treasury bill
market rate, discount rate, and the rate for adjustable-rate
mortgages, as shown in figures 25, 26, and 27 72 ,
respectively. Note how these interest rates behave very
similar to the federal funds rate target proving a significant
correlation between monetary policy and actual interest
rates. Mortgage rates, in particular, rose by more than 2%
between 2004 and 2007. A “hike of this magnitude can
double the payments on”73 adjustable-rate mortgages and
push borrowers into a financial hole. In the years following
the 9/11-attacks, “the number of adjustable-rate mortgages
rose to about one-third of total mortgages,” 74 which
engendered the housing bubble. The implosion of these
mortgages, which initiated the financial crisis, is proven in
figure 2875, where resets equal the losses accumulated by
banks as borrowers became unable to pay off their debts.
Therein, banks incurred too much bad debt, which could not
be covered by the existing capital reserves.
When economists refer to the bursting of the housing or
credit bubble, the amount of bad debt in the financial
system reached critical levels and left financial institutions
insolvent. Monetary policy is supposed to prevent this
situation before it ever reaches a critical point. However, in
the 2000s the Federal Reserve’s loose-fitting approach
played a key role in causing excessive risk-taking 76 .
Claudio Borio and Haibin Zhu (2012) studied this
relationship between monetary policy and risk-taking in
more detail:
“Lower interest rates, for instance, boost asset and
collateral values as well as income and profits, which in
turn can reduce risk perceptions and increase risk tolerance.
[T]his can encourage risk-taking.”77
In addition, not only interest rates, but also liquidity
shocks impact risk-taking in the economy. If monetary
policy is kept too loose for too long its weak constraints can
lead to excessive risk-taking78. Other potential causes for
excessive risk-taking mainly relate to the philosophy of
corporate governance. A recent study on this topic by
70 quoted in Bianco (2008). Page 4.
71 Appendix C.
72 Appendix D.
73 Comiskey and Madhogarhia (2009). Page 273.
74 Taylor (2009). Page 11
75 Appendix D.
76 Challe (2012). Page 51.
77 Borio and Zhu (2011). Page 243.
78 Borio and Zhu (2011). Page 245.
Hamid Mehran, Alan Morrison, and Joel Shapiro (2011)
examines how the banking sector had been infested by
shadowy decision-making. Overall, the study proposes that
strategic decisions were based on a desire to increase
individual bonuses, short-term stock price movements, or
the selfish short-term interests of major shareholders 79 .
Regardless, between 9/11 and the collapse of the financial
system, the willingness of banks and all other economic
agents to take ever greater risks led to a phenomenon called
systemic risk. The authorities, in cooperation with our
nation’s banks, injected a dangerous virus into the economy.
After the bankruptcy of Lehman Brothers it unleashed its
power.
Utilizing a variation of the original Taylor Rule in order
to determine the federal funds rate target could have
incapacitated the virus before it ever became a threat and
prevented the Great Recession. To clarify, according to this
particular specification of the rule the Federal Reserve
should base its target interest rate on the following formula:
i = r + π + ∂∗(π − π’) + µ∗(y − y’)
where i is the federal funds rate, r is the natural federal
funds rate oftentimes taken to be 2%, π is the rate of
inflation, π’ is the desired inflation rate, ∂ is a fixed
inflation gap coefficient, µ is a fixed GDP gap coefficient, y
is the logarithm of real output in the economy, and y’ is the
logarithm of potential output80. As proven by figure 2981,
the fact that the Federal Reserve kept interest rates “too low
for too long… [and] then raised them too far too fast”82
triggered the collapse of the financial system. If policy
makers had adhered to the Taylor Rule introduced above
instead of trying to aggressively safeguard the market, the
boom would not have occurred to such a high degree.
Instead, borrowers would have acted more conservatively.
In addition, banks would not have written as many
adjustable-rate mortgages because the likelihood of interest
rates decreasing would have been larger. To clarify, lower
interest rates mean that banks receive a lower return on
adjustable-rate mortgages, making these less attractive to
the institutions. In turn, the lower current interest rates are,
the more of these adjustable-rate mortgages are sold.
Without the boom, there would not have been a bust and no
financial crisis. If monetary policy is executed carefully it
can help the economy approach full employment and
prosperity, but if not it “will ensure high inflation and
recurrent recessions”83.
8. Regression Analysis
In order to strengthen the arguments made in this paper
up to this point, two ordinary least squares regression
79 Mehran et al. (2011). Page 1.
80 Fernandez et al. (2008). Page 5.
81 Appendix D.
82 Comiskey and Madhogarhia (2009). Page 273.
83 Nelson (2010). Page 13.
375 David Joel Skandera: Connecting 9/11 to the Financial Crisis
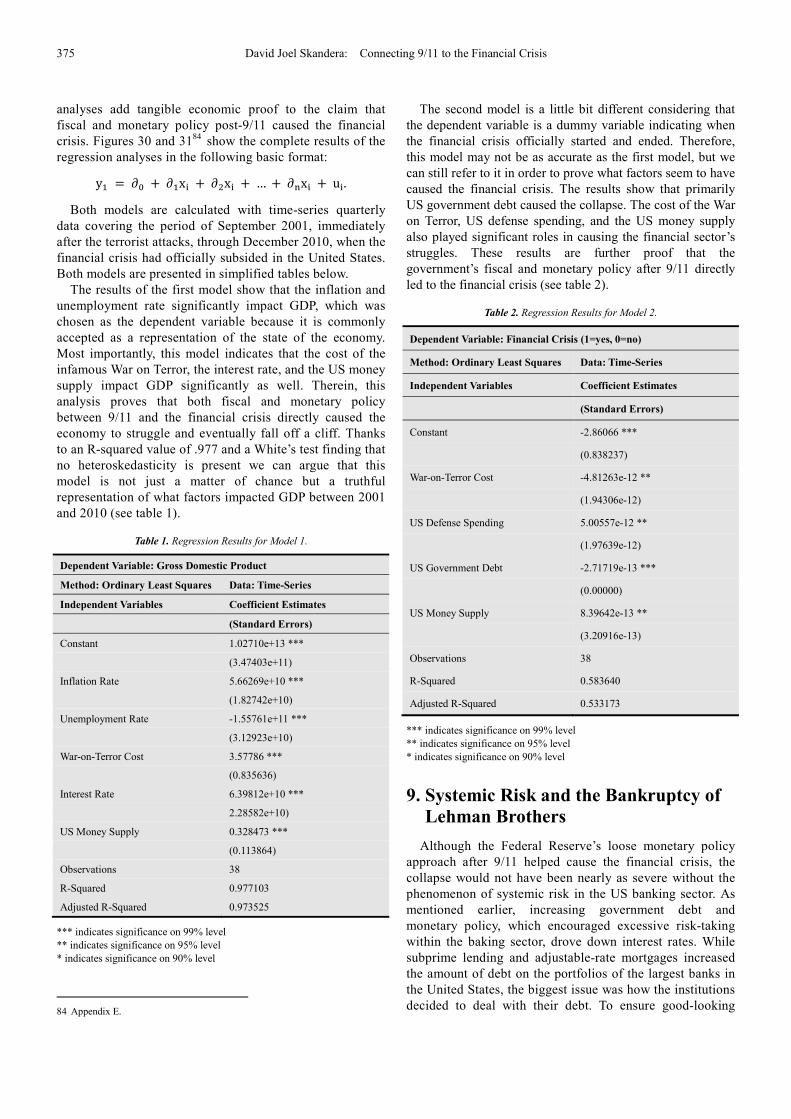
analyses add tangible economic proof to the claim that
fiscal and monetary policy post-9/11 caused the financial
crisis. Figures 30 and 3184 show the complete results of the
regression analyses in the following basic format:
y� = ∂� + ∂�x� + ∂�x� + … + ∂�x� + u�.
Both models are calculated with time-series quarterly
data covering the period of September 2001, immediately
after the terrorist attacks, through December 2010, when the
financial crisis had officially subsided in the United States.
Both models are presented in simplified tables below.
The results of the first model show that the inflation and
unemployment rate significantly impact GDP, which was
chosen as the dependent variable because it is commonly
accepted as a representation of the state of the economy.
Most importantly, this model indicates that the cost of the
infamous War on Terror, the interest rate, and the US money
supply impact GDP significantly as well. Therein, this
analysis proves that both fiscal and monetary policy
between 9/11 and the financial crisis directly caused the
economy to struggle and eventually fall off a cliff. Thanks
to an R-squared value of .977 and a White’s test finding that
no heteroskedasticity is present we can argue that this
model is not just a matter of chance but a truthful
representation of what factors impacted GDP between 2001
and 2010 (see table 1).
Table 1. Regression Results for Model 1.
Dependent Variable: Gross Domestic Product
Method: Ordinary Least Squares Data: Time-Series
Independent Variables Coefficient Estimates
(Standard Errors)
Constant 1.02710e+13 ***
(3.47403e+11)
Inflation Rate 5.66269e+10 ***
(1.82742e+10)
Unemployment Rate -1.55761e+11 ***
(3.12923e+10)
War-on-Terror Cost 3.57786 ***
(0.835636)
Interest Rate 6.39812e+10 ***
2.28582e+10)
US Money Supply 0.328473 ***
(0.113864)
Observations 38
R-Squared 0.977103
Adjusted R-Squared 0.973525
*** indicates significance on 99% level
** indicates significance on 95% level
* indicates significance on 90% level
84 Appendix E.
The second model is a little bit different considering that
the dependent variable is a dummy variable indicating when
the financial crisis officially started and ended. Therefore,
this model may not be as accurate as the first model, but we
can still refer to it in order to prove what factors seem to have
caused the financial crisis. The results show that primarily
US government debt caused the collapse. The cost of the War
on Terror, US defense spending, and the US money supply
also played significant roles in causing the financial sector’s
struggles. These results are further proof that the
government’s fiscal and monetary policy after 9/11 directly
led to the financial crisis (see table 2).
Table 2. Regression Results for Model 2.
Dependent Variable: Financial Crisis (1=yes, 0=no)
Method: Ordinary Least Squares Data: Time-Series
Independent Variables Coefficient Estimates
(Standard Errors)
Constant -2.86066 ***
(0.838237)
War-on-Terror Cost -4.81263e-12 **
(1.94306e-12)
US Defense Spending 5.00557e-12 **
(1.97639e-12)
US Government Debt -2.71719e-13 ***
(0.00000)
US Money Supply 8.39642e-13 **
(3.20916e-13)
Observations 38
R-Squared 0.583640
Adjusted R-Squared 0.533173
*** indicates significance on 99% level
** indicates significance on 95% level
* indicates significance on 90% level
9. Systemic Risk and the Bankruptcy of
Lehman Brothers
Although the Federal Reserve’s loose monetary policy
approach after 9/11 helped cause the financial crisis, the
collapse would not have been nearly as severe without the
phenomenon of systemic risk in the US banking sector. As
mentioned earlier, increasing government debt and
monetary policy, which encouraged excessive risk-taking
within the baking sector, drove down interest rates. While
subprime lending and adjustable-rate mortgages increased
the amount of debt on the portfolios of the largest banks in
the United States, the biggest issue was how the institutions
decided to deal with their debt. To ensure good-looking

International Journal of Economics, Finance and Management Sciences 2015; 3(4): 367-390 376
balance sheets, banks engaged in default swaps worth
hundreds of billions of dollars 85 . Because all of Wall
Street’s financial institutions traded their debt in such a
manner, systemic risk grew larger by the minute. To clarify,
systemic risk is a result of financial institutions being
interconnected through debt trading. If one institution fails,
many others will follow because the system will have to
cover the indebtedness of the insolvent company. When the
authorities realized the degree to which the largest banks of
our nation depended on each other it was already too late.
While the Federal Reserve still made an effort to save
Bear Stearns from bankruptcy when it became evident the
bank was running low on cash, the central bank’s officials
decided to make an example of Lehman Brothers to prove
that improper decision-making has consequences. However,
the Federal Reserve was oblivious to the level of systemic
risk in the system. Allowing Lehman to fail caused a fallout
that put the financial system in legitimate danger86. Due to
the size of Lehman, a large number of banks, institutions,
and organizations thought swapping defaults with and
investing in the bank would be safe. After all, how could a
bank of Lehman’s size with all its assets and connections
ever fail? Once it did fail uncountable companies inherited
unaffordable debt resulting in unbearable losses. At this
point in time, uncertainty within the financial system rose
to historic levels, resulting in a panic that led to stocks
crashing. Meanwhile, banks stopped lending altogether
simply to ensure their own survival. To accentuate the
relationship between 9/11 and systemic risk, the response to
the terrorist attacks led to loose monetary policy and,
therein, to excessive risk-taking. This excessive risk-taking
resulted in the entire American financial system being
interconnected, which eventually led to an economic crisis
as complex as any in history.
10. Counterarguments
It should not come as a surprise that there has been
plenty of debate amongst economists regarding the causes
of the financial crisis and what led to them in the first place.
One counterargument to this paper’s thesis is that excessive
global saving had a significant impact on creating the
conditions that led to the financial crisis. There are two
main hypotheses put forth by proponents of this view: “(i)
net capital flows from… account surplus countries to deficit
ones helped to finance the credit booms in the latter” and
“(ii) a rise in… global saving relative to… investment in
surplus countries depressed… interest rates” 87 . Maurice
Obstfeld and Kenneth Rogoff, argue that the “global
imbalances… were a critically important co-determinant”88
of the conditions that led to the financial crisis. The authors
argue that countries with large account surpluses such as
China and Japan took advantage of the extra capital and
85 Kirk (2009).
86 Kirk (2009).
87 Borio and Disyatat (2011). Page 1.
88 Obstfeld and Rogoff (2009). Page 1.
offered cheap loans to the United States. These capital
flows presumably enabled American decision-makers to
keep interest rates low.
Claudio Borio and Piti Disyatat (2011), however, tell a
different story about the reality:
“The state of these accounts tells us little about the
[actual] role a country plays in international borrowing,
lending, financial intermediation... and about the impact of
cross-border capital flows on domestic financial
conditions.”89
This means that we cannot refer to net capital flows or
account imbalances to explain the drop in interest rates
without also taking a look at other variables such as the
domestic money supply. The problem is that “a focus on…
accounts in the analysis of cross-border capital flows
diverts attention away from the global financing patterns
that are at the core of financial fragility” 90 . Fact is that
current account imbalances are negligible because current
account balances only reflect the net resource flows
between two trading partners. “Stocks, including all the
transactions involving only trade in financial assets, which
make up the bulk of cross-border financial activity”91 are
excluded, invalidating the argument that global imbalances
could have affected the financial system in the United
States significantly. While differences in current account
balances are irrelevant, low capital account balances can
indeed impact monetary policy. However, as shown in
figure 3292, the American account balance was all but low
throughout the 2000s.
The second counterhypothesis states that an increase in
global saving relative to investment caused a saving glut
that led to low interest rates. However, this argument is
highly disputed. In fact, suggesting that an increasing
level of savings caused interest rates to be kept low is
simply a way of shifting blame to countries such as China
or Germany and away from the leadership of the Federal
Reserve 93 . The saving-glut argument fails to take into
account the underlying issue within the financial system.
Over the past decades the system has become “more
fixated on speculation than on fulfilling its societal role of
intermediation” 94 in the United States. By the 2000s
increasingly excessive risk-taking within the financial
sector was not questioned anymore because it had become
the norm. Everyone accepted risky business and
speculative practices because it increased profits and
helped the US economy become the strongest and most
flexible in the world. Consequently, excess in savings did
not lead to bad monetary policy, but the nature of the
financial sector did.
Lastly, while many economists counter the argument
that the terrorist attacks of 9/11 had a significant impact
89 Borio and Disyatat (2011). Page 1.
90 Borio and Disyatat (2011). Page 1.
91 Borio and Disyatat (2011). Page 1.
92 Appendix E.
93 Stiglitz (2014). Page 1.
94 Stiglitz (2014). Page 1.

377 David Joel Skandera: Connecting 9/11 to the Financial Crisis
on the economy, all of these critics look at the short-run
instead of the long-run effects. It might be true that the
uncertainty and drop in economic activity immediately
after the attacks “was followed by a strong rebound,”95
but the long-term impact was certainly not positive. While
it cannot be denied that the economy was doing well about
a year after 9/11, the research presented in this paper
proves that the United States government was oblivious to
its true state. Especially external borrowing, loose
monetary policy, and fiscal-policy changes impacted by
the attacks, directly or indirectly, masked the issues within
the financial system. Therein, the authorities allowed these
problems to grow to unsustainable levels. Although the
economy might have seemed healthy between 2001 and
2007, it grew more ill each and every day and the shock of
the terrorist attacks magnified the decisions of the Federal
Reserve during that time. Specifically, the national debt
began to increase because of post-9/11 fiscal policy,
encouraging the decision to cut interest rates. Yes, interest
rates were already falling, but they probably would not
have been cut as much96. Liquidity, on the other hand, was
injected in the market to alleviate the fear of a market
crash in response to the one-week shutdown of the stock
market caused by the attacks.
11. Conclusion
In summary, the terrorist attacks of 9/11 led the United
States government to increase spending significantly,
nullifying the successes made at the end of the 1990s in
regards to national debt. The event was the catalyst for
debt rising to almost twenty trillion dollars today. Initially,
spending funds on homeland security and the War on
Terror did not seem to be a terrible decision although it
was expected to strain the government’s budget. After all,
fighting the people who bring fear to our doorstep has
always been the American way. There had been wars in
the past that had to be financed, but never had the
expenditures led to economic crises. Instead they had
helped domestic markets perform better. However, this
time around the government made a major mistake in that
it cut taxes at the same time it increased spending, which
goes against every kind of common sense. As a result,
monetary policy suffered from the increasing debt in that
authorities tried to keep policies loose to minimize the
impact on the interest bill of the government. Other
evaluations, such as a Cobb-Douglas production function
or a Keynesian IS-LM model illustrate how increases in
the national debt and federal borrowing led to higher
interest rates in the mid- to late-2000s. In addition, the
outrageous amount of debt incurred between 2001 and
2007 made authorities hesitant to provide the necessary
stimulus to boost the economy out of the Great Recession.
The government’s fiscal policy was not the only factor in
95 Bloom (2007). Page 2.
96 Faber, ed. Burton (2011). Page 2.
causing the financial crisis, however. The Federal Reserve
had at least as much of an impact. Decisions regarding the
money supply and interest rates incentivized banks to lend
ever more money and customers to engage in ever more
risky borrowing. As adjustable-rate mortgages and
subprime lending became popular practices, the market
was already moving towards an inevitable bust. In fact,
when the Federal Reserve made more money available to
banks, the latter began to lend more money to each other
and customers, which helped keep interest rates low. At
that time, not many experts, if any, saw the paradox of
monetary economics hiding in the market. Had it been
noticed in time, the economy would have been better
prepared for the spike in interest rates. This could have
helped our banks elude the crisis. On the other hand, if the
government and the Federal Reserve had adhered to a
variation of the original Taylor Rule, the paradox and
other conditions that led to the collapse could have been
avoided altogether. Fact is, bad fiscal and monetary
policies lead to recessions and, if one bad decision follows
another, the ramifications will increase exponentially in
magnitude. The best example is the bankruptcy of Lehman
Brothers. After the government and Federal Reserve
allowed systemic risk to invade the financial system with
low interest rates and an ever increasing money supply,
they shut down their bail-out programs and cut almost all
investments in struggling banks. As a result, Lehman
Brothers failed and dragged down with it the entire
financial system.
When our children learn about September 11, 2001, the
legacy of this disastrous event will not only include the
loss of thousands of American lives, but also encompass
two wars, examples of bad fiscal and monetary policy, and
a historic collapse of the US economy. Considering the
apparent vulnerability of the American financial system,
we can only hope that we are dealing with an occurrence
of the Black Swan Theory, which states that “this crisis
[was] a once-in-a-century event, caused by a confluence
of factors so rare that it is impractical to think of erecting
regulatory barriers” 97 . In order to avoid future market
failures of such magnitude it is imperative that the
regulatory institutions of the United States act as one unit
in regards to fiscal and monetary policy and trust in
proven rules, analyses of past recessions, and justify
decisions rationally before proposing any authoritative
action. On a last note, to understand the financial crisis in
its entirety, further research must be done especially on
systemic risk and the interconnectivity of banks on Wall
Street before the collapse. This paper provides an
important stepping-stone for anybody who attempts to
comprehend what happened to the American financial
system in the late-2000s and why. In the future, this paper
may be expanded to include an analysis of the conditions
that led to the financial crisis. Any expansionary research
should start with a viewing of the documentaries Inside
97 Jickling (2009). Page 7.
International Journal of Economics, Finance and Management Sciences 2015;
the Meltdown by Michael Kirk and Inside Job
Appendix A
Figure 1. Quarterly change in GDP (%) in the US between 2000 and 2013. The shaded areas indicate times when the economy was officially
McBride, Bill. “Will the U.S. Economy Grow in 2013?”. Calculated Risk Finance & Economics. 10 January 2013. Web. 2
Appendix B
Figure 2. Actual (bold) versus projected (dotted) US government debt in trillions of US dollars between 1990 and 2014. George W. Bush e
president in January of 2001 and the financial crisis began in 2007.
Kestenbaum, David. “What if We Paid Off The Debt: The Secret Government Report”. NPR Planet Money. 20 October 2011. Web. 1 Dec
International Journal of Economics, Finance and Management Sciences 2015; 3(4):
Inside Job by Charles Ferguson.
Quarterly change in GDP (%) in the US between 2000 and 2013. The shaded areas indicate times when the economy was officially
McBride, Bill. “Will the U.S. Economy Grow in 2013?”. Calculated Risk Finance & Economics. 10 January 2013. Web. 2
Actual (bold) versus projected (dotted) US government debt in trillions of US dollars between 1990 and 2014. George W. Bush e
president in January of 2001 and the financial crisis began in 2007.
estenbaum, David. “What if We Paid Off The Debt: The Secret Government Report”. NPR Planet Money. 20 October 2011. Web. 1 Dec
): 367-390 378
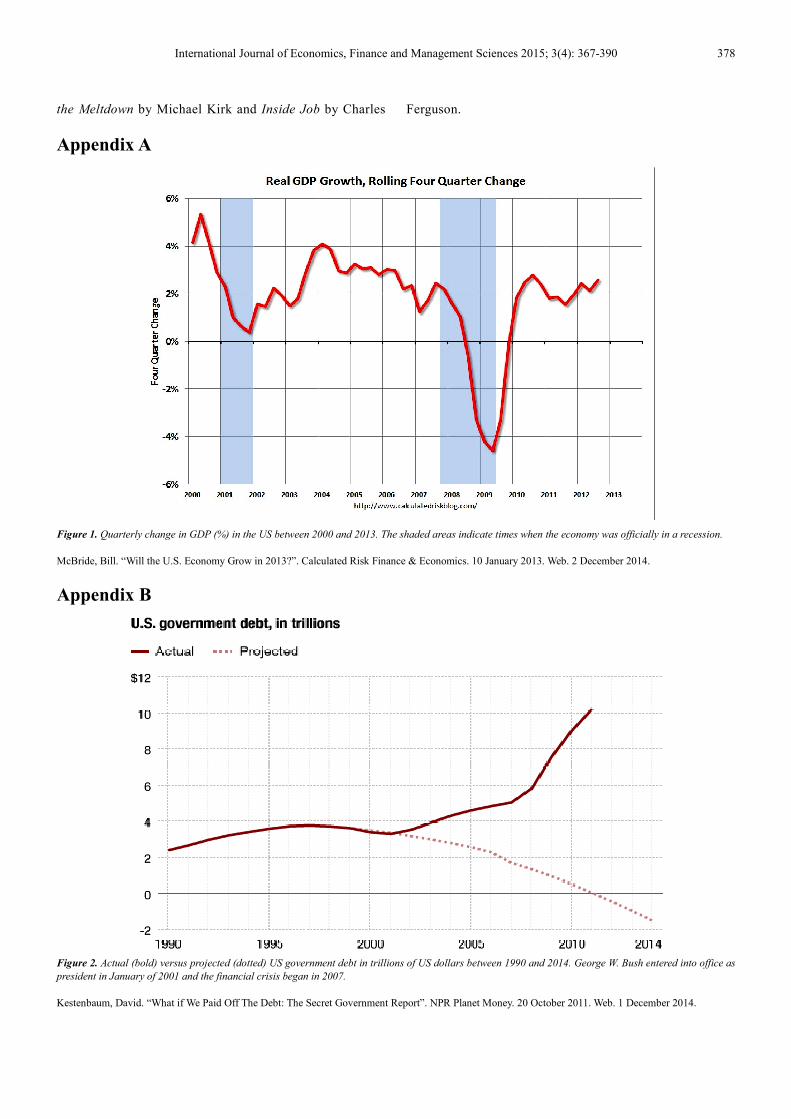
Quarterly change in GDP (%) in the US between 2000 and 2013. The shaded areas indicate times when the economy was officially in a recession.
McBride, Bill. “Will the U.S. Economy Grow in 2013?”. Calculated Risk Finance & Economics. 10 January 2013. Web. 2 December 2014.
Actual (bold) versus projected (dotted) US government debt in trillions of US dollars between 1990 and 2014. George W. Bush entered into office as
estenbaum, David. “What if We Paid Off The Debt: The Secret Government Report”. NPR Planet Money. 20 October 2011. Web. 1 December 2014.

379 David Joel Skandera: Connecting 9/11 to the Financial Crisis
Figure 3. US government spending on the Iraq and Afghanistan wars (red), the US department of defense budget (green),
budget (blue) between 2000 and 2011. The department of defense uses its budget to pay for all military related expenses, incl
health care of uniformed and civilian personnel, the maintenance
purchase of new equipment.
Figure 4. US national debt in trillions of US dollars between 2001 and 2011, where it originated, and which transactions where made dur
David Joel Skandera: Connecting 9/11 to the Financial Crisis
US government spending on the Iraq and Afghanistan wars (red), the US department of defense budget (green),
budget (blue) between 2000 and 2011. The department of defense uses its budget to pay for all military related expenses, incl
health care of uniformed and civilian personnel, the maintenance of arms, equipment, and facilities, the funding of operations, and the development and
US national debt in trillions of US dollars between 2001 and 2011, where it originated, and which transactions where made dur
US government spending on the Iraq and Afghanistan wars (red), the US department of defense budget (green), and the annual increase of this
budget (blue) between 2000 and 2011. The department of defense uses its budget to pay for all military related expenses, including the salaries, training, and
of arms, equipment, and facilities, the funding of operations, and the development and
US national debt in trillions of US dollars between 2001 and 2011, where it originated, and which transactions where made during this time period.
International Journal of Economics, Finance and Management Sciences 2015;
Figure 5. The cost of the War on Terror in billions of US dollars between 2001 and 2010. The War on Terror
attacks and is still going on today.
Figure 6. Federal tax rates (%) in the US between 1918 and 2014. Pay special attention to the tax
government spending increased significantly due to the wars in Iraq and Afghanistan.
Source: Bradford Tax Institute, History of Federal Income Tax Rates: 1913
International Journal of Economics, Finance and Management Sciences 2015; 3(4):
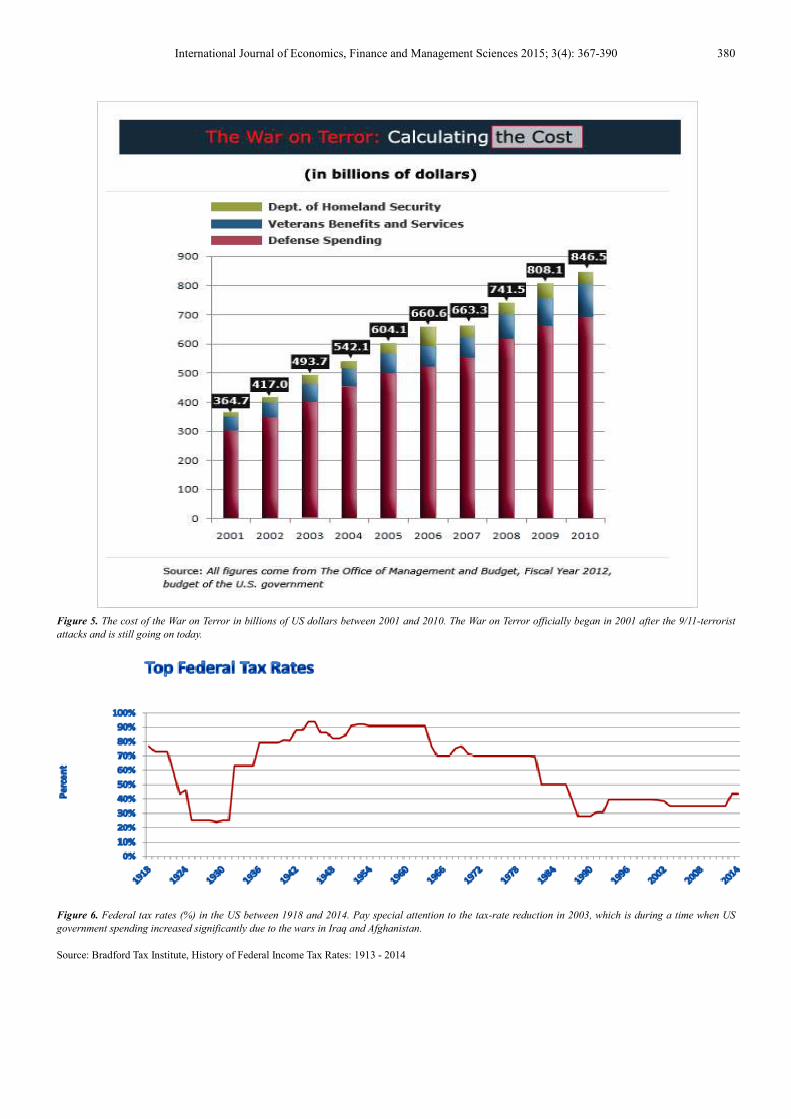
The cost of the War on Terror in billions of US dollars between 2001 and 2010. The War on Terror officially began in 2001 after the 9/11
Federal tax rates (%) in the US between 1918 and 2014. Pay special attention to the tax-rate reduction in 2003, which is during a time when US
ending increased significantly due to the wars in Iraq and Afghanistan.
Source: Bradford Tax Institute, History of Federal Income Tax Rates: 1913 - 2014
): 367-390 380
officially began in 2001 after the 9/11-terrorist
rate reduction in 2003, which is during a time when US

381 David Joel Skandera: Connecting 9/11 to the Financial Crisis
Figure 7. Major foreign holders of US federal debt. Between 2000 and 2010 China was the primary lender of the United States.
Figure 8. US government net investment in the economy between 2000 and 2013 in billions of US dollars. This kind of investment is a sig
GDP formula (GDP = C + I + G + X – M).
Appendix C
Figure 9. An IS-LM model indicating what should happen to market interest rates (i) and level of output (Y) in the economy when the IS curve
right (change in investment and/or saving in the economy). Between 2004 and 2006 the market interest rate rose.
David Joel Skandera: Connecting 9/11 to the Financial Crisis
Major foreign holders of US federal debt. Between 2000 and 2010 China was the primary lender of the United States.
US government net investment in the economy between 2000 and 2013 in billions of US dollars. This kind of investment is a sig
LM model indicating what should happen to market interest rates (i) and level of output (Y) in the economy when the IS curve
/or saving in the economy). Between 2004 and 2006 the market interest rate rose.
Major foreign holders of US federal debt. Between 2000 and 2010 China was the primary lender of the United States.
US government net investment in the economy between 2000 and 2013 in billions of US dollars. This kind of investment is a significant part of the
LM model indicating what should happen to market interest rates (i) and level of output (Y) in the economy when the IS curve shifts to the
International Journal of Economics, Finance and Management Sciences 2015; 3(4): 367-390 382
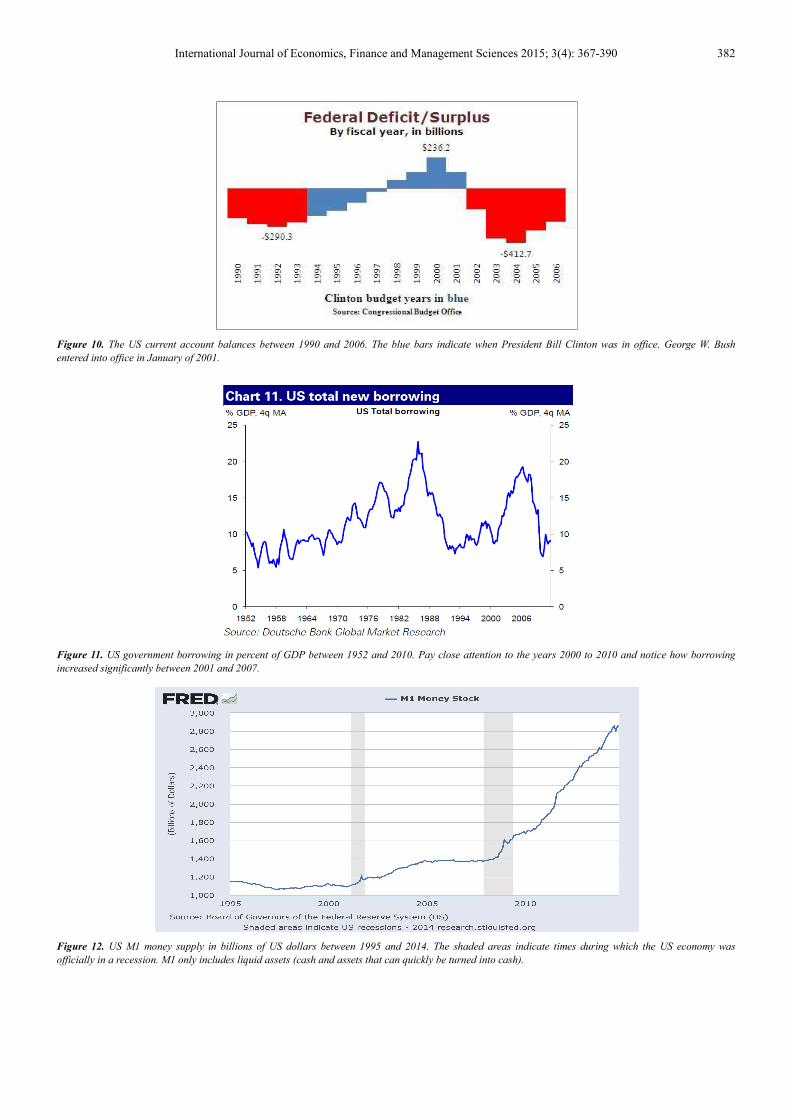
Figure 10. The US current account balances between 1990 and 2006. The blue bars indicate when President Bill Clinton was in office. George W. Bush
entered into office in January of 2001.
Figure 11. US government borrowing in percent of GDP between 1952 and 2010. Pay close attention to the years 2000 to 2010 and notice how borrowing
increased significantly between 2001 and 2007.
Figure 12. US M1 money supply in billions of US dollars between 1995 and 2014. The shaded areas indicate times during which the US economy was
officially in a recession. M1 only includes liquid assets (cash and assets that can quickly be turned into cash).
383 David Joel Skandera: Connecting 9/11 to the Financial Crisis
source: www.financeandeconomics.org
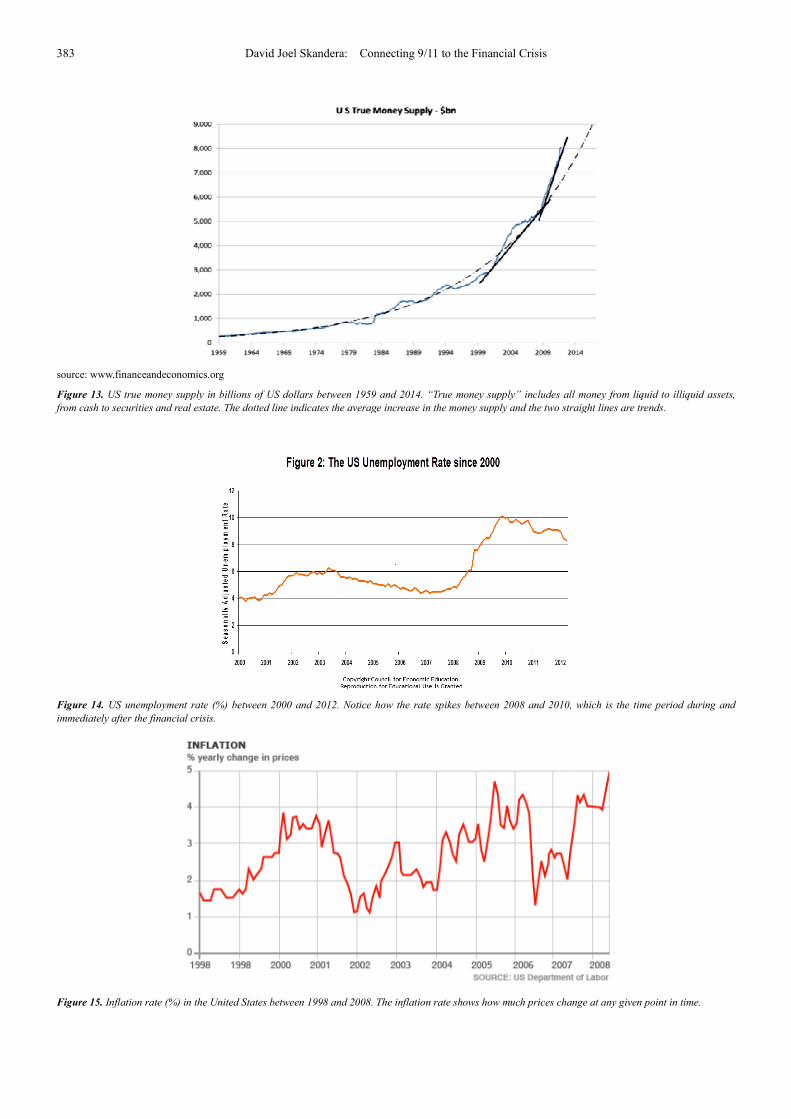
Figure 13. US true money supply in billions of US dollars between 1959 and 2014. “True money supply” includes all money from liquid to i
from cash to securities and real estate. The dotted line indicates the average increase in the money supply and the two straight lines are trends.
Figure 14. US unemployment rate (%) between 2000 and 2012. Notice how the rate spikes between 2008 and 2010, which is the time period du
immediately after the financial crisis.
Figure 15. Inflation rate (%) in the United States between 1998 and 2008. The inflation rate shows how much prices change at any given p
David Joel Skandera: Connecting 9/11 to the Financial Crisis
US true money supply in billions of US dollars between 1959 and 2014. “True money supply” includes all money from liquid to i
eal estate. The dotted line indicates the average increase in the money supply and the two straight lines are trends.
US unemployment rate (%) between 2000 and 2012. Notice how the rate spikes between 2008 and 2010, which is the time period du
Inflation rate (%) in the United States between 1998 and 2008. The inflation rate shows how much prices change at any given p
US true money supply in billions of US dollars between 1959 and 2014. “True money supply” includes all money from liquid to illiquid assets,
eal estate. The dotted line indicates the average increase in the money supply and the two straight lines are trends.
US unemployment rate (%) between 2000 and 2012. Notice how the rate spikes between 2008 and 2010, which is the time period during and
Inflation rate (%) in the United States between 1998 and 2008. The inflation rate shows how much prices change at any given point in time.
International Journal of Economics, Finance and Management Sciences 2015;
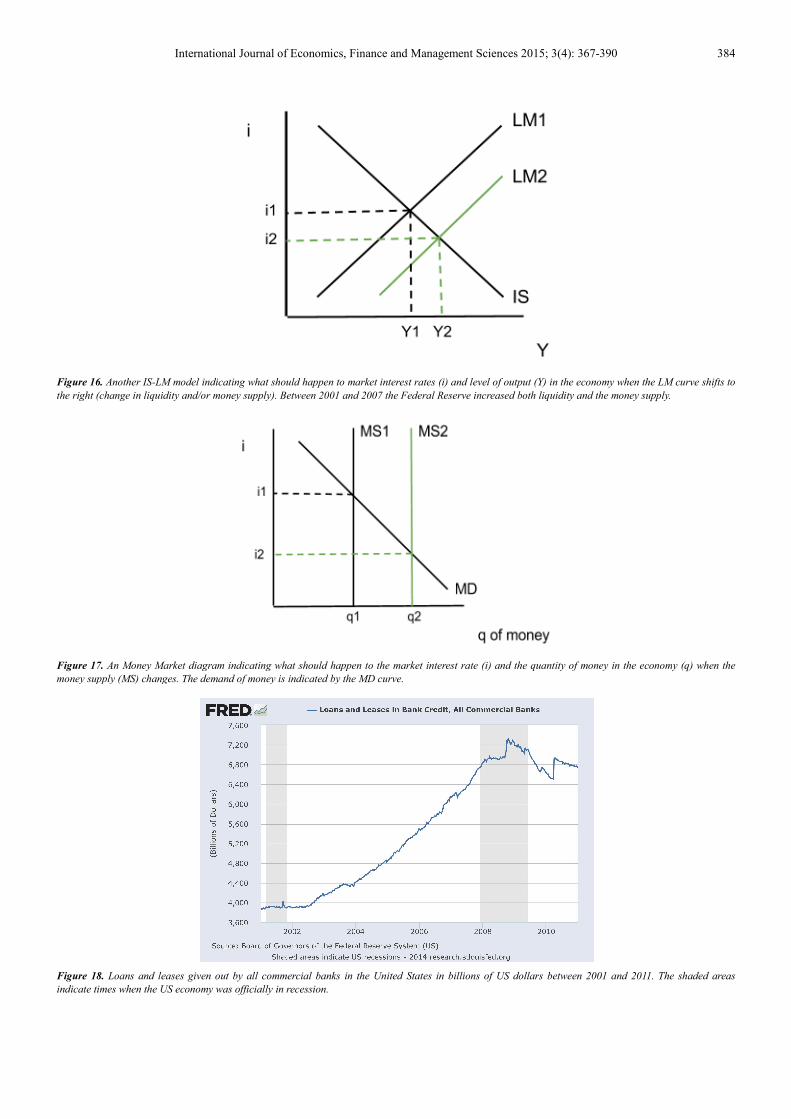
Figure 16. Another IS-LM model indicating what should
the right (change in liquidity and/or money supply). Between 2001 and 2007 the Federal Reserve increased both liquidity and t
Figure 17. An Money Market diagram indicating what should happen to the market interest rate (i) and the quantity of money in the econom
money supply (MS) changes. The demand of money is indicated by the MD curve.
Figure 18. Loans and leases given out by all commercial banks in the United States in billions of US dollars between 2001 and 2011. The
indicate times when the US economy was officially in recession.
International Journal of Economics, Finance and Management Sciences 2015; 3(4):
LM model indicating what should happen to market interest rates (i) and level of output (Y) in the economy when the LM curve shifts to
the right (change in liquidity and/or money supply). Between 2001 and 2007 the Federal Reserve increased both liquidity and t
An Money Market diagram indicating what should happen to the market interest rate (i) and the quantity of money in the econom
money supply (MS) changes. The demand of money is indicated by the MD curve.
Loans and leases given out by all commercial banks in the United States in billions of US dollars between 2001 and 2011. The
indicate times when the US economy was officially in recession.
): 367-390 384
happen to market interest rates (i) and level of output (Y) in the economy when the LM curve shifts to
the right (change in liquidity and/or money supply). Between 2001 and 2007 the Federal Reserve increased both liquidity and the money supply.
An Money Market diagram indicating what should happen to the market interest rate (i) and the quantity of money in the economy (q) when the
Loans and leases given out by all commercial banks in the United States in billions of US dollars between 2001 and 2011. The shaded areas

385 David Joel Skandera: Connecting 9/11 to the Financial Crisis
Figure 19. An IS-LM model that indicates what happe
Between 2001 and 2004 liquidity and the money supply increased (LM curve to the right) and between 2005 and 2008 public inves
the right).
Appendix D
Figure 20. The effective federal funds rate in the US financial sector between 2000 and 2014 as established by the Federal Reserve. It b
identical to the interest/discount rate in the US.
Figure 21. Total federal debt as percentage of GDP between 2000 and 2010. The shaded areas indicate times when the US economy was in
David Joel Skandera: Connecting 9/11 to the Financial Crisis
LM model that indicates what happened to the market interest rate (i) and the level of output (Y) in the US economy between 2001 and 2008.
Between 2001 and 2004 liquidity and the money supply increased (LM curve to the right) and between 2005 and 2008 public inves
The effective federal funds rate in the US financial sector between 2000 and 2014 as established by the Federal Reserve. It b
Total federal debt as percentage of GDP between 2000 and 2010. The shaded areas indicate times when the US economy was in
ned to the market interest rate (i) and the level of output (Y) in the US economy between 2001 and 2008.
Between 2001 and 2004 liquidity and the money supply increased (LM curve to the right) and between 2005 and 2008 public investment increased (IS curve to
The effective federal funds rate in the US financial sector between 2000 and 2014 as established by the Federal Reserve. It behaves almost
Total federal debt as percentage of GDP between 2000 and 2010. The shaded areas indicate times when the US economy was in a recession.

International Journal of Economics, Finance and Management Sciences 2015;
Figure 22. A simple supply-demand (S-D) diagram indicating what should happen to the price (P) and quantity of bank
demand for loans (D) decreases.
Figure 23. This graph shows the median sales price of existing homes in the United States in US dollars between 1999 and 2014. The shade
times when the economy was officially in recession. The housing boom occurred between 2002 and 2007 and reached peak levels between 2005 and 2006.
Figure 24. The number of forced home foreclosures (blue columns) in the United States between 2005 and 2010 and as a percentage of all s
International Journal of Economics, Finance and Management Sciences 2015; 3(4):
D) diagram indicating what should happen to the price (P) and quantity of bank
This graph shows the median sales price of existing homes in the United States in US dollars between 1999 and 2014. The shade
y in recession. The housing boom occurred between 2002 and 2007 and reached peak levels between 2005 and 2006.
The number of forced home foreclosures (blue columns) in the United States between 2005 and 2010 and as a percentage of all s
): 367-390 386
D) diagram indicating what should happen to the price (P) and quantity of bank-to-bank loans (P) in the US if the
This graph shows the median sales price of existing homes in the United States in US dollars between 1999 and 2014. The shaded areas indicate
y in recession. The housing boom occurred between 2002 and 2007 and reached peak levels between 2005 and 2006.
The number of forced home foreclosures (blue columns) in the United States between 2005 and 2010 and as a percentage of all sales (red line).
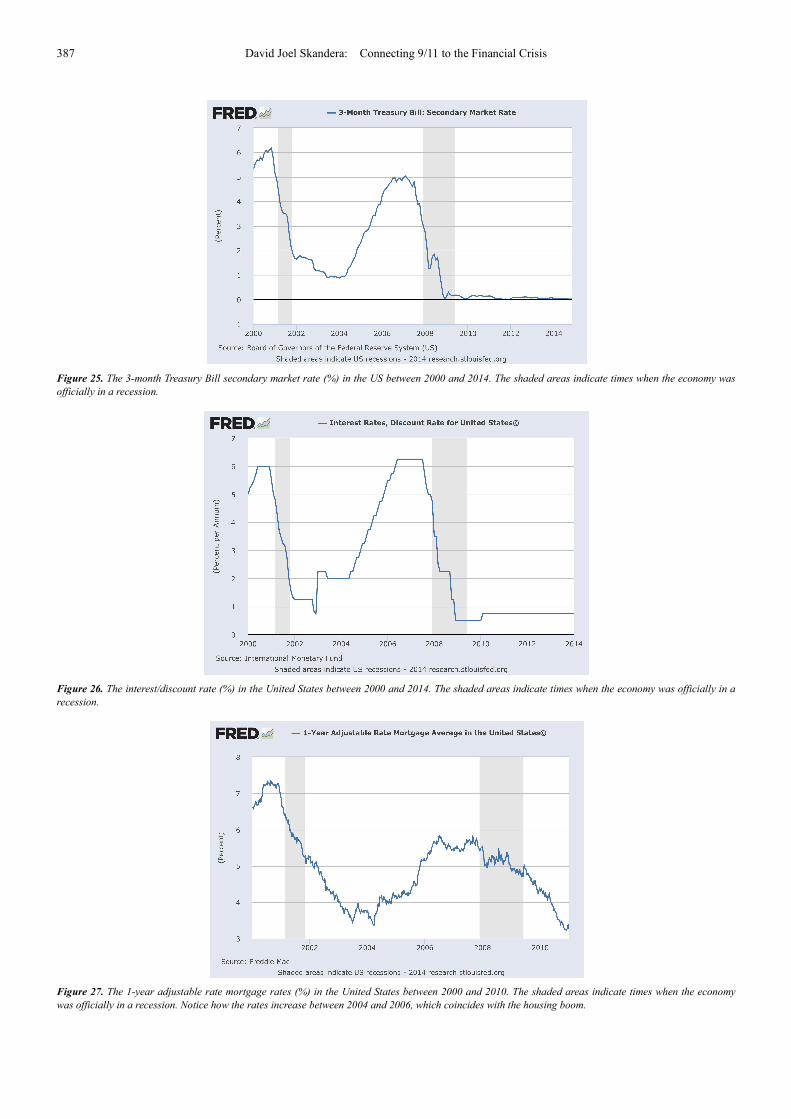
387 David Joel Skandera: Connecting 9/11 to the Financial Crisis
Figure 25. The 3-month Treasury Bill secondary market rate (%) in the US between 2000 and 2014. The shaded areas indicate times when the economy was
officially in a recession.
Figure 26. The interest/discount rate (%) in the United States between 2000 and 2014. The shaded areas indicate times when the economy was officially in a
recession.
Figure 27. The 1-year adjustable rate mortgage rates (%) in the United States between 2000 and 2010. The shaded areas indicate times when the economy
was officially in a recession. Notice how the rates increase between 2004 and 2006, which coincides with the housing boom.

International Journal of Economics, Finance and Management Sciences 2015; 3(4): 367-390 388
source: www.doctorhousingbubble.com
Figure 28. Monthly adjustable-rate mortgage (ARM) reset schedule. When a mortgage resets it basically means that it went bad and cannot be repaid.
Whenever a mortgage resets, banks incur bad debt. Notice how resets increase significantly between 2007 and 2008, which coincides with the financial crisis.
source: John B. Taylor’s Getting Off Track
Figure 29. Actual federal funds rate (%, normal line) versus the appropriate federal funds rate calculated with the Taylor Rule (%, dotted rule) between 2000
and 2007. Arguably, if the Federal Reserve had adhered to the Taylor Rule the financial crisis could have been avoided or at least mediated.
Appendix E
Figure 30. Model 2: OLS, using observations 2001:3-2010:4 (T = 38) Dependent variable: GDP.
coefficient std. error t-ratio p-value
const 1.02710e+13 3.47403e+11 29.57 8.34e-25 ***
Inflation_Rate 5.66269e+10 1.82742e+10 3.099 0.0040 ***
Unemployment_Rate −1.55761e+11 3.12923e+10 −4.978 2.12e-05 ***
War_on_Terror_Co~ 3.57786 0.835636 4.282 0.0002 ***
Interest_Rate 6.39812e+10 2.28582e+10 2.799 0.0086 ***
US_Money_Supply 0.328473 0.113864 2.885 0.0070 ***
Mean dependent var 1.41e+13 S.D. dependent var 7.59e+11
Sum squared resid 4.87e+23 S.E. of regression 1.23e+11
R-squared 0.977103 Adjusted R-squared 0.973525
F(5, 32) 273.1121 P-value(F) 2.98e-25
Log-likelihood −1021.131 Akaike criterion 2054.262
Schwarz criterion 2064.088 Hannan-Quinn 2057.758
rho 0.479220 Durbin-Watson 0.893879
White's test for heteroskedasticity:
Null hypothesis: heteroskedasticity not present
Test statistic: LM = 25.314
with p-value = P(Chi-square(20) > 25.314) = 0.18968

389 David Joel Skandera: Connecting 9/11 to the Financial Crisis
Figure 31. Model 6: OLS, using observations 2001:3-2010:4 (T = 38) Dependent variable: Financial_Crisis.
coefficient std. error t-ratio p-value
const −2.86066 0.838237 −3.413 0.0017 ***
War_on_Terror_Co~ −4.81263e-12 1.94306e-12 −2.477 0.0186 **
US_Defense_Spend~ 5.00557e-12 1.97639e-12 2.533 0.0163 **
US_Government_De~ −2.71719e-13 0.00000 −2.857 0.0074 ***
US_Money_Supply 8.39642e-13 3.20916e-13 2.616 0.0133 **
Mean dependent var 0.210526 S.D. dependent var 0.413155
Sum squared resid 2.629639 S.E. of regression 0.282287
R-squared 0.583640 Adjusted R-squared 0.533173
F(4, 33) 11.56460 P-value(F) 5.59e-06
Log-likelihood −3.175614 Akaike criterion 16.35123
Schwarz criterion 24.53916 Hannan-Quinn 19.26443
rho 0.398879 Durbin-Watson 1.183206
White's test for heteroskedasticity:
Null hypothesis: heteroskedasticity not present
Test statistic: LM = 27.5792
with p-value = P(Chi-square(14) > 27.5792) = 0.0161718
Figure 32. US Current and capital account balances (balance of payments) between 1980 and 2010 in billions of US dollars. Notice how the capital account
balance decreased immensely over a very short period of time between 2006 and 2009. Also, notice how the current account balance increased just as quickly
over the same period of time.
References
[1] Amadeo, Kimberly. “How the 9/11 Attacks Still Affect the Economy Today”. US Economy. 4 April 2014. Web. 9 November 2014.
[2] Bianco, Katalina M. “The Subprime Lending Crisis: Causes and Effects of the Mortgage Meltdown”. CCH Mortgage Compliance Guide and Bank Digest. CCH, 2008. Web. 4 December 2014.
[3] Bilmes, Linda J. “The Economic Fallout from 9/11”. Power & Policy. Harvard University, 5 September 2011. Web. 9 November 2014.
[4] Bloom, Nick. “The Economic Impact of 9/11”. Stanford Institute for Economic Policy Research. Stanford University, February 2007. Web. 9 November 2014.
[5] Borio, Claudio, and Piti Disyatat. “Global Imbalances and the Financial Crisis”. Monetary and Economic Department - BIS Working Papers. Basel, Switzerland: Bank of International Settlements, May 2011. Web. 9 November 2014.
[6] Borio, Claudio, and Haibin Zhu. “Capital Regulation, Risk-Taking, and Monetary Policy: A Missing Link in the Transmission Mechanism?”. Journal of Financial Stability. 24 December 2011. Web. 4 December 2014.
[7] Burger, Andrew. “Four Huge Ways 9/11 Impacted the American Economy”. Go Baking Rates: Finance. 10 September 2013. Web. 9 November 2014.
[8] Challe, Edouard. “Leverage, Excessive Risk-Taking, and Financial Instability”. L’actualite de la Recherche en Finance. 31 January 2012. Web. 4 December 2014.
[9] Comiskey, Michael, and Pawan Madhogarhia. “Unraveling the Financial Crisis of 2008”. Journal of Political Science and Politics. American Political Science Association, Vol. 42 No. 2. April 2009. Web. 9 November 2014.

International Journal of Economics, Finance and Management Sciences 2015; 3(4): 367-390 390
[10] Corsetti, Giancarlo. “The Debt Burden and its Consequences for Monetary Policy: Proceedings of a Conference held by the International Economic Association at the Deutsche Bundesbank”. Journal of Economic Literature: Vol. 37.4, p. 271-275. 1 November 1999. Updated: 11 December 2013. Web. 9 November 2014.
[11] Eichenbaum, Martin, and Jonas Fisher. “Fiscal Policy in the Aftermath of 9/11”. NBER Working Paper Series. National Bureau of Economic Research, April 2004. Web. 9 November 2014.
[12] Elliot, Larry. “IMF Warns Period of Ultra-Low Interest Rates Poses Fresh Financial Crisis Threat”. International Monetary Fund. The Guardian, Washington: 8 October 2014. Web. 2 December 2014.
[13] Engen, Eric M., and R. Glenn Hubbard. ed. Mark Gertler and Kenneth Rogoff. “Federal Government Debt and Interest Rates”. National Bureau of Economic Research: Macroeconomic Annual 2004. Volume 19 (April 2005): pg. 83-160. Web. 9 Nov 2014.
[14] Fernandez, Adriana Z, and Evan F. Koenig, and Alex Nikolsko- Rzhevskyy. “The Relative Performance of Alternative Taylor Rule Specifications”. Staff Papers. Federal Reserve Bank of Dallas, June 2008. Print.
[15] Hamilton, James D. “Measuring the Liquidity Effect”. The American Economic Review. American Economic Association, Volume 87, Number 1 (March 1997): pg. 80-97. Web. 2 December 2014
[16] Inside the Meltdown. dir. Michael Kirk. perf. Ben Bernanke, Will Lyman, and Peter Haydu. Frontline, 2009. Documentary Film.
[17] Jickling, Mark. “Causes of the Financial Crisis”. Congressional Research Service. Cornell University ILR School: Federal Publications, 29 January 2009. Web. 9 November 2014.
[18] Kuttner, Kenneth N. “Low Interest Rates and Housing Bubbles: Still No Smoking Gun”. International Banking Conference. Federal Reserve Bank of Chicago, 1 January 2012. Web. 1 December 2014.
[19] Levy, Pema. “Did 9/11 Cause the Financial Crisis?”. The American Prospect. 10 September 2011. Web. 9 November 2014.
[20] Makinen, Gail. “The Economic Effects of 9/11: A Retrospective Assessment”. Congressional Research Service. The Library of Congress, 27 September 2002. Web. 9 November 2014.
[21] Mehran, Hamid, and Alan Morrison, and Joel Shapiro. “Corporate Governance and Banks: What Have We Learned from the Financial Crisis?”. Federal Reserve Bank of New York Staff Reports. Federal Reserve Bank of New York, June 2011. Web. 4 December 2014.
[22] Neely, Christopher J. “The Federal Reserve Responds to Crises: September 11th Was Not the First”. Federal Reserve Bank of St. Louis Review. Federal Reserve Bank of St. Louis: p. 27- 42, March/April 2004. Web. 9 November 2014.
[23] Nelson, Charles R. “Monetary Policy”. Macroeconomics: An Introduction. 22 January 2010. Print. Obstfeld, Maurice, and Kenneth Rogoff. “Global Imbalances and the Financial Crisis: Products of Common Cause”. University of California-Berkley, Harvard University. November 2009. Web. 9 November 2014.
[24] Reinhart, Carmen M, and Takeshi Tashiro. “Crowding Out Redefined: The Role of ReserveAccumulation”. Working Paper for Asia Economic Policy Conference at the Federal Reserve Bank of San Francisco. National Bureau of Economic Research, November 2013. Web. 3 December 2014.
[25] Roberts, Bryan W. “The Macroeconomic Impacts of the 9/11 Attack: Evidence from Real-Time Forecasting”. Office of Immigration Statistics. Department of Homeland Security, August 2009. Web. 9 November 2014.
[26] Santomero, Anthony M. “Monetary Policy in the Post-9/11 Environment: Stability through Change”. Federal Reserve Bank of Philadelphia. Global Interdependence Center, Philadelphia, PA. International Monetary and Trade Conference, 2 October 2003. Speech. 9 November 2014.
[27] Stiglitz, Joseph. “Martin Wolf’s ‘The Shifts and the Shocks’”. Book Review. Financial Times, 29 August 2014. Web. 4 December 2014.
[28] Taylor, John B. Getting Off Track: How Government Actions and Interventions Caused, Prolonged, and Worsened the Financial Crisis. Stanford: Hoover Institution Press, Stanford University, 2009. Print.
[29] Timberlake, Richard H. “Federal Reserve System”. The Concise Encyclopedia of Economics. 2nd edition. Library of Economics and Liberty, 2008. Web. 2 December 2014.
[30] Warner, Jeremy. “9/11: How Osama Bin Laden Caused Our Banking Meltdown and Financial Crisis”. The Telegraph. 8 September 2011. Web. 9 November 2014.
[31] Yardeni, Ed, and Marc Faber, and Mark Zandi, and Axel Merk, and Donald Coxe, and David Rosenberg, and Rob Arnott. ed. Jonathan Burton. “How 9/11 Still Affects Stock, Bond Investors”. Market Watch. 9 September 2011. Web. 9 November 2014.