connecticut’s geospatial newsletter … lands, including the mediterranean region. all maps were,...
TRANSCRIPT

The Capitol Region Council of Governments (CRCOG) re-ceived approval for a Regional Performance Initiative (RPI) grant from the CT Office of Policy and Management in 2008. The RPI grants were designed to take advantage of economies of scale that can be realized by regional coopera-tion and coordination of pro-jects. The capture and proc-essing of aerial imagery fits this model extremely well and
this project provided a large cost savings of up to $1.3 million dollars as com-pared to individual municipalities contracting for the imagery themselves at the time of the flight. The entire Capitol Region, Meriden and the Town of Plainville partici-pated in this project for a total of 30 Municipalities. Several additional com-munities also contracted with the vendor WSP Sells, Inc. at reduced cost due to the size and coordination of the flight. (Continued on page 2).
Geo Highlights Huge GIS Savings pg 1 & 2
The Tourism Map pg 1
CT Libraries and Job Centers Are Mapped pg 2
Newtown GIS pg 3
Geo-Tidbits pg 4
CT Trust for Historic Barns Survey pg 5 & 6
Vernon Saves Money Using GIS this Winter pg 7
Cost Sharing Partnership in 2011 Orthoimagery Project pg 8
CT 2010 NAIP 4Band Ortho-photography pg 9
Happy Birthday U2U pg 10
ESRI Technical Certification pg 11
ArcGIS Online Community Basemap Program pg 12
Connecticut’s Geospatial Newsletter
Winter Edition 2011
Volume 4, Issue 1
CONNECTICUT Geo-Focus
Newsletter Contacts Submit letters, projects, feedback
and articles to: [email protected] or
These articles are published for the education and enjoyment of the GIS community, and
may be edited to fit space available.
The CT Geospatial Council does not endorse or recommend any software programs.
www.ct.gov/gis
Connecticut’s Geospatial Newsletter
Spring Edition 2011
Volume 4, Issue 1
CONNECTICUT Geo-Focus
From the CT GeoDESK
It’s All About Being On The Map! Connecticut had been
erased from a regional tourism groups promotional map of New England when the state couldn't pay the group’s annual fees this January. Thanks to Governor Dannel Malloy, the state has paid $100,000 in dues to Dis-cover New England after direct-ing other funds within existing resources. Gov. Molloy has been a great supporter of state tourism efforts which have been stated in the related articles from CT newspapers.
Regional Performance Initiative Brings Huge Savings to 30 Municipalities By Erik Snowden CRCOG

Connecticut’s Geospatial Newsletter
Spring Edition 2011
Volume 4, Issue 1
Geo-Focus News
This particular aerial survey of color, leaf off, 3 inch pixel resolution orthophotography provides the ability to map a comprehensive set of detailed planimetric data that includes roads, sidewalks, streets, highways, and alleys in-cluding curb lines, edge of paved surfaces or edge of traveled way, utility poles, street signs, highway lane and traffic safety markings, and general feature details as building footprints, decks, pools, reservoirs, tanks, docks, piers, airports, bridges, overpasses, underpasses, railroads, parking lots, driveways, other impervious surfaces, streams, lakes, drainage courses, holding basins, shorelines, other watercourses, vegetation outlines, fence lines, drainage, and other similar con-struction or terrain features. This is ideal for identifying features on the ground surface in developed, open, and even wooded areas because leaves on trees and shrubs that normally obstruct the view from above are largely absent. For example, features such as stone walls, dirt roads, and other structures in wooded areas are usually visible and identifiable. Areas of deciduous verses coniferous trees are apparent. The project was managed by CRCOG, with generous assistance from municipal GIS professionals in the region. In particular, the task of reviewing the quality of the orthophotography produced by the vendor was completed by CRCOG staff and these municipal GIS professionals. Towns included in CRCOG are: Andover, Avon, Bloomfield, Bolton. Canton, East Granby, East Hartford, East Windsor, Ellington, Enfield, Farmington, Glastonbury, Granby, Hartford, Hebron, Manchester, Marlborough, Newing-ton, Rocky Hill, Simsbury, Somers, South Windsor, Suffield, Tolland, Vernon, West Hartford, Wethersfield, Windsor Locks and Windsor. http://www.crcog.org/index.html
(CRCOG Continued from page 1)
Public Libraries and Job Center Offices Mapped By Alan Sylvestre, CTDOL Established in 2000 when the Connecticut General Assembly provided funding for the purchase of licensed in-
formation databases for Connecticut's libraries, schools and colleges, iCONN is part of the Connecticut Education Net-work that provides students, faculty and residents with online access to library and information resources. It is adminis-tered by the Connecticut State Library in conjunction with the Department of Higher Education. Through iCONN, a core level of information including secured access to licensed databases is available to every citizen in Connecticut. http://ct.webjunction.org/workforce-resources/-/articles/content/107480926
In the second half of 2010, the State Library entered a cooperative agreement with the state Department of Labor (CTDOL) and the state Office for Workforce Competitiveness (OWC) to extend the availability of online job search resources to job seekers using Connecticut State Library computers. Using a spreadsheet containing the names and addresses of Connecticut’s 245 public libraries, geocoding software, and the MapInfo® GIS platform, Al Syl-vestre of CTDOL’s Office of Research and Information designed and developed a set of fifteen maps showing the librar-ies’ locations in the state’s fourteen CT Works office regions. You can reach Al by e-mail at [email protected].

Connecticut’s Geospatial Newsletter
Spring Edition 2011
Volume 4, Issue 1
The Newtown Emergency Communications Center (NECC) is a Public Safety Answering Point (PSAP) that answers Police/Fire and EMS 911 calls for service. The Center utilizes Computer Aided Dispatch (CAD) software to track calls for service and within the CAD is a GIS mapping component. With the hard work and dedication of the Newtown Technology & GIS Department our CAD Mapping is the best in the state, better in fact than the E-911 state database mapping system.
Newtown’s GIS mapping allows for the Emergency Telecommunication Dispatcher (ETD) to pinpoint residential and business locations as well as drill down layers to provide emergency responders with hydrant locations – precise turn by turn directions to homes or busi-nesses and boundary information. Dispatchers can also view actual photos of property for bet-ter visual information. Recently GIS was utilized to determine calls for service within a par-ticular area, so the ability of utilizing the GIS to track trends in criminal activity and deploy re-sources has become a valuable asset. For many months, staff had been requesting a map that had specific information on it that could be printed out and put on the wall in the Center. Working with Scott Sharlow (IT and GIS Director) – and Steven Birney (our GIS technician) they queried staff as to their needs and began doing what they do best – plotting and planning! Within a few short weeks a map was presented to me that had all town owned buildings (Library – Municipal Center – Senior Center) –schools – all five fire companies, the ambulance garage as well as police sectors and fire districts. The map also includes trails and all fire hydrants – walking trails and waterways as well as bordering towns and town lines. Three separate “mini maps” are included within the map and depict three areas of the commu-nity that have high profile specific location information. Staff can visually see the town and specific districts as well as pinpoint streets by utiliz-ing the index – all streets are clearly marked and easily located using the grids. A colored leg-end depicts plotted information and again is easily viewed, read and understood. After all the planning and changes were complete the hard part was begun – how to print the map for dis-play. Using plain paper was not an option, and mapping paper is costly. Our vision was to
have the map laminated so that it could be written on if needed and then simply wipe off with dry erase. The NECC now has a 68” x 40” colored vinyl map proudly displayed in the Center. Once people saw what was ac-complished for us, the calls to Steven flooded his office for this map with “tweaks” making is specific for other agencies. The Assessors / Tax Collectors office wall now has a map displayed on the wall as you enter their office – Land Use and the Fire Marshal’s office also have new maps. When I first came here to the NECC I did not have a lot of experience with GIS, in fact I wasn’t even sure what it was, now I can’t imagine being without it. No PSAP should be without mapping and the advantages that it not only gives your Telecommunicators but the valuable information that it provides to your first responders. To be able to tell fire companies where the closest hydrant is for water deployment saves time and LIVES. To be able to give turn by turn directions to EMS as they traverse back roads to medical calls and allow law enforcement the ability to plan and plot deployment of resources is a tool NO ONE should be without. I cannot imagine doing my job without the advancement of the GIS and IT resources and the cost savings it brings to the town.
GIS Helps Pinpoint Locations, Saves Time and Lives by Maureen Will – Director of Emergency Communications, Newtown, CT
Newtown Connecticut Municipal GIS
To be able to give turn by
turn directions to EMS as
they traverse back roads to medical calls and allow law enforcement the ability to plan and plot deployment of resources is a tool NO ONE
should be without.

Connecticut’s Geospatial Newsletter
Spring Edition 2011
Volume 4, Issue 1
Geo-Tidbits SAVE THE DATE
COFFEE, DONUTS AND GEOGRAPHIC INFORMATION SYSTEMS
The Connecticut User to User Geo-graphic Information Systems Network is hold-ing a half-day presentation on the basics of GIS with presentations from Connecticut GIS professionals on applications, data, hardware, software and people. There will be breakout sessions with hands-on demonstrations in five application areas: Environment, Urban and Regional Planning, Municipal Information Technol-ogy, K-12 Education and Non-Profits. Who Should Attend: Members, staff and boards of environmental organizations, plan-ning and zoning commissions, ZBA, non-profit organizations; municipal IT managers who oversee GIS operations, K-12 teachers. This is for beginners and people who would like to know something about GIS. Where: Central Connecticut State University When: Saturday April 2, 2011 8:30-12:30. Registration will be limited to the first 100 to apply and it is free. You can register at http://gis1.students.ccsu.edu/U2U/CoffeeDonutsAndGIS/ For more information contact Dr. John Harmon (CCSU Geography Emeritus) - [email protected]<mailto:[email protected]
Geography and Religion
A Bit of Geo-History Early Maps
During the Medieval period, European maps
were dominated by religious views. The T-O map (or O-T orbis terrar-ium) was common. In this
map format, Jerusalem was depicted at the center
and east was oriented toward the map top.
Viking explorations in the North Atlantic gradually
were incorporated into the world view beginning in the 12th century. Mean-
while, cartography devel-oped along more practical
and realistic lines in Arabic lands, including
the Mediterranean region. All maps were, of course, drawn and illuminated by
hand, which made the distribution of maps extremely limited.
In ancient and modern times alike, theology and ge-
ography have often been closely related studies
because they meet at crucial points of human curiosity. If we seek after the nature of God, we must consider the
nature of man and the earth, and if we look at the earth, questions of divine purpose in it’s creation and of the
role of mankind on it inevitably
arise. Clarence Glacken, Berkely 1909-1989 .
CT State Emergency Operations Center (EOC) was activated by the Governor more than once due to snowmelt and heavy rains causing widespread flooding around the state. The GeoLab team developed new flood maps by town for the EOC. Thanks to John Gustafson and Pete Sandgren (DEMHS), Scott Roberts (Town of S. Windsor), Becky Cutler (DPW), Beth Stewart-Kelly (Military), Mike Varney and Bernard Asimonye (DOIT) for your participation.
Up until the 18th century, maps were often decorated with fanciful beasts and monsters, at the expense of accurate details about places. French mapmakers of the 1700s and 1800s en-couraged the use of more scientific methods in
the art they called "cartographie." The French word "cartographie" (the sci-ence of making maps), from which we get our English word “cartography,” was created from "carte," meaning “map,” and "-graphie," meaning “representation by.” Around the same time we adopted “cartography” in the mid-19th century, we also created our word for a mapmaker, “cartographer.”

Connecticut’s Geospatial Newsletter
Spring Edition 2011
Volume 4, Issue 1
Connecticut Trust for Historic Preservation’s Barn Survey
A Google Maps Application By Dr. John Harmon, Professor Emeritus, CCSU Geography
Many people think that GIS requires expensive software and a long learning curve but there are a lot of tools and applications that can put basic GIS display and query functionality on the world wide web quickly and inexpensively. It can be done entirely using free software. The tradeoff is with time but having retired I have lots of that. In 2004, the Connecticut Trust for Historic Preservation received a grant from the Connecticut Commission on Culture and Tourism to conduct a baseline, windshield survey of the historic (and current) barns in the state. They have trained probably hundreds of volunteers. The volunteers also do the data entry, putting the information from the forms into a web form and uploading the pictures. After checking by Trust staff this information is added to their database and a web interface allows access. Volunteers go out into the field with digital cameras and data forms on clipboards to record information about this vanishing cultural resource. They have surveyed close to 5,000 barns and expect between 7 and 8 thousand by June 2011 when the project comes to an end. I approached them about building a web-based map interface for their database. Originally I intended to do it using some fancy and expensive software we have access to here at CCSU but after speaking with them I realized that they would be happy with something much simpler and, actually, more intuitive to use. So, I offered to pro-vide a Google Map web interface for their barn data. The Google corporation provides free Application Programming Interface (API) keys to developers who want to use Google Maps as a base for their applications. By using Java scripting inside the html page you can place your own information on top of the Google Map interface, use the navigation tools they provide and even al-low for switching between a map base, air photo and hybrid image. Entry to the website is through a map. Using a freeware program called GeoHtml you can draw invisible polygons over a graphic image, in this case, a map of the towns in the state. This tool creates a <map> element in the html and inside the <map> element are child <area> elements that contain the screen coordinates for the town
outline and a URL to be accessed when you click in-side the town. So you just use your mouse and click on the appropriate town to take you to that town’s URL. The markers are the geocoded locations of the barns that have been surveyed and there is a scrolling sidebar on the right containing a list of the town’s surveyed barns sorted alphanumerically by address. Map and tools are pulled from a Google server, centered where you said they should be and zoomed to the level you set. The basic html page with a scrolling sidebar (some towns have lots of barns) and the CT Trust image is loaded into your browser. The Java script reads through a text file that contains all the information about each barn including its lati-tude and longitude. It places a marker at the right lo-cation and loads the side bar with the barns’ locations sorted alphanumerically by address. This information comes from the local server here at CCSU. Finally it draws the outline of the town in blue using coordi-
nates stored in an XML file in the folder. Clicking either on the marker representing a barn or on the barn’s address in the side bar pops up an information window. (Continued on page 6).

Connecticut’s Geospatial Newsletter
Spring Edition 2011
Volume 4, Issue 1
Connecticut Trust for Historic
Preservation’s Barn Survey
The image of the barn is being served by the CT Trust’s server in New Haven and placed on the popup. You access the information page by clicking on Information. See the photo below. So this website is simply a map interface that allows you access to the same information that their existing website does but by doing it geographically, the barns are put in a context – other barns, the landscape and the road network. Often that is the principle function a GIS provides – geographic context for tabular data. So for maintenance we do this: A text file data dump of the database Geocoding the barn addresses (determining latitude and longitude) Output is an Excel spreadsheet Python script reads through the spreadsheet and produces for each town: •A new text file containing all the barns that were located during geocoding – around 80%) •A new html file containing the Java script and html needed for displaying the map •A new html file containing information about the barns that could not be lo-cated to be placed on the map. The entire set of 3*169 = 507 new files is written out with each update, re-placing the old files. The XML containing the coordinates of the town’s boundary does not change. You must have your own Google Maps API key.
Access data page for the barn from the CT Trust’s server. Image served from CT Trust’s server.
(Continued from page 5)
If You Want To Do This Yourself: • You need a computer that is web-enabled, i.e. that other computers on the
web can see and get data from. • You need to get your own Google Map API key – will work for that folder
and all sub-folders • http://code.google.com/apis/maps/signup.html • Get the basic Java and Html code from this Google Maps tutorial site
http://econym.org.uk/gmap/ • Storing data in a text file is a LOT EASIER than storing and accessing
through XML data.
MAGIC now offering TIFF images!
The University of Connecticut Library’s Map and Geographic Information Center (MAGIC), has recently updated our historical aerial photography indexes to en-able users to download a TIFF image of each aerial photo. Based upon feedback from our users, MAGIC is in the process of ena-bling users’ direct access to full-quality TIFF images of aerial pho-tography and maps. Currently us-ers can access TIFF images for 1951-1952, 1957, 1970, 1985-1986, 1990, and 1995 directly from the MAGIC Connecticut GIS Data page (http://magic.lib.uconn.edu/connecticut_data.html#indexes) via shapefiles, KML , .csv files, and an interactive map preview. The ability to provide TIFF downloads was made possible thanks to the efforts of the Uni-versity of Connecticut Library’s Information Technology Services staff, Joshua Strunk (UConn Ge-ography student) for updating the shapefiles, and to all our student staff that digitized these aerial photos.

Connecticut’s Geospatial Newsletter
Spring Edition 2011
Volume 4, Issue 1
Winter 2011 - Cost savings using GIS for emergency roof top snow removal!
The town of Vernon used the 2009 CRCOG ortho images to map out the roofs of schools and large public build-ings. The maps were used to determine the total square footage of the building roofs so the engineer could calculate how much snow was on the roofs and make a determination as to if the buildings were over structural capacity. We cannot show a dollar amount as to how much money we saved, but the maps allowed the engineers to make a quick spur of the moment decision as to the safety of the buildings and if there was an immediate need to close the building and remove the snow. The engineer did determine the building roofs should be cleared immediately and created a priority list as to which buildings were in immediate danger. One of the attached maps shows the aerial view of Rockville High School, the other has a CAD drawing overlaid onto the aerial image. This map with the CAD drawing broke out the roof into sections so snow removal crews were not concentrated in one area. The increased resolution of the images allowed crews to see features that were on the roofs that were potentially covered by the snow (ex. Air conditioner, vent, hatch-way).
Rockville High School with CAD drawing overlay and the 2009 orthophotography showing critical objects like air conditioners, heating & kitchen vents, chiller units, roof drains, hatchways and exhaust fans. Using Aerial Photography To Help Expose Fire Hydrant Locations In Storms Vernon also used the 2009 CRCOG ortho images to locate fire hydrants in critical areas. Previous snow fall
accumulations have never completely buried hydrants. The Vernon GIS did not have hydrants mapped out and the in-creased resolution of the aerial image allowed the GIS department to quickly and accurately map out close to 80% of the hydrants. This allowed for maps to be created emphasizing critical areas in Rockville where cleanup crews could con-centrate on locating and removing snow to expose the hydrant. Again we cannot attach a dollar amount as a savings, but it allowed the decision makers in Vernon clear accurate information to aid in an emergency situation.
The Town of Vernon GIS By Aaron Nash, Town of Vernon, GIS Department

DVDs Available for Loan from the CGA
The Alliance has copies of two DVDs produced by the Arizona
Geographic Alliance: “Integrating Geography with
Reading and Writing” and “Integrating Geography with
Mathematics.” In addition, we also have a copy of a DVD about the Peters Map Projection. If you are interested in borrowing one of these DVDs, please email CGA
Co-coordinator William De-Grazia at [email protected] and we will ship them to you as
soon as possible.
Connecticut State Data Center Joins MAGIC The Map and Geo-graphic Information Center (MAGIC) is now home to the Connecticut State Data Center, the U.S. Census Bureau’s public data contact for Connecticut-related cen-sus data. In October 2010, MAGIC formed a partnership with the UConn College of Liberal Arts and Sciences, the UConn Department of Geography, Center for Population Research, and the Connecticut Office of Policy and Management to move the Connecticut State Data Center to MAGIC. The Connecticut State Data Center assists state agencies, businesses, governments, researchers, and the pub-lic with locating, accessing, and using U.S. Census data. To further enhance the Connecticut State Data Center’s data offerings, the entire website (http://ctsdc.uconn.edu) is being updated to include additional datasets to U.S. Census data for Connecticut in mapping, as well as numeric, friendly formats. Thanks to the efforts of Jeffrey Dunn, Jie Lin, and Will Carnes (UConn Geography students), Connecticut Census data is being processed to en-able users to join data to shapefiles and once complete, these shapefiles will be available from the Connecticut State Data Center and MAGIC websites.
Connecticut’s Geospatial Newsletter
Spring Edition 2011
Volume 4, Issue 1
Connecticut 2011 Orthoimagery Project
State of Connecticut Enters Into Cost-Sharing Partnership
with Federal Government for 2011 Orthoimagery Flight
By Dan Czaja, Department of Public Safety
The State of Connecticut, through its Departments of Transportation (DOT) and Public Safety (DPS), have part-nered with the National Geospatial Intelligence Agency (NGA) and the United Stated Geological Survey (USGS) under the USGS Urbanized Area Flight Program to procure a statewide high-resolution orthoimagery that is detailed enough to support regional, state, and national purposes. This project, known as the Connecticut (CT) 2011 Orthoimagery Project, is planned to be flown in the spring 2011(leaf-off) and will cover all of Connecticut (approximately 5,266 square miles). The orthoimagery will be one foot resolution and consist of 4-bands, containing true color and near infrared. The project will be jointly funded by DOT, DPS, and NGA with USGS managing the orthoimagery procurement and quality assurance. This orthoimagery will be available publicly, without license restrictions, and will greatly benefit all levels of government, including U.S. Depart-ment of Interior science programs and USGS geospatial program goals for The National Map, for the National Spatial Data Infrastructure (NSDI) and the State Spatial Data Infrastructure (SSDI). This project supports the various missions of the State of Connecticut, like transportation, public safety/9-1-1, and homeland security/emergency management, who require regularly updated aerial imagery to meet government opera-tional needs. The partnership significantly reduces state government spending by eliminating procurement and contract mobilization costs, contract management costs, including quality assurance, and minimizing impacts on related adminis-trative resources. Given these benefits, the Connecticut Geospatial Information Systems Council (CGISC) in cooperation with DOT and DPS is further investigating how this effort might potentially be used the future standard and basis for Con-necticut’s Orthoimagery Program. Any questions can be directed to either Jim Spencer ([email protected]) at DOT or Dan Czaja ([email protected]) at DPS.

Connecticut’s Geospatial Newsletter
Spring Edition 2011
Volume 4, Issue 1
Geo-Focus News
Connecticut 2010 4Band NAIP Orthophotography Connecticut 2010 NAIP orthophotography is a statewide aerial survey of 2010 natural color and color infrared im-agery for Connecticut from the National Agriculture Imagery Program (NAIP). NAIP acquires digital ortho imagery during the agricultural growing seasons in the continental United States. A primary goal of the NAIP program is to enable availability of ortho imagery within one year of acquisition. NAIP is administered by the USDA's Farm Ser-vice Agency (FSA) through the Aerial Photography Field Office in Salt Lake City. This information is used as a base layer for GIS programs in FSA's County Service Centers and is also available online from the CT ECO website at www.cteco.uconn.edu. The USDA Tolland State Office of the NRCS provided the 2010 NAIP imagery raster data files to the State of Connecticut for inclusion in CT ECO. State NAIP projects that resulted in collecting this infor-mation for Connecticut are contracted by the FSA each year based on available funding. NAIP imagery for Connecti-cut is available on CT ECO for 2006, 2008, and 2010. The 2010 NAIP digital ortho imagery includes 4 color bands, allowing for the display and analysis in natural color or color infrared, as shown in the nearby example. The imagery was taken last summer during peak growing season and is generally referred to as “leaf on” orthophotography due to the presence of leaves on the deciduous trees and shrubs. This leaf-on imagery is captured during the peak growing season and is used as a base layer for GIS programs in FSA's County Service Centers. The ground resolution for this imagery is 3.39 feet (1 meter) per image pixel. The natural color imagery serves a variety of purposes, from functioning as a cartographic base to supporting identi-fication and mapping of habitat areas through photo interpretation. The color infrared imagery is particularly useful when discerning features such as vegetation that give off a distinct signature in the infrared spectrum. With color in-frared imagery, intense bright red typically represents vigorously growing, dense vegetation that is producing a large amount of chlorophyll. Lighter tones of red, magenta, pinks generally represent vegetation that does not contain as much chlorophyll such as mature stands of evergreens. Agricul-tural fields nearing the end of the growing season, and dead or unhealthy plants often appear in less intense reds, green, or tan.
Color Natural
Where to get them Color - http://cteco.uconn.edu/guides/Ortho_2010_Color_NAIP.htm
Color Infrared - http://cteco.uconn.edu/guides/Ortho_2010_Infrared_NAIP.htm Color and Color Infrared - http://cteco.uconn.edu/guides/Orthos_2010_4Band_NAIP.htm
How do I connect to the CT ECO map services in ArcMap?
Geo-Focus News
Connecticut’s Geospatial Newsletter
Spring Edition 2011
Volume 4, Issue 1
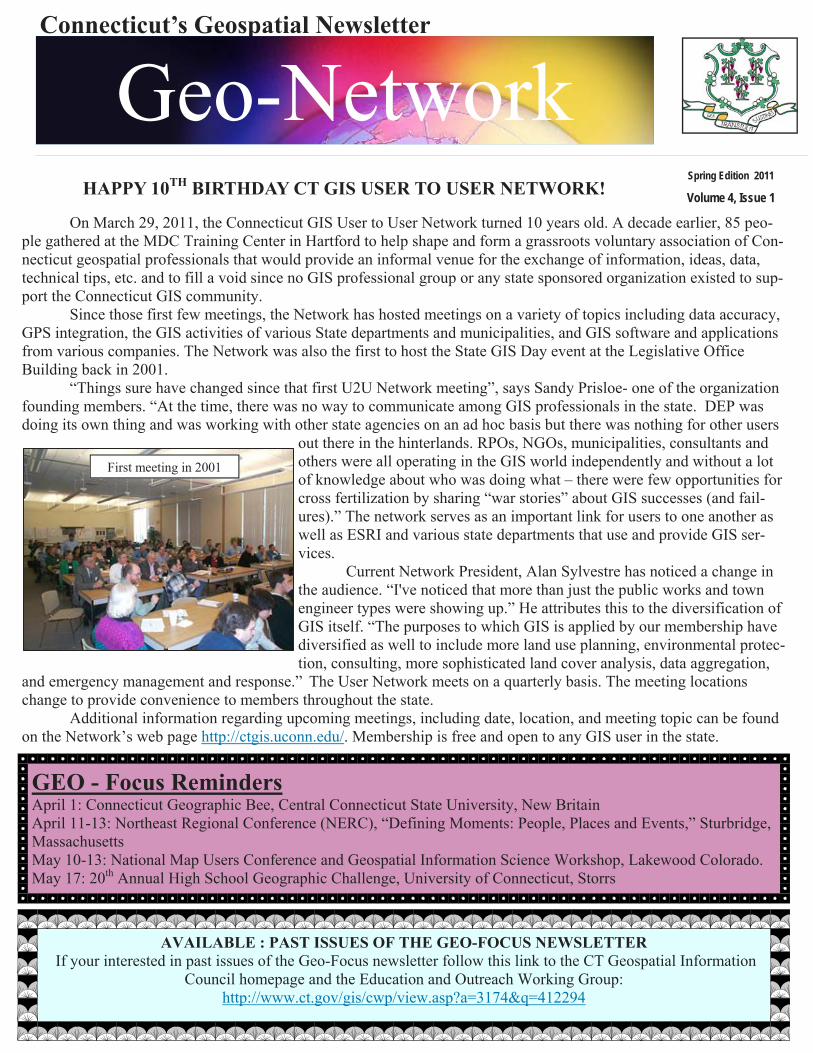
Geo-Network On March 29, 2011, the Connecticut GIS User to User Network turned 10 years old. A decade earlier, 85 peo-ple gathered at the MDC Training Center in Hartford to help shape and form a grassroots voluntary association of Con-necticut geospatial professionals that would provide an informal venue for the exchange of information, ideas, data, technical tips, etc. and to fill a void since no GIS professional group or any state sponsored organization existed to sup-port the Connecticut GIS community. Since those first few meetings, the Network has hosted meetings on a variety of topics including data accuracy, GPS integration, the GIS activities of various State departments and municipalities, and GIS software and applications from various companies. The Network was also the first to host the State GIS Day event at the Legislative Office Building back in 2001. “Things sure have changed since that first U2U Network meeting”, says Sandy Prisloe- one of the organization founding members. “At the time, there was no way to communicate among GIS professionals in the state. DEP was doing its own thing and was working with other state agencies on an ad hoc basis but there was nothing for other users
out there in the hinterlands. RPOs, NGOs, municipalities, consultants and others were all operating in the GIS world independently and without a lot of knowledge about who was doing what – there were few opportunities for cross fertilization by sharing “war stories” about GIS successes (and fail-ures).” The network serves as an important link for users to one another as well as ESRI and various state departments that use and provide GIS ser-vices. Current Network President, Alan Sylvestre has noticed a change in the audience. “I've noticed that more than just the public works and town engineer types were showing up.” He attributes this to the diversification of GIS itself. “The purposes to which GIS is applied by our membership have diversified as well to include more land use planning, environmental protec-tion, consulting, more sophisticated land cover analysis, data aggregation,
and emergency management and response.” The User Network meets on a quarterly basis. The meeting locations change to provide convenience to members throughout the state. Additional information regarding upcoming meetings, including date, location, and meeting topic can be found on the Network’s web page http://ctgis.uconn.edu/. Membership is free and open to any GIS user in the state.
HAPPY 10TH BIRTHDAY CT GIS USER TO USER NETWORK!
GEO - Focus Reminders April 1: Connecticut Geographic Bee, Central Connecticut State University, New Britain April 11-13: Northeast Regional Conference (NERC), “Defining Moments: People, Places and Events,” Sturbridge, Massachusetts May 10-13: National Map Users Conference and Geospatial Information Science Workshop, Lakewood Colorado. May 17: 20th Annual High School Geographic Challenge, University of Connecticut, Storrs
AVAILABLE : PAST ISSUES OF THE GEO-FOCUS NEWSLETTER If your interested in past issues of the Geo-Focus newsletter follow this link to the CT Geospatial Information
Council homepage and the Education and Outreach Working Group: http://www.ct.gov/gis/cwp/view.asp?a=3174&q=412294
First meeting in 2001

Geo-Focus News
Connecticut’s Geospatial Newsletter
Spring Edition 2011
Volume 4, Issue 1
Esri Technical Certification Now Available
Last December, Esri introduced the Esri Technical Certification Program.
Users worldwide could register for and take exams beginning January 17, 2011. “Esri set the industry benchmark for GIS technology. Now we’re setting a standard for users that raises the bar for ArcGIS skills,” commented Nick Frunzi, director of Educational Services at Esri. By establishing an industry-recognized standard, the certification program will: • Improve success with GIS by creating a community of professionals proficient in using Esri software. • Help organizations maximize their investment in Esri products by employing a workforce certified in using best
practices. • Create professional development opportunities. • Provide opportunity for individuals, business
partners, consultants, and other organizations to distinguish themselves among their peers.
• Assist hiring organizations in assessing candidate skills and abilities.
The program consists of 13 certifications recognizing expertise in desktop, developer, or enterprise use of ArcGIS. The five certifications available now are ArcGIS Desktop Associate, ArcGIS Desktop Professional, Web Application Developer Associate, Enterprise Geodatabase Management Associate, and Enterprise Administration Associate. The remainder will be available later in 2011 and into 2012. Taking examinations Users achieve certification by successfully completing examinations offered worldwide in over 5,000 testing locations through Pearson VUE, Esri’s global testing partner. The computer-based exams consist of 90-95 multiple choice questions and take approxi-mately 2 hours to complete. The cost is $225. Within five days of taking an exam, candidates are notified via email whether they achieved a passing score. Each exam has a unique scoring standard for passing which is a result of extensive beta testing.
Candidates who don’t achieve a passing score may retake the examination two weeks after the first attempt. If they’re not successful in the second attempt, they must wait 90 days before taking the exam a third time.
The Esri Technical Certification web site lists specific skills that will be assessed in each exam, as well as training courses that aid in the acquiring and improving of these skills.
Find out more Website: www.esri.com/certification Email: [email protected] To Register: www.pearsonvue.com/esri

Geo-Focus News
Connecticut’s Geospatial Newsletter
Spring Edition 2011
Volume 4, Issue 1
Community Base-Map Program Users Collaborate to Build Free,
High-Quality Basemap By ESRI
A new and popular program is helping provide users worldwide with uniform and authoritative source basemaps that contain the level of detail and coverage needed for most GIS Web mapping projects. Most organizational GIS departments compile and maintain mapping data for their own jurisdiction, but adding this data to global basemaps that can be used by anyone creates many challenges that cannot be easily overcome by individual organizations. Through Esri's Community Maps Program, ArcGIS user organizations and other geographic data providers world-wide now have a way to contribute their authoritative, up-to-date geo-graphic data to a community map that is broadly available. Hundreds of organizations around the world are providing their authoritative and up-to-date content for integration into online community maps, such as World Topographic Map, World Street Map, and World Imagery. These popular maps are hosted and maintained by Esri and can be used with Esri software (desktop, Web, mobile), as well as standard Internet browsers using Esri's free and open Web mapping APIs. The intent of these community maps is to provide the best available data from multiple governmental and commercial data providers to the GIS user community and to continue to enhance these maps. What type of data is needed? Detailed basemap data for cities or regions at 1:5,000 scale, for example, vegetation layers, building footprints, or parcel data; basemap data for counties or regions at 1:50,000 scale; detailed street map data at 1:50,000 scale or larger; and high-resolution imagery, for example, 1 me-ter or better—collected in the past three years. Any data that is provided through the program is checked to ensure that it improves on the existing data in the community map. And while Esri will request permission to publish the data as part of the community map online, it does not take ownership of the data. Content that has been contributed and ac-cepted is integrated into one of the existing community basemaps and published during the update cycle, typically twice a year. Organizations that are interested in receiving help to prepare their data for online publishing can perform two important steps: author the map, then cache the map. To help with authoring the map, Esri has created a number of downloadable map templates that ensure uniform, high-quality cartography. These templates also include map docu-ments, sample data, and symbol style files. Once the map has been authored, a map cache is generated using the Bing Maps/Google Maps tiling scheme, or ArcGIS Server can be used to create a map cache using the built-in tiling scheme. Alternatively, Esri can create the map cache based on the authored map provided by the organization. The map cache is then blended into the community map and published. Participation is simple. User organizations that are interested in contributing their data to the Community Maps Program just need to fill out a participation form and provide some information about their data, such as coverage area, resolution or scale, and a brief description. Once Esri has received the data, it will review the data to confirm the suitability and notify the user organization. Contributing geographic data through the Community Maps Program benefits user organizations by eliminating costs associated with distributing data and making it widely available. It also decreases the costs associ-ated with setting up and maintaining data. More importantly, it provides a mechanism for user organizations to make their high-quality, authoritative content available globally in an easy-to-access manner. To get more detail about the program visit www.esri.com/communitymaps. Also, to sign up for the newsletter, visit this link: www.esri.com/library/newsletters/community-maps/community-maps.html.
Aerial imagery for the state of Massachusetts was provided by MassGIS and then blended into the World Imagery
base map.