connecticut's geospatial newsletter - ct.gov
TRANSCRIPT

Geo Highlights Hurricane Irene and Emergency Operation Centers pg 1 & 2
Landsat Image Maps Aid Fire Recovery Efforts pg 3
Geo-Tidbits pg 4
How Do Submarines Navigate? pg 5
Municipal ArcGIS Server: Milford CT pg 6
Remote Sensing: Mapping Ancient Roads pg 7
2010 National Geographic BEE Information pg 8
Peepers Foliage Maps pg 9
How Old Is That Globe? pg 10
CT GIS Day at LOB pg 11
Newsletter Contacts
Submit letters, projects, feedback and articles to:
[email protected] or [email protected]
These articles are published for the education
and enjoyment of the GIS community, and may be edited to fit space available.
The CT Geospatial Council does not endorse
or recommend any software programs. www.ct.gov/gis
Connecticut’s Geospatial Newsletter
Fall Edition 2011
Volume 4, Issue 3
CONNECTICUT Geo-Focus From the CT GeoDESK
Prepping the EOC for Irene By Meghan McGaffin and John Hangen, City of Milford On Wednesday August 31st the Milford Management Information Systems department started getting calls asking for maps to prepare the Emergency Operation Center (EOC) for Hurricane Irene. The Milford coastline is heavily developed for residential use and flooding is a common problem. A 2002 New York Times article reports that Milford has over 14 miles of coastline, the longest of any town in the state. The effects of Irene were rightly anticipated to be devastating. The first maps were produced showing Sea, Lake and Overland Surges from Hurricanes (SLOSH) model data provided by the National Hurricane Center. This data was overlaid onto a city street index map and printed 7 feet wide by 7 feet tall. All the 100’ assessor tiles showing the coastline were printed and delivered to the EOC. More street maps were printed and then attention was turned to digital solutions. Continued on page 2.
Good Night Irene by Beth Stewart-Kelly We are still talking about Hurricane Irene and how it devastated the State of Connecticut, not to men-tion our neighbors to the north. I live in West Haven and spent my pre-storm time preparing for the worst. It was the first time we had to board up the south facing windows to protect our property. After-wards, we had no power for five days. I was kept very busy at work in the Geolab at the State Emergency Operations Center (SEOC) and the Joint Operations Center (JOC) for two weeks after the storm. The above map is a snapshot in time showing the tracking of power outages from utilities data, de-rived from multiple sources. The black was 100% no power and in the yellow areas <1% had no power. Also tracked were road closures, military operations and open Red Cross centers. Thematic mapping developed in the state Geolab helped decision makers keep track of open shelters, blocked or flooded roads, agricultural/farmlands along flooded rivers, and later, the progress of the FEMA PDA (Preliminary Damage Assessment) teams.

Connecticut’s Geospatial Newsletter
Fall Edition 2011 Volume 4, Issue 3
MILFORD EOC The EOC was to be staffed by personnel with all different levels of GIS expertise which was the first consideration in creating digital solutions. The second consideration was a possible loss of power. While the EOC has genera-tor power, the server room at the main municipal building does not and the bulk of the GIS data is stored there.
An ArcReader project solved the requirements for being stored locally and easy to use. ArcReader does have some limitations as the interface is not intuitive for those with no GIS experience. The next solu-tion was to create a project us-ing ArcGIS for Server that could be served across our in-ternal network with the advan-tage of having multiple data sources ready as base maps. Our existing ArcGIS for Server base map already included Bing Maps, topography, Bing Aerial and an ESRI air photo and was quickly customized with SLOSH data. The look and feel of our FlexViewer base map has similar controls to standard online mapping sites, lending familiarity to non-GIS personnel. The last product deliv-ered to the EOC was an HTML-based directory to exist-ing maps that would possibly be helpful in an emergency re-sponse situation. This docu-ment linked to engineering, po-lice beat, natural hazards maps, the maps that were printed and delivered to the EOC and to
online mapping sources. All of the digital sources – the ArcReader, FlexViewer site and the directory were given desktop shortcuts on 6 computers in the EOC, making data access consistent for all the staff. After the storm passed the EOC stayed operational during the cleanup and recovery. The maps and data provided to the EOC was found to be useful in deploying officers, targeting neighborhoods for evacuation and planning for what were to become one of the worst natural disasters in the history of Milford.
Continued from page 1
Connecticut’s Geospatial Newsletter
Fall Edition 2011 Volume 4, Issue 3
Landsat Images Aid Fire Recovery Efforts
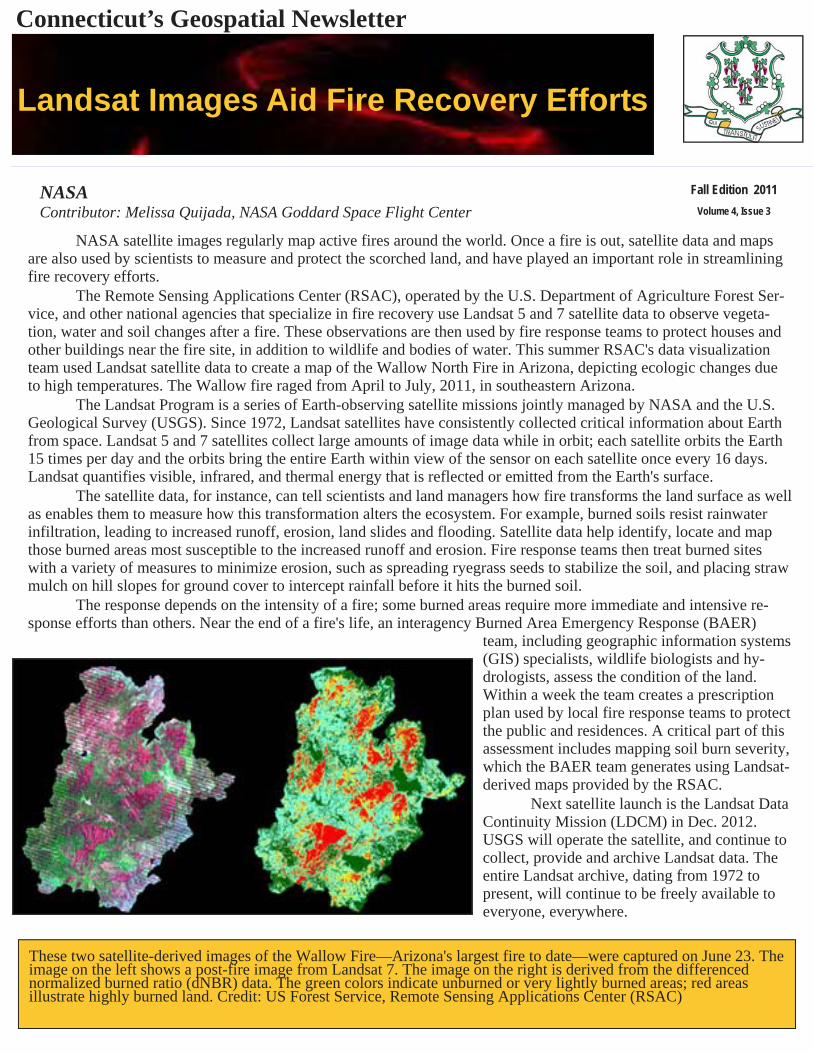
NASA satellite images regularly map active fires around the world. Once a fire is out, satellite data and maps are also used by scientists to measure and protect the scorched land, and have played an important role in streamlining fire recovery efforts. The Remote Sensing Applications Center (RSAC), operated by the U.S. Department of Agriculture Forest Ser-vice, and other national agencies that specialize in fire recovery use Landsat 5 and 7 satellite data to observe vegeta-tion, water and soil changes after a fire. These observations are then used by fire response teams to protect houses and other buildings near the fire site, in addition to wildlife and bodies of water. This summer RSAC's data visualization team used Landsat satellite data to create a map of the Wallow North Fire in Arizona, depicting ecologic changes due to high temperatures. The Wallow fire raged from April to July, 2011, in southeastern Arizona. The Landsat Program is a series of Earth-observing satellite missions jointly managed by NASA and the U.S. Geological Survey (USGS). Since 1972, Landsat satellites have consistently collected critical information about Earth from space. Landsat 5 and 7 satellites collect large amounts of image data while in orbit; each satellite orbits the Earth 15 times per day and the orbits bring the entire Earth within view of the sensor on each satellite once every 16 days. Landsat quantifies visible, infrared, and thermal energy that is reflected or emitted from the Earth's surface. The satellite data, for instance, can tell scientists and land managers how fire transforms the land surface as well as enables them to measure how this transformation alters the ecosystem. For example, burned soils resist rainwater infiltration, leading to increased runoff, erosion, land slides and flooding. Satellite data help identify, locate and map those burned areas most susceptible to the increased runoff and erosion. Fire response teams then treat burned sites with a variety of measures to minimize erosion, such as spreading ryegrass seeds to stabilize the soil, and placing straw mulch on hill slopes for ground cover to intercept rainfall before it hits the burned soil. The response depends on the intensity of a fire; some burned areas require more immediate and intensive re-sponse efforts than others. Near the end of a fire's life, an interagency Burned Area Emergency Response (BAER)
team, including geographic information systems (GIS) specialists, wildlife biologists and hy-drologists, assess the condition of the land. Within a week the team creates a prescription plan used by local fire response teams to protect the public and residences. A critical part of this assessment includes mapping soil burn severity, which the BAER team generates using Landsat-derived maps provided by the RSAC. Next satellite launch is the Landsat Data Continuity Mission (LDCM) in Dec. 2012. USGS will operate the satellite, and continue to collect, provide and archive Landsat data. The entire Landsat archive, dating from 1972 to present, will continue to be freely available to everyone, everywhere.
NASA Contributor: Melissa Quijada, NASA Goddard Space Flight Center
These two satellite-derived images of the Wallow Fire—Arizona's largest fire to date—were captured on June 23. The image on the left shows a post-fire image from Landsat 7. The image on the right is derived from the differenced normalized burned ratio (dNBR) data. The green colors indicate unburned or very lightly burned areas; red areas illustrate highly burned land. Credit: US Forest Service, Remote Sensing Applications Center (RSAC)

A Landsat Flyby
The Landsat program offers the longest continuous global record
of the Earth's surface; it continues to deliver visually stunning and scientifically valuable images of our planet. This short video high-lights Landsat's many benefits to
society.
Connecticut’s Geospatial Newsletter
Fall Edition 2011
Volume 4, Issue 3
Geo-Tidbits Taxonomy, in a broad sense, the science of classification, but more strictly the classification of living and extinct organisms—i.e., biological classification. The term is derived from the Greek taxis (“arrangement”) and nomos (“law”). Taxonomy is, there-fore, the methodology and principles of systematic botany and zoology and sets up arrangements of the kinds of plants and ani-mals in hierarchies of superior and subordinate groups.
Calling all map makers:
Participate in Connecticut’s
GIS Day Event November 17,
2011. Maps, and lots of them,
are needed to fill the Map Gal-
lery at the Legislative Office
Building in Hartford. Come vote
for your favorite map
November 17! For more info contact : [email protected] [email protected] [email protected]
“A number of astronauts, and then all of us who saw the photography from space,
marveled at how much the Florida peninsula,
meandering Mississippi, the islands of Britain, and the
boot of Italy resembled the maps everyone had
grown up with. We had taken it for granted
that maps were faithful reflections of reality; but we were somehow amazed when
reality turned out to be true to the maps.”
John Noble Wilford,
The Mapmakers
Corn Mazes Are Maps by Dr. Joseph J. Kerski, USGS
Corn mazes are paths cut or plowed in a field of corn (maize) so that the paths form a pattern when viewed from overhead. The patterns can be famous people, maps, flags, drawings, themes, or an infinite number of others. Unlike tracing through a maze on paper, the human becomes the "tracer" through the maze. Because corn mazes are maps (1), mazes and maps have fascinated people for centuries (2), maps are essential tools to study geography (3), corn mazes provide a unique and fun way to learn about geography, including scale, relative and absolute
location, land use, and other geographic themes. Visit the following sites to learn about corn mazes or to locate a maze near you: www.mazeplay.com and http://www.cornfieldmaze.com/

How do submarines navigate?
By the Submarine Warfare Division, U.S. Navy All of the warfighting submarines that the United States Navy currently operates are large and powerful nuclear-powered vessels of two types: attack submarines and fleet ballistic missile submarines called "Boomers." Many of these submarines are longer than a football field. Great Britain, France, China, and Russia operate nuclear-powered submarines. These and many other countries also operate small numbers of diesel or conventionally-powered subma-rines. In all, 43 countries operate over 600 submarines. The country with the largest number of submarines is Russia.
Sonar (SOund NAvigation and Ranging) gives our submarines virtual "eyes" underwater. Sonar is used primarily to detect ships and submarines. There are two types of sonar: active and passive. When using active sonar, a submarine transmits a pulse of sound into the water and listens for how long it takes to bounce off another object such as a ship or submarine and return. This gives information about that ship or submarine's direction and distance away. Unfortu-nately, if a submarine uses active sonar, all the other sonar-capable ships and submarines in the area would know that the submarine is there. Since the primary advantage that submarines enjoy is stealth (other ships don't know where they are), most submarines rarely use active sonar. Passive sonar listens for the
sounds coming from other ships and submarines. When a submarine uses passive sonar, it is able to obtain informa-tion about other ships and submarines without revealing its own position. Like detectives examining a crime scene, skilled sonar operators can determine such things as ship speed, number of propellers and even the exact kind of ship just by listening to the sounds.
Connecticut’s Geospatial Newsletter
Fall Edition 2011
Volume 4, Issue 3
The introduction of Electronic Chart Display and Infor-mation System (ECDIS) helps navigate the ship safely in all weather conditions. Electronic Navigation Chart (ENC), a re-placement of the conventional paper chart, is a tool used for navigation. ENC also provides detailed information about depth, hazards and navigational aids within the area. ENC is supported by visual and audio alarms of ECDIS provide the navigator on bridge sufficient means to navigate the vessel safely. The display is used to provide selective information, ei-ther spatial or textual information, to the navigator for safe pas-sage. ENC is the database for GIS operations and ECDIS is the real time GIS application in the marine environment.

Connecticut’s Geospatial Newsletter
Fall Edition 2011
Volume 4, Issue 3
MUNICIPAL ARCGIS SERVER
Milford, CT (pop. 54,000) underwent a major technological upgrade in 2010-2011. Fiber optic cable was in-stalled to link municipal buildings. This increase in network speed allowed for greater server management and data shar-ing between offices. This was necessary as the City installed a new permitting system, ViewPermit by ViewPoint of New Bedford, MA. ViewPermit was created with the input of Connecticut municipal officials in the Capital Region Council of Governments and has since been adopted by 14 towns in CT. ViewPermit has the ability to access GIS data through ArcGIS for Server and Milford decided to purchase the Standard work-group level with 4 cores. The new server and software was a major leap forward for a city that has always been willing to push ahead with GIS innovations. After taking Introduction to ArcGIS for Server classes from ESRI, the GIS staff in Milford created an intranet GIS site. When creating a site with ArcGIS for Server there are a lot of options. Out of the box, ESRI provides the tools to make a basic map with limited functions. To expand functionality and interface options, it is necessary to choose a platform for customization. Milford found that the simplest way to go forward was to use the free FlexViewer option. FlexViewer is sourced by Adobe and is easy to use, only requiring editing an .xml file. The help files provided by ESRI and the ESRI forums had all the necessary information to learn how to implement and customize the application. Once the basic prem-ise is understood, it is very easy to add many pre-made tools (called widgets) to the map. The resulting interface is attrac-tive, intuitive and easy to use. ArcGIS for Server was installed by ViewPoint consultants and is installed on site rather than hosting in the cloud environment. Some of the permitting functions are hosted in the cloud but the GIS data is local. By installing ArcGIS for Server the City of Milford initiated a massive data reorganization and update. Shapefiles, while, “outdated”, are still commonly used in Milford and are being replaced by an SDE geodatabase structure. The new structure and new server means that all of the existing and useful maps will need to be converted to read sources from the new location. This work will be a long, on-going process as there are over 800 .mxd files and more than a dozen active desktop GIS users.
Milford: ArcGIS Server Project By Meghan McGaffin, City of Milford
Upcoming geospatial training courses offered at CLEAR Geospatial Training Program at UCONN. “Geospatial Technologies at Work: An Introduction to GIS” “Pictures, Points & Places: An Introduction to GPS” Mashup Madness: Using Google Tools to Create Maps on the Web” “Developing Custom Geoprocessing Tools: An Introduction to Python Scripting” “Creating and Using Geospatial Models: Introduction to ModelBuilder” Contact Cary Chadwick at (860) 345-5216 email [email protected] http://clear.uconn.edu/geospatial/training.htm
NEARC Northeast Arc Users Group 2011 conference will be in Saratoga Springs on Sunday, November 13th to Wednesday November 16. The conference will feature keynote session, vendor demonstrations,
poster display and over 60 technical workshops and user presentations. For more information: http://northeastarc.org/

Some of the most prominent remote sensing research has been done in regards to Maya studies in Mesoamerica. The Petén region of northern Guatemala is of particular focus because the Petén is a densely forested region that lacks modern settlements and infrastructure. It is extremely difficult to survey which leaves remote sensing as an ideal solu-tion to this research problem. The use of remote sensing techniques in this region has been a great advantage for archaeologists who have a difficult time penetrating the hilly, karstic, thickly forested landscape. Remote sensing techniques have uncovered a wealth of informa-tion about the region and about the people that inhabited it. The Petén is arguably one of the most difficult of the Maya landscapes in which to subsist. It is questions regarding subsistence patterns and related problems that have driven remote sensing methodology in the hopes of understanding the complex adaptations that the Maya developed. Remote
sensing methods have also proven invaluable when working to discover features, cisterns, and temples. Archaeologists have identified vegetative differentiation associated with such features. With the advent of remote sensing, archaeologists are able to pinpoint and study the features hidden beneath this canopy without ever visiting the jungle. A pioneer in the use of remote sensing in Maya research is NASA archaeologist Tom Sever, who has applied remote sensing to research in Maya site discovery as well as mapping causeways and roads. Sever has stressed the enormous use of remote sensing in uncovering settlement patterns, population den-
sities, societal structure, communication, and transportation. Sever has done much of his research in the Petén region of northern Guatemala, where he and his research team have used satellite imagery and GIS to map undiscovered roads and causeways the ancient Maya built to connect cities and settlements. These landscape artifacts represent the advan-tage of using remote sensing as these causeways are not visible from the ground. By mapping these forms, Sever is able to locate new sites and further uncover ancient Maya methods of communicated and transportation. Sever and his team also use remote sensing methods to gather data on deforestation. The rain forests of the Petén are undergoing massive deforestation, and Sever's remote sensing offers another window into this understanding and halting this problem. Monitoring the rate of deforestation not only has important ecological value, but the use of remote sensing can detect landscape change. By measuring the magnitude of landscape change in terms of vegetative
cover and soil geography, as well as shifting land use patterns and the associ-ated cultural diversity, archaeologists are given a window into depletion rates and trends in anthropogenic landscape alteration. Much attention has been de-voted to the mapping of canals and irrigation systems . Synthetic Aperture Ra-dar (SAR) has proved particularly useful in this research. SAR is a type of radar that is sensitive to linear and geometric features on the ground. It is also impor-tant to include a method called ground truthing, or the process of physically vis-iting (on foot) the localities surveyed to verify the data and help inform the in-terpretation. GPS is often used to aid in this process.
Geophysical methods have also been employed in Maya research. Ground Penetrating Radar (GPR) has been performed on a number of sites, including Chichen Itza. The GPR research has detected buried causeways and structures that might have otherwise gone unnoticed.
Connecticut’s Geospatial Newsletter
Fall Edition 2011
Volume 4, Issue 3
MAPPING ANCIENT ROADS
Photo: Color Infrared Photography showing suspected road.
Maya Researcher Uses Remote Sensing by NASA

Connecticut’s Geospatial Newsletter
Fall Edition 2011
Volume 4, Issue 3
TEACHERS AND PARENTS
Each year
thousands of
schools in the
United States
participate in the
National
Geographic Bee.
Imagine your
child
Winning…..
First place for a
$25,000
scholarship!
Second place
winner receives
$15,000
scholarship!
Third place
winner receives
$10,000
scholarship!
24th ANNUAL
CONNECTICUT GEOGRAPHIC BEE March 30, 2012
WHO: 100 of the brightest young minds in Connecticut today (grades 4-8) WHAT: The 24th Annual Connecticut Geographic Bee, a program of the Na-
tional Geographic Society, sponsored by Google and Plum Creek Timber Company
WHERE: Herbert D. Welte Auditorium on the campus of Central Connecticut
State University- New Britain, Connecticut WHEN: Friday March 30, 2012 Preliminary Rounds 9:45-10:45 A.M. Final Competition 11:15 A.M. WHY: State Champion wins $100, geography books, and a trip to Washing-
ton, DC to compete in the National Geographic Bee, May 22-23, and a chance to win a $25,000 college scholarship HOW: Each state contestant won their school Bee and finished in the top 100 out of over 225 school winners (100+ if there are ties) competing
across Connecticut in a written exam of geographic knowledge Contact: William DeGrazia State Coordinator Connecticut Geographic Bee Home # 203-375-8882 Cell # 203-260-1392 (media please use day of event) [email protected]
Connecticut’s Geospatial Newsletter
Fall Edition 2011
Volume 4, Issue 3
GEEPERS CREEPERS IT’S TIME FOR THE PEEPERS!
YANKEE Fall Foliage Maps
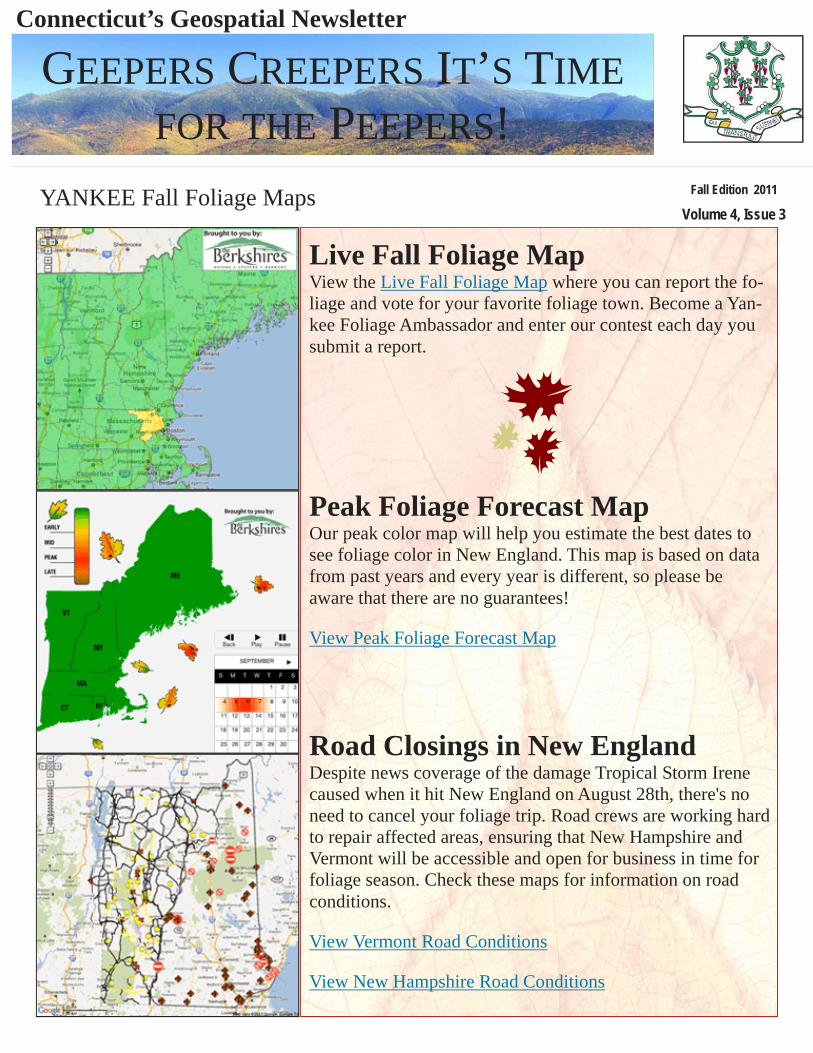
Live Fall Foliage Map View the Live Fall Foliage Map where you can report the fo-liage and vote for your favorite foliage town. Become a Yan-kee Foliage Ambassador and enter our contest each day you submit a report.
Peak Foliage Forecast Map Our peak color map will help you estimate the best dates to see foliage color in New England. This map is based on data from past years and every year is different, so please be aware that there are no guarantees!
View Peak Foliage Forecast Map
Road Closings in New England Despite news coverage of the damage Tropical Storm Irene caused when it hit New England on August 28th, there's no need to cancel your foliage trip. Road crews are working hard to repair affected areas, ensuring that New Hampshire and Vermont will be accessible and open for business in time for foliage season. Check these maps for information on road conditions.
View Vermont Road Conditions
View New Hampshire Road Conditions

Do all world globes look alike? When the world is reduced to twelve inches, the first impression is “yes.” However, recently at a local flea market, an interesting world globe showed up – the base looked reminiscent of the 1933 Chicago World’s
Fair. The style was clearly old, but how old? The maker’s emblem or seal is there but, oddly, there’s no date. Globe makers employed researchers, drafts-men, and artists in their quest for accuracy and vis-ual appeal. But, apparently, these companies felt that a globe with an expiration date, no matter how beau-tiful, would cast doubt on that accuracy. After all, who would buy an obsolete globe or world map? World globes, as they used to be called, were made by various manufacturers: some of the most common brands are Replogle, George F. Cram Co., and Rand McNally. Determining the age of this globe requires some detective work. It would take significant changes to make a globe out of date, and while the geography changes slowly, there have been abrupt changes to the political landscape. All the evidence is right there on that 12-inch ball. Typically the first place to look is Europe, and specifically Germany – if a globe or map
shows East and West Germany, we know it is post WW II. What next? How about political changes in Africa, or the Middle East? This globe shows Persia, with Iran in parentheses, perhaps hedging for an impending change, and a way to stretch the lifespan of this globe. Another clue: where Thailand is now, the word “Siam” stands out. Now, time for some research. Be one of the first people to arrive at the globe’s date within one year for credit in the next Geo-Focus newsletter! (send your response to [email protected])
Connecticut’s Geospatial Newsletter
Fall Edition 2011
Volume 4, Issue 3
CONNECTICUT Geo-Focus How Old Is That Globe? By Peter Sandgren
Above picture is base of Globe.

Historic Map Exhibit and Symposium by Mary Hutchinson, Jamestown, RI There are currently two historic map exhibits and an upcoming map collecting symposium being held in Newport, RI that you might be interested in. One is the “Envisioning the World: The First Printed Maps, 1472-1700” at the Na-val War College Museum and includes the first known printed map of the world (T and 0), the first two-color printed world map, the oldest printed road map (the Peutinger Table), Mercator and Ptolemy maps and so much more. It’s a private collection from California and will be at the museum until December 31st. You’ll need a Visitor Pass to get on the naval base (just call ahead the day before with your name(s) so that they can run a security clearance). Free. The other is at the Redwood Library and Athenaeum, 50 Bellevue Avenue, Newport titled, “A Sense of Place: Exploring Newport and Narragansett Bay Through Historic Maps”. Many of the maps are from the Redwood Library, Newport County Preservation Society or on loan from private collections. That exhibit includes Des Barres charts, Ezra Stiles’ map of Newport, Blaskowitz charts and some very rare maps of Rhode Island. Free (although donations are welcome). On until December 30th. If you want to take in both exhibits on one-day and be part of an organized tour, the Redwood Library and Athenaeum will host a day-long symposium “Collecting Maps: A Redwood Library and Naval War College Museum Cartographic Collaboration” in celebration of the above two current exhibitions. You’ll need to register for this and is restricted to the first 50 people. Fee $20, includes lunch. The date is Sat-urday, October 15. For more information on the Red-wood Library’s map exhibition and sympo-sium http://www.redwoodlibrary.org/events/calendar. For more information on the “Envisioning the World: First Printed Maps, 1472-1700” exhibition at the Naval War College Mu-seum http://www.envisioningtheworld.com/
Newport Naval War College

Visit www.ct.gov/gis for more information