connecticut point in time count 2017: …pointintime.info/simtechsolutions/assets/file/final...
TRANSCRIPT
Page 1 of 9
CONNECTICUT POINT IN TIME COUNT 2017: STATISTICAL MODELS & METHODOLOGIES FOR AN ACCURATE COUNT
The Connecticut Coalition to End Homelessness (CCEH) partnered with Simtech Solutions, a cause-
driven technology services provider, for the design and implementation of the unsheltered count
methodology in support of the annual Point-in-Time Count (CT PIT 2017) for the State of Connecticut
as required by the United States Department of Housing and Urban Development (HUD). Simtech
Solutions staff focused on the development of the technical framework to support the data collection and
analysis and contracted with Dan Treglia, PhD, of the University of Pennsylvania, to provide guidance
and support of the sampling and enumeration strategy used to derive the final count estimates.
This final report highlights the approach, training, tools and analytical methods that were deployed
during the project. It showcases CCEH’s efforts to achieve a highly reliable estimation of homelessness
and reflects the evolution of the project as the approach was refined. Finally, it includes additional
recommendations as Connecticut looks towards the future.
The project relied on the experience and knowledge of CCEH staff and volunteers who are on the
ground throughout the State as well as advanced technology and specialized knowledge. Connecticut has
conducted a consistent statewide methodology for its PIT since 2008, which provided the foundation for
this project. While the State of Connecticut is interested in homelessness overall, each region is also
required to submit separate reports to HUD.
PREPARING FOR THE COUNT
Sampling Strategy
The state of Connecticut is comprised of two Continua of Care (CoC): the Balance of State CoC (CT-
505) and Fairfield County (CT-503).
A stratified random sample was employed to estimate the number of unsheltered homeless individuals in
each CoC. For each CoC, CCEH and PIT Regional Coordinators designated each of Connecticut’s
2,581 block groups either “high” or “low” based on the probability of finding a homeless person in that
block group. All high probability areas, and a random sample of low probability areas, were canvassed
during the PIT count.

Page 2 of 9
Designating High Probability Block Groups
High probability designations were based on
results from the previous year’s count and
institutional knowledge from CCEH and PIT
Regional Coordinators. CCEH provided to
Simtech a list of all block groups in which at
least one person was counted in 2016. Simtech
used this list to provide an initial designation of
the 127 block groups to be considered as high
probability block groups. This designation of
the block group as high probability is made
regardless of whether that block group was
designated or sampled in 2016, or if that block
group was not intended to be canvassed at all.
A list of block groups in each PIT Region
indicating these high probability block groups,
along with a map conveying this information,
was distributed to PIT Regional Coordinators
through CCEH. PIT Regional Coordinators
subsequently added or remove high probability
areas based on information available to them
through the usage of these printed maps.
PIT Regional Coordinators added or removed
designated block groups as necessary, and were
permitted to add additional block groups. If a
Coordinator wanted to add additional block
groups, they provided justification to CCEH to
ensure that the sample sizes did not exceed the
capacity to recruit, train, and deploy enough
canvassers. Two hundred and twenty-one
block groups were added during this process
which resulted in a total of 348 high probability
areas to be sampled.
PIT RegionPeople Found
in 2016
No one Found
in 2016Total
Bristol 7 85 92
Danbury 4 152 156
Greater Bridgeport 12 182 194
Greater Hartford 8 470 478
Hartford 10 86 96
Litchfield County 6 123 129
Meriden Wallingfor 1 80 81
Middletown 4 114 118
New Britain 3 57 60
New Haven 26 81 107
New Haven East 4 124 128
New Haven North So 3 123 126
New Haven West 1 59 60
Northeast 0 120 120
Norwalk Area 6 157 163
Southeast 6 181 187
Stamford Greenwich 15 122 137
Waterbury 11 138 149
Total 127 2454 2581
Figure 1 - Block Groups where homeless were found in 2016
Figure 2 - Map provided to the Hartford PIT Regional Coordinator

Page 3 of 9
Sampling Low Probability Block Groups
The low probability block groups to be canvassed were chosen through a random sample chosen from
the population of block groups at the CoC level. Dan Treglia performed this task using SAS Statistical
Software.
The Continuum of Care, rather than the PIT Region, was used as the basis for choosing the low
probability sample to ensure that samples were large enough to be statistically valid. PIT Regions such
as New Britain and New Haven West, for example, each only have a total of sixty (60) block groups
insufficient for a statistically reliable sample. Small sample sizes can result in high variance, the
confidence intervals are large, and the reliability of the PIT count estimates would then be in question.
This is especially true for subpopulations, like youth or veterans, where the small numbers expected to
be counted could lead to artificially high or low estimates.
In addition to the aforementioned two CoC’s, the former Hartford CoC was sampled separately than the
remainder of the Balance of State to ensure that the counts from this largely urban area did not inflate
the enumeration applied to rural/suburban areas.
Determining the Sample Size of Low Probability Block Groups
The sample size for each Continuum of Care was determined by Simtech and CCEH in consultation
with PIT Regional Coordinators, with a goal of improving the accuracy of the PIT count by increasing
the sample size while understanding that the logistical constraints of finding, training, staging, and
deploying canvassers across the state. Simtech used the formula below to estimate the predicted
precision of the 2017 estimate, within each CoC, for any given sample size:
where: is the proposed sample size, d is the precision, i.e., the maximum tolerated difference
between the population total number of unsheltered homeless within low probability block groups and
its sample estimate; is the number of low probability areas for each Continuum of Care; z is the
standard normal score for a desired significance level , (for example, z = 1.96 for , which
corresponds to a 95% confidence level); and is the true variance of the number of unsheltered
homeless within low probability block groups. Simtech used results from prior years to estimate ,
the population variance, in order to make confidence interval predictions for any given sample size.
LPLP
LP
NzN
dn
1
1
222
2
LPn
LPN
05.2
2

Page 4 of 9
The sample sizes for each of the three regions that were set up as unique count areas are shown below.
Figure 3 - Sampling Set Up for CT-502 Hartford
Figure 4- Sampling Set Up for CT-503 Fairfield County
Figure 5 - Sampling Set Up for CT-505 Balance of State

Page 5 of 9
Set up the Counts for each Continuum of Care
Each Continuum of Care (CoC) was set up in the Point in Time Regional Command Center so that it
could receive survey data from the mobile app, Counting Us. This entailed defining the boundaries of
the area and assigning a unique “Setup Key” which is provided to volunteers the night of the count.
Figure 6 - Each Continuum of Care was Set Up to Receive Surveys within the Command Center
Count Administrator, Jacqueline Janosko, updated the block groups to indicate which are to be
considered as high or low probability. All high probability block groups were designated to be sampled,
along with the list of randomly sampled low probability block groups provided by Dan Treglia.
Figure 7 - Block Groups were designated as low or high Probability, and an indication was made as to whether each should be sampled.

Page 6 of 9
CONDUCTING THE COUNT
Utilization of Mobile Technology with Built-In GPS Capabilities
The 2017 PIT Count was the second year that Connecticut used mobile technology developed by
Simtech Solutions to help automate the count process. Volunteers downloaded the Counting Us app
from either Google Play or the iTunes App Store, registered an account, and joined the appropriate count
by entering a specific Setup Key attributed to the count project for which they were volunteering.
The Counting Us app includes three types of surveys that can be administered to individuals or
households. The survey questions include such demographic information as age, race, and gender as
well as information on veteran status, disabling conditions, length of homelessness, and other questions
that are included in the final PIT report that is submitted to HUD. A key feature of the Counting Us
application is the built-in GPS functionality that pinpoints the exact physical location that each survey
was conducted. This feature works with the maps and shape files that are in the Command Center.
Page 7 of 9
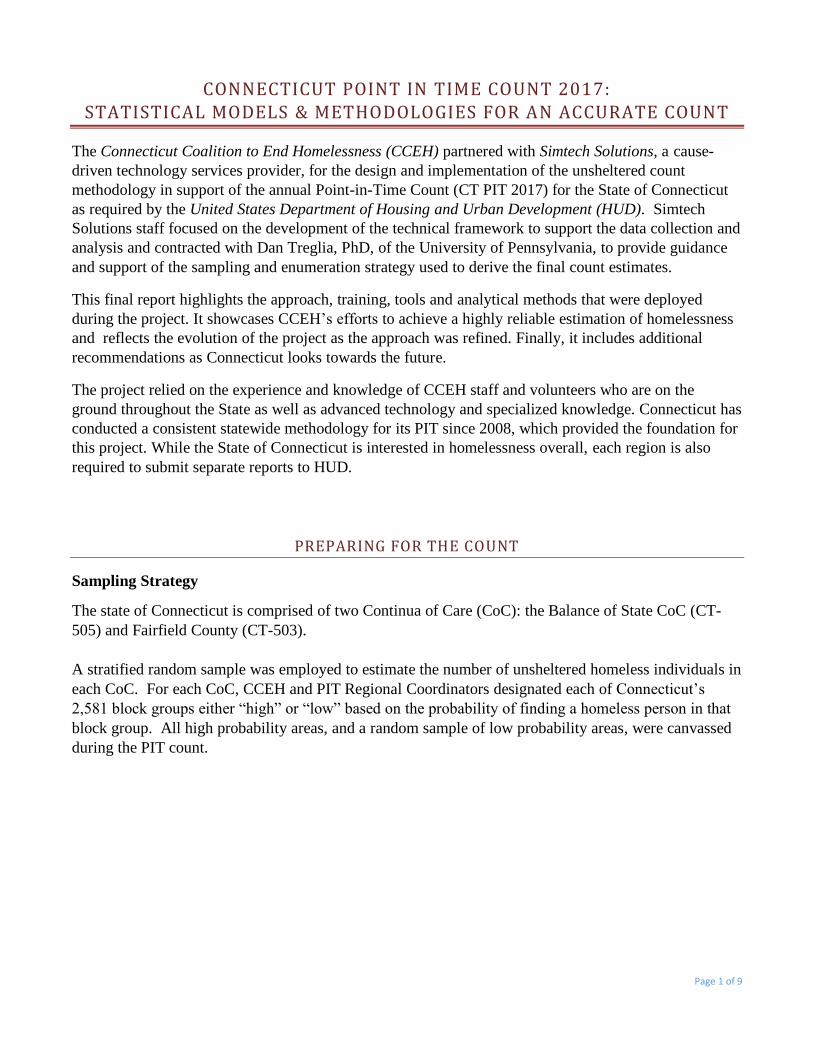
Count Activities were Monitored in Real-Time
The Point in Time Regional Command Center was used to receive survey data that was submitted by
volunteers using the Counting Us mobile app, in real time. The map view from within the Command
Center shows the location of each survey that has been conducted. Count Administrators were able to
contact volunteers on their smart phones if any surveys were conducted outside of their designated count
area.
Figure 8 - Count Administrators watch the activities of Count Volunteers in real-time.
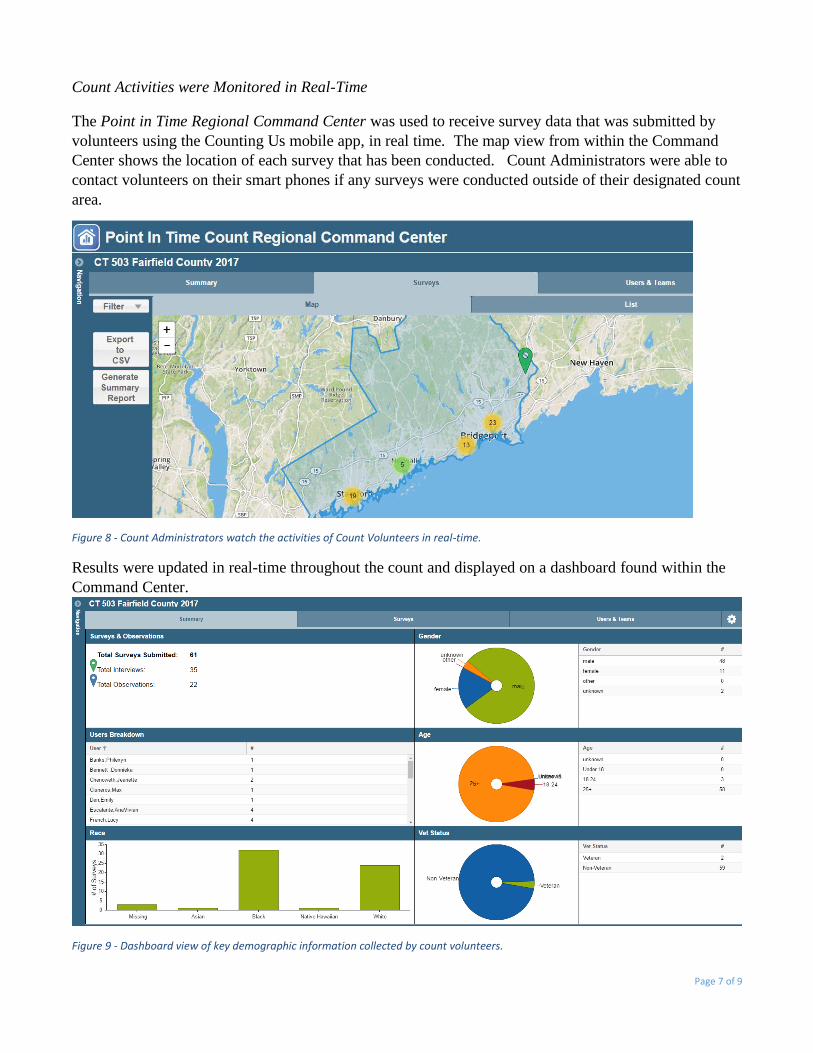
Results were updated in real-time throughout the count and displayed on a dashboard found within the
Command Center.
Figure 9 - Dashboard view of key demographic information collected by count volunteers.

Page 8 of 9
DERIVING THE FINAL COUNT ESTIMATES
Total Estimate
Sampling weights, estimates, and confidence intervals were applied differently to high and low
probability block groups in order to produce final estimates. Because CCEH conducted a census of high
probability block groups, there are no sample weights or confidence intervals. For low probability areas,
the average number of individuals counted in each sampled block group within each Continuum of Care
was applied to the universe of low probability areas within that CoC. This is mathematically equivalent
to applying a sample weight based on the proportion of sample areas chosen.
In order to ensure the methodological rigor of the PIT estimate, only those individuals encountered in
areas designated as high probability or as part of the sample of low probability block groups to be
counted were included in the results calculation. Individuals counted outside of the boundaries of block
groups to be canvassed were not included in the results as doing so would have removed the randomness
of the random sample. In total, there were twenty-three (23) surveys excluded, conducted in eighteen
(18) block groups. These block groups will be recorded for inclusion in designated areas for CT PIT
2018.
CoC CT-503 has 605 total block groups. 88 were designated as high probability, and 517 were therefore
low probability. All 88 of the high
probability block groups were canvassed,
along with a sample of 55 of the 517 low
probability block groups; 54 individuals
were counted in the high probability areas,
and two (2) were counted in the 55 low
probability areas. The sampling set up for
the three counts can be found in Exhibit A.
Figure 11 - Estimated Number of Homeless in CT-503 for the night of the 2017 Point in Time Count
The Weighting Factor (9.4) used to estimate the total number of homeless in the low probability areas
was derived by dividing the total number of low probability block groups (517) by the total number of
low probability block groups that were sampled (55). With only 2 people surveyed this resulted in an
estimated 18.8 people for all low probability block groups, which was subsequently rounded to 19. The
total estimated count for the region of 73 was derived by adding the estimate from the low probability
block groups (19) to the total counted in the high probability block groups (54).
Figure 10 - Block Group Designations for CT-503

Page 9 of 9
PIT Region, CAN, and Sub-CoC Estimates
Estimates at the PIT Region, Coordinated Access Network (CAN), and Sub-CoC estimates were based
on the number of individuals counted in high probability block groups in that region as well the
weighted average number of individuals estimated in the low probability sample. Complete HUD Point
in Time Reports were produced for each of these region types.
Since the number of block groups within the sub-regions represents an insufficient sample size for the
purposes of estimations, the estimates for these sub-regions was based on the estimates derived at the
CoC level. In order to accomplish this, the overall percentage of low probability block groups that exist
within the sub-region must first be calculated. The example below shows that the Greater Hartford
CAN contains 516 low probability block groups whereas the Balance of State CoC contains 1,649.
Therefor, the percentage of low probability block groups for the CoC that exist within the Greater
Hartford CAN is 516/1,649 or 31.29%.
Figure 12- Determining the Percentage of Low Probability Block Groups within the Sub-Region
Deriving the overall estimates for the sub-region is a two-step process. First, all count figures from the
high probability block groups are counted without any adjustment. The second step is to derive the
estimated counts for the low probability block groups. This is done by multiplying the estimated figures
from the low probability block groups for the entire CoC by the percentage of low probability block
groups for the CoC that exist within the sub-region. Continuing to use Greater Hartford CAN as an
example, the estimated number of households for the sub-region is shown below. Five (5) households
counted in high probability block groups plus 98 households counted across the entire CoC muliplied by
the 31.29% calculated above. This results in a total estimated number of households of 36.
Figure 13 - Estimated Count Figures for the Greater Hartford CAN