connected vehicles program: driver performance - conservancy
TRANSCRIPT

Connected Vehicles Program: Driver Performance and Distraction Evaluation for In-vehicle Signing
Final Report
Prepared by:
Janet Creaser Michael Manser
HumanFIRST Program
University of Minnesota
CTS 12-05

Technical Report Documentation Page 1. Report No. 2. 3. Recipients Accession No. CTS 12-05 4. Title and Subtitle 5. Report DateConnected Vehicles Program: Driver Performance and Distraction Evaluation for In-vehicle Signing
March 20126.
7. Author(s) 8. Performing Organization Report No. Janet Creaser and Michael Manser 9. Performing Organization Name and Address 10. Project/Task/Work Unit No. HumanFIRST Program ITS Institute University of Minnesota 111 Church St. SE Minneapolis, MN 55112
CTS Project #2011091 11. Contract (C) or Grant (G) No. (c) 89261 (wo) 270
12. Sponsoring Organization Name and Address 13. Type of Report and Period Covered Minnesota Department of Transportation 395 John Ireland Boulevard, MS 330 St. Paul, MN 55155
14. Sponsoring Agency Code
15. Supplementary Notes http://www.its.umn.edu/Publications/ResearchReports/16. Abstract (Limit: 250 words) The Minnesota Department of Transportation (MnDOT) conducted a demonstration project as part of the Connected Vehicles Program to design, build, and test three new software applications to run on a commercially available personal navigation device (PND). The goal of this study was to examine only the in-vehicle signing (IVS) function for four zones and determine the utility and potential distraction associated with this function. The specific zones of interest that were signed on the PND were areas where speed zone changes occurred along the same roadway or for speed changes associated with construction, school and curve zones. A continuous navigation function was provided in two of the three conditions to examine the effect of navigation information alone and multiple sources of information on driving performance. Driving performance measures known to be related to distraction as well as subjective usability and workload measures were used to help identify potential distraction associated with the IVS information. The project identified some driver effects that may occur when using a commercially available navigation device with in-vehicle signing (IVS) information, such as drivers demonstrating higher speeds associated with some of the System On conditions. Overall, distraction effects were small and not consistent across all zones or conditions. The main conclusion drawn from this study was that the IVS information was considered useful by drivers and resulted in few distraction-related effects. The benefit of advance notification likely outweighs any distraction that may be associated with in-vehicle signing of these zones.
17. Document Analysis/Descriptors Connected vehicles program, In vehicle sensors, Navigation devices, Advanced driver information systems
18. Availability Statement No restrictions. Document available from:National Technical Information Services, Alexandria, Virginia 22312
19. Security Class (this report) 20. Security Class (this page) 21. No. of Pages 22. Price Unclassified Unclassified 50

Connected Vehicles Program: Driver Performance and Distraction Evaluation for In-vehicle Signing
Final Report
Prepared by:
Janet Creaser Michael Manser
HumanFIRST Program University of Minnesota
March 2012
Published by:
Center for Transportation Studies University of Minnesota
200 Transportation and Safety Building 511 Washington Avenue SE
Minneapolis, Minnesota 55455
This report represents the results of research conducted by the authors and does not necessarily represent the views or policies of the University of Minnesota.
The authors and the University of Minnesota do not endorse products or manufacturers. Any trade or manufacturers’ names that may appear herein do so solely because they are considered essential to this report.

Acknowledgments
This work is funded by the Minnesota Department of Transportation (MnDOT) through Sponsor Award Number 89261, Work Order 270. We would like to thank Peter Easterlund of the HumanFIRST Program and Alec Gorjestani of the Intelligent Vehicles Laboratory, both of the ITS Institute, for their assistance during this project as well as our research assistants, Samantha Sandgren, Daniel Drew, Jenna Heath, and Luke Rabelhofer.
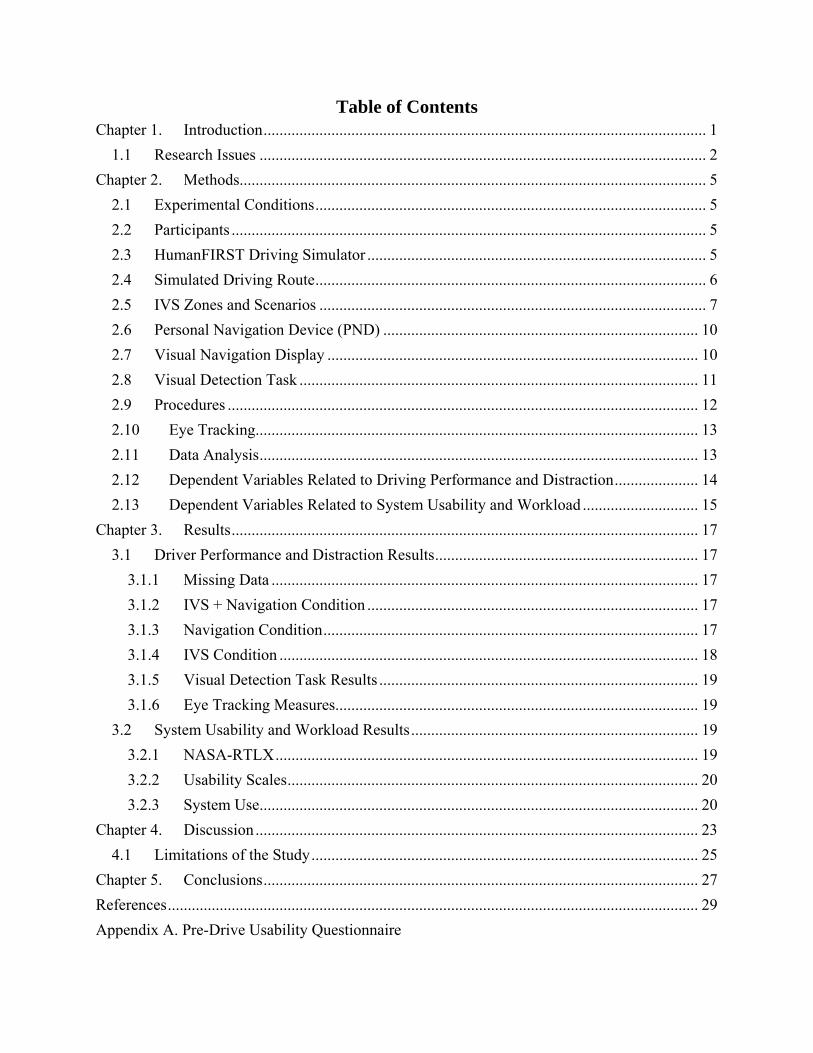
Table of Contents Chapter 1. Introduction ............................................................................................................... 1
1.1 Research Issues ................................................................................................................ 2
Chapter 2. Methods..................................................................................................................... 5
2.1 Experimental Conditions .................................................................................................. 5
2.2 Participants ....................................................................................................................... 5
2.3 HumanFIRST Driving Simulator ..................................................................................... 5
2.4 Simulated Driving Route .................................................................................................. 6
2.5 IVS Zones and Scenarios ................................................................................................. 7
2.6 Personal Navigation Device (PND) ............................................................................... 10
2.7 Visual Navigation Display ............................................................................................. 10
2.8 Visual Detection Task .................................................................................................... 11
2.9 Procedures ...................................................................................................................... 12
2.10 Eye Tracking............................................................................................................... 13
2.11 Data Analysis .............................................................................................................. 13
2.12 Dependent Variables Related to Driving Performance and Distraction ..................... 14
2.13 Dependent Variables Related to System Usability and Workload ............................. 15
Chapter 3. Results ..................................................................................................................... 17
3.1 Driver Performance and Distraction Results .................................................................. 17
3.1.1 Missing Data ........................................................................................................... 17
3.1.2 IVS + Navigation Condition ................................................................................... 17
3.1.3 Navigation Condition .............................................................................................. 17
3.1.4 IVS Condition ......................................................................................................... 18
3.1.5 Visual Detection Task Results ................................................................................ 19
3.1.6 Eye Tracking Measures ........................................................................................... 19
3.2 System Usability and Workload Results ........................................................................ 19
3.2.1 NASA-RTLX .......................................................................................................... 19
3.2.2 Usability Scales ....................................................................................................... 20
3.2.3 System Use.............................................................................................................. 20
Chapter 4. Discussion ............................................................................................................... 23
4.1 Limitations of the Study ................................................................................................. 25
Chapter 5. Conclusions ............................................................................................................. 27
References ..................................................................................................................................... 29
Appendix A. Pre-Drive Usability Questionnaire

Appendix B. Practice and Experimental Drive Instructions
Appendix C. NASA-RTLX Workload Questionnaire
Appendix D. Post-Drive Usability and Use Questionnaire
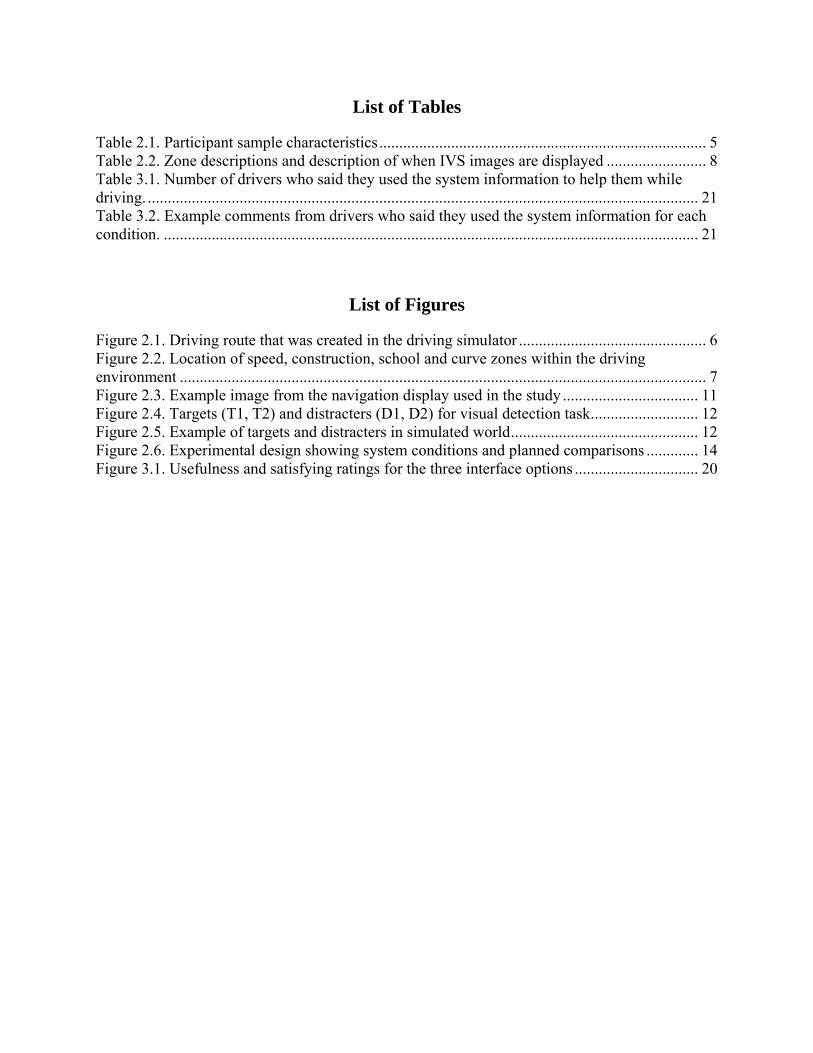
List of Tables
Table 2.1. Participant sample characteristics .................................................................................. 5 Table 2.2. Zone descriptions and description of when IVS images are displayed ......................... 8 Table 3.1. Number of drivers who said they used the system information to help them while driving. .......................................................................................................................................... 21 Table 3.2. Example comments from drivers who said they used the system information for each condition. ...................................................................................................................................... 21
List of Figures
Figure 2.1. Driving route that was created in the driving simulator ............................................... 6 Figure 2.2. Location of speed, construction, school and curve zones within the driving environment .................................................................................................................................... 7 Figure 2.3. Example image from the navigation display used in the study .................................. 11 Figure 2.4. Targets (T1, T2) and distracters (D1, D2) for visual detection task ........................... 12 Figure 2.5. Example of targets and distracters in simulated world ............................................... 12 Figure 2.6. Experimental design showing system conditions and planned comparisons ............. 14 Figure 3.1. Usefulness and satisfying ratings for the three interface options ............................... 20

Executive Summary
The Minnesota Department of Transportation (MnDOT) conducted a demonstration project as part of the Connected Vehicles Program to design, build, and test three new software applications to run on a commercially available personal navigation device (PND). The three applications that run on the PND (e.g., TomTom or phone running Android) that use Global Positioning System (GPS) technology will:
1. Calculate and present mileage-based user fees (MBUF) for the road on which a driver is traveling and an accumulated bill
2. Present in-vehicle signing (IVS) to drivers about specific zones they encounter (e.g., construction)
3. Present traveler information using probe vehicle data, which will allow information to pass between vehicles and the infrastructure and allow drivers to see travel time information.
The overall goals of the larger project, entitled Minnesota Road Fee Test, were to:
• Develop and validate the functionality of each vehicle acting as a probe and providing information to a central location,
• Provide route-specific traveler information to vehicles, • Demonstrate the technical feasibility of a mileage-based user fee (MBUF) component, • Identify drivers’ opinions about the MBUF component and to identify the reaction to this
component by the general public, and • Demonstrate the feasibility of delivering time-specific safety and warning messages on
an in-vehicle display. The goal of the study described in this report was to examine only the in-vehicle signing (IVS) function (#2) for four zones and determine the utility and potential distraction associated with the IVS information. The specific zones of interest that were signed on the PND in this study were areas where speed zone changes occurred along the same roadway, notification of school zones, notification of construction zones and notification of curves to assist drivers with preparing for transitions to new driving situations. A continuous navigation function was provided in two of the three conditions to examine the effect of navigation information alone and multiple sources of information (IVS + Navigation Information) on driving performance. Driving performance measures known to be related to distraction as well as subjective usability and workload measures were used to help identify potential distraction associated with the IVS information. Sixty-one participants (balanced for gender and across age groups) completed the study and were divided among three system conditions. The first system condition included the IVS information plus a continuous visual navigation function. The navigation information was not visible in this condition while the IVS information was presented. The second system condition included just the continuous visual navigation information and the third condition included just the IVS information with no other visual information provided during the drive. All information was displayed using an Android phone mounted on the center console of the vehicle within the driver’s view (i.e., in the same location where a manufacturer-installed navigation screen and controls would be located). A simulated driving route was developed in the HumanFIRST simulator using a real roadway network from southern Minnesota. Drivers in each condition
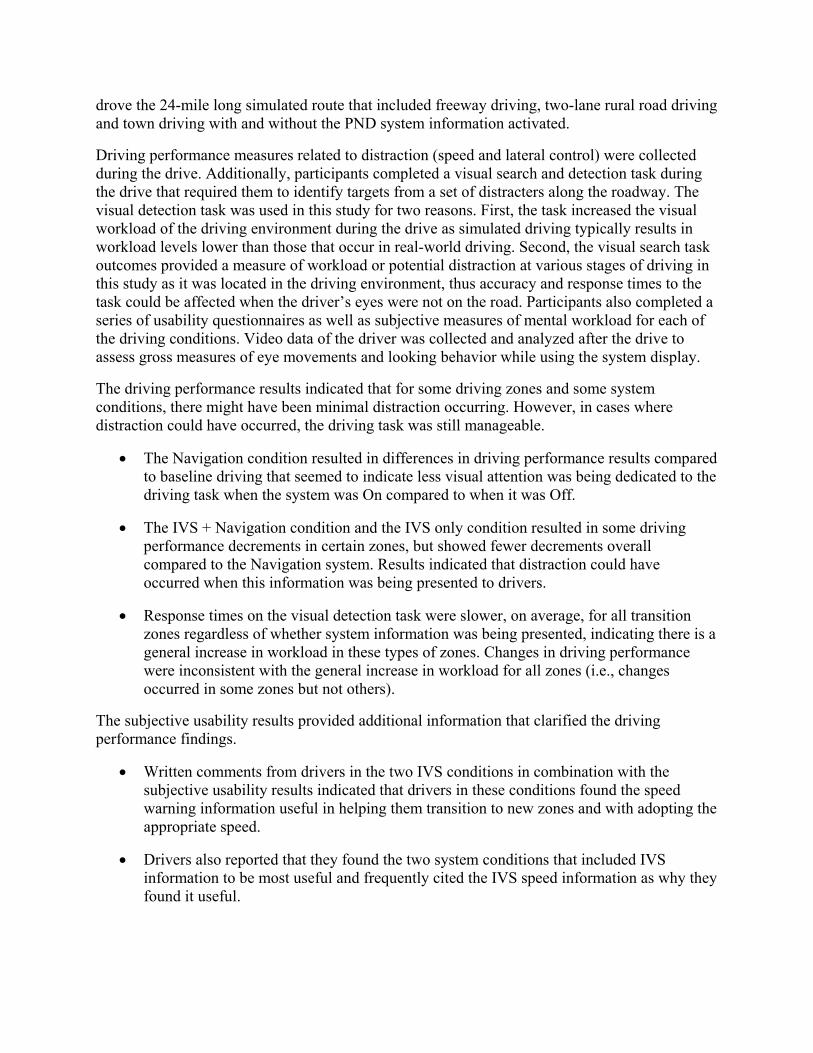
drove the 24-mile long simulated route that included freeway driving, two-lane rural road driving and town driving with and without the PND system information activated.
Driving performance measures related to distraction (speed and lateral control) were collected during the drive. Additionally, participants completed a visual search and detection task during the drive that required them to identify targets from a set of distracters along the roadway. The visual detection task was used in this study for two reasons. First, the task increased the visual workload of the driving environment during the drive as simulated driving typically results in workload levels lower than those that occur in real-world driving. Second, the visual search task outcomes provided a measure of workload or potential distraction at various stages of driving in this study as it was located in the driving environment, thus accuracy and response times to the task could be affected when the driver’s eyes were not on the road. Participants also completed a series of usability questionnaires as well as subjective measures of mental workload for each of the driving conditions. Video data of the driver was collected and analyzed after the drive to assess gross measures of eye movements and looking behavior while using the system display.
The driving performance results indicated that for some driving zones and some system conditions, there might have been minimal distraction occurring. However, in cases where distraction could have occurred, the driving task was still manageable.
• The Navigation condition resulted in differences in driving performance results compared to baseline driving that seemed to indicate less visual attention was being dedicated to the driving task when the system was On compared to when it was Off.
• The IVS + Navigation condition and the IVS only condition resulted in some driving performance decrements in certain zones, but showed fewer decrements overall compared to the Navigation system. Results indicated that distraction could have occurred when this information was being presented to drivers.
• Response times on the visual detection task were slower, on average, for all transition zones regardless of whether system information was being presented, indicating there is a general increase in workload in these types of zones. Changes in driving performance were inconsistent with the general increase in workload for all zones (i.e., changes occurred in some zones but not others).
The subjective usability results provided additional information that clarified the driving performance findings.
• Written comments from drivers in the two IVS conditions in combination with the subjective usability results indicated that drivers in these conditions found the speed warning information useful in helping them transition to new zones and with adopting the appropriate speed.
• Drivers also reported that they found the two system conditions that included IVS information to be most useful and frequently cited the IVS speed information as why they found it useful.
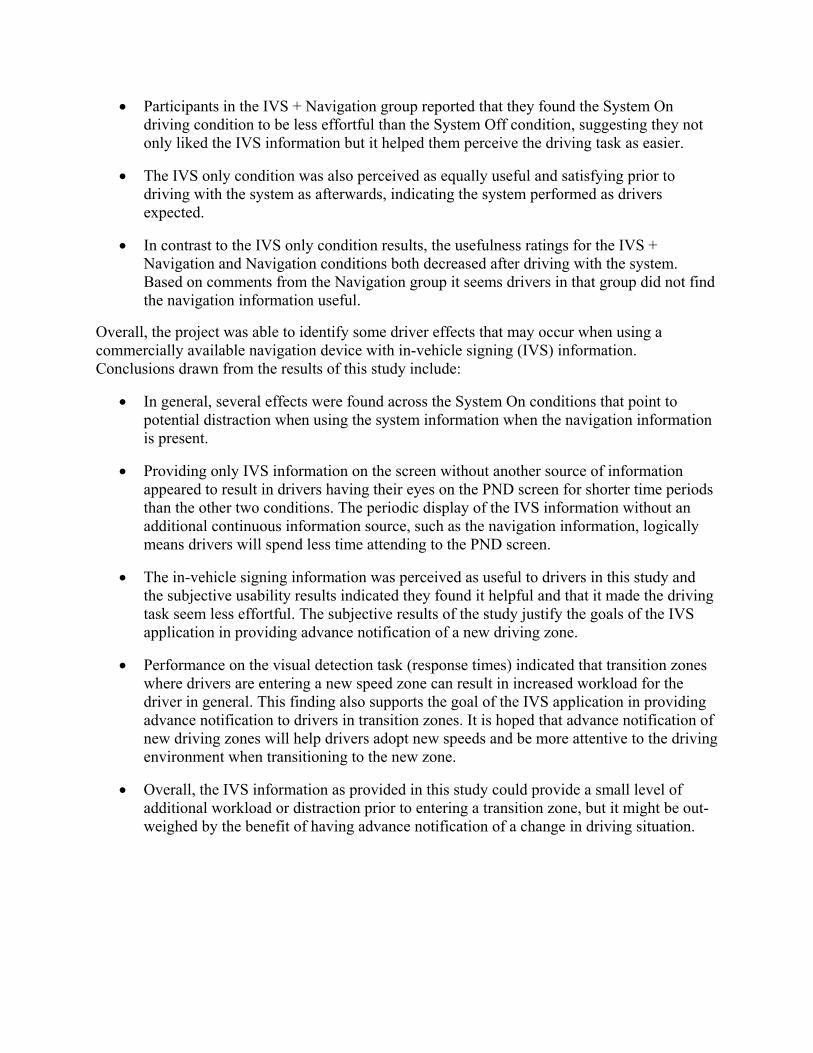
• Participants in the IVS + Navigation group reported that they found the System On driving condition to be less effortful than the System Off condition, suggesting they not only liked the IVS information but it helped them perceive the driving task as easier.
• The IVS only condition was also perceived as equally useful and satisfying prior to driving with the system as afterwards, indicating the system performed as drivers expected.
• In contrast to the IVS only condition results, the usefulness ratings for the IVS + Navigation and Navigation conditions both decreased after driving with the system. Based on comments from the Navigation group it seems drivers in that group did not find the navigation information useful.
Overall, the project was able to identify some driver effects that may occur when using a commercially available navigation device with in-vehicle signing (IVS) information. Conclusions drawn from the results of this study include:
• In general, several effects were found across the System On conditions that point to potential distraction when using the system information when the navigation information is present.
• Providing only IVS information on the screen without another source of information appeared to result in drivers having their eyes on the PND screen for shorter time periods than the other two conditions. The periodic display of the IVS information without an additional continuous information source, such as the navigation information, logically means drivers will spend less time attending to the PND screen.
• The in-vehicle signing information was perceived as useful to drivers in this study and the subjective usability results indicated they found it helpful and that it made the driving task seem less effortful. The subjective results of the study justify the goals of the IVS application in providing advance notification of a new driving zone.
• Performance on the visual detection task (response times) indicated that transition zones where drivers are entering a new speed zone can result in increased workload for the driver in general. This finding also supports the goal of the IVS application in providing advance notification to drivers in transition zones. It is hoped that advance notification of new driving zones will help drivers adopt new speeds and be more attentive to the driving environment when transitioning to the new zone.
• Overall, the IVS information as provided in this study could provide a small level of additional workload or distraction prior to entering a transition zone, but it might be out-weighed by the benefit of having advance notification of a change in driving situation.
1
Chapter 1. Introduction
The Minnesota Department of Transportation (MnDOT) conducted a demonstration project as part of the Connected Vehicles Program to design, build, and test three new software applications to run on a commercially available personal navigation device (PND). The three applications that run on the PND (e.g., TomTom or phone running Android) that use global positioning satellite (GPS) technology include:
1. Calculate and present Mileage Based User Fees (MBUF) for the road on which a driver is traveling and an accumulated bill
2. Present In-Vehicle Signing (IVS) to drivers about specific zones they encounter (e.g., construction)
3. Present Traveler Information Using Probe Vehicle Data which will allow information to pass between vehicles and the infrastructure and allow drivers to see travel time information.
The overall goals of the larger project, entitled Minnesota Road Fee Test, were to:
• Develop and validate the functionality of each vehicle acting as a probe and providing information to a central location,
• Provide route-specific traveler information to vehicles, • Demonstrate the technical feasibility of a mileage-based user fee (MBUF) component, • Identify drivers’ opinions about the MBUF component and to identify the reaction to this
component by the general public, and • Demonstrate the feasibility of delivering time-specific safety and warning messages on
an in-vehicle display.
The goal of the project is to improve safety and mobility for drivers. The Minnesota Road Fee Test was led by the MnDOT Office of Traffic, Safety, and Technology with technical support provided by Mixon Hill Incorporated. Battelle Memorial Institute (BMI) was the development lead for the product while Science Application International Corporation (SAIC) was tasked with conducting functional evaluations. The project employed a robust product development strategy that included concept development, product functionality validation, and the identification of the initial product impressions by the general public to accomplish the overall project goals. The goal of the study described in this report was to examine only the in-vehicle signing (IVS) function (#2) to determine the utility of the information and whether any potential distraction was associated with using the IVS information. The purpose of the IVS application was to transmit roadway signing information from the infrastructure to a PND interface. The IVS information is intended to augment the ability of drivers to detect transition points in the road while driving that may occur due to changes in speed limits along a road, school zones, construction zones and upcoming curves. The design iteration tested in the current study evaluated the presentation of advance notification signs for upcoming zones and for signs that occurred within a zone requiring the driver to adopt a new speed (e.g., adopting a reduce speed in a construction zone).
2
Significant tenets associated with the development and design of in-vehicle technology are to create a product that 1) is perceived by drivers as being useful, 2) that is usable, and 3) that influences performance in a positive and expected way. If a product does not meet these basic tenets it will not be well received by drivers and would likely result in drivers not employing the product (and not benefiting from the product). In addition, if the product lacks usability, it could potentially contribute to unanticipated consequences during use (e.g., distraction). The project scope allowed for an initial investigation of the IVS application to be conducted with the general public to determine if their impression of the application meets the stated project goals of improving safety and mobility. This activity initially addresses the first tenet identified above. The work covered in the study reported here addressed the need to evaluate the second and third tenets of in-vehicle technology design and development as they relate to the IVS application. Specifically, the purpose was to determine the extent to which the IVS application developed by BMI would influence driver performance and perceptions of usability in both positive and negative ways. A critical element of this phase was also to determine the extent to which changes in driver performance and perceptions of usability may be indicative of driver distraction. For example, distraction due to the IVS application may result from a need to view the application for an extended period of time while driving.
1.1 Research Issues
The driver behavior we expected to see when using the IVS information was appropriate compliance with speed limits. This included drivers’ adjusting their speed appropriately before entry into a new speed zone and maintaining the correct speed throughout the new speed zone. It also included drivers being aware of why changes in the speed zones are occurring (e.g., school zones, construction zone, curve, changes in speed limit along a roadway). A main goal of this study was also to assess the level (if any) of distraction associated with the presented IVS information. Distraction can be defined as “a diversion of attention away from activities critical to safe driving toward a competing activity” (Lee, Young & Regan, 2009; p. 38). In the case of the visual IVS or mapping information, drivers attending to that information may have their visual attention diverted away from the roadway at the same moment a critical incident occurs (e.g., lead vehicle performs emergency braking, child dashes into street). If attention to the IVS occurred during a critical event and reduced the ability of the driver to respond to such an event, it could be considered a distraction.
In this study, navigation information was included as a control condition for the IVS information because the effect of navigation information on driving performance has been well documented. Research has demonstrated that navigation support systems that provide only visual route guidance result in more driving performance decrements than those that provide auditory guidance because of the load they place on visual attention (Bayly, Young & Regan, 2009). Systems that use simple turn-by-turn (versus complex holistic maps) route guidance resulted in the fewest performance decrements, particularly if auditory instructions are also provided (e.g., Dingus et al., 1997). Therefore, it was expected that the navigation information display used in this study would potentially impact driving performance as has been seen in previous research. By comparing a Navigation information only condition to two IVS conditions, one in which only IVS information appears periodically on the screen and one in which IVS information is periodically overlaid on top of the navigation display, it was expected that we would be able to

3
identify any additional distraction effects that may be associated specifically with the IVS information. When measuring performance related to distraction, lateral control performance (e.g., lane position, lane position variability) is most sensitive to visual distraction (e.g., Young, Regan & Lee, 2009; Engstrom, et al, 2005). In particular, lane keeping is often impacted by following visual navigation instructions compared to voice instructions; therefore, assessing lateral performance measures will help us understand the impact of the navigation and IVS information instructions on driver distraction. Additionally, eye glance data can be measured to assess visual distraction. Single-glance durations of two seconds or more away from the roadway are associated with increased near-crash/crash risk (Klauer et al., 2006).
In order to keep drivers focused on the roadway during simulated driving, it is often useful to incorporate an additional visual task into the environment to create visual workload that is similar to real-world driving. Therefore, this study included a visual search and detection task embedded into the driving environment. Participants were required to identify specific targets among a set of distracters that were presented in the driving scene (e.g., along the left and right sides of the roadway). The purpose of this task was to increase visual attention towards the roadway and determine the extent to which the IVS information may draw attention away from the roadway at critical moments (e.g., during presentation of the target). This task acted as a surrogate measure of whether the IVS information presentation was distracting and, thus, had an effect on the ability of the driver to identify safety critical events in the environment when interacting with the IVS information. Although the targets used in this task were shapes, their presence and the ability to detect a change in one of the shapes acted as surrogates for such events as a car or pedestrian potentially entering the roadway. Similar embedded visual detection tasks have been used to examine visual scanning performance for other types of in-vehicle distraction or inattention, such as during automated car following (e.g., Funke, Matthews, Warm & Emo, 2007) or while engaging in a hands-free cell phone conversation (e.g., Strayer, Drews, & Johnston, 2003). Finally, in addition to driving performance, a subjective assessment of cognitive workload provided another way to determine if distraction or usability issues might be associated with the in-vehicle interface. The perceived mental workload reported by drivers was measured using the NASA Raw Task Load Index (NASA-RTLX) (Hart & Staveland, 1988).
Overall, the goal of this study was to determine if distraction or excess workload occurred when using the IVS information. Navigation information was used to control the levels of continuous information presented by the system and to simulate the use of IVS information in conjunction with a PND. Driving performance measures known to be related to distraction as well as subjective usability and workload measures were collected to help identify potential distraction associated with the IVS information.

4
5
Chapter 2. Methods
2.1 Experimental Conditions
This study included three experimental conditions: IVS + Navigation, Navigation, and IVS. The IVS + Navigation condition contained both a navigation feature and the in-vehicle signing alerts (IVS). The navigation information appeared continuously on the screen until IVS information was presented. When IVS information was presented, the navigation information was no longer visible. The Navigation group used the portable device with only the navigation feature running and the IVS feature turned off, while the IVS group used the system with only the IVS feature turned on and the navigation feature turned off for the experimental drive.
2.2 Participants
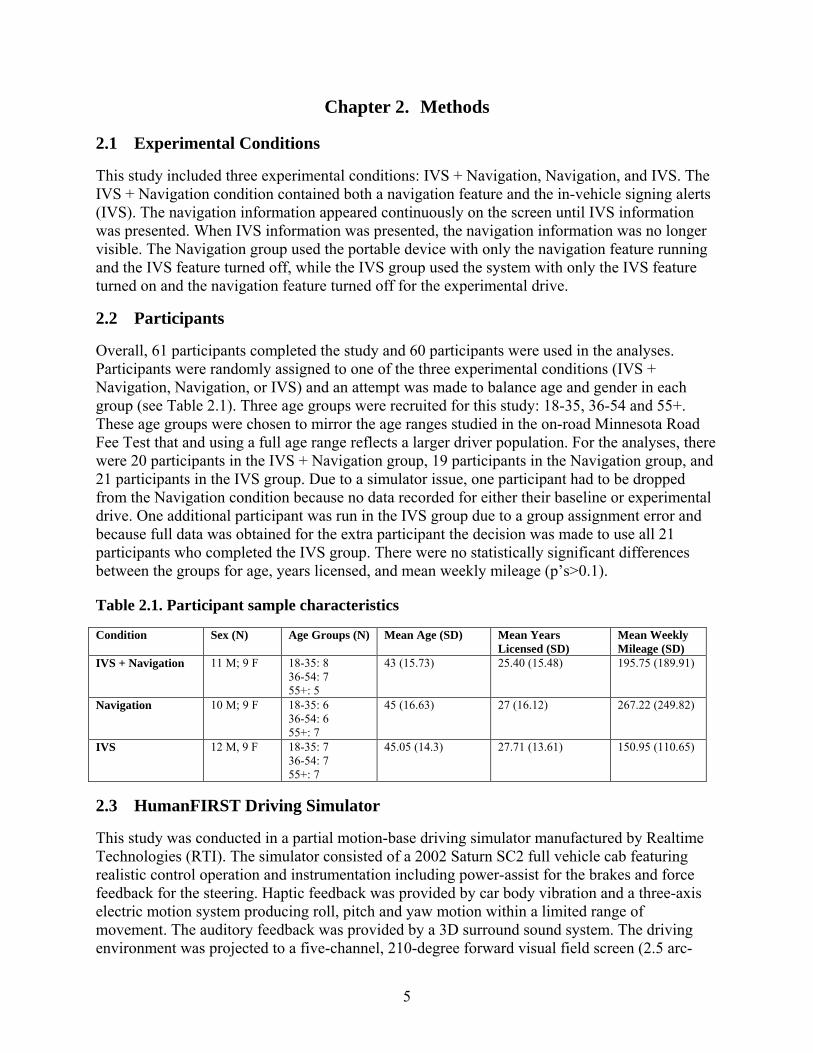
Overall, 61 participants completed the study and 60 participants were used in the analyses. Participants were randomly assigned to one of the three experimental conditions (IVS + Navigation, Navigation, or IVS) and an attempt was made to balance age and gender in each group (see Table 2.1). Three age groups were recruited for this study: 18-35, 36-54 and 55+. These age groups were chosen to mirror the age ranges studied in the on-road Minnesota Road Fee Test that and using a full age range reflects a larger driver population. For the analyses, there were 20 participants in the IVS + Navigation group, 19 participants in the Navigation group, and 21 participants in the IVS group. Due to a simulator issue, one participant had to be dropped from the Navigation condition because no data recorded for either their baseline or experimental drive. One additional participant was run in the IVS group due to a group assignment error and because full data was obtained for the extra participant the decision was made to use all 21 participants who completed the IVS group. There were no statistically significant differences between the groups for age, years licensed, and mean weekly mileage (p’s>0.1).
Table 2.1. Participant sample characteristics
Condition Sex (N) Age Groups (N) Mean Age (SD) Mean Years Licensed (SD)
Mean Weekly Mileage (SD)
IVS + Navigation 11 M; 9 F 18-35: 8 36-54: 7 55+: 5
43 (15.73) 25.40 (15.48) 195.75 (189.91)
Navigation 10 M; 9 F 18-35: 6 36-54: 6 55+: 7
45 (16.63) 27 (16.12) 267.22 (249.82)
IVS 12 M, 9 F 18-35: 7 36-54: 7 55+: 7
45.05 (14.3) 27.71 (13.61) 150.95 (110.65)
2.3 HumanFIRST Driving Simulator
This study was conducted in a partial motion-base driving simulator manufactured by Realtime Technologies (RTI). The simulator consisted of a 2002 Saturn SC2 full vehicle cab featuring realistic control operation and instrumentation including power-assist for the brakes and force feedback for the steering. Haptic feedback was provided by car body vibration and a three-axis electric motion system producing roll, pitch and yaw motion within a limited range of movement. The auditory feedback was provided by a 3D surround sound system. The driving environment was projected to a five-channel, 210-degree forward visual field screen (2.5 arc-

6
minutes per pixel) with rear and side mirror views provided by a rear screen and vehicle-mounted LCD panels, respectively.
2.4 Simulated Driving Route
A 24-mile long route was identified southwest of the Minneapolis/St. Paul metropolitan area that incorporated expressway, rural, and local roads to accomplish the goals of testing the system alerts (see Figure 2.1). This driving route was chosen because it included speed zone and curve warning zones that were of interest for this study. To shorten the driving route, a small portion of low-speed town driving was eliminated to reduce the drive time by five minutes (see Figure 2 for start and stop points on the route). The driving route took about 25 minutes to complete and was driven in a clockwise direction (see Figure 2.1). The drive included a segment of freeway driving, several segments of rural two-lane road driving, and two segments of town driving. To allow drivers to easily navigate the route, the route was designed so drivers can only go in the desired direction and drivers in all conditions were provided with an auditory turn direction in advance of each turn. Barricades were placed at intersections and interchanges to prevent drivers from going the wrong way. IVS and navigation information were displayed to drivers on an Android cellular phone that was mounted to the center console of the vehicle within the driver’s view. Oncoming traffic was presented in the simulation to that represented light traffic flow. Scenario features, such as road striping, buildings, trees, grass and hills were incorporated into the drive to approximate the environmental landscape of the real-world route.
Figure 2.1. Driving route that was created in the driving simulator
7
2.5 IVS Zones and Scenarios
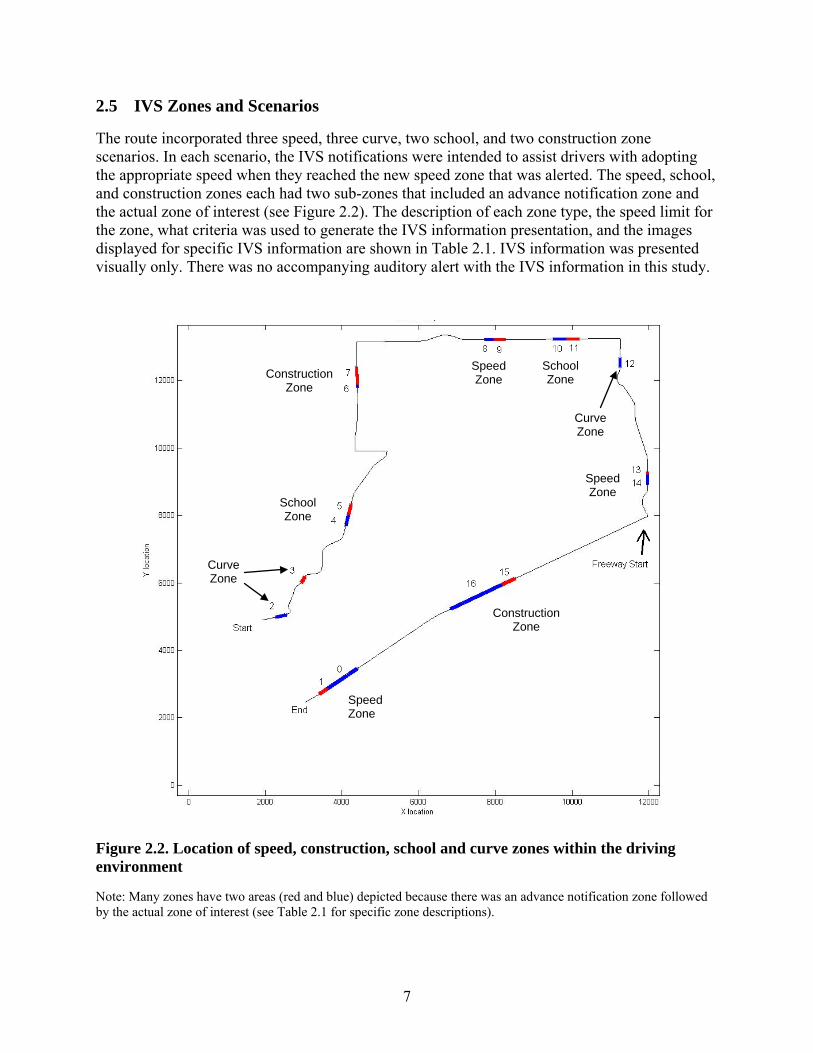
The route incorporated three speed, three curve, two school, and two construction zone scenarios. In each scenario, the IVS notifications were intended to assist drivers with adopting the appropriate speed when they reached the new speed zone that was alerted. The speed, school, and construction zones each had two sub-zones that included an advance notification zone and the actual zone of interest (see Figure 2.2). The description of each zone type, the speed limit for the zone, what criteria was used to generate the IVS information presentation, and the images displayed for specific IVS information are shown in Table 2.1. IVS information was presented visually only. There was no accompanying auditory alert with the IVS information in this study.
Figure 2.2. Location of speed, construction, school and curve zones within the driving environment
Note: Many zones have two areas (red and blue) depicted because there was an advance notification zone followed by the actual zone of interest (see Table 2.1 for specific zone descriptions).
Speed Zone
Curve Zone
Construction Zone
Speed Zone
Construction Zone
School Zone
School Zone
Speed Zone
Curve Zone

8
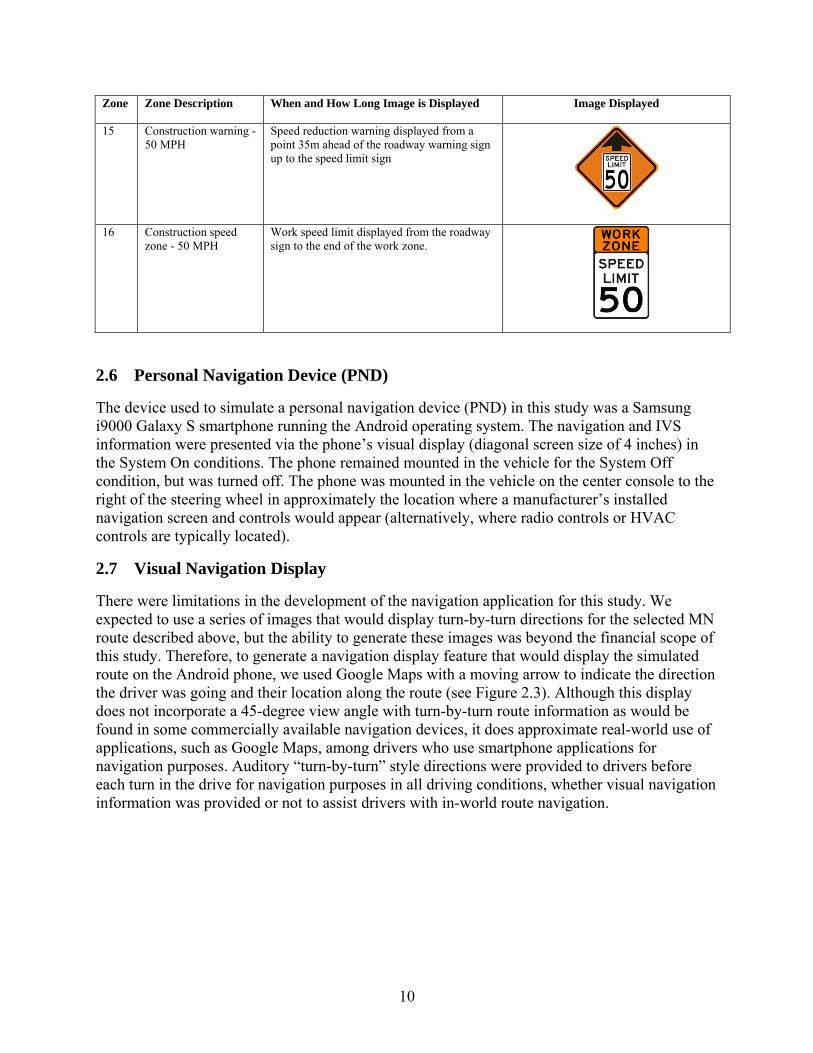
Table 2.2. Zone descriptions and description of when IVS images are displayed
Zone Zone Description When and How Long Image is Displayed Image Displayed
0 Speed Warning zone - 55 MPH
Speed reduction warning displayed from a point 35m ahead of the roadway warning sign up to the speed limit sign.
1 Speed zone - 55 MPH Speed limit displayed from the roadway sign to a point 250m past the sign.
2 Curve - reverse turn left - 30 MPH
Curve warning displayed along with speed from a point 75m in advance of the roadway curve sign up to the roadway curve entry point.
3 Curve - reverse turn right - 35 MPH
Curve warning displayed along with speed from a point 75m in advance of the roadway curve sign up to the roadway curve entry point.
4 School warn zone - 35 MPH
Speed reduction warning displayed from a point 35m ahead of the roadway warning sign up to the speed limit sign.
5 School zone - 35mph Speed limit displayed from the roadway sign to the end of the school zone.
6 Construction Warning - 40 MPH
Speed reduction warning displayed from a point 35m ahead of the roadway warning sign up to the speed limit sign

9
Zone Zone Description When and How Long Image is Displayed Image Displayed
7 Construction speed zone - 40 MPH
Work speed limit displayed from the roadway sign to the end of the work zone.
8 Speed Warning zone - 35 MPH
Speed reduction warning displayed from a point 35m ahead of the roadway warning sign up to the speed limit sign.
9 Speed zone - 35 MPH Speed limit displayed from the roadway sign to a point 250m past the sign.
10 School warn zone - 35 MPH
Speed reduction warning displayed from a point 35m ahead of the roadway warning sign up to the speed limit sign.
11 School zone - 35mph Speed limit displayed from the roadway sign to the end of the school zone.
12 Curve winding road right - 40 MPH
From a point 75 m in advance of the roadway sign up to the roadway curve entry point
13 Speed Warning zone - 40 MPH
Speed reduction warning displayed from a point 35m ahead of the roadway warning sign up to the speed limit sign.
14 Speed zone - 40 MPH Speed limit displayed from the roadway sign to a point 250m past the sign.
10
Zone Zone Description When and How Long Image is Displayed Image Displayed
15 Construction warning - 50 MPH
Speed reduction warning displayed from a point 35m ahead of the roadway warning sign up to the speed limit sign
16 Construction speed zone - 50 MPH
Work speed limit displayed from the roadway sign to the end of the work zone.
2.6 Personal Navigation Device (PND)
The device used to simulate a personal navigation device (PND) in this study was a Samsung i9000 Galaxy S smartphone running the Android operating system. The navigation and IVS information were presented via the phone’s visual display (diagonal screen size of 4 inches) in the System On conditions. The phone remained mounted in the vehicle for the System Off condition, but was turned off. The phone was mounted in the vehicle on the center console to the right of the steering wheel in approximately the location where a manufacturer’s installed navigation screen and controls would appear (alternatively, where radio controls or HVAC controls are typically located).
2.7 Visual Navigation Display
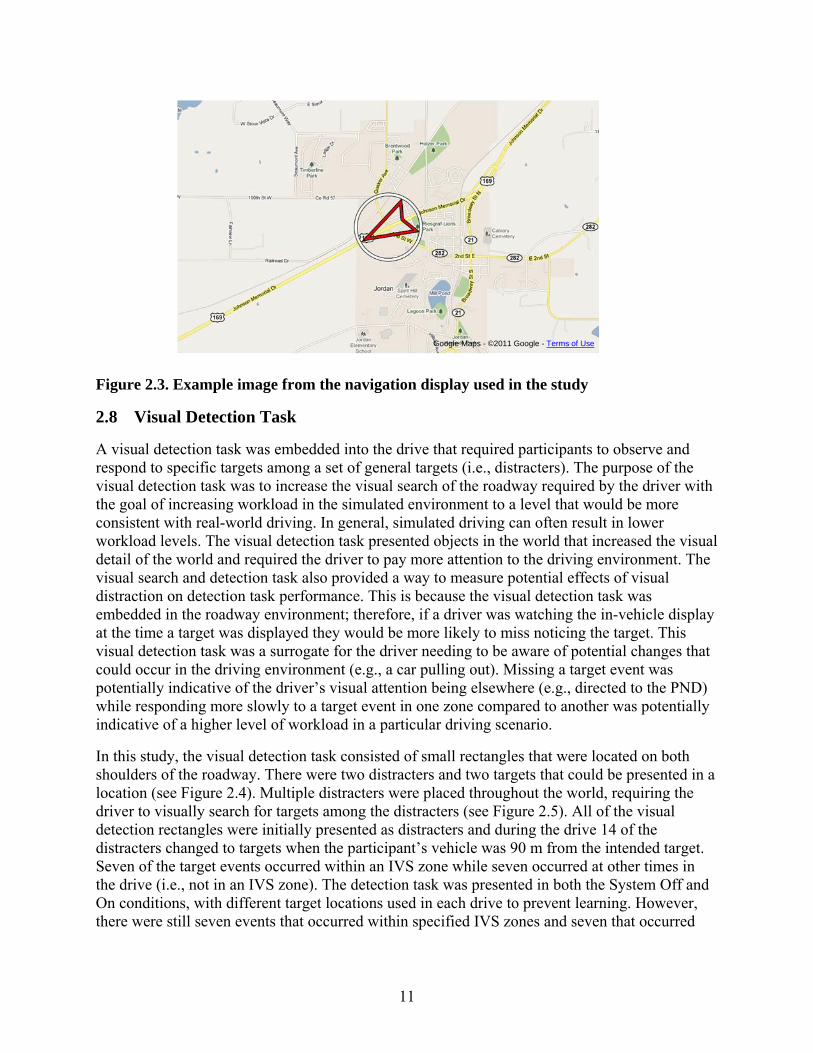
There were limitations in the development of the navigation application for this study. We expected to use a series of images that would display turn-by-turn directions for the selected MN route described above, but the ability to generate these images was beyond the financial scope of this study. Therefore, to generate a navigation display feature that would display the simulated route on the Android phone, we used Google Maps with a moving arrow to indicate the direction the driver was going and their location along the route (see Figure 2.3). Although this display does not incorporate a 45-degree view angle with turn-by-turn route information as would be found in some commercially available navigation devices, it does approximate real-world use of applications, such as Google Maps, among drivers who use smartphone applications for navigation purposes. Auditory “turn-by-turn” style directions were provided to drivers before each turn in the drive for navigation purposes in all driving conditions, whether visual navigation information was provided or not to assist drivers with in-world route navigation.
11
Figure 2.3. Example image from the navigation display used in the study
Google Maps - ©2011 Google - Terms of Use
2.8 Visual Detection Task
A visual detection task was embedded into the drive that required participants to observe and respond to specific targets among a set of general targets (i.e., distracters). The purpose of the visual detection task was to increase the visual search of the roadway required by the driver with the goal of increasing workload in the simulated environment to a level that would be more consistent with real-world driving. In general, simulated driving can often result in lower workload levels. The visual detection task presented objects in the world that increased the visual detail of the world and required the driver to pay more attention to the driving environment. The visual search and detection task also provided a way to measure potential effects of visual distraction on detection task performance. This is because the visual detection task was embedded in the roadway environment; therefore, if a driver was watching the in-vehicle display at the time a target was displayed they would be more likely to miss noticing the target. This visual detection task was a surrogate for the driver needing to be aware of potential changes that could occur in the driving environment (e.g., a car pulling out). Missing a target event was potentially indicative of the driver’s visual attention being elsewhere (e.g., directed to the PND) while responding more slowly to a target event in one zone compared to another was potentially indicative of a higher level of workload in a particular driving scenario.
In this study, the visual detection task consisted of small rectangles that were located on both shoulders of the roadway. There were two distracters and two targets that could be presented in a location (see Figure 2.4). Multiple distracters were placed throughout the world, requiring the driver to visually search for targets among the distracters (see Figure 2.5). All of the visual detection rectangles were initially presented as distracters and during the drive 14 of the distracters changed to targets when the participant’s vehicle was 90 m from the intended target. Seven of the target events occurred within an IVS zone while seven occurred at other times in the drive (i.e., not in an IVS zone). The detection task was presented in both the System Off and On conditions, with different target locations used in each drive to prevent learning. However, there were still seven events that occurred within specified IVS zones and seven that occurred

12
outside IVS zones whether the system was on or off. Both accuracy and response times to targets were measured for the 14 target events.
Figure 2.4. Targets (T1, T2) and distracters (D1, D2) for visual detection task
Figure 2.5. Example of targets and distracters in simulated world Note: Target is circled in red.
2.9 Procedures
Participants completed the informed consent process followed by a demographic questionnaire. Participants had their vision assessed to ensure it met minimum standards for licensing in Minnesota (20/40 corrected or uncorrected) and to ensure their color vision was unimpaired to continue with participation. A generic description of the system information they would potentially encounter during the drive was provided to drivers and a pre-drive usability questionnaire was administered to assess driver’s perceived usefulness and satisfaction with the system’s description prior to driving with it (Van der Lann, Heino & de Waard, 1997; see Appendix A). Participants were then provided with instructions for the practice drives and driving-related tasks. They completed a 5-minute practice drive to become accustomed to the simulator and its controls. Participants were also instructed on how to complete the visual detection task and drove an additional 10-minute practice drive that included several detection events to which they had to respond.
D1 D2 T1 T2

13
Once the practice sessions were completed, participants received instructions for the experimental drives (see Appendix B for Practice Drive and Experimental Drive Instructions). Participants were encouraged to drive “as they normally would” and were not given explicit instructions about maintaining speed limits. They were asked to attend to the IVS or navigation information as needed during their drive. Participants were also told that the route was self-explaining (e.g., could only go one direction at intersections) and that an auditory message alerting them of an upcoming turn would play in advance of any turns they needed to make. Participant drives were counterbalanced so that half the participants in each group drove the System Off condition first while the other half drove the System On condition first. The Off and On conditions were counterbalanced to reduce learning and carry-over effects that can occur during experimental sessions in the simulator (e.g., fatigue in later drives can potentially have an effect on driver behavior; counterbalancing helps balance out any potential effects like this between the system conditions). After each drive, participants completed the NASA-TLX workload questionnaire (Hart & Staveland, 1988; see Appendix C). A five to ten minute break was given between drives to allow the participant to rest. Each experimental drive took approximately 25 minutes to complete. After the experimental drives were completed, the participant completed a series of post-drive questionnaires. Participants completed a Usability Survey and the same Usability Scale questionnaire (see Appendix D) they completed prior to driving with the system to get a post-test rating of system usefulness and satisfaction. Participants were also asked whether they used the system information while driving and to provide reasons for why they did or did not use the information. Once the questionnaires were completed, participants were debriefed, thanked and remunerated for their time.
2.10 Eye Tracking
Two cameras were used to video record each driver’s eye and head position while they were driving. Videos were analyzed post-hoc to evaluate how often each driver looked away from the roadway (i.e., into the vehicle). Two experimenters were trained and calibrated to rate each video using special software that marked the time points when drivers looked away from the roadway and back to it. The number of glances away from the roadway (i.e., into the vehicle, usually towards the PND display), the duration of each glance, and the total time a driver looked away from the roadway during a drive were recorded for analysis. These measures provided a gross assessment of drivers’ looking behavior with respect to the in-vehicle device.
2.11 Data Analysis
Planned comparisons were run on the data for the variables of interest. To assess differences between regular driving (System Off) and when using each system configuration (IVS + Navigation, Navigation, IVS) within each group a paired-comparisons t-test was used. To assess differences between the groups when each configuration of the system was active a one-way analysis of variance was run. Post-hoc tests were used to assess where differences occurred if a significant effect was found using the ANOVA analysis. Differences were considered significant at p < .05.

14
System Off
System On
Road signs present on roadway
Between Conditions Comparison for System On:
1-way ANOVA
IVS + Navigation
System Off
System On
Navigation
System Off
System On
IVS
Figure 2.6. Experimental design showing system conditions and planned comparisons
Within-Subjects Comparisons: t-tests
2.12 Dependent Variables Related to Driving Performance and Distraction
As described in the study design document, the dependent variables of interest related to performance and distraction were:
1. Mean speed: This measured how well drivers adhered to posted speed limits. This measure also served as a potential indication of distraction or workload (e.g., if failure to slow down entering a zone was noted).
2. Standard deviation of lane position (SDLP): This measured the potential for visual distraction in that more variability in lane position can be indicative of a driver looking away from the roadway.
3. Response times to visual detection task: This measured potential distraction. If response times were longer during times when system was displaying IVS information, it meant attention might have been diverted away from the visual detection task and towards the in-vehicle display. Alternatively, it could be an indicator of increased workload in a zone that may or may not be due to the in-vehicle device.
4. Hit rate for visual detection task: This measured how well drivers performed the visual detection task. Distraction may have been present if participants missed more targets when the system was displaying IVS information versus not displaying IVS information.

15
5. Eye Tracking (Total Time Looking Away from Roadway, Total Number of Glances Away from Roadway, Average Glance Duration Away from Roadway): These measures provided a gross assessment of drivers’ looking behavior with respect to the in-vehicle device.
2.13 Dependent Variables Related to System Usability and Workload
Subjective measures were collected to assess the workload associated with using the system information and the usability of the interface.
1. NASA-TLX: Subjective responses to the NASA-RTLX (Hart & Staveland, 1988) were collected after each baseline and system condition drive. The NASA-RTLX consists of six subscales (mental demand, physical demand, temporal demand, effort, performance, frustration) that can be evaluated individually or combined to obtain a total workload score. Each individual scale is marked out of 100. Total workload is the sum of the six subscales divided by 6.
2. Usability Scales: The Usability Scales (Van der Lann, Heino & de Waard, 1997; see Appendices A and D) were administered pre and post-drive to allow for a comparison of hypothetical usability with actual usability of the system. The scale consists of 9 items which are scored and summed to create two scales (Items 1, 3, 7 and 9 make up the “usefulness scores” while Items 2, 4, 6, and 8 make up the “satisfying scores”). Ideally, perceptions of system usefulness and satisfaction will be positive and improve or remain constant with actual use, indicating a satisfactory system design.
3. System Use: This question assessed the degree to which drivers used the system information (and why or why not) while driving.

16

17
Chapter 3. Results
3.1 Driver Performance and Distraction Results
The data analyses were conducted for the within-groups and between-groups effects. Significant effects were correlated to with the time at which drivers had to perform the visual detection secondary task to determine if the effects could have been caused or exacerbated by completing the visual search task versus interacting with any on-screen information displayed at the same time.
3.1.1 Missing Data Due isolated simulator data collection issues, participant data was lost for one participant in the Navigation group (System On and Off data). In addition, data for one drive was missing for five participants. Two participants in the IVS + Navigation group were missing data, one in the Off condition and one in the On condition. Their other drive data was collected. Three participants in the IVS only group were missing data for one drive each, with two participants missing their System Off data and one participant missing their System On data. The small amount of missing data did not negatively affect the outcome of the data analyses.
3.1.2 IVS + Navigation Condition Within the 35 mph speed zone, there was a significant main effect of system status for the IVS + Navigation group, t(17)=-2.65, p=0.017. On average, drivers in this group were traveling faster in the On condition (M=38.95; SD=5.29) than in the Off condition (M=36.65; SD3.26). There were no other tasks (i.e., the visual detection task) occurring during this driving zone indicating that the results were unique to the IVS + Navigation condition. It is not clear if the increased speed in the On condition was due to distraction, but it indicates that drivers were going faster in this zone while there was in-vehicle information displayed on the screen.
3.1.3 Navigation Condition There were several significant performance and/or potential distraction-related results associated with the Navigation condition. For the 55 mph speed zone, drivers in the Navigation condition, on average, had statistically significant faster mean speeds for the On condition (M=64.68; SD=12.04) versus the Off condition (M=61.22; SD=7.12) in the advance notification zone (t(18)=-2.38, p=0.03). There was also a statistically significant difference between the experimental conditions when the system was on, F(2,57)=3.23, p =0.047. Post-hoc testing revealed the significant result was due to drivers in the Navigation (M=64.68; SD=12.04) condition driving faster than those in the IVS Condition (M=58.11; SD=5.17). There was a visual detection task for the On driving conditions (all system conditions when system was active) in the advance notification zone that could have influenced or increased the distraction associated with this condition. The faster mean speeds in the advance zone may have also simply carried over to the speed zone in which there was no visual detection task present for any condition. Within the 55 mph speed zone, there was a statistically significant difference between the system conditions when the system was active for mean speed in the zone, F(2,57)=3.91, p=0.026. Post-hoc testing revealed the difference occurred because drivers in the Navigation condition (M=62.12; SD=10.82) were driving faster than drivers in the IVS + Navigation condition (M=56.26; SD=3.41).

18
The Navigation condition drivers also exhibited statistically significant faster mean speeds in the advance notification portion of the 40 mph speed zone for the On condition (M=47.33; SD=7.81) versus the Off condition (M=42.69; SD=6.80) , t(18)=-2.85, p=0.011. There was no visual detection task during this zone, which means the speed associated with this condition was not associated with completing the secondary task. The increased mean speed for the On only condition for the Navigation group could indicate inattention to the posted road speed, particularly because this condition did not provide in-vehicle information about the road speed and the drivers needed to attend to the roadway to determine the appropriate speed for these zones. However, because speed was not increased in the Off condition, it is possible drivers may have been distracted by the Navigation information and missed the on-road signs in this condition.
The Navigation group also showed statistically significant differences in standard deviation of lane position (SDLP) between the Off and On conditions in a 35 mph curve (t(18)=2.96, p=0.08) and in a construction zone, (t(18)=2.25, p=0.037). In the both zones, SDLP for the Off condition showed increased variability compared to the On condition. In both zones there was a visual detection task associated with the Off condition which could have influenced SDLP (i.e., drivers responding to the task may have poorer lane keeping as they attempt to complete the task). Because the system was not on during the drives that showed increased lane variability, it seems variability in lane position may have simply occurred in this group as they attended to the zone’s requirements (i.e., adjusting speed, searching for road signs, completing the visual detection task in the advance notification zone, etc).
3.1.4 IVS Condition There were three statistically significant performance and/or distraction-related results for the IVS condition (without Navigation information). Within the advance notification zone for the 35 mph speed zone, there was a statistically significant difference in mean speed for the On versus Off status for the IVS condition, t(19)=-2.28, p=0.038. On average, drivers in this group were traveling faster while the system was On (M=45.08; SD=5.30) compared to when the system was Off (M=42.39; SD=5.23). Within the 35 mph speed zone, there was a significant main effect of system status for the IVS group, t(19)=-4.01, p=0.001. The IVS group had a mean speed of 38.97 mph (SD=2.90) in the On condition compared to its Off condition mean speed of 36.86 mph (SD=2.44). There was a visual detection task in the advance notification zone which could have distracted drivers from adjusting their speed appropriately and it is possible this effect carried over into the speed zone for this group. However, because the IVS + Navigation group also experienced increased mean speeds during the 35 mph zone it may be there was an additive effect associated with completing the visual detection task while also attending to in-vehicle information that may have resulted in the drivers failing to adjust their speed appropriately.
In the 30 mph curve left zone, there was a statistically significant difference in SDLP for the On versus Off status for the IVS condition, t(19)=2.39, p=0.027. On average, drivers showed more variability in lane keeping when the system was Off (M=0.20; SD=0.07) compared with when the system was On (M=0.17; SD=0.06). There was a visual detection task present in this Off condition and the results suggest that completing the visual detection task may have influenced lane keeping performance in the curve.
19
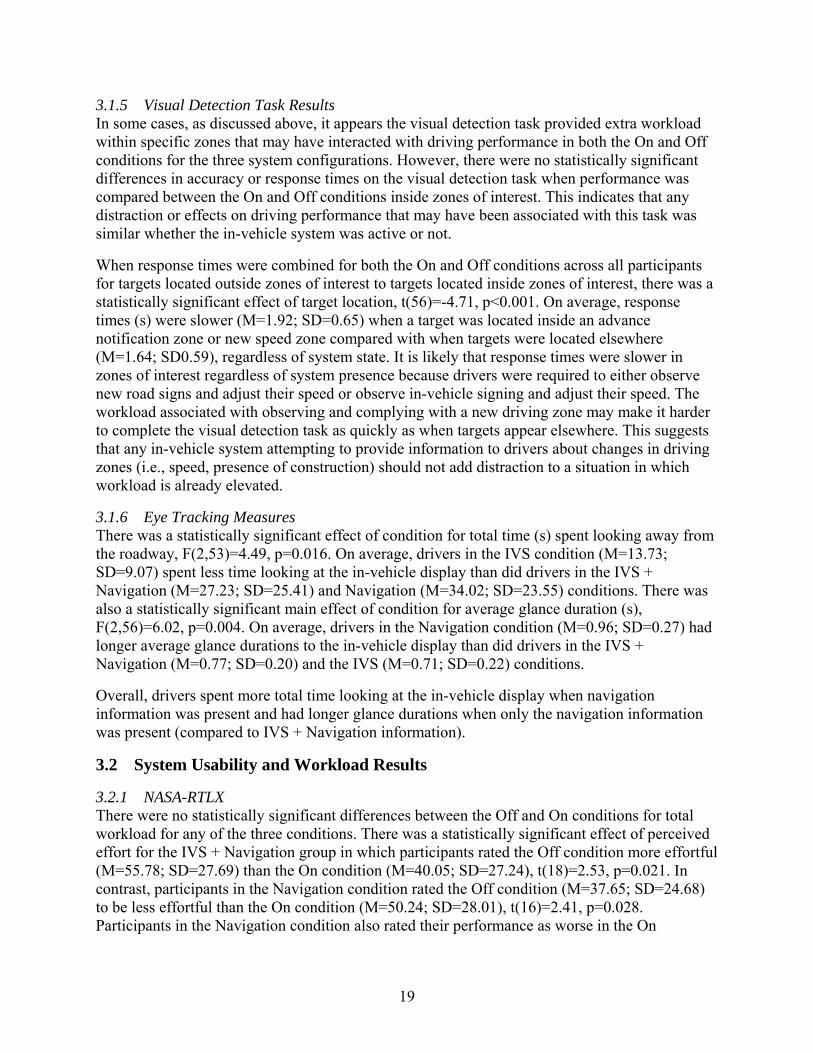
3.1.5 Visual Detection Task Results In some cases, as discussed above, it appears the visual detection task provided extra workload within specific zones that may have interacted with driving performance in both the On and Off conditions for the three system configurations. However, there were no statistically significant differences in accuracy or response times on the visual detection task when performance was compared between the On and Off conditions inside zones of interest. This indicates that any distraction or effects on driving performance that may have been associated with this task was similar whether the in-vehicle system was active or not.
When response times were combined for both the On and Off conditions across all participants for targets located outside zones of interest to targets located inside zones of interest, there was a statistically significant effect of target location, t(56)=-4.71, p<0.001. On average, response times (s) were slower (M=1.92; SD=0.65) when a target was located inside an advance notification zone or new speed zone compared with when targets were located elsewhere (M=1.64; SD0.59), regardless of system state. It is likely that response times were slower in zones of interest regardless of system presence because drivers were required to either observe new road signs and adjust their speed or observe in-vehicle signing and adjust their speed. The workload associated with observing and complying with a new driving zone may make it harder to complete the visual detection task as quickly as when targets appear elsewhere. This suggests that any in-vehicle system attempting to provide information to drivers about changes in driving zones (i.e., speed, presence of construction) should not add distraction to a situation in which workload is already elevated.
3.1.6 Eye Tracking Measures There was a statistically significant effect of condition for total time (s) spent looking away from the roadway, F(2,53)=4.49, p=0.016. On average, drivers in the IVS condition (M=13.73; SD=9.07) spent less time looking at the in-vehicle display than did drivers in the IVS + Navigation (M=27.23; SD=25.41) and Navigation (M=34.02; SD=23.55) conditions. There was also a statistically significant main effect of condition for average glance duration (s), F(2,56)=6.02, p=0.004. On average, drivers in the Navigation condition (M=0.96; SD=0.27) had longer average glance durations to the in-vehicle display than did drivers in the IVS + Navigation (M=0.77; SD=0.20) and the IVS (M=0.71; SD=0.22) conditions.
Overall, drivers spent more total time looking at the in-vehicle display when navigation information was present and had longer glance durations when only the navigation information was present (compared to IVS + Navigation information).
3.2 System Usability and Workload Results
3.2.1 NASA-RTLX There were no statistically significant differences between the Off and On conditions for total workload for any of the three conditions. There was a statistically significant effect of perceived effort for the IVS + Navigation group in which participants rated the Off condition more effortful (M=55.78; SD=27.69) than the On condition (M=40.05; SD=27.24), t(18)=2.53, p=0.021. In contrast, participants in the Navigation condition rated the Off condition (M=37.65; SD=24.68) to be less effortful than the On condition (M=50.24; SD=28.01), t(16)=2.41, p=0.028. Participants in the Navigation condition also rated their performance as worse in the On

20
condition (M=66.82; SD=21.17) compared with the Off condition (M=76.29; SD=17.03), t(16)=2.18, p=0.044.
3.2.2 Usability Scales The usability scales assess drivers’ perceptions of a system’s usefulness and their satisfaction with it both prior to using the system (based on a written description of the system in this study) and after they are able to interact with it while driving. The upper right quadrant of the graph indicates systems that are perceived as useful and satisfying to some degree. Overall, the three interface options were all perceived to be somewhat useful and satisfying both before system use and afterwards (see Figure 3.1). There was a statistically significant drop in perceived usefulness for the IVS + Navigation condition from pre-drive (M=1.02; SD=0.87) to post-drive (M=0.50; SD=1.09), t(19)=2.67, p=0.015. There was also a statistically significant drop in perceived usefulness for the Navigation condition from pre-drive (M=1.33; SD=0.62) to post-drive (M=0.71; SD=1.07), t(15)=2.57, p=0.021. There were no statistically significant changes in how satisfying the drivers rated the IVS + Navigation or the Navigation conditions after use. There were also no statistically significant differences in how drivers perceived the IVS condition pre-drive versus post-drive.
Figure 3.1. Usefulness and satisfying ratings for the three interface options
-2
-1
0
1
2
-2 -1.5 -1 -0.5 0 0.5 1 1.5 2
Use
fuln
ess
Satisfying
IVS + Navigation Pre-Drive IVS + Navigation Post-Drive
IVS Only Pre-Drive IVS Only Post-Drive
Navigation Only Pre-Drive Navigation Only Post-Drive
3.2.3 System Use Overall, drivers in the IVS + Navigation and the IVS conditions reported the most use of the system (see Table 3.1). What is interesting is that even though the Navigation condition reported low usage of the information, they spent more time on average looking at the display and had longer glance durations to the display while driving. This may indicate that drivers were attempting to use the information but were perhaps unable to use it effectively to help them make navigation decisions during the drive thus they reported they did not use the information. The higher reported use of the system information in the other conditions indicates that drivers may have found the in-vehicle signing information to be useful while driving, more so than the navigation information. Comments related to the Navigation only condition indicated that difficulty understanding the information occurred and that some drivers found it distracting.

21
Most of the positive comments about the system information were for the two IVS conditions (see Table 3.2).
Table 3.1. Number of drivers who said they used the system information to help them while driving
Condition Used System Information Did Not Use System Information IVS + Navigation 16 4 Navigation 7 10 IVS 14 6
Table 3.2. Example comments from drivers who said they used the system information for each condition
Condition Examples of Comments for Participants who said they Used the System Information IVS + Navigation • “I used it mostly for the speed limit signs and when speed was about to change”
• “It was nice to have a heads up on speed changes, especially in the construction zones” • “I found it useful because there were times I missed signs…”
Navigation • “Direction, turns- helped me assess what was ahead” • “The only thing that the phone presented for me was a map of the terrain and where I was, which I did
use around curves.” • “I could see when there was an intersection coming up & where I should turn, see big curves ahead of
time, and keep track of where I was in the route.”
IVS • “Most often it served as a confirmation & reminder of the sign I had already seen. Also a reminder that the speed limit was still in effect.”
• “It's nice to give you an assurance of the road sign by stating the speed and when you are in a change of speed.”
• “I'm not always conscious of my speed, big help”

22

23
Chapter 4. Discussion
The goal of this study was to identify if distraction occurred when using IVS information while driving. Overall, results indicated that driving performance (mean speed and lane keeping position) was affected in certain zones for each of the System On conditions. The findings also indicated that there may be some additional visual distraction or workload associated with viewing the in-vehicle information while concurrently performing the visual search task. In particular, the Navigation condition resulted in performance that seemed to indicate less attention to the driving task when the system was On compared to when it was Off. The IVS + Navigation and IVS alone conditions resulted in fewer changes in driving performance when the system was on, particularly with respect to maintaining an appropriate speed within a zone when compared to the Navigation system. Performance compared to the Off conditions was similar between the IVS + Navigation and IVS conditions for most scenarios. Comments from drivers in the two IVS conditions in combination with the subjective usability results indicated that drivers in these conditions found the speed warning information useful in helping them transition to new zones and with adopting the appropriate speed. Moreover, the IVS + Navigation group reported that they found the System On driving condition to be less effortful than the System Off condition, suggesting they not only liked the IVS information but it helped them perceive the driving task to be easier to complete. The IVS condition was also perceived as equally useful and satisfying prior to driving with the system as afterwards, indicating the system performed as expected. In contrast, the usefulness ratings for the IVS + Navigation and Navigation alone conditions decreased after driving with the system. Based on comments from the Navigation group, this may have occurred because drivers did not find the Navigation information useful during the drive, which is very likely related to how the driving route was designed.
It is important to note that the IVS alone condition resulted in the shortest total time looking away from the road compared to the IVS + Navigation and Navigation conditions. This suggests that the more information there is on a display, the more time drivers are likely to spend looking at it. In this study, the navigation information in the IVS + Navigation and Navigation alone conditions were running constantly during the simulated drive in the On conditions. This provided more information to which the driver could choose to attend. In contrast, the IVS condition alone only displayed the IVS information when a zone of interest occurred in the drive otherwise no information was displayed on the screen. In this condition, drivers only had to choose to look at the screen at certain times during the drive when IVS information was present, which likely explains why they spent less time looking at the in-vehicle display than in the other two conditions. The finding that drivers who had Navigation information spent more time looking at the in-vehicle device is consistent with previous research showing that visual route guidance can be a source of visual distraction for drivers (e.g., Dingus et al., 1995). Presenting navigation information in this study provided an understanding of how two types of information may interact when presented on a single display (i.e., continuous information plus intermittent alert information as in the IVS + Navigation condition).
An examination of the performance results and subjective results revealed that the Navigation condition may have produced extra workload on some drivers. For example, drivers in the Navigation condition had longer glance durations to the in-vehicle display than did drivers in the other conditions when the system was On and they also reported that the On driving condition required more effort than the Off condition. Although the average glance duration across the

24
group did not exceed the 2 s or more duration that has been indicated to increase near-crash/crash risk while driving (Klauer et al., 2006), the drivers in the Navigation On condition did demonstrate more changes away from expected driving behavior than the other two conditions. The participant comments indicated that drivers were trying to use the Navigation information but found it difficult to use. This is likely related to the type of information this particular navigation system provided, but it should also be noted that many drivers choose to use navigation applications on their phones that may provide levels of visual distraction similar to the display used in this study (i.e., applications that provide map directions but do not provide turn-by-turn visual or auditory guidance that would potentially be less distracting to use). Overall, the Navigation information displayed in this study was used to control the amount of information on the in-vehicle display and, in this regard, it served its purpose by demonstrating that constant information may result in more time looking away from the roadway than periodic information.
Of further interest is that the combined information condition, IVS + Navigation, did not appear to have the same effect on drivers as the Navigation alone condition. An examination of the post-drive comments indicated that this may have occurred because drivers in the IVS + Navigation condition felt less compelled to view the Navigation information once they were exposed to the IVS information. That is, they felt the IVS information was more important and attended to it as needed and less so to the Navigation information. In contrast, comments from the Navigation condition indicated that because this was the only information available to the drivers in that condition that they felt they needed to try to attend to it. This is likely an artifact of the experimental process because drivers knew they were in an experiment using an informational device and, therefore, may have felt compelled to attend to certain information on the display even though the instructions did not require them to use the information unless they needed/wanted to use it. In this case, the Navigation group may have felt they should attend to the Navigation information while the IVS + Navigation group may have felt it was more important to attend to the IVS information and may have relied less heavily on the visual Navigation information. Therefore, although the Navigation condition provided a starting point for understanding the potential effects of combining information on one display (continuous navigation information with periodic sign alerts), it did not provide the expected benefit of determining whether additional distraction was associated with the IVS system above and beyond the potential distraction caused by the navigation information. In fact, the results from the IVS only group indicated that IVS information alone was not as distracting.
Finally, performance on the visual detection task that was embedded into the driving environment indicated that transitions into new zones on the roadway, in general, may result in higher workload among drivers (as reflected in longer response times to targets in the zones of interest compared to elsewhere in the drive regardless of system state). This is an important finding because some of the negative driving performance results occurred for the System On conditions when a visual detection task was also present in a zone of interest. This suggests that a transition in the driving environment provided a load on the driver in general (regardless of roadway conditions, etc) while the detection task in this study added an additional load on the driver in a manner similar to how a higher workload driving environment might do so (e.g., such as if a road were busy with other cars of pedestrians). When a driver is then further required to attend to in-vehicle information in this type of condition, there may be an additive effect of the workload associated with transition zones, with attending to additional external visual
25
information (e.g., cars, pedestrians, construction workers/vehicles), and with attending to the in-vehicle information.
Because the IVS information is intended to assist drivers with making safer transitions into these zones, it is important that the information be displayed in a manner that mitigates the workload associated with a zone transition and other external information. In this study, the school, construction and speed zones all had an advance notification zone prior to entry into the new speed zone. In a few of these zones, the Navigation and the IVS conditions showed higher mean speeds in the advance notification zones when the system was On compared to when it was Off. Although the speeds associated with these results were near or at the posted speed limit for the zone, it may indicate that drivers attending to Navigation or IVS information were slower to adjust their speeds as they approached the new speed zone (i.e., drivers should be at the new speed as they enter the new zone) than they were when the system was Off and there was no in-vehicle information requiring attention. If this is the case, it suggests that drivers were either using the IVS information differently than they did road signs (e.g., choosing not to slow down until later in the zone) or they were temporarily distracted by the information and, as a result, adjusted their speeds later in the zone than when attending to just the road sign.
4.1 Limitations of the Study
Simulated driving does not pose the same risks that real-world driving does and can sometimes results in lower workload demands on the driver than real-world driving. In an attempt to ensure adequate workload levels during this simulated drive, a visual search and detection task was incorporated into the environment. There can also be experimental effects that occur because drivers know they are participating in an experiment and may attempt to behave as they feel they are expected to behave. For example, this might have occurred with the Navigation condition in this study, in which drivers may have felt compelled to try to use the navigation information but were unable to do so in the end without finding it distracting or difficult to comprehend. This was likely an effect due to the study instructions that indicated to drivers that an informational system would be located in the vehicle that they could choose to use while driving and some drivers may have felt they should use the navigation information given the absence of other information on the PND screen. However, despite certain limitations inherent to simulated driving, the study results indicated that workload was reasonably managed by the inclusion of the visual search and detection task and that all System On conditions showed one or more small distraction-related effects. Therefore, it is important to note that small visual distraction effects in a controlled simulator environment where perceived risks are low could translate to larger performance and safety issues when using such a system in the real world.

26
27
Chapter 5. Conclusions
Overall, the project was able to partially identify some of the driver effects that can occur when using a commercially available navigation device with in-vehicle signing (IVS) information included. Several conclusions can be drawn from the results of this study:
• In general, several effects were found across the System On conditions that point to potential distraction when using the system information when the navigation information is present.
• Providing only IVS information on the screen without another source of information appeared to result in drivers having their eyes on the PND screen for shorter time periods than the other two conditions. The periodic display of the IVS information without an additional continuous information source, such as the navigation information, logically means drivers will spend less time attending to the PND screen.
• The in-vehicle signing information was perceived as useful to drivers in this study and the subjective usability results indicated they found it helpful and that it made the driving task seem less effortful. The subjective results of the study justify the goals of the IVS application in providing advance notification of a new driving zone.
• Performance on the visual detection task indicated that transition zones where drivers are entering a new speed zone can result in increased workload for the driver in general (i.e., performance did not appear to be increasingly or decreasingly affected by the presence or absence of in-vehicle information). This finding also supports the goal of the IVS application in providing advance notification to drivers in transition zones. It is hoped that advance notification of new driving zones will help drivers adopt new speeds and be more attentive to the driving environment when transitioning to the new zone.
• Overall, the IVS information as provided in this study could provide a small level of additional workload or distraction prior to entering a transition zone, but it might be outweighed by the benefit of having advance notification of a change in driving situation.

28
29
References
Bayly, M., Young, K.L., Regan, M.A. (2009). “Sources of distraction inside the vehicle and their effects on driving performance.” In M.A. Regan, J.D. Lee, K.L. Young (Eds.), Driver Distraction: Theory, Effects and Mitigation (pp. 191-214). Boca Raton, FL: CRC Press.
Dingus, T.A., Hulse, M.C., Mollenhauer, M.A., Fleischman, R.N., McGehee, D.V., Manakkal, N. (1997). “Effects of age, system experience, and navigation technique on driving with an advanced traveler information system.” Human Factors, 39(2), 177-199.
Engstrom, J., Johansson, E., Ostlund, J. (2005). “Effects of visual and cognitive load in real and simulated driving.” Transportation Research Part F, 8(2), 97-120.
Funke, G., Matthews, G., Warm, J.S., Emo, A.K. (2007). “Vehicle automation: A remedy for driver stress?” Ergonomics, 50(8), 1302-1323.
Hart, S.G., Staveland, L.E. (1988). “Development of a multi-dimensional workload rating scale: Results of empirical and theoretical research.” In P. A. Hancock, N. Meshkati (Eds.), Human Mental Workload (pp. 139-183). Amsterdam, Netherlands: Elsevier.
Klauer, S.G., Dingus, T.A., Neale, V.L., Sudweeks, J.D., Ramsey, D.J. (2006). The impact of driver inattention on near-crash/crash risk: An analysis using the 100-car naturalistic driving study data (DOT HS 810 594). Washington, D.C.: United States Department of Transportation.
Lee, J.D., Young, K.L., Regan, M.A. (2009). “Defining driver distraction.” In M.A. Regan, J.D. Lee, K.L. Young (Eds.), Driver Distraction: Theory, Effects and Mitigation (pp. 31-40). Boca Raton, FL: CRC Press.
Strayer, D.L., Drews, F.A., Johnston, W.A. (2003). “Cell phone-induced failures of visual attention during simulated driving.” Journal of Experimental Psychology: Applied, 9(1), 23-32.
Van der Lann, J.D., Heino, A., de Waard, D. (1997). “A simple procedure for the assessment of acceptance of advance transport telematics.” Transportation Research Part C, 5(1), 1–10.
Young, K.L., Regan, M.A., Lee, J.D. (2009). “Measuring the effects of driver distraction: Direct driving performance methods and measures.” In M.A. Regan, J.D. Lee, K.L. Young (Eds.), Driver Distraction: Theory, Effects and Mitigation (pp. 85-106). Boca Raton, FL: CRC Press.

Appendix A. Pre-Drive Usability Questionnaire

A-1
System Usability Questionnaire (Pre-Drive)
System Description: Today you will be driving with an in-vehicle information system that can provide roadway information to assist you with driving decisions. This system runs on a smartphone and uses visual icons to indicate changes in the speed limit as well as upcoming curves, construction zones and school zones (see example below). This information will be provided within a reasonable distance of the actual road sign and is intended to help you better identify these traffic zones and situations so you can respond accordingly. Based on this description of the system and how it operates, please complete the questionnaire below.
Example of the system’s information that shows an upcoming change in the speed limit.
Once you have read and understood this system description, please complete the questionnaire on the next page.
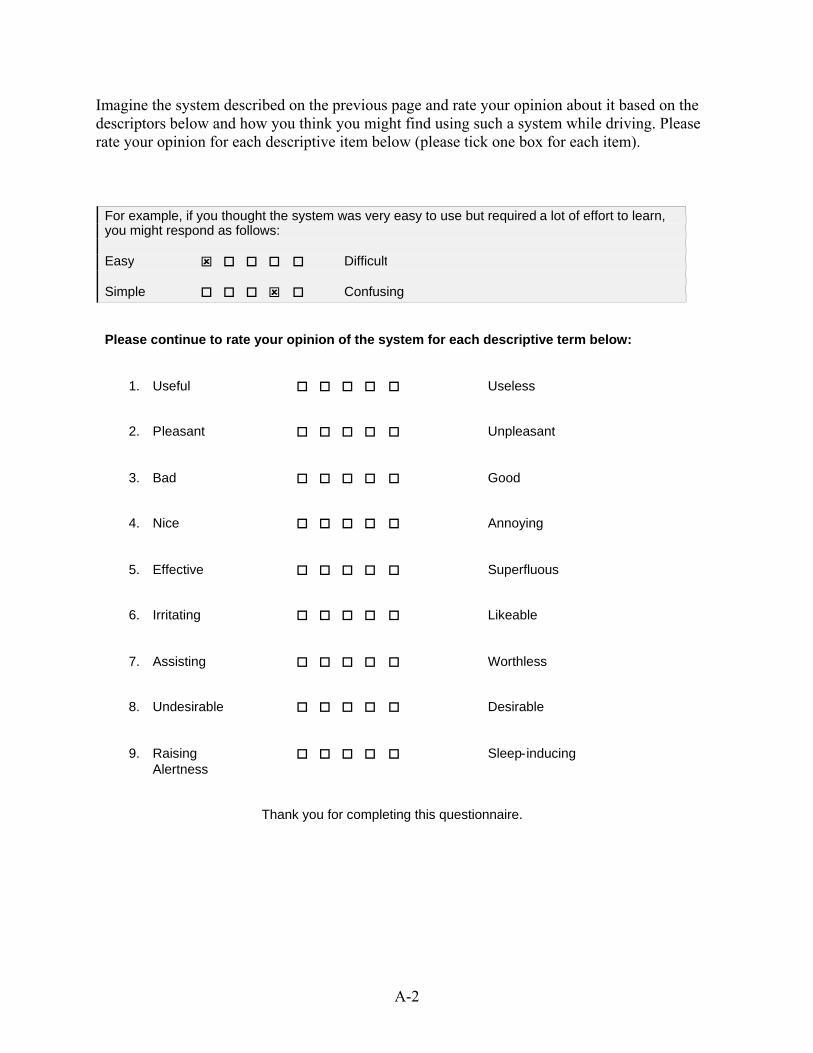
A-2
Imagine the system described on the previous page and rate your opinion about it based on the descriptors below and how you think you might find using such a system while driving. Please rate your opinion for each descriptive item below (please tick one box for each item).
For example, if you thought the system was very easy to use but required a lot of effort to learn, you might respond as follows: Easy Difficult Simple Confusing Please continue to rate your opinion of the system for each descriptive term below:
1. Useful Useless
2. P leasant Unpleasant
3. Bad Good
4. Nice Annoying
5. Effective Superfluous
6. Irritating Likeable
7. Assisting Worthless
8. Undesirable Desirable
9. Raising Sleep - inducing Alertness
Thank you for completing this questionnaire.

Appendix B. Practice and Experimental Drive Instructions

B-1
Practice Drives – Instructions
1. Practice Drive 1: “This first drive will take about 5 minutes and will be used to get you familiar with how the simulator works and feels while you are driving. The goal is to drive as you normally would and just get a feel for how the simulator feels in comparison to real driving. It will not feel just like ‘real driving’ and that is ok. The aim is simply to get familiar with how it feels so you are comfortable with accelerating, stopping, and other driving maneuvers.”
2. Practice Drive 2: “The second practice drive will also take about 5-10 minutes to complete. During this drive you will not only drive the vehicle but will complete a visual detection task. There will be colored rectangles located along the left and right side of the road. There are targets and non-targets. When you see one of the targets, you will respond by pushing the button on the steering wheel. The goal is to respond as soon as possible after you identify a target. You also want to try to be as accurate as possible (i.e., only responding to targets).
There are two targets you are looking for: a rectangle with a BLACK TOP or a rectangle with a GREEN BOTTOM. If you see either of these, you should push the button on the steering wheel as quickly as possible. You only have to see one at a time. We recommend that you keep your thumb on the steering wheel button during the drive so you are able to respond quickly when you see a target. There will be other rectangles in the driving environment that are not targets. Your job is to find the targets and respond only if you see a target (BLACK TOP or GREEN BOTTOM only). “
Show picture of targets. Show Steering Wheel button.

B-2
Experimental Drives – Instructions
Baseline Drive
“In this drive, you will be driving on highways and on town streets. The drive takes approximately 25 minutes to complete. Your goal is to drive as you normally would in the real world. You will be guided through the route by barricades on the roadway that will allow you to only go one direction at an intersection or interchange (e.g., construction barriers, etc). There will also be an auditory instruction advising you of the next turn prior to needing to turn. You will need to pay attention to these in order to follow the route. The turns can be a bit tight so make sure to slow down appropriately to make the turns. During this drive you will also be completing the visual search task that you practiced during the practice session. Please identify targets by pressing the button on the steering wheel as soon as you detect a target. Your goal is to respond as quickly and accurately as possible when you see one of the targets appear.” Show participants the targets again (BLACK TOP or GREEN BOTTOM) and remind them to keep their thumb on the button so they can respond quickly. Ask participant if they have any questions. If not, start the appropriate drive (refer to order list for participant). IVS +Navigation OR Navigation OR IVS Drive
“In this drive, you will be driving on highways and on town streets. The drive takes approximately 25 minutes to complete. Your goal is to drive as you normally would in the real world. You will be guided through the route by barricades on the roadway that will allow you to only go one direction at an intersection or interchange. There will also be an auditory instruction indicating an upcoming turn prior to reaching a turn. You will need to pay attention to these in order to follow the route. During this drive you will notice there is a cell phone mounted on the center console that may display information about road signs or navigation. The information this system provides is designed to help you better identify changes in the driving environment. You are encouraged to use this information as needed during the drive. During this drive you will also be completing the visual search task that you practiced during the practice drives. Please identify targets by pressing the button on the steering wheel as soon as you detect a target. Your goal is to respond as quickly and accurately as possible when you see one of the targets appear.” Show participants the targets again (BLACK TOP or GREEN BOTTOM) and remind them to keep their thumb on the button so they can respond quickly. Ask participant if they have any questions. If not, start the appropriate drive (refer to order list for participant).

Appendix C. NASA-RTLX Workload Questionnaire
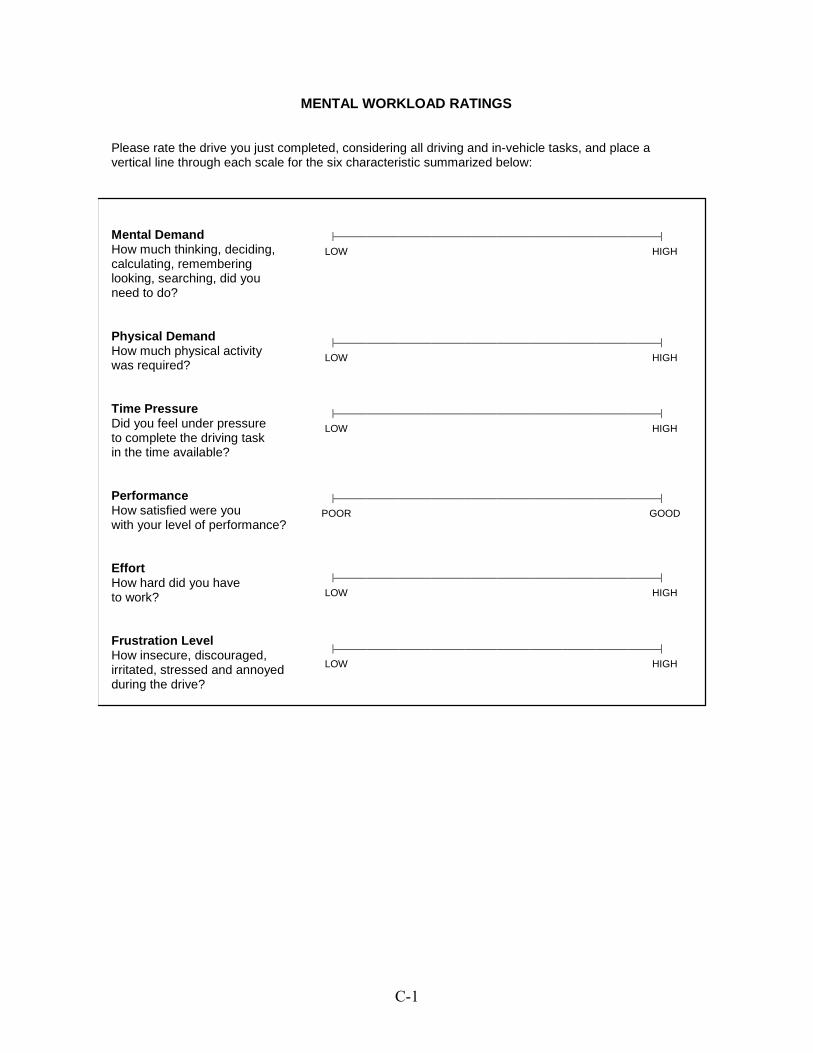
C-1
MENTAL WORKLOAD RATINGS Please rate the drive you just completed, considering all driving and in-vehicle tasks, and place a vertical line through each scale for the six characteristic summarized below: Mental Demand How much thinking, deciding, calculating, remembering looking, searching, did you need to do? Physical Demand How much physical activitywas required?
Time Pressure Did you feel under pressure to complete the driving task in the time available? Performance How satisfied were you with your level of performance? Effort How hard did you have to work? Frustration Level How insecure, discouraged, irritated, stressed and annoyed during the drive?
LOW HIGH
LOW HIGH
LOW HIGH
POOR GOOD
LOW HIGH
LOW HIGH

Appendix D. Post-Drive Usability and Use Questionnaire

D-1
System Usability Questionnaire (post-drive)
Now that you have driven with the in-vehicle information system, please rate your opinion of it based on your experiences driving with it. Please rate your opinion for each descriptive item below (please tick one box for each item).
For example, if you thought the system was very easy to use but required a lot of effort to learn, you might respond as follows: Easy Difficult Simple Confusing Please continue to rate your opinion of the system for each descriptive term below:
1. Useful Useless
2. Pleasant Unpleasant
3. Bad Good
4. Nice Annoying
5. Effective Superfluous
6. Irritating Likeable
7. Assisting Worthless
8. Undesirable Desirable
9. Raising Sleep-inducing Alertness

D-2
System Use Question
Did you use the information presented on the in-vehicle device to help you identify changes in the driving environment (i.e., changes in speed limit)?
___Yes
___No
If “yes”, please explain what information you used or how you used the information to change your driving behavior. If “no”, please explain why you did not use the information presented on the sign.