connect the dots - macrobusiness · 2016. 3. 8. · live webcast hosted by: jeffrey gundlach chief...
TRANSCRIPT

Live Webcast hosted by:
Jeffrey Gundlach
Chief Executive Officer
March 8, 2016
Connect the Dots
1
Fund Offerings
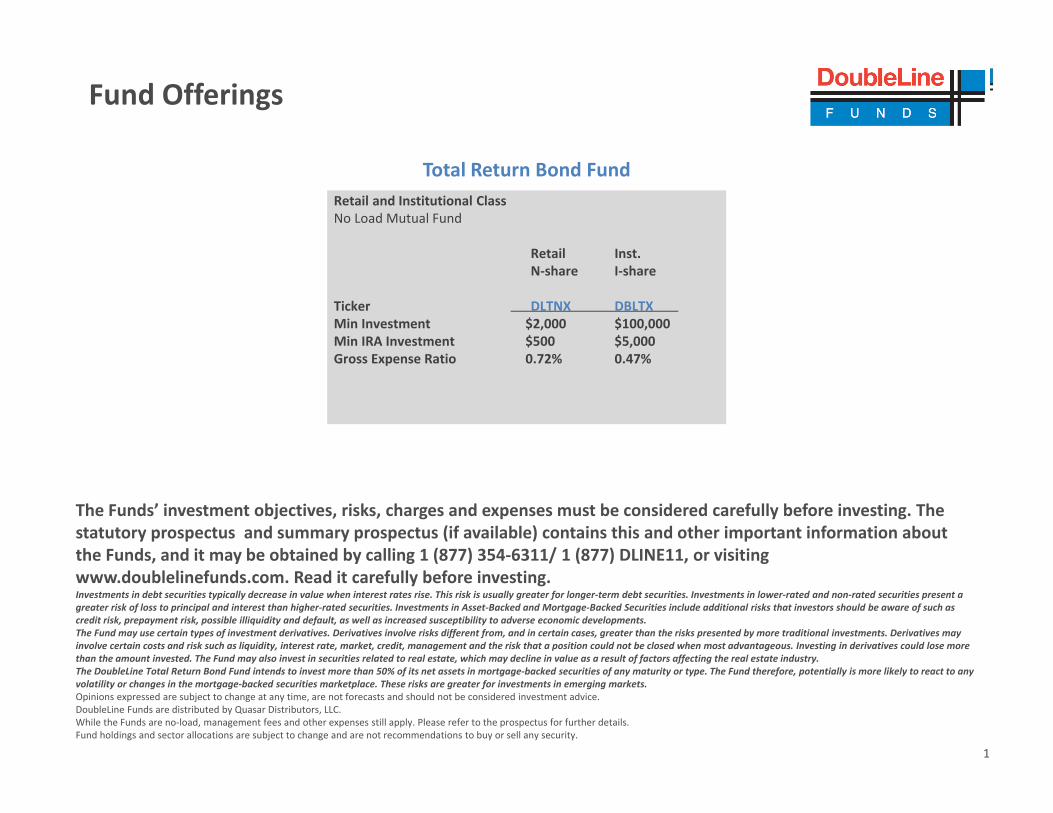
The Funds’ investment objectives, risks, charges and expenses must be considered carefully before investing. The statutory prospectus and summary prospectus (if available) contains this and other important information about the Funds, and it may be obtained by calling 1 (877) 354‐6311/ 1 (877) DLINE11, or visiting www.doublelinefunds.com. Read it carefully before investing.Investments in debt securities typically decrease in value when interest rates rise. This risk is usually greater for longer‐term debt securities. Investments in lower‐rated and non‐rated securities present a greater risk of loss to principal and interest than higher‐rated securities. Investments in Asset‐Backed and Mortgage‐Backed Securities include additional risks that investors should be aware of such as credit risk, prepayment risk, possible illiquidity and default, as well as increased susceptibility to adverse economic developments.The Fund may use certain types of investment derivatives. Derivatives involve risks different from, and in certain cases, greater than the risks presented by more traditional investments. Derivatives may involve certain costs and risk such as liquidity, interest rate, market, credit, management and the risk that a position could not be closed when most advantageous. Investing in derivatives could lose more than the amount invested. The Fund may also invest in securities related to real estate, which may decline in value as a result of factors affecting the real estate industry.The DoubleLine Total Return Bond Fund intends to invest more than 50% of its net assets in mortgage‐backed securities of any maturity or type. The Fund therefore, potentially is more likely to react to any volatility or changes in the mortgage‐backed securities marketplace. These risks are greater for investments in emerging markets.Opinions expressed are subject to change at any time, are not forecasts and should not be considered investment advice.DoubleLine Funds are distributed by Quasar Distributors, LLC.While the Funds are no‐load, management fees and other expenses still apply. Please refer to the prospectus for further details.Fund holdings and sector allocations are subject to change and are not recommendations to buy or sell any security.
Retail and Institutional ClassNo Load Mutual Fund
Retail Inst.N‐share I‐share
Ticker DLTNX DBLTXMin Investment $2,000 $100,000Min IRA Investment $500 $5,000Gross Expense Ratio 0.72% 0.47%
Total Return Bond Fund
2
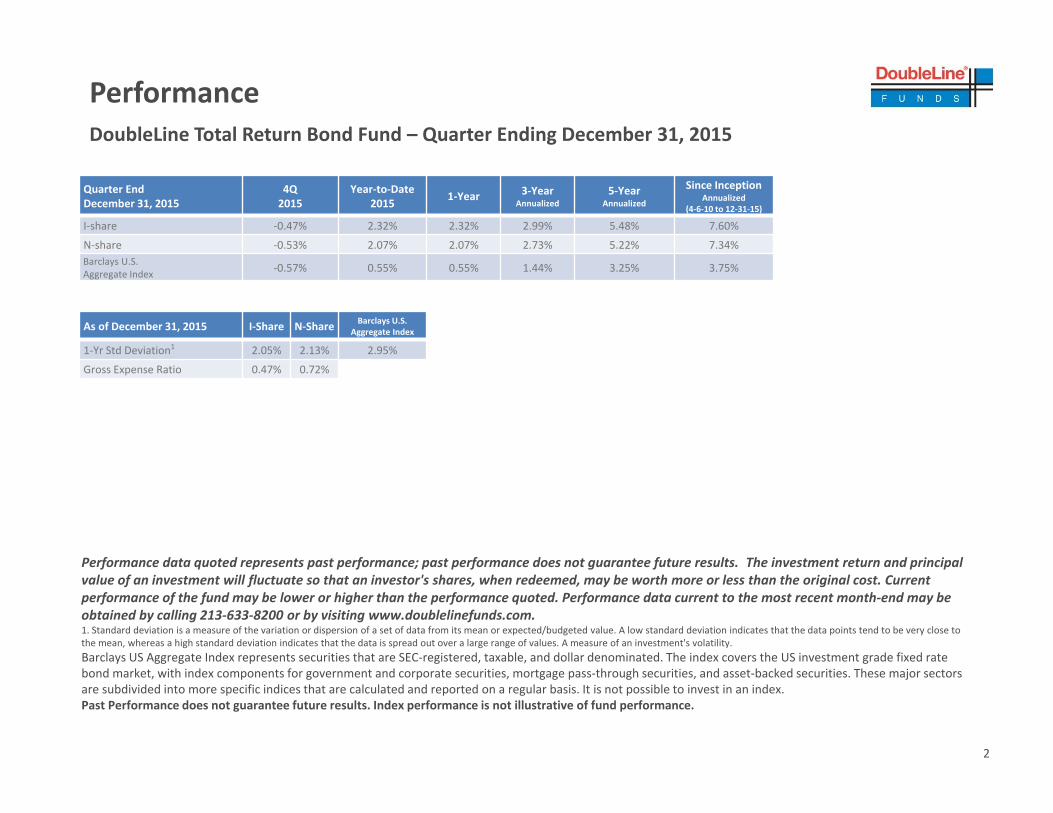
PerformanceDoubleLine Total Return Bond Fund – Quarter Ending December 31, 2015
Performance data quoted represents past performance; past performance does not guarantee future results. The investment return and principal value of an investment will fluctuate so that an investor's shares, when redeemed, may be worth more or less than the original cost. Current performance of the fund may be lower or higher than the performance quoted. Performance data current to the most recent month‐end may be obtained by calling 213‐633‐8200 or by visiting www.doublelinefunds.com. 1. Standard deviation is a measure of the variation or dispersion of a set of data from its mean or expected/budgeted value. A low standard deviation indicates that the data points tend to be very close to the mean, whereas a high standard deviation indicates that the data is spread out over a large range of values. A measure of an investment's volatility.Barclays US Aggregate Index represents securities that are SEC‐registered, taxable, and dollar denominated. The index covers the US investment grade fixed rate bond market, with index components for government and corporate securities, mortgage pass‐through securities, and asset‐backed securities. These major sectors are subdivided into more specific indices that are calculated and reported on a regular basis. It is not possible to invest in an index.Past Performance does not guarantee future results. Index performance is not illustrative of fund performance.
Quarter EndDecember 31, 2015
4Q2015
Year‐to‐Date2015 1‐Year 3‐Year
Annualized5‐Year
Annualized
Since InceptionAnnualized
(4‐6‐10 to 12‐31‐15)
I‐share ‐0.47% 2.32% 2.32% 2.99% 5.48% 7.60%
N‐share ‐0.53% 2.07% 2.07% 2.73% 5.22% 7.34%Barclays U.S. Aggregate Index ‐0.57% 0.55% 0.55% 1.44% 3.25% 3.75%
As of December 31, 2015 I‐Share N‐Share Barclays U.S.Aggregate Index
1‐Yr Std Deviation1 2.05% 2.13% 2.95%
Gross Expense Ratio 0.47% 0.72%

3
Upcoming Webcast Announcements
Rising Rates Webcast– March 23, 2016Portfolio Managers will discuss Low Duration Bond Fund, Low Duration Emerging Markets Fund and Floating Rate FundGo to www.doublelinefunds.com, Home page under “Events”2016 Webcast Schedule to register1:15 pm PDT/4:15 pm EDT
Asset Allocation Webcast– April 12, 2016Jeffrey Gundlach will discuss Core Fixed Income and Flexible Income FundsGo to www.doublelinefunds.com, Home page under “Events”2016 Webcast Schedule to register1:15 pm PDT/4:15 pm EDT
Strategic Commodities Fund Webcast– April 26, 2016Jeffrey Sherman will hostStrategic Commodity Fund webcast titled “Commodities: Time to Revisit?”Go to www.doublelinefunds.com, Home page under “Events”2016 Webcast Schedule to register1:15 pm PDT/4:15 pm EDT
To Receive Presentation Slides:You can email [email protected]

Live Webcast hosted by:
Jeffrey Gundlach
Chief Executive Officer
March 8, 2016
Connect the Dots

5
TAB I – The Fed

6
Fed’s Dot Plot
Source: foreXlive “FOMC dot plot and central tendencies” December 16, 2015FOMC = Federal Open Market Committee

7
Market Implied Central Bank ExpectationsAs of 3/1/16
Source: DoubleLine; Morgan StanleyBPS = basis point.
‐50
‐40
‐30
‐20
‐10
0
10
20
30
Federal Reserve
European Central Bank
Bank of England
Bank of Canada
Reserve Bank of Australia
Reserve Bank of New
Zealand
Swiss National Bank
Norges Bank
Riksbank Bank of Japan
BPS
Market Implied Central Bank Expectations
Mar‐16
Jun‐16
Sep‐16
Dec‐16
8
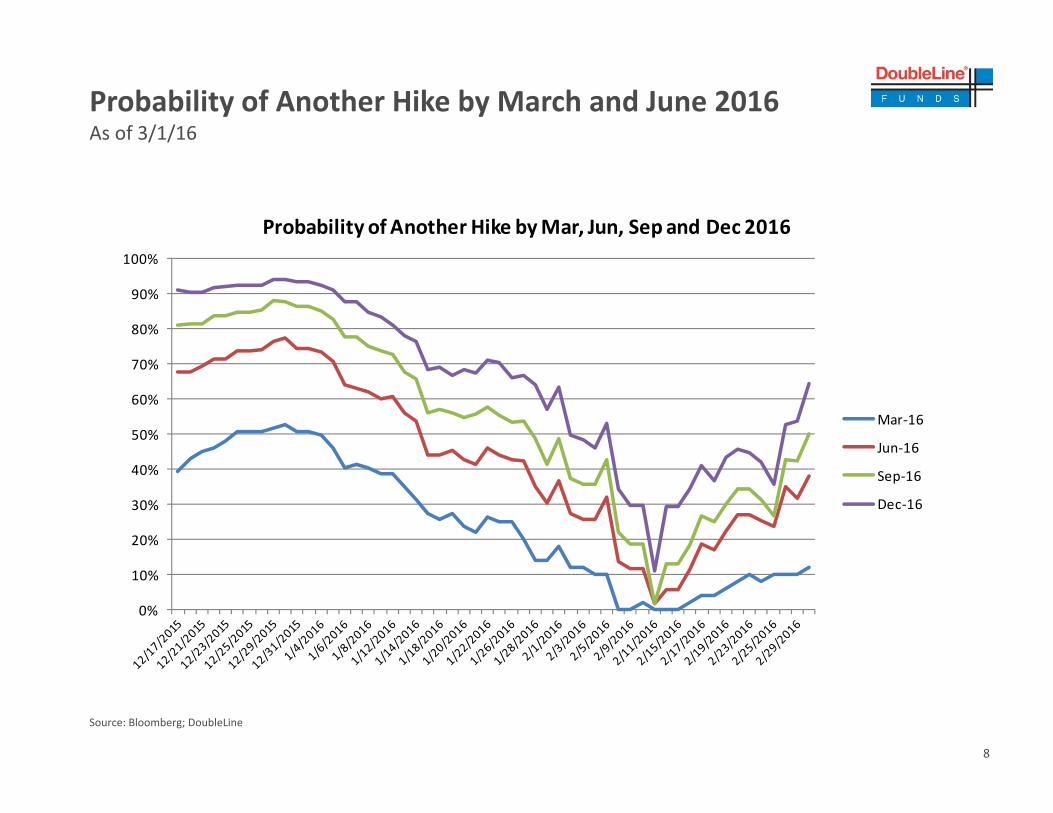
Probability of Another Hike by March and June 2016As of 3/1/16
Source: Bloomberg; DoubleLine
0%
10%
20%
30%
40%
50%
60%
70%
80%
90%
100%
Probability of Another Hike by Mar, Jun, Sep and Dec 2016
Mar‐16
Jun‐16
Sep‐16
Dec‐16
9
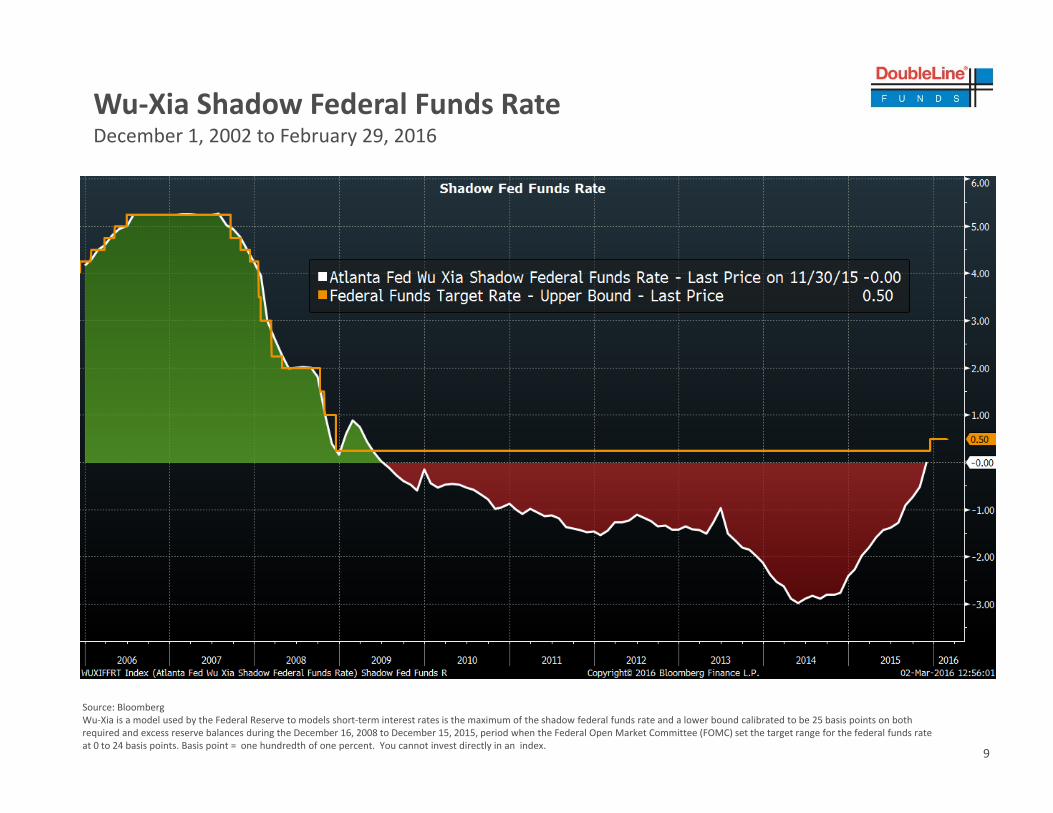
Wu‐Xia Shadow Federal Funds RateDecember 1, 2002 to February 29, 2016
Source: BloombergWu‐Xia is a model used by the Federal Reserve to models short‐term interest rates is the maximum of the shadow federal funds rate and a lower bound calibrated to be 25 basis points on both required and excess reserve balances during the December 16, 2008 to December 15, 2015, period when the Federal Open Market Committee (FOMC) set the target range for the federal funds rate at 0 to 24 basis points. Basis point = one hundredth of one percent. You cannot invest directly in an index.

10
Wu‐Xia Shadow Federal Funds RateAs of February 29, 2016
‐4
‐3
‐2
‐1
0
1
2
3
4
5
‐40 ‐35 ‐30 ‐25 ‐20 ‐15 ‐10 ‐5 0 5 10 15 20 25 30 35 40
PCT Ch
ange
Months Around Fed Tightening
Effective Fed Funds during Previous Hiking Cycles (*2014‐2016 Hiking cycle proxied from Wu‐Xia Shadow Rate)
1994‐1995
1999‐2000
2004‐2006
2014‐2016
Source: Bloomberg, DoubleLineWu‐Xia is a model used by the Federal Reserve to models short‐term interest rates is the maximum of the shadow federal funds rate and a lower bound calibrated to be 25 basis points on both required and excess reserve balances during the December 16, 2008 to December 15, 2015, period when the Federal Open Market Committee (FOMC) set the target range for the federal funds rate at 0 to 24 basis points. Basis point = one hundredth of one percent. PCT = percent. You cannot invest directly in an index.
11
‐6%
‐4%
‐2%
0%
2%
4%
6%
8%
10%
GDP Ye
ar ‐o
ver‐Ye
ar % Cha
nge
Decem
ber 3
1, 199
9 ‐D
ecem
ber 3
1, 201
5
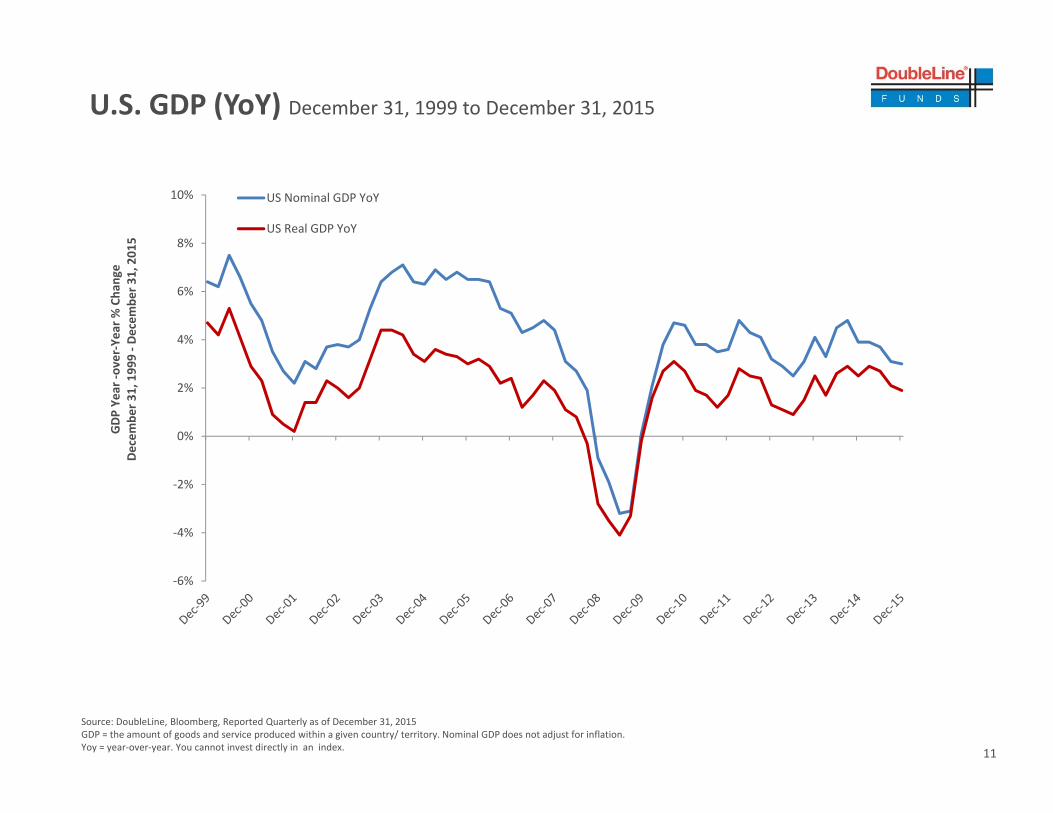
US Nominal GDP YoY
US Real GDP YoY
Source: DoubleLine, Bloomberg, Reported Quarterly as of December 31, 2015GDP = the amount of goods and service produced within a given country/ territory. Nominal GDP does not adjust for inflation.Yoy = year‐over‐year. You cannot invest directly in an index.
U.S. GDP (YoY) December 31, 1999 to December 31, 2015

12
ISM Manufacturing and Non‐Manufacturing PMIAs of 2/29/16
30
35
40
45
50
55
60
65ISM Manufacturing and Non‐Manufacturing PMI
Recession
Manufacturing
Services
Source: Bloomberg, DoubleLineISM Manufacturing index is based on surveys of more than 300 manufacturing firms by the institute of Supply Management. ISM Non‐Manufacturing is an index of more than 400 non‐manufacturing firms’ purchasing and supply executives within 60 sectors across the nation. Survey conducted by the Institute of Supply & Management (ISM). Non‐Manufacturing PMI = A composite index calculated as an indicator of the overall economic condition for the non‐manufacturing sector of the U.S. economy. PMI = Purchasing Managers Index tracks economic data. You cannot invest directly in an index.

13
2s10s Spread and Fed Hiking CyclesJune 30, 1976 through June 30, 2015
Source: Bloomberg Financial Services, DoubleLine Capital LP2s = U.S. 2 Year Treasury Bond. 10s = 10 year U. S. Treasury bond. QE Taper = quantitative easing tapering or stopping of the government bond buying program. Avg = average. You cannot invest directly in an index.

14
Recession Indicator: U.S. Unemployment Rate and the 12‐month Moving AverageMarch 31, 1949 to February 22, 2016
Source: Atlanta Fed, Bloomberg, DoubleLineUS Unemployment Rate (USURTOT) = U‐3 U.S. Unemployment rate total in labor force seasonally adjusted tracks the number of unemployed persons as a percentage of the labor force. These figures generally come from household labor force survey. SMAVG = 12 month moving average. You cannot invest directly in an index.

15
TAB II – Global Economy

16
Global GDP ForecastsYear End 2015 and Forecast for 2016
Source: Hands on Turkish, G20 Talks in Turkey as of November 19, 2015GDP = The amounts of good and services produced within a given country. UK = United Kingdom. You cannot invest directly in an index.

17
Quantitative Easing vs. Quantitative TaperingDecember 31, 2008 through January 31, 2016
ECB = European Central Bank, BoJ = Bank of Japan, EM = Emerging Markets, CB =Central Bank, bn = billion, QE = Quantitative Easing is an unconventional monetary policy in which a central bank purchases government securities or other securities form the market in order to lower interest rates and increase money supply. QT = Quantitative tapering = Refers to the reduction of the Federal Reserve’s quantitative easing or bond buying program. You cannot invest directly in an index.

18
U.S. and Japan 2s10s and Recession
‐2
0
2
4
6
8
10
9/1/90
9/1/91
9/1/92
9/1/93
9/1/94
9/1/95
9/1/96
9/1/97
9/1/98
9/1/99
9/1/00
9/1/01
9/1/02
9/1/03
9/1/04
9/1/05
9/1/06
9/1/07
9/1/08
9/1/09
9/1/10
9/1/11
9/1/12
9/1/13
9/1/14
9/1/15
US 2s10s and US Recessions
NBER Recession 2s10s 10y UST
‐1
0
1
2
3
4
5
6
7
8
9
9/1/90
9/1/91
9/1/92
9/1/93
9/1/94
9/1/95
9/1/96
9/1/97
9/1/98
9/1/99
9/1/00
9/1/01
9/1/02
9/1/03
9/1/04
9/1/05
9/1/06
9/1/07
9/1/08
9/1/09
9/1/10
9/1/11
9/1/12
9/1/13
9/1/14
9/1/15
Japan 2s10s and Japan Recessions
OECD Japan Recession 2s10s 10y JGB
Source: Bloomberg, DoubleLineNBER Recession = Is a monthly concept that takes account of a number of monthly indicators, such as employment, personal income and industrial production as well as quarterly GDP growth. 2s10s is the spread between 2‐year U. S Treasuries and 10 Year U.S. Treasuries. 10y UST = 10 year U.S. Treasury bonds. 10yJGB = 10 year Japanese bonds. OECD = Organization for Economic Cooperation and Development is a group of 30 countries that discuss and develop economic and social policy. You cannot invest directly in an index.
%%

19
ECB Monetary Policy Announcements and USDEUR and Eurostoxx 50 Performance (3 months Leading Up to and 3 months Proceeding Central Bank Announcements)
Source: Bloomberg; DoubleLine as of date indicated in chart.USDEUR = US Dollar vs. Euro exchange rate, ECB = European Central Bank, Eurostoxx = EuroStoxx 600 (EXSE) Index is a subset of the STOXX Global 1800 Index. It represents 600 large, mid and small capitalization companies across 18 countries of the European region: Austria, Belgium, Czech Republic, Denmark, Finland, France, Germany, Greece, Ireland, Italy, Luxembourg, the Netherlands, Norway, Portugal, Spain, Sweden, Switzerland and the United Kingdom. $EUR – ECB QE = Euro spot price in U.S. dollars minus European central Bank quantitative easing. EXSE –ECB QE = EuroStoxx 600 minus ECB quantitative easing. EXSE – Draghi QE Ext = Eurostoxx 600 minus Draghi’s extension of the QE program in the European Union. You cannot invest directly in an index.
75
80
85
90
95
100
105
110
115
‐64 ‐59 ‐54 ‐49 ‐44 ‐39 ‐34 ‐29 ‐24 ‐19 ‐14 ‐9 ‐4 1 6 11 16 21 26 31 36 41 46 51 56 61Normalized
to Cen
tral Ban
k An
noun
cemen
ts
Trading Days to Announcement
Eurostoxx Performance during ECB Announcements
EX5E ‐ ECB QE (1/22/15) EX5E ‐ Draghi QE Ext. (12/03/15)
88
93
98
103
108
‐64 ‐59 ‐54 ‐49 ‐44 ‐39 ‐34 ‐29 ‐24 ‐19 ‐14 ‐9 ‐4 1 6 11 16 21 26 31 36 41 46 51 56 61
Normalized
to Cen
tral Ban
k An
noun
cemen
ts
Trading Days to Announcement
USDEUR Performance during ECB Announcements
$EUR ‐ ECB QE (1/22/15) $EUR ‐ Draghi QE Ext. (12/03/15)

20
Bank of Japan Monetary Policy Announcements and USDJPY and Nikkei Performance(3 months Leading Up to and 3 months Proceeding Central Bank Announcements)
Source: Bloomberg; DoubleLine
90
92
94
96
98
100
102
104
106
108
110
‐64 ‐59 ‐54 ‐49 ‐44 ‐39 ‐34 ‐29 ‐24 ‐19 ‐14 ‐9 ‐4 1 6 11 16 21 26 31 36 41 46 51 56 61
Normalized
to Cen
tral Ban
k An
noun
cemen
ts
Trading Days to Announcement
USDJPY Performance during BOJ Announcements
$JPY ‐ BOJ QQE1 (4/4/13) $JPY ‐ BOJ QQE2 (10/31/14)
$JPY ‐ BoJ Neg. Rates (1/29/16)
80
85
90
95
100
105
110
115
120
125
‐64 ‐59 ‐54 ‐49 ‐44 ‐39 ‐34 ‐29 ‐24 ‐19 ‐14 ‐9 ‐4 1 6 11 16 21 26 31 36 41 46 51 56 61Normalized
to Cen
tral Ban
k An
noun
cemen
ts
Trading Days to Announcement
Nikkei Performance during BOJ Announcements
NKY ‐ BOJ QQE1 (4/4/13) NKY ‐ BOJ QQE2 (10/31/14)
NKY ‐ BoJ Neg. Rates (1/29/16)
Source: Bloomberg; DoubleLine as of date indicated in chart.USDJPY = Japanese yen quoted in U.S. dollar terms. BoJ = Bank of Japan. $JPY – BOJ QQE1 = Japanese yen spot price in U.S. dollars minus Bank of Japan’s quantitative and qualitative easing 1 program. $JPY –BOJ QQE2 = Japanese yen spot price in U.S. dollars minus Bank of Japan’s quantitative and qualitative easing 2 program. $JPY – BOJ Neg Rates= Japanese yen spot price in U.S. dollars minus Bank of Japan’s negative interest rates. NKY = Nikkei 225 composite is the leading Japanese stock market. It’s price weighted index comprised of Japan’s top 225 blue‐chip companies on the Tokyo Stock Exchange. You cannot invest directly in an index.

21
Zero Lower Bound Still Exists for EA Bank Deposits
*Shaded area represents the range of average overnight deposit rates paid by banks across the euro area
ECB = European Central Bank, Euro Area O/N depo rate = Euro Area overnight deposit rateYou cannot invest directly in an index.

22
South Korea Exports (YoY)March 9, 1991 to March 2, 2016
Source: Bloomberg. DoubleLineYoY = year‐over‐year. You cannot invest directly in an index.

23
China Exports and Imports (YoY)March 7, 1996 to March 2, 2016
Source: Bloomberg. DoubleLineYoY = year‐over‐year. USD = U.S. dollar. You cannot invest directly in an index.
24
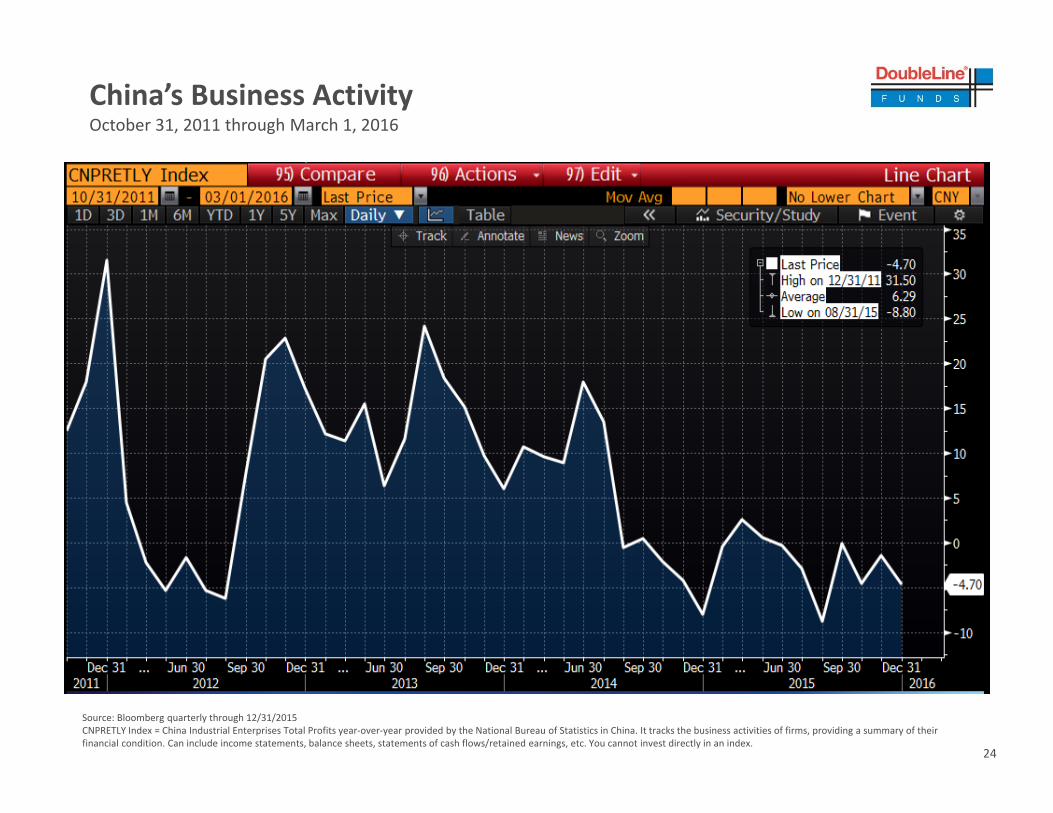
China’s Business ActivityOctober 31, 2011 through March 1, 2016
Source: Bloomberg quarterly through 12/31/2015CNPRETLY Index = China Industrial Enterprises Total Profits year‐over‐year provided by the National Bureau of Statistics in China. It tracks the business activities of firms, providing a summary of their financial condition. Can include income statements, balance sheets, statements of cash flows/retained earnings, etc. You cannot invest directly in an index.

25
CNY Trade Weighted and CNYUSD (5yrs)March 2, 2011 to March 2, 2016
China’s move to a basket peg is apparent – the devaluation so far is specific to USD
Source: Bloomberg; DoubleLine as of date indicated in chart.CNY = Chinese Renminbi. Morgan Stanley CNY is a trade weighted index for the Chinese Renminbi indexed to 100 on January 1, 2010. CNY‐USD X‐Rate = The Chinese renminbi (yuan) is the official currency of the People’s Republic of China minus the U.S. Dollar exchange rate. You cannot invest directly in an index.

26
Global Stocks Have Been Moving with YuanMarch 9, 2015 through March 8, 2016
Source: BloombergMXWD = MSCI ACWI Index is a free‐float weighted global equity index. It includes both emerging and developed world markets. CNYUSD Curncy = The Chinese renminbi (yuan) is the official currency of The People’s Republic of China. The US dollar is the official currency of the United States of America. You cannot invest directly in an index.

27
Global Stocks and InflationMarch 9, 2015 – March 7, 2016
Source: Bloomberg, DoubleLineMXWD Index = MSCI ACWI Index is a free‐float weighted equity index includes both emerging and developed markets. USGGBE10 Index = 10 year U.S. treasury breakeven inflation rates calculated by subtracting the real yield of the inflation linked maturity curve from the yield of the closest nominal Treasury maturity. You cannot invest directly in an index.

28
U.S. Breakevens and WTIMarch 2, 2013 to March 2, 2016
Source: Blooberg, DoubleLineBreakevens = They are calculated by subtracting the real yield of the inflation linked maturity curve form the yield of the closest nominal Treasury maturity. WTI = West Texas Crude oil spot price based on futures. You cannot invest directly in an index.

29
Headline InflationDecember 31, 1999 – January 31, 2016
55.9
‐3.0%
‐2.0%
‐1.0%
0.0%
1.0%
2.0%
3.0%
4.0%
5.0%
6.0%
Year over Y
ear %
Cha
nge
Decem
ber 3
1, 1999 ‐Jan
uary 31, 2016
Headline US Consumer Price IndexHeadline US Personal Consumption Expenditure Index
Source: Bloomberg, DoubleLineConsumer Price Index (CPI) is the measure that examines the weighted average of prices of a basket of consumer goods and services, such as transportation, food and medical care. Personal Consumption Expenditure (PCE) is the primary measure of consumer spending on god and services in the U.S. economy. It accounts for about 2/3 of domestic final spending, and thus it’s the primary engine that drives future economic growth. You cannot invest directly in an index.
30
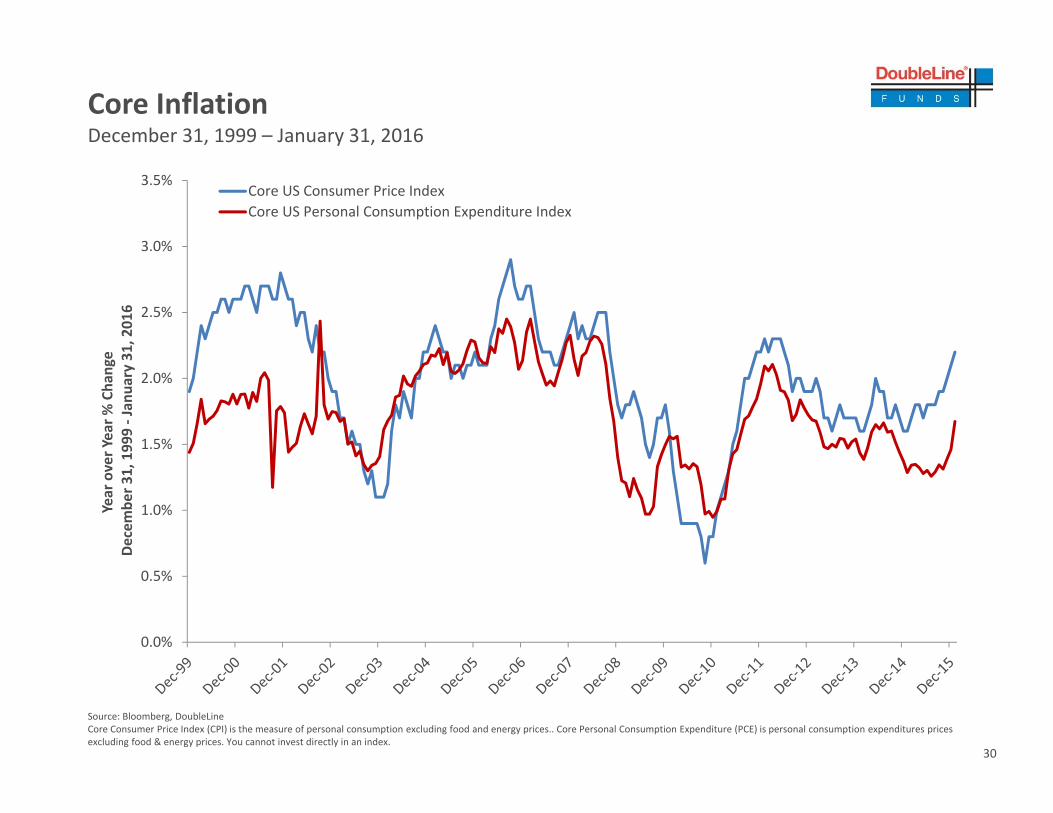
Core InflationDecember 31, 1999 – January 31, 2016
55.9
0.0%
0.5%
1.0%
1.5%
2.0%
2.5%
3.0%
3.5%
Year over Y
ear %
Cha
nge
Decem
ber 3
1, 1999 ‐Jan
uary 31, 2016
Core US Consumer Price IndexCore US Personal Consumption Expenditure Index
Source: Bloomberg, DoubleLineCore Consumer Price Index (CPI) is the measure of personal consumption excluding food and energy prices.. Core Personal Consumption Expenditure (PCE) is personal consumption expenditures prices excluding food & energy prices. You cannot invest directly in an index.
31
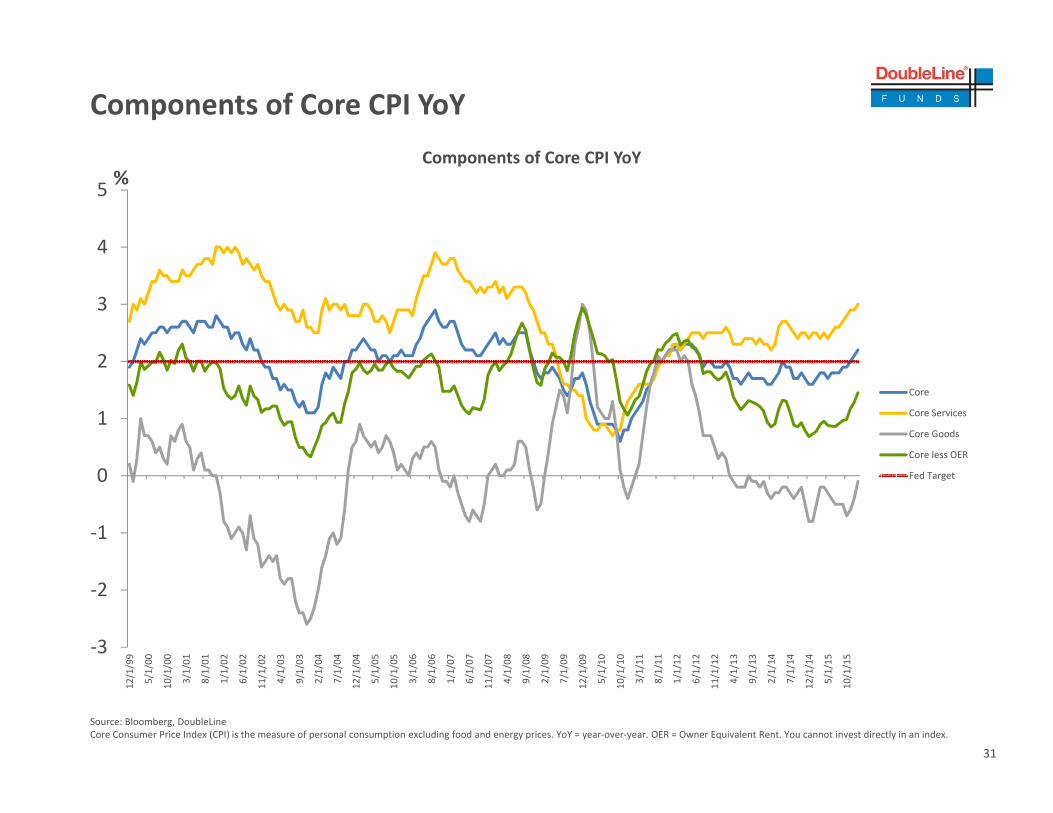
Components of Core CPI YoY
Source: Bloomberg, DoubleLineCore Consumer Price Index (CPI) is the measure of personal consumption excluding food and energy prices. YoY = year‐over‐year. OER = Owner Equivalent Rent. You cannot invest directly in an index.
‐3
‐2
‐1
0
1
2
3
4
5
12/1/99
5/1/00
10/1/00
3/1/01
8/1/01
1/1/02
6/1/02
11/1/02
4/1/03
9/1/03
2/1/04
7/1/04
12/1/04
5/1/05
10/1/05
3/1/06
8/1/06
1/1/07
6/1/07
11/1/07
4/1/08
9/1/08
2/1/09
7/1/09
12/1/09
5/1/10
10/1/10
3/1/11
8/1/11
1/1/12
6/1/12
11/1/12
4/1/13
9/1/13
2/1/14
7/1/14
12/1/14
5/1/15
10/1/15
Components of Core CPI YoY
Core
Core Services
Core Goods
Core less OER
Fed Target
%

32
TAB III –Bloodless Verdict of the Market

33
U.S. Dollar Index Spot December 31, 2007 through March 8, 2016
Source: Bloomberg Financial ServicesDXY = DXY is the US Dollar Index (USDX) indicates the general value of the US dollar. Average exchange rates between the US dollar and six major world currencies.An investment cannot be made directly in an index.
34
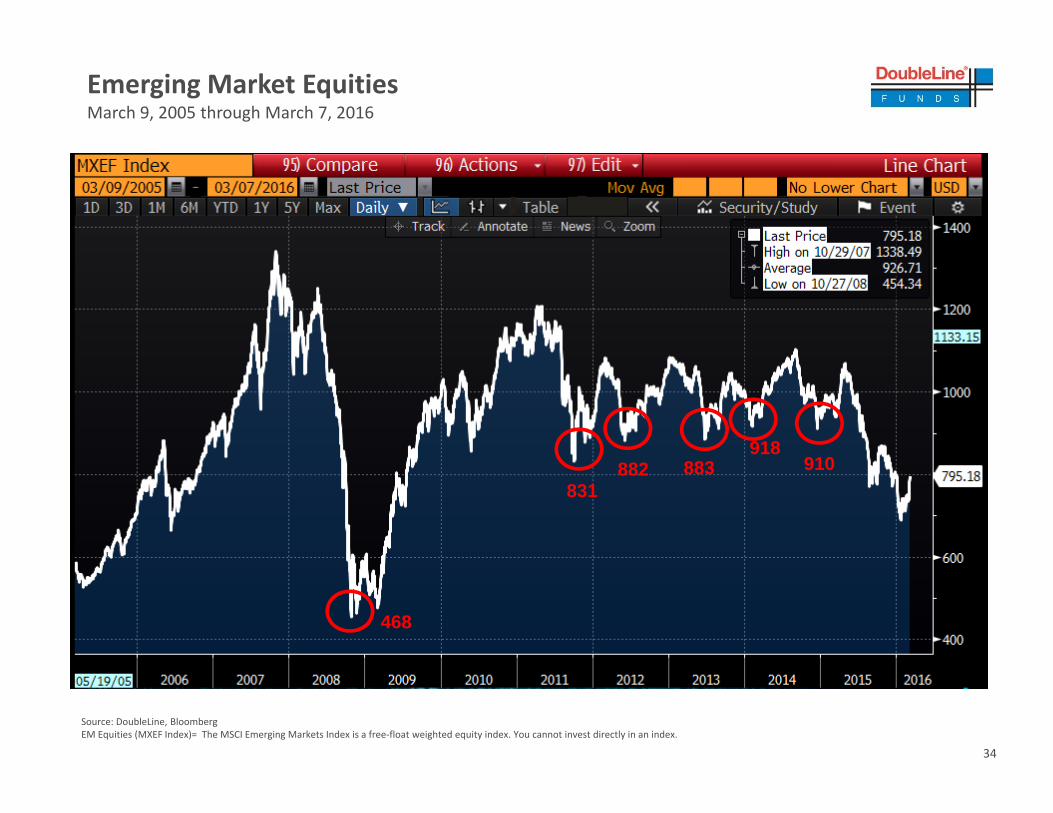
Emerging Market EquitiesMarch 9, 2005 through March 7, 2016
831882 883
918910
468
Source: DoubleLine, BloombergEM Equities (MXEF Index)= The MSCI Emerging Markets Index is a free‐float weighted equity index. You cannot invest directly in an index.

35
Shanghai CompositeMarch 9, 2005 through March 8, 2016
Source: BloombergSHCOMP = Shanghai composite index is a capitalized‐weighted index. The index tracks the daily price performance of all A‐shares and B‐shares listed on the Shanghai Stock Exchange.You cannot invest directly in an index.

36
Junk Bonds December 31, 2007 to March 8, 2016
Source: DoubleLine, BloombergJNK = SPDR Barclays High Yield Bond ETF in an exchange‐traded incorporated in the U.S. It seeks investment results that correspond to the price and yield of the Barclays High Yield Very Liquid Bond Index. Please see the appendix for prospectus link, description, expenses, etc. for JNK. DoubleLine Total Return Bond Fund owns 0% JNK as of March 8, 2016. You cannot invest directly in an index.

37
Commodity PricesDecember 30, 1999 to March 8, 2016
Source: BloombergBCOM Index= Bloomberg Commodity Index is calculated on an excess return basis and reflects commodity futures price movements with monthly rebalancing. You cannot invest directly in an index..

38
Commodity Sector Performance (1 year)March 2, 2015 to March 2, 2016
Source: Bloomberg Financial Services, DoubleLineDJ UBS Commodity index is calculated on an excess return basis and reflects commodity futures price movements. Other indices reflected are subsets of the DJ Commodity index for the sectors indicated. You cannot invest directly in an index.

39
Gold and Gold Miners March 9, 2005 through March 7, 2016
Source: Bloomberg Financial ServicesGDX = Market Vectors Gold Miners ETF is an exchange traded fund incorporated in the USA. It tracks the performance of the Arca Gold Miners Index. GLD = SPDR Gold Shares is an investment fund incorporated in the USA. The objective of the Trust is for the Shares to reflect the performance of the price of gold bullion, less the Trust’s expenses. DoubleLine Total Return Bond Fund holds 0% of GLD and 0% of GDX as of March 8, 2016. You cannot invest directly in an index.

40
BofA/Merrill Fixed Income Index Returns
Data Source: BofA/Merrill Lynch Indices through year‐end December 31, 2015 and March 7, 2016 for the respective years indicated.Please see the Appendix for index definitions. An investment cannot be made directly in an index.
2.33%
1.44%
3.67%
1.23%
3.13%
1.70%
‐4.45%
0.84%
1.46%
1.09%
‐0.63%
0.63%
‐4.55%
‐1.15%
Government (G0A0)
Mortgages (MOAO)
International‐Developed (NOGO)
Corporate (COAO)
International‐Emerging (IGOV)
High Yield (JOAO)
Convertibles (VOSO)
Grey = Year 2015Blue = Year‐To‐Date 2016

41
BofA/Merrill Fixed Income Index Returns
2.49%
1.36%
1.02%
1.41%
2.73%
‐1.54%
0.57%
0.62%
‐2.19%
‐5.08%
‐1.04%
‐15.01%
AAA‐Rated Credit (COA1)
A‐Rated Credit (COA3)
BBB‐Rated Credit (COA4)
B‐Rated High Yield (JOA2)
BB‐Rated High Yield Credit (JOA1)
CCC‐Rated High Yield (JOA3)
Investment Grade = Indices rated AAA to BBB‐ (shown above) are considered to be investment grade. A bond is considered investment grade if its credit rating is BBB‐ or higher by Standard & Poor’s or Baa3 by Moody’s. The higher the rating, the more likely the bond is to pay back at par/$100 cents on the dollar. AAA is considered the highest quality and the lowest degree of risk. They are considered to be stable and dependable.Below Investment Grade = Also known as “junk bond” (shown above) is a security rated below investment grade having a rating of BBB‐ or below. These bonds are seen as having higher default risk or other adverse credit events, but typically pay higher yields than better quality bonds in order to make them attractive. They are less likely to pay back at par/$100 cents on the dollar.Credit distribution from the highest available credit rating from any Nationally Recognizes Statistical Rating Organization (S&P, Moodys, and Fitch).Source: BofA/Merrill Lynch Indices as of December 31, 2015 and March 7, 2016 and for their respective years indicated.Please see appendix for Index definitionsAn investment cannot be made directly in an index.
Grey = Year 2015Blue = Year‐To‐Date 2016

42
U.S. 2‐Year TreasuryMarch 9, 2010 through March 8, 2016
Source: Bloomberg Financial Services, DoubleLine Capital LPGT02 = US 2 Year Treasury Bond. You cannot invest directly in an index.

43
Source: Bloomberg Financial Services, DoubleLine Capital LPGT5 = US 5 Year Treasury Bond. You cannot invest directly in an index.
U.S. 5‐Year TreasuryMarch 9, 2010 through March 8, 2016

44
Source: Bloomberg Financial Services, DoubleLine Capital LPGT10 = US 10 Year Treasury Bond. You cannot invest directly in an index.
U.S. 10‐Year TreasuryMarch 9, 2010 through March 8, 2016
45
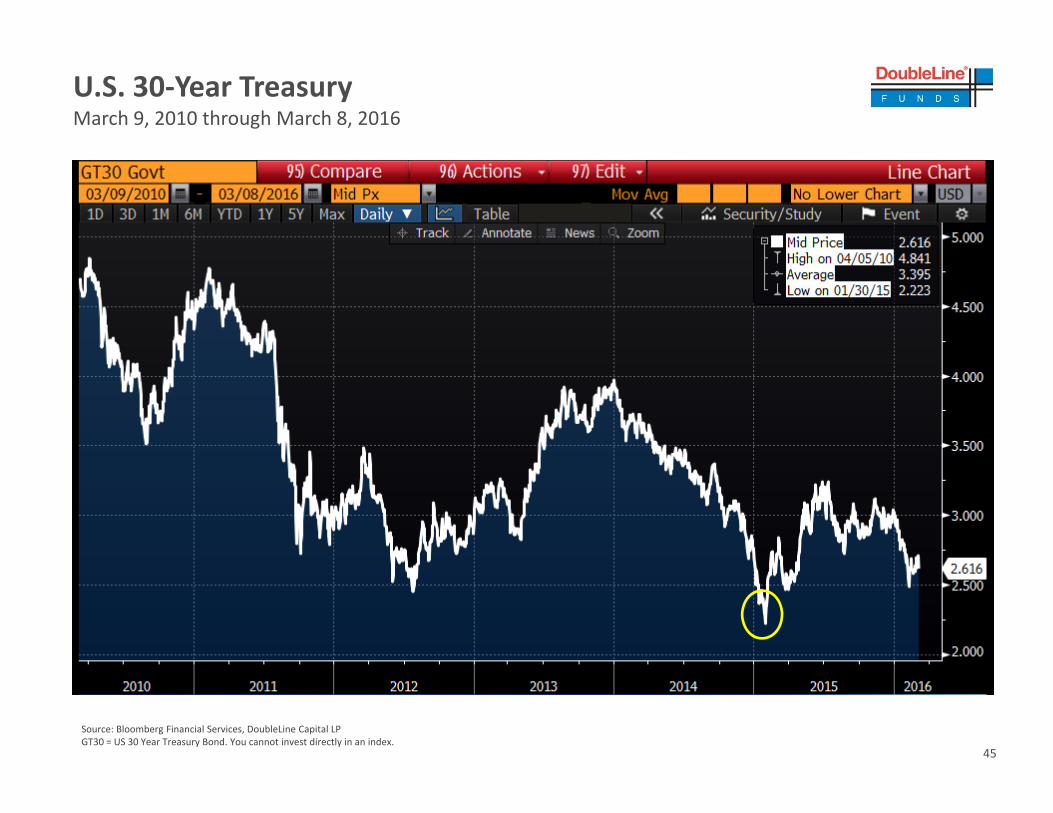
Source: Bloomberg Financial Services, DoubleLine Capital LPGT30 = US 30 Year Treasury Bond. You cannot invest directly in an index.
U.S. 30‐Year TreasuryMarch 9, 2010 through March 8, 2016

46
Credit & EnergyTAB IV

47
High Yield vs. S&P 500 March 9, 2007 through March 7, 2016
Source: BloombergSPX = S&P 500 Index is comprised of capitalized‐weighted index of 500 stocks. J0A0 = BofA/Merrill Lynch US Cash Pay High Yield Index tracks the performance of US dollar denominated below investment grade corporate debt, currently in a coupon paying period, that is publicly issued in the US domestic market. H0A3 = BofA/ Merrill Lynch US High Yield index tracks performance of US dollar denominated below investment grade corporate debt publicly issued in the US domestic market CCC and lower.You cannot invest directly in an index.
S&P 500
HY CCC and lower
High Yield

48
Shiller PE Ratio January 1, 1890 to March 7, 2016
Source: Multpl.com, Robert Shiller “Irrational Exuberance” book for historical S&P 500 PE Ratios. PE ratio is the price earnings ratio which values a company that measures its current share price relative to its per‐share earnings. Shiller PE Ratio = Professor Robert Shiller developed a cyclically adjusted PE ratio (CAPE ratio) which takes the current equity share price/10 year inflation adjusted average earnings. Similar to traditional P/E (price/earnings) the CAPE ratio can be applied to a broad based index (S&P 500) and not just a single equity name. S&P 500 is a capitalized‐weighted index of 500 stocks. It’s designed to measure performance of the broad domestic economy through changes in the aggregate market value of 500 stocks representing all major industries. You cannot invest directly in an index.
PE Ratio

49
S&P 500 Net Profit MarginJanuary 1, 1973 through March 31, 2015
S&P 500 Index is designed to measure performance of the broad domestic economy through changes in the aggregate market value of 500 stocks representing all major industries. Bp = basis point. You cannot invest directly in an index.

50
S&P 500 12 Month Trailing Earnings‐Per‐Share (EPS)November 19, 2000 through February 25, 2016
Source: Bloomberg, DoubleLineS&P 500 Index is designed to measure performance of the broad domestic economy through changes in the aggregate market value of 500 stocks representing all major industries. EPS = earning per share. You cannot invest directly in an index.

51
Leverage At All Time HighDecember 31, 1998 through December 31, 2015
Source: BAML, The HY Wire, 2016 Outlook: May the odds be ever in your favorHY = High Yield. An investment cannot be made directly in an index.
%

52
Leverage At All Time HighDecember 31, 1998 through December 31, 2015
Source: BAML, The HY Wire, 2016 Outlook: May the odds be ever in your favorHY = High Yield. YoY = year‐over‐year. ebita = earnings before interest, taxes, depreciation and amortization. Pct = %. An investment cannot be made directly in an index.

53
Lending Standards vs. U.S. Default RatesDecember 31, 1990 to December 31, 2015
HY = High Yield. Rhs = right hand side. BofAML US HY default rate is the calculated historical default rate for the ML HY Index (J0A0). Please see appendix for index description.You cannot invest directly in an index.

54
Credit Bankruptcies
Abengoa = Abengoa Bioenergy is a U.S. Holding LLC. Chapter 11 refers to bankruptcy protection from creditors given to a company. DoubleLine Total Return Bond Fund hold 0% in Agengoa as of March 8, 2016.You cannot invest directly in an index.

55
Trailing 12mo Rating DriftJanuary 1, 2011 to December 31, 2015
Investment Grade = Indices rated AAA to BBB‐ (shown above) are considered to be investment grade. A bond is considered investment grade if its credit rating is BBB‐ or higher by Standard & Poor’s or Baa3 by Moody’s. The higher the rating, the more likely the bond is to pay back at par/$100 cents on the dollar. AAA is considered the highest quality and the lowest degree of risk. They are considered to be stable and dependable.Below Investment Grade = Also known as “junk bond” (shown above) is a security rated below investment grade having a rating of BBB‐ or below. These bonds are seen as having higher default risk or other adverse credit events, but typically pay higher yields than better quality bonds in order to make them attractive. They are less likely to pay back at par/$100 cents on the dollar.Credit distribution from the highest available credit rating from any Nationally Recognizes Statistical Rating Organization (S&P, Moodys, and Fitch).Ratings upgrades/downgrades are determined by Moodys.Please see appendix for Index definitionsAn investment cannot be made directly in an index.

56
Upgrade/Downgrade Ratio for All Rated BondsDecember 31, 1990 through June 30. 2015
Investment Grade = Indices rated AAA to BBB‐ (shown above) are considered to be investment grade. A bond is considered investment grade if its credit rating is BBB‐ or higher by Standard & Poor’s or Baa3 by Moody’s. The higher the rating, the more likely the bond is to pay back at par/$100 cents on the dollar. AAA is considered the highest quality and the lowest degree of risk. They are considered to be stable and dependable.Below Investment Grade = Also known as “junk bond” (shown above) is a security rated below investment grade having a rating of BBB‐ or below. These bonds are seen as having higher default risk or other adverse credit events, but typically pay higher yields than better quality bonds in order to make them attractive. They are less likely to pay back at par/$100 cents on the dollar.Credit distribution from the highest available credit rating from any Nationally Recognizes Statistical Rating Organization (S&P, Moodys, and Fitch).Ratings upgrades/downgrades are determined by Moodys.Please see appendix for Index definitionsAn investment cannot be made directly in an index.

57
Investment Grade & High Yield Bonds March 9, 2015 to March 7, 2016
Source: DoubleLine, BloombergJNK = SPDR Barclays High Yield Bond ETF in an exchange‐traded incorporated in the U.S. It seeks investment results that correspond to the price and yield of the Barclays High Yield Very Liquid Bond Index. LQD = iShares iBoxx Investmetn Grade Corporate Bond ETF is an exchange‐traded fund seeking to track the investment grade results of an index composed of U.S. dollar‐denominated investment grade corporate bonds. Please see the appendix for prospectus link, description, expenses, etc. for JNK. DoubleLine Total Return Bond Fund owns 0% JNK and 0% LQD as of March 8, 2016. You cannot invest directly in an index.
58
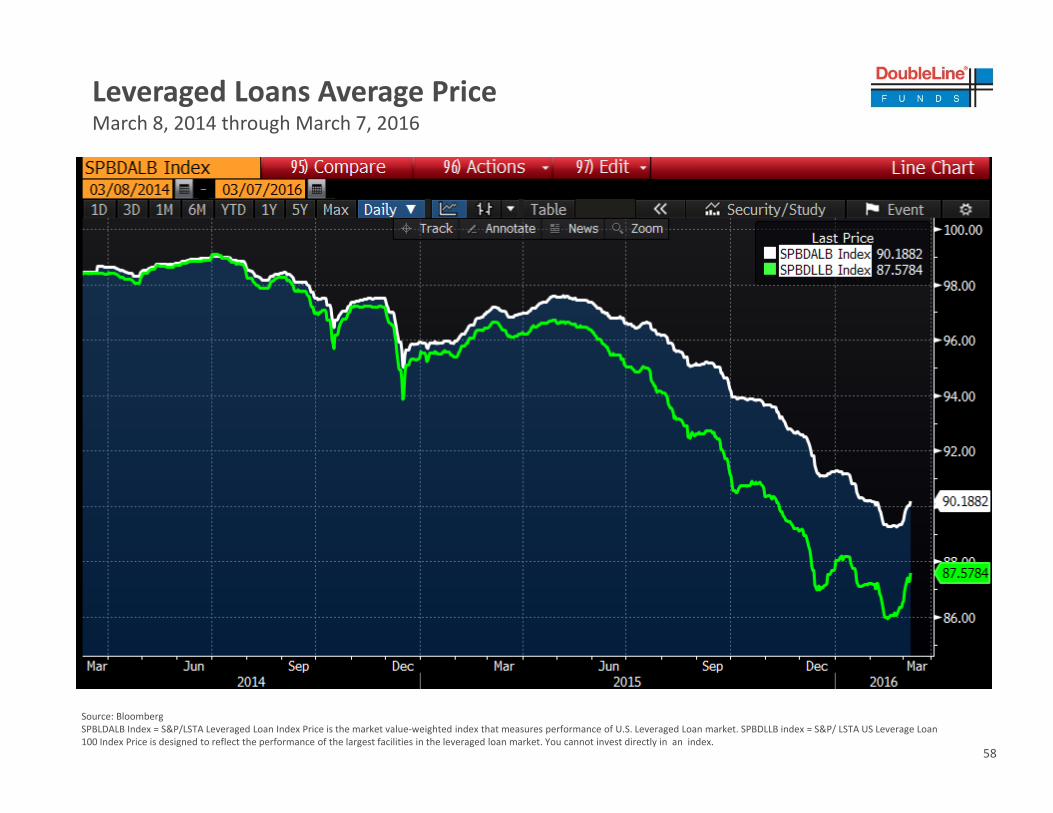
Leveraged Loans Average PriceMarch 8, 2014 through March 7, 2016
Source: BloombergSPBLDALB Index = S&P/LSTA Leveraged Loan Index Price is the market value‐weighted index that measures performance of U.S. Leveraged Loan market. SPBDLLB index = S&P/ LSTA US Leverage Loan 100 Index Price is designed to reflect the performance of the largest facilities in the leveraged loan market. You cannot invest directly in an index.

59
CLO Issuance January 1, 2013 to February 29, 2016
Source: Bank of America Merrill LynchCLO = Collateralized Loan Obligation. You cannot invest directly in an index.
60
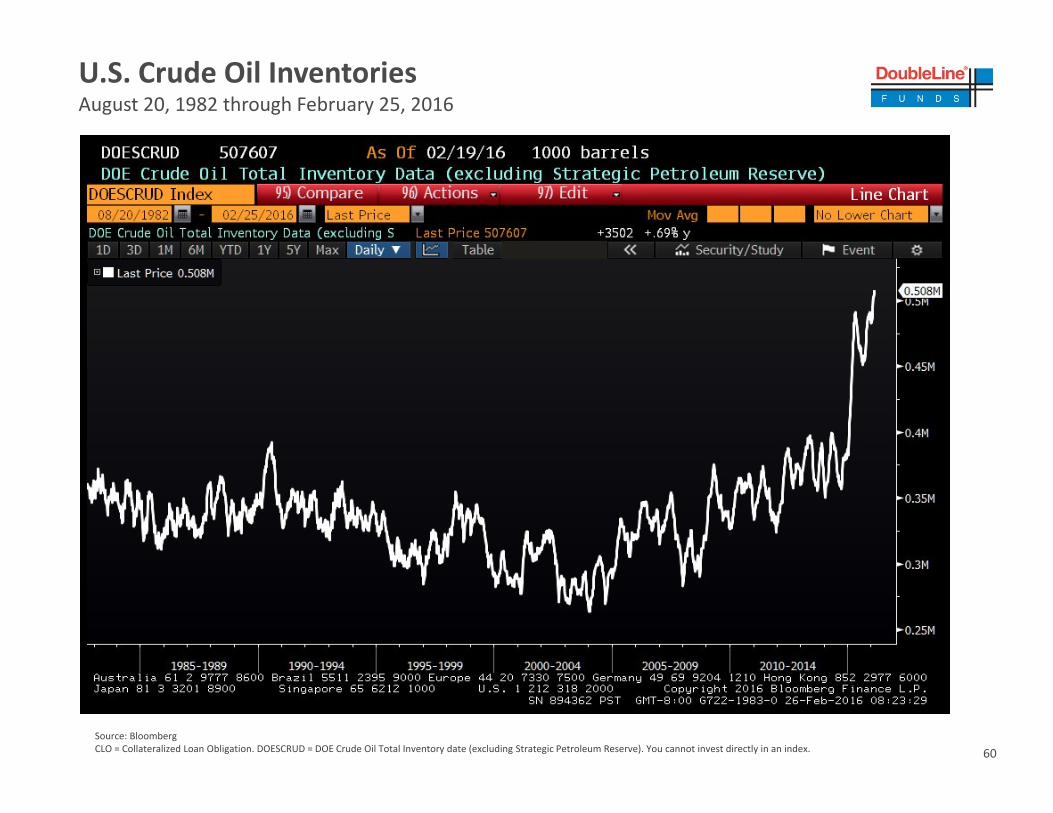
U.S. Crude Oil InventoriesAugust 20, 1982 through February 25, 2016
Source: BloombergCLO = Collateralized Loan Obligation. DOESCRUD = DOE Crude Oil Total Inventory date (excluding Strategic Petroleum Reserve). You cannot invest directly in an index.

61
U.S. Crude Oil Inventories by Year
Source: Bloomberg . 2016 is through February 19, 2016DOESCRUD = DOE Crude oil total inventory data is updated every Wednesday. Information is provided by the Energy Information Administration as part of their weekly petroleum status report. You cannot invest directly in an index.
250,000
300,000
350,000
400,000
450,000
500,000
550,000
1 3 5 7 9 11 13 15 17 19 21 23 25 27 29 31 33 35 37 39 41 43 45 47 49 51Weeks
US Crude Oil Inventories by Year
2005
2006
2007
2008
2009
2010
2011
2012
2013
2014
2015
2016

62
Energy Market Has Large Oversupply March 31, 2014 to December 31, 2015

63
Energy Market Has Large Oversupply January 1, 1997 to December 31, 1999
Source: BloombergOECD = Organization for Economic Development

64
U.S. Crude Supply and DemandNovember 30, 1998 through January 31, 2016
Source: DoubleLine, BloombergOPCBRTOT Index = Data obtained form the Energy Intelligence Group’s monthly oil Market Intelligence publication. Data includes estimated OPEC and Non‐OPEC oil production statistics as well as global oil supply. OPCBTSUP Index = Data obtained from Energy Group’s monthly oil Market Intelligence e publication of total supply data. You cannot invest directly in an index.
65
DoubleLine Total Return Bond Fund
TAB VII

66
Duration: DBLTX vs. Barclays U.S. Aggregate IndexApril 1, 2010 through February 29, 2016
Source: DoubleLine, BarclaysBarclays AGG Duration = Barclays US Aggregate Index duration. Duration is a measure of sensitivity of the price of a fixed income investment to a change in interest rates. It’s expressed in years

67
DBLTX Duration vs. 10 Year U.S. Treasury YieldMay 31, 2010 through February 29, 2016
Source: DoubleLine, BloombergDuration is a measure of sensitivity of the price of a fixed income investment to a change in interest rates. It’s expressed in years.

68
Portfolio statistics as of February 29, 2016 based on market weighted averages. Subject to change without notice.Average price = A measure of the weighted average price paid for the securities calculated by taking the prices and dividing by the number of securities and does not include cash. Average price should not be confused with net asset value.Average Duration = Duration is used as a risk measure. It measures the price volatility of a security given a change in interest rate movements.Average Life = The average number of years that each dollar of unpaid principal due on the mortgage remains outstanding. Average life is computed as the weighted average time to the receipt of all future cash flows, using as the weights the dollar amounts of the principal paydowns.Source: DoubleLine Capital LPYou cannot invest directly in an index. Please see index definition in the appendix.
Total Return Bond Fund Portfolio Statistics
Total Return Bond Fund
Barclays Capital U.S. Aggregate Index
Average Price $99.30 $104.83
Duration 2.79 5.40
Average Life 4.52 7.70

69
Portfolio composition as of February 29, 2016. Subject to change without notice.Source: DoubleLine Capital LP. Sector allocations are subject to change and should not be considered a recommendation to buy or sell any security.Cash = The value of assets that can be converted into cash immediately. Can include marketable securities, such as government bonds, banker's acceptances, cash equivalents on balance sheets that may include securities that mature within 90 days.Government – U.S. treasury securities.Agency = Mortgage securities whose principal and interest guaranteed by the U.S. Government agency including Fannie Mae (FNMA) or Freddie Mac (FHLMC).Non‐Agency = Residential Mortgages Bond Securities are a type of bond backed by residential mortgages. Non‐Agency means they were issued by a private issuer.CMBS = Commercial Mortgage‐Backed Securities. Securitized loans made on commercial rather than residential property.CLO = Collateralized Mortgage Obligations
Total Return Bond Fund Portfolio Composition –By Security Type
Cash 11.9%
Government3.7%
Agency 48.9%
Non Agency 21.1%
CMBS7.4%
CLO 4.6% ABS 2.4%

Live Webcast hosted by:
Jeffrey Gundlach
Chief Executive Officer
March 8, 2016
Connect the Dots

71
SPDR Barclays High Yield Bond ETF(JNK)
Investment Objective & SummaryThe investment objective of the SPDR Barclays High Yield Bond ETF seeks to provide investment results that, before fees and expenses, corresponds generally to the price and yield performance of the Barclays High Yield Very Liquid Index. The ETF invests in U.S. high yield bonds.
The Barclays High Yield Very Liquid Index is designed to measure the performance of publicly issued U.S. dollar denominated high yield corporate bonds with above‐average liquidity. High yield securities are generally rated below investment grade and are commonly referred to as "junk bonds." The Index includes publicly issued U.S. dollar denominated, non‐investment grade, fixed‐rate, taxable corporate bonds that have a remaining maturity of at least one year, regardless of optionality, are rated high‐yield (Ba1/BB+/BB+ or below) using the middle rating of Moody's Investors Service, Inc., Fitch Inc., or Standard & Poor's, Inc. Respectively, and have $500 million or more of outstanding face value
Important Risk Information ‐ In general, ETFs can be expected to move up or down in value with the value of the applicable index. Although ETF shares may be bought and sold on the exchange through any brokerage account, ETF shares are not individually redeemable from the Fund. Investors may acquire ETFs and tender them for redemption through the Fund in Creation Unit Aggregations only. Please see the prospectus for more details.Bond funds contain interest rate risk (as interest rates rise bond prices usually fall); the risk of issuer default; issuer credit risk; liquidity risk; and inflation risk.Investing in high yield fixed income securities, otherwise known as "junk bonds" is considered speculative and involves greater risk of loss of principal and interest than investing in investment grade fixed income securities. These lower‐quality debt securities involve greater risk of default or price change due to potential changes in the credit quality of the issuer.The Fund invests by sampling the Index, holding a range of securities that, in the aggregate, approximates the full Index in terms of key risk factors and other characteristics which may cause the fund to experience tracking errors relative to performance of the Index.Distributor: State Street Global Markets, LLC, member FINRA, SIPC, a wholly owned subsidiary of State Street Corporation. References to State Street may include State Street Corporation and its affiliates. Certain State Street affiliates provide services and receive fees from the SPDR ETFs.
Before investing, consider the funds' investment objectives, risks, charges and expenses. To obtain a prospectus or summary prospectus which contains this and other information, call 1‐866‐787‐2257 or talk to your financial advisor. Read it carefully before investing.JNK is distributed by State Street Global Markets, LLC

72
iBOXX High Yield Corporate Bond ETF(HYG)Investment ObjectiveThe iShares iBoxx $ High Yield Corporate Bond ETF seeks to track the investment results of an index composed of U.S. dollar‐denominated, high yield corporate bonds.
Carefully consider the Funds' investment objectives, risk factors, and charges and expenses before investing. This and other information can be found in the Funds' prospectuses or, if available, the summary prospectuses which may be obtained by visiting the iShares ETF and BlackRock Fund prospectus pages. Read the prospectus carefully before investing. Investing involves risk, including possible loss of principal. The iShares Enhanced ETFs, iShares Short Maturity Bond ETF, iShares Liquidity Income ETF and the iShares Interest Rate Hedged ETFs are actively managed funds and do not seek to replicate the performance of a specified index. The Funds may have a higher portfolio turnover than funds that seek to replicate the performance of an index. Fixed income risks include interest‐rate and credit risk. Typically, when interest rates rise, there is a corresponding decline in bond values. Credit risk refers to the possibility that the bond issuer will not be able to make principal and interest payments. Non‐investment‐grade debt securities (high‐yield/junk bonds) may be subject to greater market fluctuations, risk of default or loss of income and principal than higher‐rated securities. The iShares Short Maturity Bond ETF will invest in privately issued securities that have not been registered under the Securities Act of 1933 and as a result are subject to legal restrictions on resale. Privately issued securities are not traded on established markets and may be illiquid, difficult to value and subject to wide fluctuations in value. Delay or difficulty in selling such securities may result in a loss to the iShares Short Maturity Bond ETF. The fund may invest in asset‐backed (“ABS”) and mortgage‐backed securities (“MBS”) which are subject to credit, prepayment and extension risk, and react differently to changes in interest rates than other bonds. Small movements in interest rates may quickly reduce the value of certain ABS and MBS. Shares of ETFs are bought and sold at market price (not NAV) and are not individually redeemed from the Fund. Brokerage commissions will reduce returns. Market returns are based upon the midpoint of the bid/ask spread at 4:00 p.m. Eastern time (when NAV is normally determined for most ETFs), and do not represent the returns you would receive if you traded shares at other times. For the prospectus please call 1‐800‐882‐0052.HJY is distributed by BlackRock

73
Market Vectors Gold Miners ETF (GDX)
Investment Objective & SummaryThe investment objective seeks to replicate as closely as possible, before fees and expenses, the price and yield performance of the NYSE Arca Gold Miners Index (GDMNTR), which is intended to track the overall performance of companies involved in the fold mining industry.

74
SPDR® Gold Shares ETF (GLD)Investment Objective & SummaryThe investment objective of the Trust is for SPDR® Gold Shares (GLD) to reflect the performance of the price of gold bullion, less the Trust’s expenses.The spot price of gold bullion is determined by market forces in the 24‐hour global over‐the‐counter (OTC) market for gold. The OTC market accounts for most global gold trading, and prices quoted reflect the information available to the market at any given time. The price, holdings, and net asset a value of Gold Shares, as well as market data for the overall gold bullion market, can be tracked daily at www.spdrgoldshares.com.

75
DefinitionsBarclays Capital US Aggregate Index ‐ The Barclays Capital US Aggregate Index represents securities that are SEC‐registered, taxable, and dollar denominated. The index covers the US investment grade fixed rate bond market, with index components for government and corporate securities, mortgage pass‐through securities, and asset‐backed securities. These major sectors are subdivided into more specific indices that are calculated and reported on a regular basis.Barclays Capital US Treasury Index ‐ This index is the US Treasury component of the US Government index. Public obligations of the US Treasury with a remaining maturity of one year or more.Barclays Capital US Treasury 10 Year Index ‐ This index is the 10 year component of the US Government index.Barclays Capital Capital US Treasury 30 Year Index ‐ This index is the 30 year component of the US Government index.Barclays Capital US High Yield Index ‐ The Barclays Capital US High Yield Index covers the universe of fixed rate, non‐investment grade debt. Eurobonds and debt issuer from countries designated as emerging markets (e.g. Argentina, Brazil, Venezuela, etc.) are excluded, but Canadian and global bonds (SEC registered) of issuers in non‐EMG countries are included. Original issue zereos, step‐up coupon structures, 144‐As and pay‐in‐kind (PIK, as of October 1, 2009) are also included.BofA Merrill Lynch US Government Index (GOAO) ‐ The Merrill Lynch US Government Index tracks the performance of US government (i.e. securities in the Treasury and Agency indices.)BofA Merrill Lynch US 15+ Year Treasury Index “Long Treasuries” (G802)‐ This index is a subset of the BofA Merrill Lynch US Treasury Index including all securities with a remaining term of final maturity greater than 15 years..BofA Merrill Lynch US Corporate Index (COAO) “Investment Grade”‐ The Merrill Lynch Corporate Index tracks the performance of US dollar denominated investment grade corporate debt publicly issued in the US domestic market. Qualifying securities must have an investment grade rating (based on an average of Moody’s, S&P and Fitch) and an investment grade rated country of risk (based on an average of Moody’s, S&P and Fitch foreign currency long term sovereign debt ratings). Securities must have at least one year remaining term to final maturity, a fixed coupon schedule and a minimum amount outstanding of $250MM.BofA Merrill Lynch US All Convertibles Index (VOSO) ‐ The Merrill Lynch All Convertible Index is a rule driven index. which includes all bonds and preferred stocks of U.S.‐registered companies, which have $50 million or more in aggregate market value and are convertibles in U.S. dollar‐denominated common stocks, ADRs or cash equivalents. Please note an investor cannot invest directly in an index.CRB Commodity Index (CRY)‐ An unweighted geometric average of some important commodities. It averages prices across 17 commodities and across time. The index tracks energy, grains, industrials, livestock, precious metals, and agriculturals.S&P 500 (SPX)‐ S&P 500 is a free‐float capitalization‐weighted index published since 1957 of the prices of 500 large‐cap common stocks actively traded in the United States.Standard Deviation – Sigma = standard deviation. It shows how much variation there is from the “average” (mean, or expected/budgeted value). A low standard deviation indicated that the data point tend to be very close to the mean, whereas high standard deviation indicated that the date is spread out over a large range of values.Dow Jones – UBS DJ Commodity Index ‐ The Dow Jones UBS – Commodity index is composed of commodities traded on U.S. exchanges, with the exception of aluminum, nickel and zinc, which trade on the London Metal Exchange (LME).“Copper”= Copper Spot Price (HGI) Copper is the world’s third most used metal behind iron and aluminum primarily used in highly cyclical industries including construction and industrial machinery manufacturing. Spot price quoted in USD/lb.“Gold”= Gold Spot Price (Golds) The Gold Spot price is quoted as US Dollar per Troy Ounce.Crude Oil= Crude oil varies greatly in appearance depending on its composition. West Texas intermediate (WTI )= Texas light sweet crude is used as a benchmark in oil pricing. It’s “light” because of the low density and sweet because of low sulfur. Brent crude = Is a major trading classification of sweet light crude. Brent is the oil maker also known as Brent Blend.Volatility Index (VIX) ‐The VIX shows the market's expectation of 30‐day volatility. It is constructed using the implied volatilities of a wide range of S&P 500 index options. This volatility is meant to be forward looking and is calculated from both calls and puts. The VIX is a widely used measure of market risk and is often referred to as the "investor fear gauge". Spread – Spread is the percentage point difference between yields of various classes of bonds compared to treasury bonds.

76
Index DescriptionsBofA Merrill Lynch US Dollar Emerging Markets Sovereign Plus Index (IGOV)This index tracks the performance of US dollar denominated emerging market and cross‐over sovereign debt publicly issued in the eurobond or US domestic market. Qualifying countries must have a BB1 or lower foreign currency long‐term sovereign debt rating (based on an average of Moody’s, S&P, and Fitch).BofA Merrill Lynch U.S. High Yield Cash Pay Index (J0A0) “Below Investment Grade”‐The Merrill Lynch High Yield Index tracks the performance of US dollar denominated below investment grade corporate debt, currently in a coupon paying period, that is publicly issued in the US domestic market. Qualifying securities must have a below investment grade rating (based on an average of Moody’s, S&P and Firth foreign currency long term sovereign debt ratings). Must have one year remaining to final maturity and a minimum outstanding amount of $100MM.BofA Merrill Lynch International Government Index (NOGO)The Merrill Lynch International Index tracks the performance of Australia, Canadian, French, German, Japan, Dutch, Swiss and UK investment grade sovereign debt publicly issued and denominated in the issuer’s own domestic market and currency. Qualifying securities must have at least one year remaining term to final maturity, a fixed coupon schedule and a minimum amount outstanding.BofA Merrill Lynch Mortgage‐Backed Securities Index (MOA0)This index tracks the performance of US dollar denominated fixed rate and hybrid residential mortgage pass‐through securities publicly issued by US agencies in the US domestic market. 30‐year, 20‐year, 15‐year and interest only fixed rate mortgage pools are included in the Index provided they have at least one year remaining term to final maturity and a minimum amount outstanding of at least $5 billion per generic coupon and $250MM per production year within each generic coupon.BofA Merrill Lynch U.S. Municipal Securities Index (UOA0)This index tracks the performance of US dollar denominated investment grade tax‐exempt debt publicly issued by US states and territories, and their political subdivisions, in the US domestic market. Qualifying securities must have at least one year remaining term to final maturity, a fixed coupon schedule and an investment grade rating (based on Moody’s, S&P and Fitch). Minimum size vary based on the initial term to final maturity at time of issuance.Barclays Capital Global Emerging Markets Index ‐ The Barclays Capital Global Emerging Markets Index represents the union of the USD‐denominated US Emerging Markets index and the predominately EUR‐denominated Pan Euro Emerging Markets Index, covering emerging markets in the following regions: Americas, Europe, Middle East, Africa, and Asia. As with other fixed income benchmarks provided by Barclays Capital, the index is rules‐based, which allows for an unbiased view of the marketplace and easy replicability.JP Morgan Investment Grade Corporate Index ‐ JP Morgan Investment Grade Corporate Index includes performance of US dollar denominated investment grade corporate debt publicly issued in the US domestic market. Qualifying securities must have an investment grade rating (based on an average of Moody’s, S&P and Fitch) and an investment grade rated country of risk (based on an average of Moody’s, S&P and Fitch foreign currency long term sovereign debt ratings). Securities must have at least one year remaining term to final maturity, a fixed coupon schedule and a minimum amount outstanding of $250MM.Draw Down ‐ The peak‐to‐trough decline during a specific record period of an investment, fund or commodity. A drawdown is usually quoted as the percentage between the peak and the trough. NAV – A mutual fund's price per share or exchange‐traded fund's (ETF) per‐share value. In both cases, the per‐share dollar amount of the fund is calculated by dividing the total value of all the securities in its portfolio, less any liabilities, by the number of fund shares outstanding. CMO – A type of mortgage‐backed security that creates separate pools of pass‐through rates for different classes of bondholders with varying maturities, called tranches. The repayments from the pool of pass‐through securities are used to retire the bonds in the order specified by the bonds' prospectusTIPS– Treasury Inflation Protection. A treasury security that is indexed to inflation in order to protect investors from the negative effects of inflation. TIPS are considered an extremely low‐risk investment since they are backed by the U.S. government and since their par value rises with inflation, as measured by the Consumer Price Index, while their interest rate remains fixed.CPI– Consumer Price Index. A measure that examines the weighted average of prices of a basket of consumer goods and services, such as transportation, food and medical care.Cash Flow – Cash flow measures the cash generating capability of a company by adding non‐cash charges (e.g. depreciation) and interest expense to pretax income.
77
Index DescriptionsBofA/Merrill Lynch High Yield Cash Pay CCC –rated Index (JOA3) – .A component of the BofA/Merrill Lynch High Yield Cash Pay Index concentrating on CCC rated High Yield credit only. BofA/Merrill Lynch High Yield Cash Pay BB–rated Index (JOA1) – .A component of the BofA/Merrill Lynch High Yield Cash Pay Index concentrating on BB rated High Yield credit only.BofA/Merrill Lynch High Yield Cash Pay B–rated Index (JOA2) – .A component of the BofA/Merrill Lynch High Yield Cash Pay Index concentrating on B rated High Yield credit only.BofA/Merrill Lynch Credit Index BBB‐rated Index (COA4) – .A component of the BofA/Merrill Lynch Credit Index concentrating on the lower rated BBB investment grade credits.BofA/Merrill Lynch Credit Index A–rated Index (COA3) – . A component of the BofA/Merrill Lynch Credit Index concentrating on the A rated investment grade credits.BofA/Merrill Lynch Credit Index AAA –rated Index (COA1) – . A component of the BofA/Merrill Lynch Credit Index concentrating on the highest rated AAA investment grade credits.BofA Merrill Lynch US Treasury Index (G0Q0) ‐The Merrill Lynch US Treasury Index tracks the performance of US dollar denominated sovereign debt publicly issued by the US government in its domestic market. Qualifying securities must have at least one year remaining term to final maturity, a fixed coupon schedule and a minimum amount outstanding of $1 billion.BofA Merrill Lynch US 10‐15 Year Treasury Index “Long Treasury”‐The Merrill Lynch US 10‐15 Treasury Index tracks the performance of US dollar denominated 10‐15 year sovereign debt publicly issued by the US government in its domestic market. It is a subset of the BofA Merrill Lynch U.S. Treasury Index (GOQO).BofA Merrill Lynch Municipal Index‐The Merrill Lynch Municipal BofA Merrill Lynch Current 10 year UST Index –‐ This index is the 10 year component of the US Government index.BofA Merrill Lynch Current 30 year UST Index –‐ This index is the 30 year component of the US Government index.Shanghai Index ‐ The Shanghai Stock Exchange Composite is a capitalization‐weighted index tracking daily price performance of all A and B‐shares listed on the Shanghai Stock Exchange. This index was developed December 19, 1990 with a base value of 100.S&P/Case‐Shiller Composite Home Price Index ‐ The Case‐Shiller Home Price Indices, one comprised of price changes within all 20 metropolitan markets, and another comprised of price changes within the following subset of 10 metropolitan markets: Boston, Chicago, Denver, Las Vegas, Los Angeles, Miami, New York, San Diego, San Francisco and Washington DC. In addition to those 10 markets, the 20‐Home Price index reflects price changes for Atlanta, Charlotte, Dallas, Detroit, Minneapolis, Phoenix, Portland, Seattle and Tampa.NASDAQ‐ A computerized system that facilitates trading and provides price quotations on more than 5,000 of the more actively traded over the counter stocks. Created in 1971, the Nasdaq was the world's first electronic stock market.Transports‐ The Industrials Sector includes companies whose businesses are dominated by one of the following activities: The manufacture and distribution of capital goods, including aerospace & defense, construction, engineering & building products, electrical equipment and industrial machineryUtilities‐ A public utility is a business that furnishes an everyday necessity to the public at large. Public utilities provide water, electricity, natural gas, telephone service, and other essentials. Utilities may be publicly or privately owned, but most are operated as private businesses.Basis Point‐ A basis point is a unit that is equal to 1/100th of 1%, and is used to denote the change in a financial instrument.REIT‐ Real Estate Trust. A security that sells like a stock on the major exchanges and invests in real estate directly, either through properties or mortgagesDuration – Duration is a commonly used measure of the potential volatility of the price of a debt security, or the aggregate market value of a portfolio of debt securities, prior to maturity. Securities with a longer duration generally have more volatile prices than securities of comparable quality with a shorter duration.

78
Index DescriptionsBofA/Merrill Lynch Inflation Linked Index (G0Q1) – The BofA Merrill Lynch US Inflation‐Linked Treasury Index tracks the performance of US dollar denominated inflation linked sovereign debt publicly issued by the US government in its domestic market. Citigroup TIPS (SBUSILSI)– . It measures the returns of the inflation‐linked bonds with fixed‐rate coupon payments that are linked to an inflation index. The price of each issue in the USLSI is adjusted by using an index ratio. The index ratio is determined by dividing the current inflation index level by the inflation index level at the time of issue of the security. The inflation index is published on a monthly basis, and the intra‐month index ratio is calculated using linear interpolation.Barclays Capital CMBS Index – tracks the performance of US dollar‐denominated securitized commercial mortgage‐backed securities.Russell 2000 – measures the performance of the small‐cap segment of the US equity universe. Russell 2000 is a subset of the Russell 3000 index representing approximately 10% of the total market capitalization of that index.S&P GSCI – is a composite index of commodity sector return representing an unleveraged, long‐only investment in commodity futures that is broadly diversified across the spectrum of commodities. S&P GSCI Agriculture – is a composite index of agriculture commodity futures unleveraged, long‐only investment.Barclays Capital US 30 Year TIPS Index ‐ . Barclays Capital 30‐year TIPS on‐the‐run index quoted in US Dollars traded intradayCitigroup Economic Surprise Index ‐ . The Citigroup Economic Surprise Indices are objective and quantitative measures of economic news. They are defined as weighted historical standard deviations of data surprises (actual releases vs Bloomberg survey median). A positive reading of the Economic Surprise Index suggests that economic releases have on balance beating consensus. The indices are calculated daily in a rolling three‐month window. The weights of economic indicators are derived from relative high‐frequency spot FX impacts of 1 standard deviation data surprises. The indices also employ a time decay function to replicate the limited memory of markets.DAX ‐ This index is the German Stock Index is a total return index of 30 selected German blue chip stocks traded on the Frankfurt Stock Exchange.CAC 40 – This index the most widely‐used indicator of the Paris market, reflects the performance of the 40 largest equities listed in France, measured by free‐float market capitalization and liquidity.FTSE 100 – Is a capitalization‐weighted index of the 100 most highly capitalized companies traded on the London Stock Exchange.Nikkei 225 – The Nikkei‐225 Stock average is a price‐weighted average of 225 top‐rated Japanese companies listed in the First Section of the Tokyo Stock Exchange.Barclays U.S. High Yield Index – An index that is composed of fixed‐rate, publicly issued, non‐investment grade debt. Barclays Euro Corporate Index – A subset of the Barclays EuroAgg measures the investment grade, euro‐denominated, fixed rate bond market, including treasuries, government‐related, corporate and securitized issues.Barclays Euro High Yield Index – Measures the market of non‐investment grade, fixed‐rate corporate bonds denominated in Euro. Inclusion is based on the currency of issue, and not the domicile of the issuer.JPMorgan Corporate EMBI Broad Diversified Index (JBCDCOMP) – This index tracks a broad basket of performance of investment grade corporate debt, including smaller issues covering a wider array of publically issued across a range of emerging market countries.JPMorgan Corporate Emerging Market Index (JCMHCOR) – This index is a liquid basket of emerging markets corporate issues which include 80 bonds, representing 60 issuers and 16 countries. It has strict liquidity criteria for inclusion in order to provide replicability, tradability, robust pricing and data integrity.JPMorgan Global Bond Index ex‐EM (JGAGGUSD) – is a comprehensive global investment grade benchmark excluding emerging markets.JPMorgan EM Bond Index Global Diversified – tracks total returns for traded external debt instruments in the emerging markets limiting the weights of those index countries with larger debt stocks by only including a specified portion of these countries eligible current face amounts of debt outstanding..Barclays U.S. Corporate Index – Is a subset of the Barclays U.S. Aggregate index which is a broad‐based flagship benchmark that measures the investment grade, U.S. dollar‐denominated, fixed rate taxable bond market. IT includes Treasuries, government‐related and corporate securities, MBS, ABS and CMBS. This subset represents the investment grade portion of that index.
getIndexA1U.S. AggrIWS?requBack to In

79
Disclaimer
Important Information Regarding This ReportThis report was prepared as a private communication and was not intended for public circulation. Clients or prospects may authorize distribution to their consultants or other agents.
Issue selection processes and tools illustrated throughout this presentation are samples and may be modified periodically. Such charts are not the only tools used by the investment teams, are extremely sophisticated, may not always produce the intended results and are not intended for use by non‐professionals.
DoubleLine has no obligation to provide revised assessments in the event of changed circumstances. While we have gathered this information from sources believed to be reliable, DoubleLine cannot guarantee the accuracy of the information provided. Securities discussed are not recommendations and are presented as examples of issue selection or portfolio management processes. They have been picked for comparison or illustration purposes only. No security presented within is either offered for sale or purchase. DoubleLine reserves the right to change its investment perspective and outlook without notice as market conditions dictate or as additional information becomes available. This material may include statements that constitute “forward‐looking statements” under the U.S. securities laws. Forward‐looking statements include, among other things, projections, estimates, and information about possible or future results related to a client’s account, or market or regulatory developments.
Important Information Regarding Risk FactorsInvestment strategies may not achieve the desired results due to implementation lag, other timing factors, portfolio management decision‐making, economic or market conditions or other unanticipated factors. The views and forecasts expressed in this material are as of the date indicated, are subject to change without notice, may not come to pass and do not represent a recommendation or offer of any particular security, strategy, or investment. All investments involve risks. Please request a copy of DoubleLine’s Form ADV Part 2A to review the material risks involved in DoubleLine’s strategies. Past performance is no guarantee of future results.
Important Information Regarding DoubleLineIn preparing the client reports (and in managing the portfolios), DoubleLine and its vendors price separate account portfolio securities using various sources, including independent pricing services and fair value processes such as benchmarking.
To receive a complimentary copy of DoubleLine Capital’s current Form ADV (which contains important additional disclosure information, including risk disclosures), a copy of the DoubleLine’s proxy voting policies and procedures, or to obtain additional information on DoubleLine’s proxy voting decisions, please contact DoubleLine’s Client Services.

80
Important Information Regarding DoubleLine’s Investment StyleDoubleLine seeks to maximize investment results consistent with our interpretation of client guidelines and investment mandate. While DoubleLine seeks to maximize returns for our clients consistent with guidelines, DoubleLine cannot guarantee that DoubleLine will outperform a client's specified benchmark or the market or that DoubleLine’s risk management techniques will successfully mitigate losses. Additionally, the nature of portfolio diversification implies that certain holdings and sectors in a client's portfolio may be rising in price while others are falling; or, that some issues and sectors are outperforming while others are underperforming. Such out or underperformance can be the result of many factors, such as but not limited to duration/interest rate exposure, yield curve exposure, bond sector exposure, or news or rumors specific to a single name.DoubleLine is an active manager and will adjust the composition of client’s portfolios consistent with our investment team’s judgment concerning market conditions and any particular sector or security. The construction of DoubleLine portfolios may differ substantially from the construction of any of a variety of bond market indices. As such, a DoubleLine portfolio has the potential to underperform or outperform a bond market index. Since markets can remain inefficiently priced for long periods, DoubleLine’s performance is properly assessed over a full multi‐year market cycle.
Important Information Regarding Client ResponsibilitiesClients are requested to carefully review all portfolio holdings and strategies, including by comparing the custodial statement to any statements received from DoubleLine. Clients should promptly inform DoubleLine of any potential or perceived policy or guideline inconsistencies. In particular, DoubleLine understands that guideline enabling language is subject to interpretation and DoubleLine strongly encourages clients to express any contrasting interpretation as soon as practical. Clients are also requested to notify DoubleLine of any updates to Client’s organization, such as (but not limited to) adding affiliates (including broker dealer affiliates), issuing additional securities, name changes, mergers or other alterations to Client’s legal structure.
DoubleLine® is a registered trademark of DoubleLine Capital LP.
© 2016 DoubleLine Capital LP
Disclaimer

81
Upcoming Webcast Announcements
Rising Rates Webcast– March 23, 2016Portfolio Managers will discuss Low Duration Bond Fund, Low Duration Emerging Markets Fund and Floating Rate FundGo to www.doublelinefunds.com, Home page under “Events”2016 Webcast Schedule to register1:15 pm PDT/4:15 pm EDT
Asset Allocation Webcast– April 12, 2016Jeffrey Gundlach will discuss Core Fixed Income and Flexible Income FundsGo to www.doublelinefunds.com, Home page under “Events”2016 Webcast Schedule to register1:15 pm PDT/4:15 pm EDT
Strategic Commodities Fund Webcast– April 26, 2016Jeffrey Sherman will hostStrategic Commodity Fund webcast titled “Commodities: Time to Revisit?”Go to www.doublelinefunds.com, Home page under “Events”2016 Webcast Schedule to register1:15 pm PDT/4:15 pm EDT
To Receive Presentation Slides:You can email [email protected]