connect for health colorado update...• connect for health colorado is implementing all state...
TRANSCRIPT
CONNECT FOR HEALTH COLORADO UPDATE Presentation to the Legislative Implementation Review Committee April 01, 2015
2
Topics for Discussion
1. Executive Director/CEO search update (Sharon O’Hara)
2. Audit implementation plan (Gary Drews)
3. Review of first and second open enrollment (Gary Drews)
4. What’s next (Gary Drews)
3
3
ED/CEO SEARCH UPDATE Sharon O’Hara, Board Chair, Connect for Health Colorado
4
4
AUDIT IMPLEMENTATION PLAN Gary Drews, Interim CEO, Connect for Health Colorado
5
Handouts for Committee Member
1. Connect for Health Colorado “Milestones, Measures, and Oversight” timeline
2. Comprehensive List of Audits and Reviews 3. Connect for Health Colorado’s “State Audit
Implementation Plan” 4. OMB A-133 Audit Dashboard
6
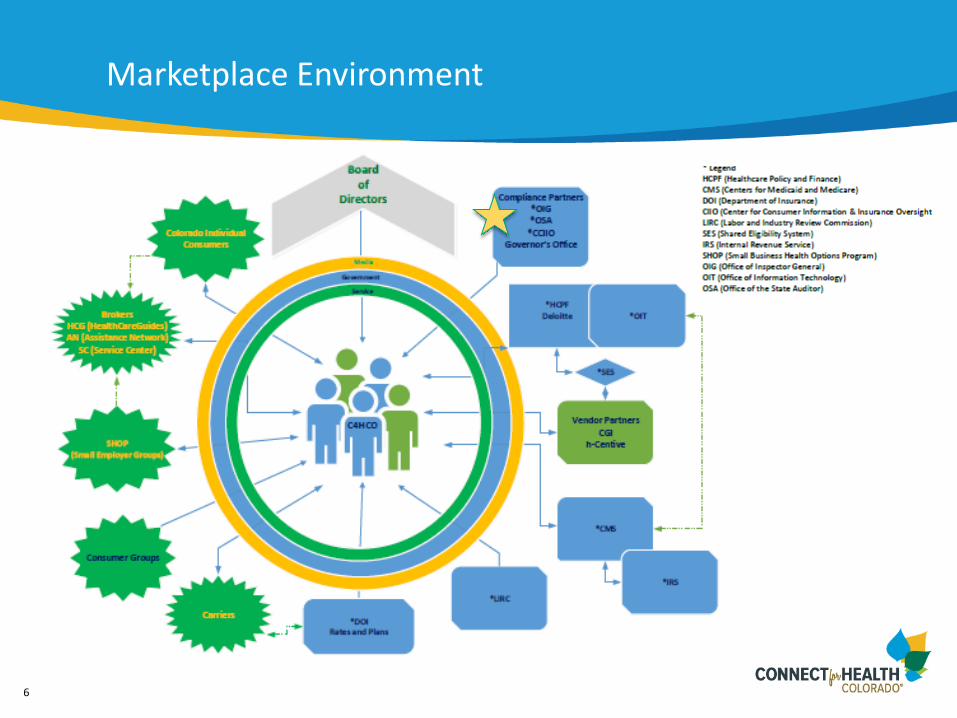
Marketplace Environment

7
Audit Update
• Recent/Ongoing Audits 1. HHS OIG Audit – ongoing 2. CMS/CCIIO Audit – preliminary draft report has been received and
responses drafted 3. CMS SMART Audit—ongoing 4. IRS Privacy and Security 5. Financial and Single A133 Audit
• Began 12/1/14 • Report presented at March 23 Board Meeting
• Hiring audit expertise to assist with audit prep, policy improvements & compliance, internal audit design/staffing

8
State and Federal Audits
Colorado OSA Limited Performance Audit • Began January 2014 (3 months after launch, half-way through 1st Open
Enrollment) and ended December 2014 • Audit found lack of available documentation to substantiate (from an audit
perspective) certain expenditures • Connect for Health Colorado is implementing all state recommendations (see
“State Audit Implementation Plan”) • An absence of adequate documentation, resulting in “questioned costs,” does not
conclude that a vendor did not provide the service, or that funds were wasted or lost. In each case the service was necessary and provided
OMB A-133 Audit • Audit reviewed financials through June 30, 2014—covering the same time period
as the OSA’s limited performance audit and has similar findings and recommendations
• Staff is making considerable progress in implementing the recommendations of this audit
• For more detail on implementation status see “OMB A-133 Audit Dashboard”

9
9
REVIEW OF OPEN ENROLLMENT Gary Drews, Interim CEO, Connect for Health Colorado
10
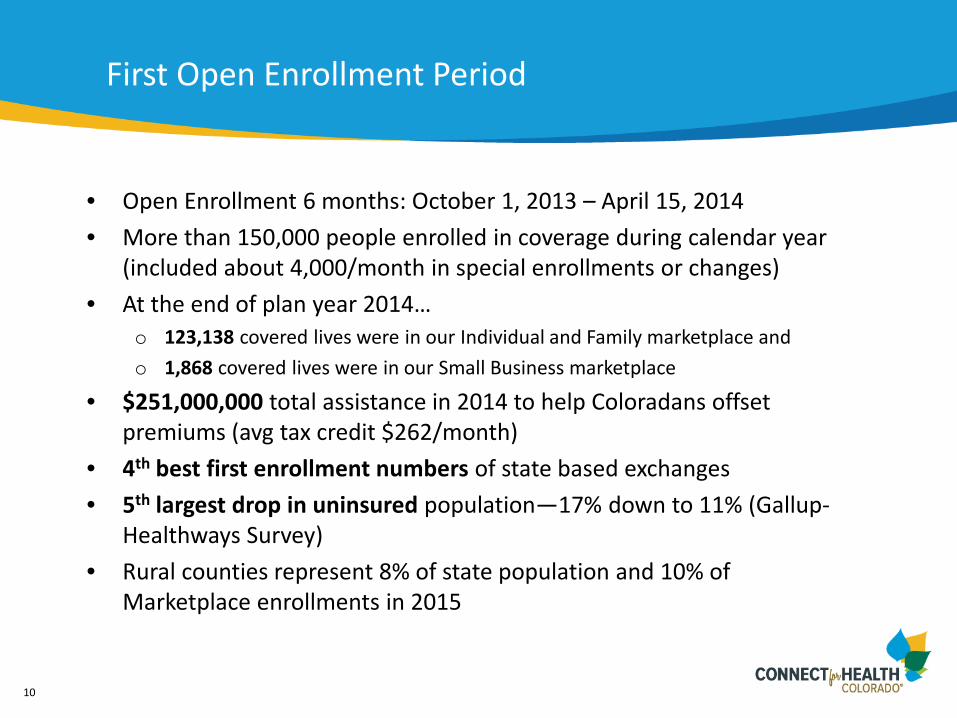
First Open Enrollment Period
• Open Enrollment 6 months: October 1, 2013 – April 15, 2014 • More than 150,000 people enrolled in coverage during calendar year
(included about 4,000/month in special enrollments or changes) • At the end of plan year 2014…
o 123,138 covered lives were in our Individual and Family marketplace and o 1,868 covered lives were in our Small Business marketplace
• $251,000,000 total assistance in 2014 to help Coloradans offset premiums (avg tax credit $262/month)
• 4th best first enrollment numbers of state based exchanges • 5th largest drop in uninsured population—17% down to 11% (Gallup-
Healthways Survey) • Rural counties represent 8% of state population and 10% of
Marketplace enrollments in 2015

11
Second Open Enrollment Period
2015 Open Enrollment exceeded the first open enrollment period • Open Enrollment 3 months: Nov. 15, 2014—Feb. 15, 2015 • Enrollments in 2015 Individual/Family Medical Plans – 141,000 covered
lives o 54% of customers received financial assistance ($228.95/mo. avg APTC) o 46% of customers had no financial assistance o 26.3% of enrollees are between 18 and 34 years old o Half of all enrollees are individuals (versus families)
• Every county (except one) had an increase in enrollments during second enrollment period compared with active policies in December 2014
• Rural counties represent 8% of state population and 10% of Marketplace enrollments in 2015
• 26% of enrollees are ages 18-34 • More than 365,000 calls to Marketplace service center
12
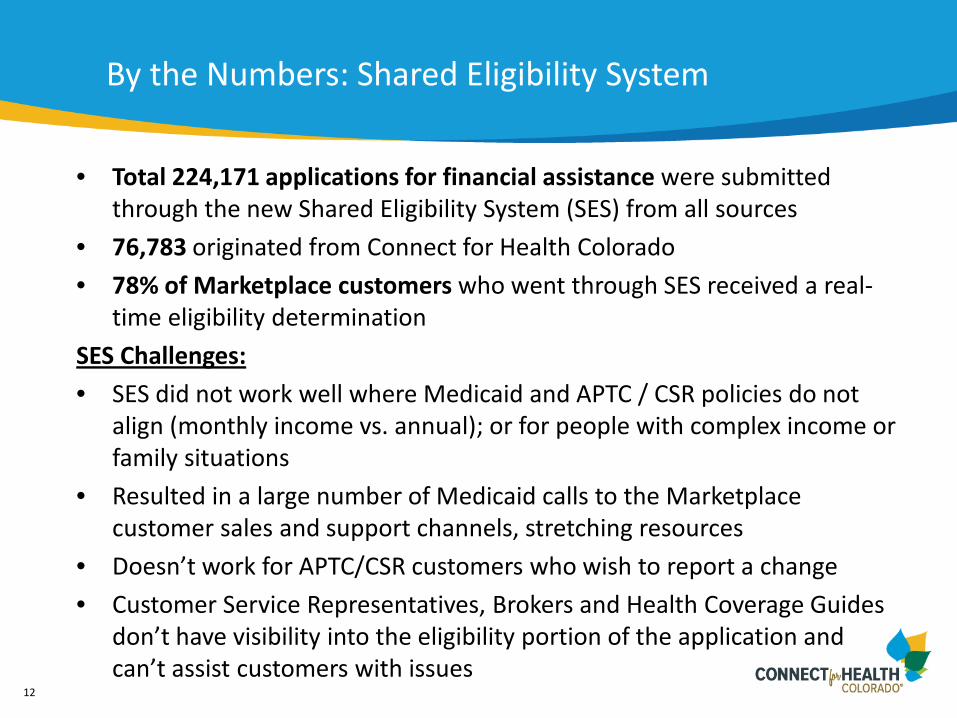
By the Numbers: Shared Eligibility System
• Total 224,171 applications for financial assistance were submitted through the new Shared Eligibility System (SES) from all sources
• 76,783 originated from Connect for Health Colorado • 78% of Marketplace customers who went through SES received a real-
time eligibility determination SES Challenges: • SES did not work well where Medicaid and APTC / CSR policies do not
align (monthly income vs. annual); or for people with complex income or family situations
• Resulted in a large number of Medicaid calls to the Marketplace customer sales and support channels, stretching resources
• Doesn’t work for APTC/CSR customers who wish to report a change • Customer Service Representatives, Brokers and Health Coverage Guides
don’t have visibility into the eligibility portion of the application and can’t assist customers with issues
13
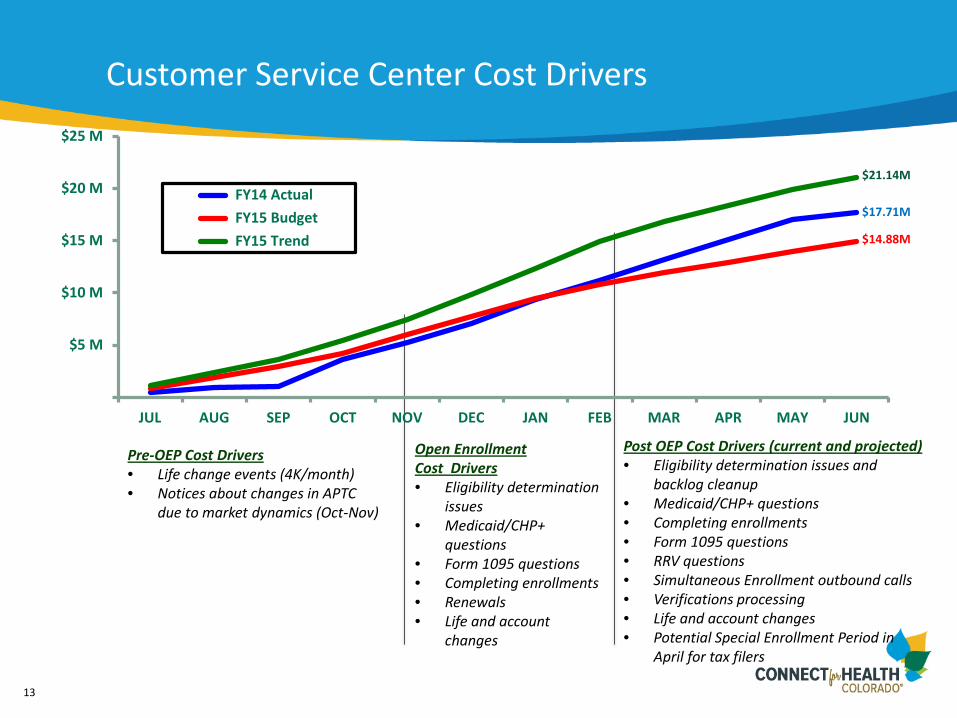
Customer Service Center Cost Drivers
Open Enrollment Cost Drivers • Eligibility determination
issues • Medicaid/CHP+
questions • Form 1095 questions • Completing enrollments • Renewals • Life and account
changes
Pre-OEP Cost Drivers • Life change events (4K/month) • Notices about changes in APTC
due to market dynamics (Oct-Nov)
Post OEP Cost Drivers (current and projected) • Eligibility determination issues and
backlog cleanup • Medicaid/CHP+ questions • Completing enrollments • Form 1095 questions • RRV questions • Simultaneous Enrollment outbound calls • Verifications processing • Life and account changes • Potential Special Enrollment Period in
April for tax filers
$5 M
$10 M
$15 M
$20 M
$25 M
JUL AUG SEP OCT NOV DEC JAN FEB MAR APR MAY JUN
FY14 Actual FY15 Budget FY15 Trend
$21.14M
$17.71M
$14.88M
14
Planning for 3rd Annual Open Enrollment
Open Enrollment for 2016 is Nov. 1, 2015 – Jan. 31, 2016
Our Priorities: 1. Improve customer experience 2. Stabilize the Marketplace 3. Achieve sustainability
15
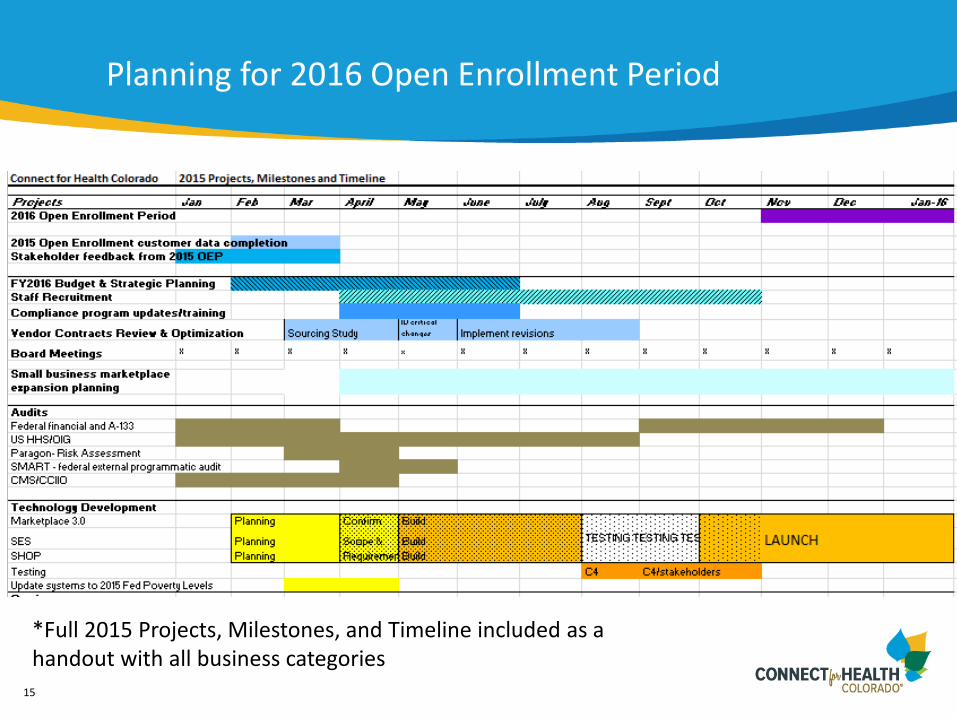
Planning for 2016 Open Enrollment Period
*Full 2015 Projects, Milestones, and Timeline included as a handout with all business categories
16
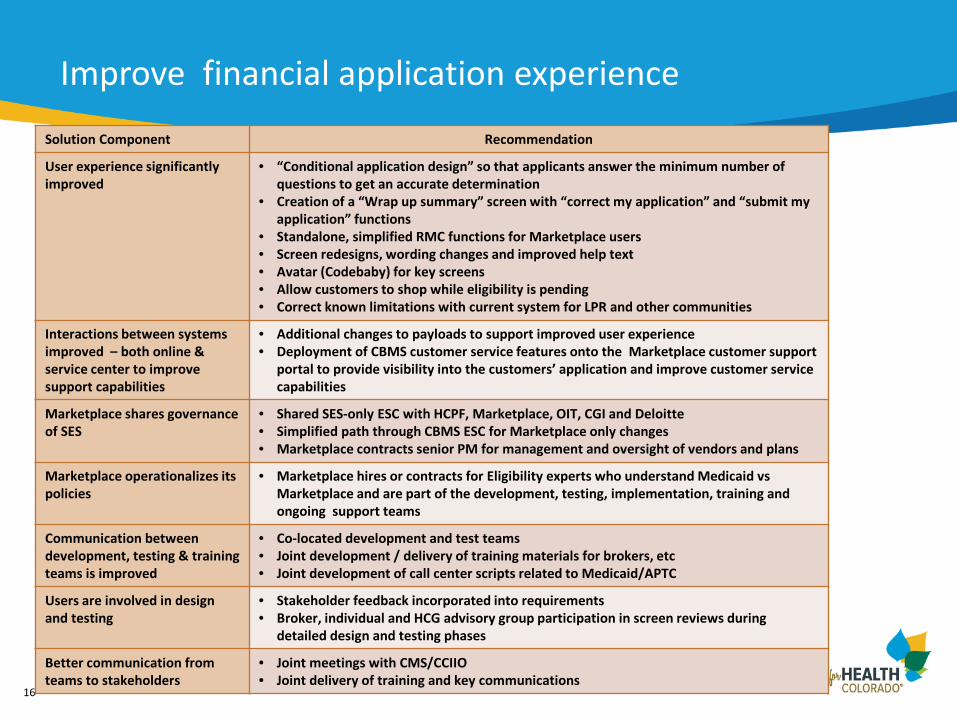
Improve financial application experience
Solution Component Recommendation
User experience significantly improved
• “Conditional application design” so that applicants answer the minimum number of questions to get an accurate determination
• Creation of a “Wrap up summary” screen with “correct my application” and “submit my application” functions
• Standalone, simplified RMC functions for Marketplace users • Screen redesigns, wording changes and improved help text • Avatar (Codebaby) for key screens • Allow customers to shop while eligibility is pending • Correct known limitations with current system for LPR and other communities
Interactions between systems improved – both online & service center to improve support capabilities
• Additional changes to payloads to support improved user experience • Deployment of CBMS customer service features onto the Marketplace customer support
portal to provide visibility into the customers’ application and improve customer service capabilities
Marketplace shares governance of SES
• Shared SES-only ESC with HCPF, Marketplace, OIT, CGI and Deloitte • Simplified path through CBMS ESC for Marketplace only changes • Marketplace contracts senior PM for management and oversight of vendors and plans
Marketplace operationalizes its policies
• Marketplace hires or contracts for Eligibility experts who understand Medicaid vs Marketplace and are part of the development, testing, implementation, training and ongoing support teams
Communication between development, testing & training teams is improved
• Co-located development and test teams • Joint development / delivery of training materials for brokers, etc • Joint development of call center scripts related to Medicaid/APTC
Users are involved in design and testing
• Stakeholder feedback incorporated into requirements • Broker, individual and HCG advisory group participation in screen reviews during
detailed design and testing phases
Better communication from teams to stakeholders
• Joint meetings with CMS/CCIIO • Joint delivery of training and key communications

17
Proposed System Changes
• Connect for Health Colorado and HCPF have a joint recommendation that would: o Streamline the online application for customers applying for Medicaid, CHP+, and
APTC/CSR (see Figure 1 below) o Allow Connect for Health Colorado staff access into the eligibility application to better
support Marketplace customers and resolve issues in a timely manner o Improved governance to allow for quicker system changes and communication across all
organizations
Customers without financial assistance
18
18
ACHIEVING SUSTAINABILITY Gary Drews, Interim CEO, Connect for Health Colorado

19
Key Considerations
• Connect for Health Colorado has used federal grants to plan, build launch and operate the Marketplace – federal monies expire in 2015
• HB13-1245 transitional funding (CoverColorado fees & reserves) include broad carrier assessment of up to $1.80 pp/pm– expires December 2016
• Private grants may be available in future • Customer Service Center costs 50% over initial projections • Assistance network devoting 40%-60% of time assisting Medicaid
customers and working eligibility issues • Technology development costs surrounding SES and resolution of
application issues exceeding projections and incurring unanticipated costs
• Marketplace fees among lowest in nation – must increase to assure viability

20
Fee Assessments
• Special Fee Assessment ($1.25 per policy per month): Preparing for 1st Quarter 2015 invoicing of Colorado Carriers for market based assessment o Over 400 Carriers have already registered for online account for quarterly
reporting o Reminder notices to be sent out to remaining Carriers o Met with Carriers and DOI to review report and invoice templates and receive
feedback o Estimated revenues of $3.5m per quarter
• Administrative User Fee (1.4%; assessed only on Marketplace Carriers) o Invoiced: $4.4m o Collected: $1.8m o To be invoiced: $1.1m

21
Preliminary Unaudited Financial Information As of February 28, 2015 ($millions)
Financial Position 2/28/2015 2/28/2014 Total Current Assets 67.3 52.0 Total Long-term Net Assets 39.0 28.7 Total Assets 106.3 80.7 Total Liabilities 24.1 30.1 Net Assets 82.2 50.6 Total Net Assets & Liabilities 106.3 80.7 Statement of Activities 8 mths ending February 28 Actual Budget Grant Revenue 54.9 49.6 Program Revenue 20.9 16.9 Total Revenue 75.8 66.6 Customer Service 19.5 14.0 Marketing 4.6 4.6 Technology 10.4 11.1 G & A 6.4 6.4 Expense Before Depreciation 40.9 36.1 Depreciation 5.8 - Total Expense 46.7 36.1 Change in Net Assets 29.1 30.5