congressional budget office douglas w. … · congressional budget office douglas w. elmendorf,...
TRANSCRIPT

www.cbo.gov
CONGRESSIONAL BUDGET OFFICE Douglas W. Elmendorf, Director U.S. Congress Washington, DC 20515
March 11, 2010 Honorable Harry Reid Majority Leader United States Senate Washington, DC 20510 Dear Mr. Leader: The Congressional Budget Office (CBO) and the staff of the Joint Committee on Taxation (JCT) have estimated the direct spending and revenue effects of H.R. 3590, the Patient Protection and Affordable Care Act (PPACA), as it was passed by the Senate on December 24, 2009. This estimate differs from our December 19 estimate for an earlier version of that legislation in that it encompasses all of the amendments that were adopted by the Senate, reflects a revised assumption about its enactment date, and incorporates some technical revisions.1 Among other things, the legislation would establish a mandate for most residents of the United States to obtain health insurance; set up insurance exchanges through which certain individuals and families could receive federal subsidies to substantially reduce the cost of purchasing that coverage; significantly expand eligibility for Medicaid; substantially reduce the growth of Medicare’s payment rates for most services (relative to the growth rates projected under current law); impose an excise tax on insurance plans with relatively high premiums; and make various other changes to the federal tax code, Medicare, Medicaid, and other programs. Updated Estimate of Budgetary Impact CBO and JCT now estimate that, on balance, the direct spending and revenue effects of enacting H.R. 3590 as passed by the Senate would yield a net reduction in federal deficits of $118 billion over the 2010–2019 period. Approximately $65 billion of that reduction would be on-budget; other effects related to Social Security revenues and spending as well as spending by the U.S. Postal Service are classified as off-budget. In the estimate that was provided on December 19, the estimated budgetary impact was a net reduction in deficits of $132 billion, of which approximately $81 billion would be on-budget. The
1 The previous estimate by CBO and JCT was provided in a letter to the Honorable Harry Reid on December 19, 2009, for an amendment in the nature of a substitute to H.R. 3590, incorporating the effects of a proposed manager’s amendment.

Honorable Harry Reid Page 2 main reasons for the differences between the earlier estimate and this estimate are described below. Tables 1 through 4 enclosed with this letter present the estimates of the direct spending, revenue, and deficit effects of H.R. 3590, as passed by the Senate. CBO and JCT’s assessment of the legislation’s impact on the federal budget deficit over the 2010–2019 period is summarized in Table 1. Table 2 shows federal budgetary cash flows for direct spending and revenues associated with the legislation. Table 3 provides estimates of the resulting changes in the number of nonelderly people in the United States who would have health insurance and presents the primary budgetary effects of the legislation’s provisions related to insurance coverage. Table 4 displays detailed estimates of the costs or savings from other proposed changes (primarily to the Medicare program) that would affect the federal government’s direct spending and some aspects of revenues. Detailed estimates of the impact of the tax provisions in the legislation are provided by JCT in JCX-61-09 (see www.jct.gov).2 The estimate provided here covers the 2010–2019 period, consistent with the budget horizon used under S. Con. Res. 13, the Concurrent Resolution on the Budget for Fiscal Year 2010. (The Congress has not yet adopted a new budget resolution that would extend the House and Senate budget enforcement periods through 2020.) Because the legislation would affect direct spending and revenues, pay-as-you-go procedures would apply. The time periods used for pay-as-you-go calculations under the new Statutory Pay-As-You-Go Act extend from fiscal year 2010 through fiscal years 2015 and 2020. Although CBO and JCT have not conducted a detailed analysis of the legislation’s effects in 2020, enactment of the legislation would probably reduce the budget deficit modestly in that year. Reflecting that assessment, CBO and JCT estimate that enacting H.R. 3590 would reduce projected on-budget deficits both through 2015 and through 2020.3
2 After JCX-61-09 was published, JCT made a small change to the estimate of the impact of limiting contributions to flexible spending accounts. That change increases the estimated revenues by about $1 billion over the 2010-2019 period. 3 Pay-as-you-go procedures do not apply to off-budget effects, which include changes to Social Security or the U.S. Postal Service. Under the Statutory Pay-As-You-Go Act, estimated changes in the on-budget deficit from direct spending and revenues are recorded on 5-year and 10-year “scorecards” by the Office of Management and Budget, which is required to order a sequestration (cancellation) of certain direct spending if either scorecard reflects a net cost in the budget year at the end of a Congressional session.

Honorable Harry Reid Page 3 Table 1. Estimate of the Effects on the Deficit From Direct Spending and Revenues
Resulting From H.R. 3590, the Patient Protection and Affordable Care Act, as Passed by the Senate
By Fiscal Year, in Billions of Dollars
2010 2011 2012 2013 2014 2015 2016 2017
2018 20192010-2014
2010-2019
NET CHANGES IN THE DEFICIT FROM INSURANCE COVERAGE PROVISIONS a,b Effects on the Deficit 3 7 9 4 34 69 110 123 129 136 56 624
NET CHANGES IN THE DEFICIT FROM OTHER PROVISIONS AFFECTING DIRECT SPENDING c Effects on the Deficit of Changes in Outlays 2 -3 -13 -27 -45 -53 -65 -79 -91 -106 -85 -478
NET CHANGES IN THE DEFICIT FROM OTHER PROVISIONS AFFECTING REVENUES d Effects on the Deficit of Changes in Revenues -1 -6 -10 -30 -27 -33 -35 -38 -41 -42 -75 -264
NET CHANGES IN THE DEFICIT a Net Increase or Decrease (-) in the Budget Deficit 4 -3 -14 -53 -38 -16 10 6 -3 -11 -104 -118 On-Budget 4 -3 -14 -49 -36 -11 18 16 8 1 -98 -65 Off-Budget e * * * -4 -2 -5 -8 -10 -11 -13 -6 -53 Memorandum: Effects on the Deficit of H.R. 3590, Incorporating the Manager’s Amendment, as Estimated on December 19
Net Increase or Decrease 5 -8 -20 -54 -35 -12 10 3 -7 -16 -111 -132 On-Budget 5 -7 -19 -49 -34 -8 18 13 4 -3 -105 -81 Off-Budget e * * * -5 -1 -4 -8 -10 -11 -13 -6 -52 Continued

Honorable Harry Reid Page 4
Table 1. Continued. Sources: Congressional Budget Office and staff of the Joint Committee on Taxation (JCT). Notes: Positive numbers indicate increases in the deficit, and negative numbers indicate reductions in the deficit. Components may not sum to totals because of rounding; * = between 0.5 billion and -0.5 billion. a. Does not include effects on spending subject to future appropriation. b. Includes excise tax on high-premium insurance plans. c. These estimates reflect the effects of provisions affecting Medicare, Medicaid, and other federal health programs, and include
the effects of interactions between insurance coverage provisions and those programs. d. The changes in revenues include effects on Social Security revenues, which are classified as off-budget. The 10-year figure of
$264 billion includes $249 billion in revenues from tax provisions (estimated by JCT) apart from receipts from the excise tax on high-premium insurance plans and $14 billion in revenues from certain provisions affecting Medicare, Medicaid, and other programs (estimated by CBO and JCT).
e. Off-budget effects include changes in Social Security spending and revenues as well as spending by the U.S. Postal Service.
Differences from Previous Estimate The estimate provided here differs from the one that was issued on December 19 for several reasons:
It incorporates a number of technical corrections to the estimates of the legislation’s provisions related to insurance coverage, the effect of which is to increase the gross cost of those provisions over the 2010–2019 period by about $4 billion (from $871 billion to $875 billion) and to increase the net cost of those provisions by about $10 billion (from $614 billion to $624 billion). Those technical corrections also yield relatively small changes in the estimated sources of insurance coverage under the legislation (see Table 3).
It reflects an updated assumption about when the legislation would be enacted, a step that is now assumed to occur in the spring of 2010; the previous estimate assumed enactment by the end of December 2009. It also includes some technical corrections as well as adjustments to account for laws enacted since December 18, 2009—in particular, an adjustment related to the Medicare Improvement Fund (which is discussed further below). Those changes increase the estimated cost of the provisions that are not related to insurance coverage by about $5 billion over 10 years.
Honorable Harry Reid Page 5
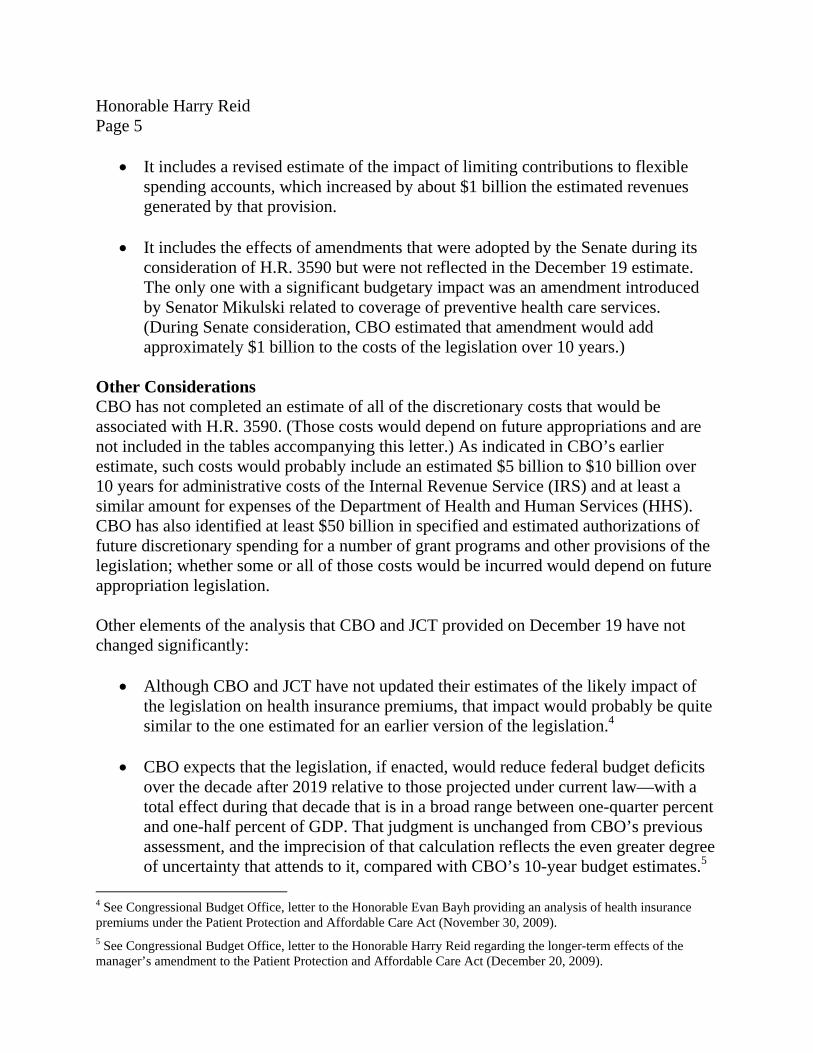
It includes a revised estimate of the impact of limiting contributions to flexible
spending accounts, which increased by about $1 billion the estimated revenues generated by that provision.
It includes the effects of amendments that were adopted by the Senate during its consideration of H.R. 3590 but were not reflected in the December 19 estimate. The only one with a significant budgetary impact was an amendment introduced by Senator Mikulski related to coverage of preventive health care services. (During Senate consideration, CBO estimated that amendment would add approximately $1 billion to the costs of the legislation over 10 years.)
Other Considerations CBO has not completed an estimate of all of the discretionary costs that would be associated with H.R. 3590. (Those costs would depend on future appropriations and are not included in the tables accompanying this letter.) As indicated in CBO’s earlier estimate, such costs would probably include an estimated $5 billion to $10 billion over 10 years for administrative costs of the Internal Revenue Service (IRS) and at least a similar amount for expenses of the Department of Health and Human Services (HHS). CBO has also identified at least $50 billion in specified and estimated authorizations of future discretionary spending for a number of grant programs and other provisions of the legislation; whether some or all of those costs would be incurred would depend on future appropriation legislation. Other elements of the analysis that CBO and JCT provided on December 19 have not changed significantly:
Although CBO and JCT have not updated their estimates of the likely impact of the legislation on health insurance premiums, that impact would probably be quite similar to the one estimated for an earlier version of the legislation.4
CBO expects that the legislation, if enacted, would reduce federal budget deficits
over the decade after 2019 relative to those projected under current law—with a total effect during that decade that is in a broad range between one-quarter percent and one-half percent of GDP. That judgment is unchanged from CBO’s previous assessment, and the imprecision of that calculation reflects the even greater degree of uncertainty that attends to it, compared with CBO’s 10-year budget estimates.5
4 See Congressional Budget Office, letter to the Honorable Evan Bayh providing an analysis of health insurance premiums under the Patient Protection and Affordable Care Act (November 30, 2009). 5 See Congressional Budget Office, letter to the Honorable Harry Reid regarding the longer-term effects of the manager’s amendment to the Patient Protection and Affordable Care Act (December 20, 2009).

Honorable Harry Reid Page 6
Under the legislation, federal outlays for health care would increase during the 2010–2019 period, as would the federal budgetary commitment to health care.6 CBO now estimates that the federal commitment would increase by about $210 billion over that period, rather than by $200 billion as previously estimated. In subsequent years, however, the effects of the proposal that would tend to decrease the federal budgetary commitment to health care would grow faster than those that would increase it. As a result, CBO expects that the proposal would generate a reduction in the federal budgetary commitment to health care during the decade following 2019; that judgment is unchanged from CBO’s previous assessment.
CBO and JCT have determined that the legislation contains several
intergovernmental and private-sector mandates as defined in the Unfunded Mandates Reform Act (UMRA). The total cost of those mandates to state, local, and tribal governments and the private sector would greatly exceed the thresholds established in UMRA ($70 million and $141 million, respectively, in 2010, adjusted annually for inflation).
There is some question as to how section 3112 of H.R. 3590, which changes funding for the Medicare Improvement Fund (MIF), would be implemented. That section would strike the amount that, until recently, was the funding provided for the MIF for 2014 and replace it with zero, thereby yielding savings that would offset part of the cost of H.R. 3590. However, the underlying provision that section 3112 would amend was changed by the Department of Defense Appropriations Act, 2010 (Public Law 111-118), so the amount of current-law funding for 2014 has changed (from about $22.3 billion to $20.7 billion). This estimate incorporates the assumption that enacting H.R. 3590 would reduce the funding for the MIF for 2014 to zero—the clear intent of section 3112—thus yielding savings of $20.7 billion. An alternative interpretation would be that enacting section 3112 would have no effect because it now contains an incorrect reference to current law. However, experts in appropriations law and statutory construction have advised CBO that, regardless of the technical error in describing current-law funding, the intention to set the funding at zero in 2014 is clear, and the provision would probably be interpreted and implemented accordingly.7 6 For additional discussion of this term, see Congressional Budget Office, letter to the Honorable Max Baucus regarding different measures for analyzing current proposals to reform health care (October 30, 2009). 7 Statutory interpretation usually begins and ends with the plain meaning of legislative language. In rare cases where a literal interpretation would be demonstrably at odds with Congressional intent, an interpretation that gives full effect to Congressional intent is preferred over a literal interpretation. See United States v. Ron Pair Enters., Inc., 489 U.S. 235, 242 (1989). Further, a literal interpretation would render section 3112 a nullity—a result to be avoided under principles of statutory interpretation.

Honorable Harry Reid Page 7 I hope this analysis is helpful for the deliberations of the Congress. If you have any questions, please contact me or CBO staff. The primary staff contacts for this analysis are Philip Ellis and Holly Harvey.
Sincerely,
Douglas W. Elmendorf Director
Enclosures cc: Honorable Mitch McConnell Republican Leader Honorable Max Baucus Chairman Committee on Finance Honorable Chuck Grassley Ranking Member Honorable Tom Harkin Chairman Committee on Health, Education, Labor, and Pensions Honorable Michael B. Enzi Ranking Member Honorable Kent Conrad Chairman Committee on the Budget Honorable Judd Gregg Ranking Member

Table 2. Estimated Changes in Direct Spending and Revenues Resulting From H.R. 3590,
the Patient Protection and Affordable Care Act, as Passed by the Senate By Fiscal Year, in Billions of Dollars
2010 2011 2012 2013 2014 2015 2016 2017
2018 20192010-2014
2010-2019
CHANGES IN DIRECT SPENDING (OUTLAYS) Health Insurance Exchanges Premium and Cost
Sharing Subsidies
0 0 0 0 14 31 56 72
79 86 14 337 Start-up Costs * * * 1 * * 0 0 0 0 2 2 Other Related Spending 0 1 2 2 1 * * * * 0 5 5 Subtotal * 2 2 2 15 31 56 72 79 86 21 344 Reinsurance and Risk Adjustment Payments a
0 0 0 0 11 18 18 18
19 21 11 106
Effects of Coverage Provisions on Medicaid and CHIP
* -1 -2 -4 25 51 75 78
80 86 18 386 Medicare and Other Medicaid and CHIP Provisions
Reductions in Annual Updates to Medicare FFS Payment Rates
* -1 -5 -9 -13 -18 -24 -31
-38 -46 -28 -186 Medicare Advantage
Rates Based on Plans’ Bids
0 -6 -7 -10 -11 -12 -14 -17
-19 -22 -34 -118 Medicare and Medicaid
DSH Payments
0 0 * * * -7 -8 -9 -9 -10 * -43 Other 1 * -1 -2 -14 -9 -9 -12 -16 -20 -16 -82 Subtotal 1 -8 -12 -21 -39 -46 -56 -70 -82 -97 -79 -430 Other Changes in Direct Spending
Community Living Assistance Services and Supports
0 0 -5 -9 -10 -11 -11 -9
-8 -7 -24 -70 Other 2 6 6 4 4 3 1 -2 -3 -2 21 19 Subtotal 2 6 1 -5 -6 -8 -10 -11 -10 -9 -3 -51 Total Outlays 3 -2 -11 -28 6 45 83 87 85 85 -31 355 On-budget 3 -2 -11 -28 6 45 83 86 84 84 -32 351 Off-budget 0 * * * * * 1 1 1 1 * 4
Continued

Table 2. Continued. By Fiscal Year, in Billions of Dollars
2010 2011 2012 2013 2014 2015 2016 2017
2018 20192010-2014
2010-2019
CHANGES IN REVENUES Coverage-Related Provisions Exchange Premium
Credits
0 0 0 0 -5 -11 -18 -22
-24 -26 -5 -106 Reinsurance and Risk
Adjustment Collections
0 0 0 0 12 16 18 18
19 22 12 106 Small Employer Tax
Credit
-2 -4 -5 -6 -5 -3 -3 -3
-4 -4 -21 -37 Penalty Payments by
Employers and Uninsured Individuals
0 0 0 0 2 5 7 8
9 10 2 39 Excise Tax on High-
Premium Plans
0 0 0 7 13 17 22 26
30 35 20 149 Associated Effects of
Coverage Provisions on Revenues
* -1 -2 -6 * 4 12 16 17 18 -10 57 Other Provisions Fees on Certain
Manufacturers and Insurers b
2 6 8 10 12 12 12 13
14 14 37 101 Additional Hospital
Insurance Tax
0 0 0 13 6 10 13 14
15 15 19 87 Other Revenue
Provisions c
-1 1 2 7 9 10 10 11
13 13 19 77 Total Revenues -1 1 3 26 44 61 73 81 88 97 73 473 On-budget -1 1 3 21 42 56 64 70 76 83 67 416 Off-budget * * * 4 2 5 9 11 12 14 6 57
NET IMPACT ON THE DEFICIT FROM CHANGES IN DIRECT SPENDING AND REVENUES d Net Change in the Deficit 4 -3 -14 -53 -38 -16 10 6 -3 -11 -104 -118 On-budget 4 -3 -14 -49 -36 -11 18 16 8 1 -98 -65 Off-budget * * * -4 -2 -5 -8 -10 -11 -13 -6 -53
Continued

Table 2. Continued. Sources: Congressional Budget Office and the staff of the Joint Committee on Taxation. Notes: Does not include effects on spending subject to future appropriation. Components may not sum to totals because of
rounding. * = between $0.5 billion and -$0.5 billion. CHIP = Children’s Health Insurance Program; FFS = Fee-for-service; DSH = Disproportionate Share Hospital. a. Risk adjustment payments lag revenues shown later in the table by one quarter. Reinsurance payments total $20 billion over
the 10-year period. b. Amounts include fees on manufacturers and importers of branded drugs and certain medical devices as well as fees on health
insurance providers. c. Amounts include $62 billion in increased revenues, as estimated by JCT, for tax provisions other than those broken out
separately in the table. In addition, this line includes an increase in revenues of about $14 billion for other provisions shown in Table 4.
d. Positive numbers indicate increases in the deficit, and negative numbers indicate reductions in the deficit.

EFFECTS ON INSURANCE COVERAGE /a 2010 2011 2012 2013 2014 2015 2016 2017 2018 2019
(Millions of nonelderly people, by calendar year)
Current Law Medicaid & CHIP 40 39 39 38 35 34 35 35 35 35
Coverage /b Employer 150 153 156 158 161 162 162 162 162 162
Nongroup & Other /c 27 26 25 26 28 29 29 29 30 30
Uninsured /d 50 51 51 51 51 51 52 53 53 54
TOTAL 267 269 271 273 274 276 277 279 281 282
Change (+/-) Medicaid & CHIP * -1 -2 -3 9 14 16 15 14 15
Employer * 2 2 2 2 * -4 -4 -4 -4
Nongroup & Other /c * * * * -2 -3 -5 -5 -5 -5
Exchanges 0 0 0 0 8 13 22 24 25 25
Uninsured /d * -1 * * -17 -24 -30 -30 -30 -31
Post-Policy Uninsured Population
Number of Nonelderly People /d 50 50 50 51 33 27 22 22 23 24
Insured Share of the Nonelderly Population /a
Including All Residents 81% 81% 81% 81% 88% 90% 92% 92% 92% 92%
Excluding Unauthorized Immigrants 83% 83% 83% 83% 90% 92% 94% 94% 94% 94%
Memo: Exchange Enrollees and Subsidies
Number w/ Unaffordable Offer from Employer /e * 1 1 1 1 1
Number of Unsubsidized Exchange Enrollees 2 3 5 6 6 6
Average Exchange Subsidy per Subsidized Enrollee $5,000 $5,100 $5,200 $5,400 $5,800
Sources: Congressional Budget Office and the staff of the Joint Committee on Taxation.
Note: CHIP = Children's Health Insurance Program; * = fewer than 0.5 million people.
a. Figures for the nonelderly population include only residents of the 50 states and the District of Columbia.
b. Figures reflect average annual enrollment; individuals reporting multiple sources of coverage are assigned a primary source.
c. Other, which includes Medicare, accounts for about half of current-law coverage in this category; the effects of the proposal are almost entirely on nongroup coverage. 3/11/2010
d. The count of uninsured people includes unauthorized immigrants as well as people who are eligible for, but not enrolled in, Medicaid. Page 1 of 2
e. Workers who would have to pay more than a specified share of their income (9.8 percent in 2014) for employment-based coverage could receive subsidies via an exchange.
TABLE 3. Estimated Effects of the Insurance Coverage Provisions Contained in H.R. 3590, the Patient Protection and
Affordable Care Act, as Passed by the Senate

EFFECTS ON THE FEDERAL DEFICIT / a,b 2010 2011 2012 2013 2014 2015 2016 2017 2018 2019 2010-2019
(Billions of dollars, by fiscal year)
Medicaid & CHIP Outlays /c 0 -1 -2 -4 25 51 75 78 80 86 386
Exchange Subsidies & Related Spending /d 0 2 2 2 19 42 74 94 103 111 449
Small Employer Tax Credits /e 2 4 5 6 5 3 3 3 4 4 40
Gross Cost of Coverage Provisions 2 5 5 4 49 97 152 175 186 200 875
Penalty Payments by Uninsured Individuals 0 0 0 0 0 -1 -2 -4 -4 -4 -15
Penalty Payments by Employers /e 0 0 0 0 -2 -4 -5 -5 -6 -6 -27
Excise Tax on High-Premium Insurance Plans /e 0 0 0 -7 -13 -17 -22 -26 -30 -35 -149
Other Effects on Tax Revenues and Outlays /f 1 2 3 7 0 -5 -13 -17 -18 -20 -60
NET COST OF COVERAGE PROVISIONS 3 7 9 4 34 69 110 123 129 136 624
Sources: Congressional Budget Office and the staff of the Joint Committee on Taxation.
Note: CHIP = Children's Health Insurance Program.
a. Does not include several billion dollars in federal administrative costs that would be subject to appropriation.
b. Components may not sum to totals because of rounding; positive numbers indicate increases in the deficit, and negative numbers indicate reductions in the deficit.
e. The effects on the deficit of this provision include the associated effects of changes in taxable compensation on tax revenues. 3/11/2010
Page 2 of 2f. The effects are almost entirely on tax revenues. CBO estimates that outlays for Social Security benefits would increase by about $3 billion over the 2010-2019 period,
and that the coverage provisions would have negligible effects on outlays for other federal programs.
c. Under current law, states have the flexibility to make programmatic and other budgetary changes to Medicaid and CHIP. CBO estimates that state spending on
Medicaid and CHIP in the 2010-2019 period would increase by about $30 billion as a result of the coverage provisions.
d. Includes $5 billion in spending for high-risk pools and the net budgetary effects of proposed collections and payments for reinsurance and risk adjustment.
TABLE 3. Estimated Effects of the Insurance Coverage Provisions Contained in H.R. 3590, the Patient Protection and
Affordable Care Act, as Passed by the Senate

Table 4. Estimate of Effects on Direct Spending and Revenues for Non-Coverage Provisions of H.R. 3590,
the Patient Protection and Affordable Care Act, as Passed by the SenateBy fiscal year, in billions of dollars.
2010 2011 2012 2013 2014 2015 2016 2017 2018 2019
2010-
2014
2010-
2019
Changes in Direct Spending Outlays
TITLE I—QUALITY, AFFORDABLE HEALTH CARE FOR ALL AMERICANS
Subtitle A—Immediate Improvements in Health Care Coverage for All Americans
1001 Amendments to the Public Health Service Act Included in estimate for expanding health insurance coverage.
1002 Helping Consumers Receive Quality Accountable Coverage * * * 0 0 0 0 0 0 0 * *
Subtitle B—Immediate Assistance to Preserve and Expand Coverage
1101 Temporary High Risk Health Insurance Pool Included in estimate for expanding health insurance coverage.
1102 Reinsurance for Early Retirees 1.3 2.5 1.3 0 0 0 0 0 0 0 5.0 5.0
1103 Immediate Assistance to Consumers in Identifying
Affordable Coverage Options Included in estimate for expanding health insurance coverage.
1104 Administrative Simplification
Effects on Medicaid spending 0 * -0.1 -0.1 -0.2 -0.4 -0.8 -1.7 -1.8 -2.0 -0.4 -7.1
Effects on exchange subsidies 0 0 0 0 -0.1 -0.3 -0.6 -1.0 -1.2 -1.2 -0.1 -4.3
Subtitle C—Effective Coverage for All Americans Included in estimate for expanding health insurance coverage.
Subtitle D—Available Coverage for All Americans Included in estimate for expanding health insurance coverage.
Subtitle E—Affordable Coverage for All Americans Included in estimate for expanding health insurance coverage.
Subtitle F—Shared Responsibility for Health Care Included in estimate for expanding health insurance coverage.
Subtitle G—Miscellaneous Provisions
1556 Equity for Certain Eligible Survivors * * * * * * * * * * * *
Sections 1551-1555 and 1557-1562 Included in estimate for expanding health insurance coverage.
Congressional Budget Office Page 1 of 16 3/11/2010

Table 4. Estimate of Effects on Direct Spending and Revenues for Non-Coverage Provisions of H.R. 3590,
the Patient Protection and Affordable Care Act, as Passed by the SenateBy fiscal year, in billions of dollars.
2010 2011 2012 2013 2014 2015 2016 2017 2018 2019
2010-
2014
2010-
2019
TITLE II—ROLE OF PUBLIC PROGRAMS
Subtitle A—Improved Access to Medicaid
2001 Medicaid Coverage for the Lowest Income Populations Included in estimate for expanding health insurance coverage.
2002 Income Eligibility for Nonelderly Determined Using
Modified Gross Income Included in estimate for expanding health insurance coverage.
2003 Requirement to Offer Premium Assistance for
Employer-Sponsored Insurance Included in estimate for expanding health insurance coverage.
2004 Medicaid Coverage for Former Foster Care Children Included in estimate for expanding health insurance coverage.
2005 Payments to Territories 0 0.1 0.1 0.1 0.7 0.7 0.8 0.8 0.9 1.0 1.0 5.3
2006 Special Adjustment to FMAP Determination for
Certain States Recovering from a Major Disaster 0 0.1 0.1 0 0 0 0 0 0 0 0.2 0.2
2007 Medicaid Improvement Fund Rescission 0 0 0 0 * -0.2 -0.2 -0.2 -0.2 0 * -0.6
Subtitle B—Enhanced Support for the Children’s Health Insurance Program
2101 Additional Federal Financial Participation for CHIP Included in estimate for expanding health insurance coverage.
2102 Technical Corrections 0 0 0 0 0.1 * * 0 0 0 0.1 0.1
Subtitle C—Medicaid and CHIP Enrollment Simplification Included in estimate for expanding health insurance coverage.
Subtitle D—Improvements to Medicaid Services
2301 Coverage for Freestanding Birth Center Services * * * * * * * * * * * *
2302 Concurrent Care for Children * * * * * * * * * * 0.1 0.2
2303 State Eligibility Option for Family Planning Services 0 0 0 0 0 0 0 0 0 0 0 0
2304 Clarification of Definition of Medical Assistance 0 0 0 0 0 0 0 0 0 0 0 0
Congressional Budget Office Page 2 of 16 3/11/2010

Table 4. Estimate of Effects on Direct Spending and Revenues for Non-Coverage Provisions of H.R. 3590,
the Patient Protection and Affordable Care Act, as Passed by the SenateBy fiscal year, in billions of dollars.
2010 2011 2012 2013 2014 2015 2016 2017 2018 2019
2010-
2014
2010-
2019
Subtitle E—New Options for States to Provide Long-Term Services and Supports
2401 Community First Choice Option 0 0.1 0.2 0.3 0.7 0.8 0.9 1.1 1.2 1.5 1.3 6.9
2402 Removal of Barriers to Providing Home and
Community-Based Services 0 0.1 0.1 0.1 0.2 0.3 0.3 0.4 0.4 0.4 0.5 2.3
2403 Money Follows the Person Rebalancing Demonstration 0 0 0 * 0.1 0.2 0.3 0.4 0.3 0.3 0.2 1.7
2404 Protection for Recipients of Home and Community-Based
Services Against Spousal Impoverishment 0 0 0 0 0.2 0.3 0.3 0.3 0.3 0.2 0.2 1.5
2405 Funding to Expand State Aging and Disability Resource Centers * * * * * * * * 0 0 * 0.1
2406 Sense of the Senate Regarding Long-Term Care 0 0 0 0 0 0 0 0 0 0 0 0
10202 Incentives for States to Offer Home and Community-Based
Services as a Long-Term Care Alternative to Nursing Homes 0 * 0.1 0.2 0.2 0.3 0.2 0.2 0.2 0.2 0.6 1.6
Subtitle F—Medicaid Prescription Drug Coverage -0.4 -2.6 -3.2 -3.3 -3.7 -4.1 -4.6 -5.0 -5.3 -5.7 -13.2 -38.0
Subtitle G—Medicaid Disproportionate Share Hospital (DSH) Payments 0 0 * * * -2.8 -3.6 -3.8 -3.9 -4.0 * -18.1
Subtitle H—Improved Coordination for Dual Eligible Beneficiaries
2601 5-Year Period for Demonstration Projects 0 0 0 0 0 0 0 0 0 0 0 0
2602 Providing Federal Coverage and Payment Coordination for
Dual Eligible Beneficiaries 0 0 0 0 0 0 0 0 0 0 0 0
Subtitle I—Improving the Quality of Medicaid for Patients and Providers
2701 Adult Health Quality Measures * * * 0.1 0.1 * * * * 0 0.2 0.3
2702 Payment Adjustment for Health Care-Acquired Conditions 0 0 * * * * * * * * * *
2703 State Option to Provide Health Homes for Enrollees With
Chronic Conditions 0 * * 0.1 0.1 0.1 0.1 0.1 0.1 0.1 0.2 0.7
2704 Demonstration Project to Evaluate Integrated Care
Around a Hospitalization 0 0 0 0 0 0 0 0 0 0 0 0
2705 Medicaid Global Payment System Demonstration Project 0 0 0 0 0 0 0 0 0 0 0 0
2706 Pediatric Accountable Care Organization Demonstration Project 0 0 0 0 0 0 0 0 0 0 0 0
2707 Medicaid Emergency Psychiatric Demonstration Project 0 * * * * * 0 0 0 0 0.1 0.1
Congressional Budget Office Page 3 of 16 3/11/2010

Table 4. Estimate of Effects on Direct Spending and Revenues for Non-Coverage Provisions of H.R. 3590,
the Patient Protection and Affordable Care Act, as Passed by the SenateBy fiscal year, in billions of dollars.
2010 2011 2012 2013 2014 2015 2016 2017 2018 2019
2010-
2014
2010-
2019
Subtitle J—Improvements to the Medicaid and CHIP Payment and * * 0 0 0 0 0 0 0 0 * *
Access Commission (MACPAC)
Subtitle K—Protections for American Indians and Alaska Natives
2901 Special Rules Relating to Indians
No Cost Sharing for Indians with Income at or Below
300 Percent of Poverty Enrolled in Coverage
Through a State Exchange Included in estimate for expanding health insurance coverage.
Payer of Last Resort and Express-Lane Option 0 0 0 0 0 0 0 0 0 0 0 0
2902 Elimination of Sunset for Payment for Medicare Part B Services
Furnished by Certain Indian Hospitals and Clinics 0 * * * * * * * * * 0.1 0.2
10221 Indian Health Improvement Act * * * * * * * * * * * *
Subtitle L—Maternal and Child Health Services
2951 Maternal, Infant, and Early Childhood Home Visiting Programs * 0.1 0.3 0.4 0.4 0.2 0.1 * 0 0 1.2 1.5
2952 Support, Education, and Research for Postpartum Depression 0 0 0 0 0 0 0 0 0 0 0 0
2953 Personal Responsibility Education * * 0.1 0.1 0.1 0.1 * * * 0 0.3 0.4
2954 Restoration of Funding for Abstinence Education * * * * * * * * * 0 0.1 0.1
2955 Inclusion of Information About The Importance of Having a
Health-Care Power of Attorney in Transition Planning for
Children Aging Out of Foster Care and
Independent Living Programs 0 0 0 0 0 0 0 0 0 0 0 0
10211-10214 Support for Pregnant and Parenting Teens and Women * * * * * * * * * * 0.1 0.2
Congressional Budget Office Page 4 of 16 3/11/2010

Table 4. Estimate of Effects on Direct Spending and Revenues for Non-Coverage Provisions of H.R. 3590,
the Patient Protection and Affordable Care Act, as Passed by the SenateBy fiscal year, in billions of dollars.
2010 2011 2012 2013 2014 2015 2016 2017 2018 2019
2010-
2014
2010-
2019
TITLE III—IMPROVING THE QUALITY AND EFFICIENCY OF HEALTH CARE
Subtitle A—Transforming the Health Care Delivery System
PART I—LINKING PAYMENT TO QUALITY OUTCOMES UNDER THE MEDICARE PROGRAM
3001 Hospital Value-Based Purchasing Program 0 0 0 0 0 0 0 0 0 0 0 0
3002 Improvements to the Physician Quality Reporting System
PPO Stabilization Fund 0 0 0 0 -0.1 * 0 0 0 0 -0.1 -0.2
Physicians' Services 0 0 0.2 0.2 0.2 0.3 -0.1 -0.2 -0.2 -0.2 0.6 0.3
3003 Improvements to the Physician Feedback Program 0 0 0 0 0 0 0 0 0 0 0 0
3004 Quality Reporting for Long-Term Care Hospitals,
Inpatient Rehabilitation Hospitals, and Hospice Programs 0 0 0 0 0 * * * * * 0 -0.1
3005 Quality Reporting for PPS-Exempt Cancer Hospitals 0 0 0 0 0 0 0 0 0 0 0 0
3006 Plans for a Value-Based Purchasing Program for
Skilled Nursing Facilities and Home Health Agencies 0 0 0 0 0 0 0 0 0 0 0 0
3007 Value-based Payment Modifier Under the Physician Fee Schedule 0 0 0 0 0 0 0 0 0 0 0 0
3008 Payment Adjustment for Conditions Acquired in Hospitals 0 0 0 0 0 -0.3 -0.3 -0.3 -0.3 -0.3 0 -1.4
PART II—NATIONAL STRATEGY TO IMPROVE HEALTH CARE QUALITY
3011 National Strategy 0 0 0 0 0 0 0 0 0 0 0 0
3012 Interagency Working Group on Health Care Quality 0 0 0 0 0 0 0 0 0 0 0 0
3013 Quality Measure Development 0 0 0 0 0 0 0 0 0 0 0 0
3014 Quality Measurement * * * * * * 0 0 0 0 0.1 0.1
3015 Data Collection; Public Reporting 0 0 0 0 0 0 0 0 0 0 0 0
Effect of Quality-Measure Development/Endorsement Provisions
on Medicare Spending 0 0 0 0 0 * * * * * 0 *
Congressional Budget Office Page 5 of 16 3/11/2010

Table 4. Estimate of Effects on Direct Spending and Revenues for Non-Coverage Provisions of H.R. 3590,
the Patient Protection and Affordable Care Act, as Passed by the SenateBy fiscal year, in billions of dollars.
2010 2011 2012 2013 2014 2015 2016 2017 2018 2019
2010-
2014
2010-
2019
PART III—ENCOURAGING DEVELOPMENT OF NEW PATIENT CARE MODELS
3021 Establishment of Center for Medicare and Medicaid Innovation * 0.1 0.2 0.2 0.2 0.2 * -0.3 -0.7 -1.2 0.7 -1.3
3022 Medicare Shared Savings Program * * * -0.1 -0.3 -0.6 -0.7 -0.9 -1.0 -1.2 -0.5 -4.9
3023 National Pilot Program on Payment Bundling 0 0 0 * * * * * * * * *
3024 Independence at Home Demonstration Program * * * * * * 0 0 0 0 * *
3025 Hospital Readmissions Reduction Program 0 0 0 -0.1 -0.3 -1.1 -1.3 -1.3 -1.4 -1.5 -0.5 -7.1
3026 Community-Based Care Transitions Program 0 * 0.1 0.1 0.1 0.1 0.1 0 0 0 0.3 0.5
3027 Extension of Gainsharing Demonstration * * * * * 0 0 0 0 0 * *
Subtitle B—Improving Medicare for Patients and Providers
PART I—ENSURING BENEFICIARY ACCESS TO PHYSICIAN CARE AND OTHER SERVICES
3101 Increase in the Physician Payment Update 0 0 0 0 0 0 0 0 0 0 0 0
3102 Extension of the Work Geographic Index Floor and Revisions
to the Practice Expense Geographic Adjustment 0.7 0.9 0.3 0 0 0 0 0 0 0 1.8 1.8
3103 Extension of Exceptions Process for Medicare Therapy Caps 0.3 0.4 0 0 0 0 0 0 0 0 0.8 0.8
3104 Extension of Payment for Technical Component of
Certain Physician Pathology Services 0.1 * 0 0 0 0 0 0 0 0 0.1 0.1
3105 Extension of Ambulance Add-Ons 0.1 * 0 0 0 0 0 0 0 0 0.1 0.1
3106 Extension of Certain Payment Rules for Long-Term Care
Hospital Services and of Moratorium on the Establishment of
Certain Hospitals and Facilities 0 0.1 0.1 * 0 0 0 0 0 0 0.2 0.2
3107 Extension of Physician Fee Schedule Mental Health Add-On * * 0 0 0 0 0 0 0 0 * *
3108 Permitting Physician Assistants to Order
Post-Hospital Extended Care Services * * * * * * * * * * * *
3109 Exemption of Certain Pharmacies From Accreditation Requirements 0 0 0 0 0 0 0 0 0 0 0 0
3110 Part B Special Enrollment Period for Disabled TRICARE Beneficiaries * * * * * * * * * * * *
3111 Payment for Bone Density Tests 0.1 0.1 * 0 0 0 0 0 0 0 0.1 0.1
3112 Revision to the Medicare Improvement Fund 0 0 0 0 -15.6 -5.2 0 0 0 0 -15.6 -20.7
3113 Treatment of Certain Complex Diagnostic Laboratory Tests 0 * * * 0 0 0 0 0 0 0.1 0.1
3114 Improved Access for Certified-Midwife Services 0 * * * * * * * * * * *
Congressional Budget Office Page 6 of 16 3/11/2010

Table 4. Estimate of Effects on Direct Spending and Revenues for Non-Coverage Provisions of H.R. 3590,
the Patient Protection and Affordable Care Act, as Passed by the SenateBy fiscal year, in billions of dollars.
2010 2011 2012 2013 2014 2015 2016 2017 2018 2019
2010-
2014
2010-
2019
PART II—RURAL PROTECTIONS
3121 Extension of Outpatient Hold Harmless Provision 0.1 * 0 0 0 0 0 0 0 0 0.2 0.2
3122 Payment for Certain Clinical Diagnostic Laboratory Tests
Furnished to Hospital Patients in Certain Rural Areas * * 0 0 0 0 0 0 0 0 * *
3123 Extension of the Rural Community Hospital Demonstration Program 0 0 0 0 0 0 0 0 0 0 0 0
3124 Extension of the Medicare-Dependent Hospital (MDH) Program 0 0 * * 0 0 0 0 0 0 * *
3125 Payment Adjustment for Low-Volume Hospitals 0 0.1 0.2 * 0 0 0 0 0 0 0.3 0.3
3126 Demonstration Project on Community Health Integration
Models in Certain Rural Counties 0 0 0 0 0 0 0 0 0 0 0 0
3127 MedPAC Study on Adequacy of Medicare Payments for
Health Care Providers Serving in Rural Areas 0 0 0 0 0 0 0 0 0 0 0 0
3128 Technical Correction Related to Critical Access Hospital Services 0 0 0 0 0 0 0 0 0 0 0 0
3129 Medicare Rural Hospital Flexibility Program 0 0 0 0 0 0 0 0 0 0 0 0
PART III—IMPROVING PAYMENT ACCURACY
3131 Payment Adjustments for Home Health Care (includes
effect of section 3401) 0 -0.4 -0.8 -1.1 -1.9 -3.3 -5.3 -7.5 -9.0 -10.3 -4.2 -39.7
3132 Hospice Reform 0 * * * * * * * * * * -0.1
3133 Medicare Disproportionate Share Hospital Payments 0 0 0 0 0 -3.7 -4.6 -5.7 -5.2 -6.0 0 -25.1
3134 Misvalued Codes Under the Physician Fee Schedule 0 0 0 0 0 0 0 0 0 0 0 0
3135 Equipment Utilization Factor for Advanced Imaging Services * -0.1 -0.1 -0.1 -0.1 -0.1 -0.1 -0.1 -0.2 -0.2 -0.4 -1.1
3136 Revision of Payment for Power-Driven Wheelchairs 0 -0.4 -0.1 * * * * -0.1 -0.1 -0.1 -0.6 -0.8
3137 Hospital Wage Index Improvement 0.2 * 0 0 0 0 0 0 0 0 0.3 0.3
3138 Treatment of Certain Cancer Hospitals 0 0 0 0 0 0 0 0 0 0 0 0
3139 Payment for Biosimilar Biological Products Included in estimate for title VII, subtitle A.
3140 Medicare Hospice Concurrent Care Demonstration Program 0 0 * * * * 0 0 0 0 * *
3141 Application of Budget Neutrality on a National Basis in the
Calculation of the Medicare Hospital Wage Index Floor 0 0 0 0 0 0 0 0 0 0 0 0
3142 HHS Study on Urban Medicare-Dependent Hospitals 0 0 0 0 0 0 0 0 0 0 0 0
Congressional Budget Office Page 7 of 16 3/11/2010

Table 4. Estimate of Effects on Direct Spending and Revenues for Non-Coverage Provisions of H.R. 3590,
the Patient Protection and Affordable Care Act, as Passed by the SenateBy fiscal year, in billions of dollars.
2010 2011 2012 2013 2014 2015 2016 2017 2018 2019
2010-
2014
2010-
2019
Subtitle C—Provisions Relating to Part C
3201 Medicare Advantage Payment 0 -6.2 -6.7 -10.4 -11.1 -12.4 -14.0 -16.8 -19.0 -21.6 -34.4 -118.1
3202 Benefit Protection and Simplification 0 0 0 0 0 0 0 0 0 0 0 0
3203 Coding Intensity Adjustment 0 0 -0.4 -0.3 0 0 0 0 0 0 -0.7 -0.7
3204 Simplification of Annual Beneficiary Election Periods * * * * * * * * * * * *
3205 Extension for Specialized MA Plans for Special Needs Individuals 0 0.2 0.2 0.2 0.1 0.1 * * * * 0.7 0.9
3206 Extension of Reasonable Cost Contracts 0 * * * 0 0 0 0 0 0 * *
3207 Technical Correction to MA Private Fee-for-Service Plans 0 * * * * * * * * * 0.1 0.1
3208 Making Senior Housing Facility Demonstration Permanent Included in estimate for section 3205.
3209 Authority to Deny Plan Bids Included in estimate for section 3201.
3210 Development of New Standards for Certain Medigap Plans 0 0 0 0 0 * * * * * 0 -0.1
Subtitle D—Medicare Part D Improvements for Prescription Drug Plans and MA–PD Plans
3301 Medicare Coverage Gap Discount Program 0 0.9 1.9 1.4 1.6 1.8 2.2 2.4 2.5 3.2 5.8 17.8
3302 Determination of Medicare Part D Low-Income Benchmark Premium 0 * 0.1 0.1 0.1 0.1 0.1 0.1 0.1 0.1 0.3 0.7
3303 Voluntary de minimis Policy for Subsidy Eligible Individuals Under
Prescription Drug Plans and MA–PD Plans 0 * * * * * * 0.1 0.1 0.1 0.1 0.4
3304 Special Rule for Widows and Widowers Regarding
Eligibility for Low-Income Assistance 0 * * * * * * * * * 0.1 0.2
3305 Information for Subsidy Eligible Individuals Reassigned
to Prescription Drug Plans and MA–PD Plans 0 0 0 0 0 0 0 0 0 0 0 0
3306 Funding Outreach and Assistance for Low-Income Programs * * * 0 0 0 0 0 0 0 * *
3307 Formulary Requirements With Respect to Certain
Categories or Classes of Drugs 0 0 0 0 0 0 0 0 0 0 0 0
3308 Reducing Part D Premium Subsidy for High-Income Beneficiaries 0 -0.3 -0.5 -0.7 -0.9 -1.1 -1.3 -1.6 -2.0 -2.4 -2.4 -10.7
3309 Elimination of Cost Sharing for Certain Dual Eligible Individuals. 0 0 0.1 0.1 0.1 0.1 0.2 0.2 0.2 0.2 0.3 1.1
3310 Reducing Wasteful Dispensing of Outpatient Prescription Drugs in
Long-Term Care Facilities 0 0 -0.1 -0.3 -0.5 -0.8 -1.0 -1.0 -0.9 -1.1 -1.0 -5.7
3311 Prescription Drug Plan Complaint System 0 0 0 0 0 0 0 0 0 0 0 0
3312 Uniform Exceptions and Appeals Process for Prescription Drug Plans
and MA–PD Plans 0 0 0 0 0 0 0 0 0 0 0 0
3313 Office of the Inspector General Studies and Reports 0 0 0 0 0 0 0 0 0 0 0 0
3314 Including Costs Incurred by AIDS Drug Assistance Programs and
Indian Health Service in Providing Prescription Drugs Toward
the Annual Out-of-Pocket Threshold Under Part D 0 * 0.1 0.1 0.1 0.1 0.1 0.1 0.1 0.1 0.2 0.6
3315 Immediate Reduction in Coverage Gap in 2010 Included in estimate for section 3301.
10328 Part D Medication Therapy Management Programs 0 0 0 0 0 0 0 0 0 0 0 0
Congressional Budget Office Page 8 of 16 3/11/2010

Table 4. Estimate of Effects on Direct Spending and Revenues for Non-Coverage Provisions of H.R. 3590,
the Patient Protection and Affordable Care Act, as Passed by the SenateBy fiscal year, in billions of dollars.
2010 2011 2012 2013 2014 2015 2016 2017 2018 2019
2010-
2014
2010-
2019
Subtitle E—Ensuring Medicare Sustainability
3401 Revision of Certain Market Basket Updates and Incorporation of
Productivity Improvements into Market Basket Updates
that do not Already Incorporate Such Improvements
(effect of productivity adjustment for home health services
included in estimate for section 3131) -0.1 -1.1 -3.8 -7.4 -11.1 -15.0 -19.1 -23.8 -29.3 -36.0 -23.5 -146.7
3402 Temporary Adjustment to the Calculation of Part B Premiums 0 -1.3 -1.9 -1.9 -2.5 -2.6 -2.8 -3.2 -4.0 -4.9 -7.5 -25.0
3403 Independent Medicare Advisory Board 0 0 0 0 0 -1.5 -4.1 -5.6 -7.6 -9.3 0 -28.0
Subtitle F—Health Care Quality Improvements 0 0 0 0 0 0 0 0 0 0 0 0
10323 Medicare Coverage for Individuals Exposed to
Environmental Health Hazards * * * * * * * * * * 0.1 0.3
10324 Protections for Frontier States 0 0.1 0.2 0.2 0.2 0.2 0.2 0.2 0.3 0.3 0.8 2.0
10325 Revision to Skilled Nursing Facility Prospective Payment System 0 0 0 0 0 0 0 0 0 0 0 0
10326 Pilot Testing of Pay-for-Performance 0 0 0 0 0 0 0 0 0 0 0 0
10329 Methodology to Assess Health Plan Value 0 0 0 0 0 0 0 0 0 0 0 0
10330 Modernizing CMS Computer and Data Systems 0 0 0 0 0 0 0 0 0 0 0 0
10331 Public Reporting of Performance Information 0 0 0 0 0 0 0 0 0 0 0 0
10332 Availability of Medicare Data 0 0 0 0 0 0 0 0 0 0 0 0
10333 Community-based Collaborative Care Networks 0 0 0 0 0 0 0 0 0 0 0 0
Congressional Budget Office Page 9 of 16 3/11/2010

Table 4. Estimate of Effects on Direct Spending and Revenues for Non-Coverage Provisions of H.R. 3590,
the Patient Protection and Affordable Care Act, as Passed by the SenateBy fiscal year, in billions of dollars.
2010 2011 2012 2013 2014 2015 2016 2017 2018 2019
2010-
2014
2010-
2019
TITLE IV—PREVENTION OF CHRONIC DISEASE AND IMPROVING PUBLIC HEALTH
Subtitle A—Modernizing Disease Prevention and Public Health Systems
4002 Prevention and Public Health Fund 0.1 0.6 0.8 1.0 1.3 1.6 1.8 1.9 2.0 2.0 3.7 12.9
Sections 4001, 4003, 4004 0 0 0 0 0 0 0 0 0 0 0 0
Subtitle B—Increasing Access to Clinical Preventive Services
4101 School-Based Health Centers * 0.1 * * * * 0 0 0 0 0.2 0.2
4102 Oral Healthcare Prevention Activities 0 0 0 0 0 0 0 0 0 0 0 0
4103 Medicare Coverage of Annual Wellness Visit Providing a
Personalized Prevention Plan 0 0.3 0.3 0.4 0.4 0.4 0.4 0.4 0.5 0.5 1.4 3.6
4104 Removal of Barriers to Preventive Services in Medicare 0 0.1 0.1 0.1 0.1 0.1 0.1 0.1 0.1 0.1 0.3 0.8
4105 Evidence-Based Coverage of Preventive Services in Medicare * * -0.1 -0.1 -0.1 -0.1 -0.1 -0.1 -0.1 -0.1 -0.3 -0.7
4106 Improving Access to Preventive Services for Eligible Adults in Medicaid 0 * * * * * * * * * * 0.1
4107 Coverage of Comprehensive Tobacco Cessation Services
for Pregnant Women in Medicaid * * * * * * * * * * * -0.1
4108 Incentives for Prevention of Chronic Diseases in Medicaid 0 * 0.1 * * 0 0 0 0 0 0.1 0.1
Subtitle C—Creating Healthier Communities
4201 Community Transformation Grants 0 0 0 0 0 0 0 0 0 0 0 0
4202 Healthy Aging, Living Well; Evaluation of Community-Based
Prevention and Wellness Programs for Medicare Beneficiaries * * * 0 0 0 0 0 0 0 0.1 0.1
4203 Removing Barriers and Improving Access to Wellness for
Individuals With Disabilities Forthcoming.0 0 0 0 0 0 0 0 0 0 0 0
4204 Immunizations 0 * 0 0 0 0 0 0 0 0 * *
4205 Nutrition Labeling at Chain Restaurants 0 0 0 0 0 0 0 0 0 0 0 0
4206 Demonstration Project Concerning Individualized Wellness Plan 0 0 0 0 0 0 0 0 0 0 0 0
4207 Reasonable Break Time for Nursing Mothers Forthcoming.0 0 0 0 0 0 0 0 0 0 0 0
Congressional Budget Office Page 10 of 16 3/11/2010

Table 4. Estimate of Effects on Direct Spending and Revenues for Non-Coverage Provisions of H.R. 3590,
the Patient Protection and Affordable Care Act, as Passed by the SenateBy fiscal year, in billions of dollars.
2010 2011 2012 2013 2014 2015 2016 2017 2018 2019
2010-
2014
2010-
2019
Subtitle D—Support for Prevention and Public Health Innovation
4301 Research On Optimizing The Delivery of Public Health Services 0 0 0 0 0 0 0 0 0 0 0 0
4302 Understanding Health Disparities: Data Collection and Analysis 0 0.1 0.1 0.1 0 0 0 0 0 0 0.2 0.2
4303 CDC and Employer-Based Wellness Programs 0 0 0 0 0 0 0 0 0 0 0 0
4304 Epidemiology-Laboratory Capacity Grants 0 0 0 0 0 0 0 0 0 0 0 0
4305 Advancing Research and Treatment for Pain-Care Management 0 0 0 0 0 0 0 0 0 0 0 0
4306 Funding for Childhood Obesity Demonstration Project * * * * * 0 0 0 0 0 * *
10407 Better Diabetes Care 0 0 0 0 0 0 0 0 0 0 0 0
10408 Grants for Workplace Wellness 0 0 0 0 0 0 0 0 0 0 0 0
10409 Cures Acceleration Network 0 0 0 0 0 0 0 0 0 0 0 0
10410 Centers of Excellence for Depression 0 0 0 0 0 0 0 0 0 0 0 0
10411 Programs Relating to Congenital Heart Disease 0 0 0 0 0 0 0 0 0 0 0 0
10412 Automated Defribrillation 0 0 0 0 0 0 0 0 0 0 0 0
10413 Young Women's Breast Health 0 0 0 0 0 0 0 0 0 0 0 0
Subtitle E—Miscellaneous Provisions 0 0 0 0 0 0 0 0 0 0 0 0
TITLE V—HEALTH CARE WORKFORCE
Subtitle A—Purpose and Definitions 0 0 0 0 0 0 0 0 0 0 0 0
Subtitle B—Innovations in the Health Care Workforce 0 0 0 0 0 0 0 0 0 0 0 0
Subtitle C—Increasing the Supply of the Health Care Workforce 0 0 0 0 0 0 0 0 0 0 0 0
Subtitle D—Enhancing Health Care Workforce Education and Training
Sections 5301-5314 0 0 0 0 0 0 0 0 0 0 0 0
5315 United States Public Health Sciences Track Included in estimate for section 4002.
5316 Family Nurse Practitioner Training Programs 0 0 0 0 0 0 0 0 0 0 0 0
Subtitle E—Supporting the Existing Health Care Workforce 0 0 0 0 0 0 0 0 0 0 0 0
Congressional Budget Office Page 11 of 16 3/11/2010

Table 4. Estimate of Effects on Direct Spending and Revenues for Non-Coverage Provisions of H.R. 3590,
the Patient Protection and Affordable Care Act, as Passed by the SenateBy fiscal year, in billions of dollars.
2010 2011 2012 2013 2014 2015 2016 2017 2018 2019
2010-
2014
2010-
2019
Subtitle F—Strengthening Primary Care and Other Workforce Improvements
5501 Expanding Access to Primary Care Services and
General Surgery Services 0 0.4 0.6 0.7 0.7 0.8 0.3 0 0 0 2.5 3.5
5502 Medicare Federally Qualified Health Center Improvements 0 * * * * 0.1 0.1 0.1 0.1 0.1 * 0.4
5503-5506 Medicare Graduate Medical Education Policies * * 0.1 0.1 0.1 0.1 0.1 0.2 0.2 0.2 0.3 1.1
5507 Demonstration Projects to Address Health Professions
Workforce Needs; Extension of Family-To-Family
Health Information Centers * 0.1 0.1 0.1 0.1 0.1 * * 0 0 0.4 0.4
5508 Increasing Teaching Capacity 0 * * * * * * * * * 0.2 0.2
5509 Graduate Nurse Education Demonstration Program 0 0 * 0.1 0.1 0.1 * 0 0 0 0.1 0.2
Subtitle G—Improving Access to Health Care Services 0 0 0 0 0 0 0 0 0 0 0 0
10503 Community Health Centers and the National Health Service Corps Fund 0 0.5 1.8 1.4 1.7 2.6 1.5 0.2 * 0 5.5 9.8
5606 State Grants to Health Care Providers 0 0 0 0 0 0 0 0 0 0 0 0
10502 Infrastructure to Expand Access to Care 0 0.1 * * 0 0 0 0 0 0 0.1 0.1
10504 Demonstration Project to Provide Access to Affordable Care 0 0 0 0 0 0 0 0 0 0 0 0
Subtitle H—General Provisions 0 0 0 0 0 0 0 0 0 0 0 0
TITLE VI—TRANSPARENCY AND PROGRAM INTEGRITY
Subtitle A—Physician Ownership and Other Transparency
6001 Limitation on Medicare Exception to the
Prohibition on Certain Physician Referrals for Hospitals * * * * * -0.1 -0.1 -0.1 -0.1 -0.1 -0.1 -0.5
6002 Transparency Reports and Reporting of Physician
Ownership or Investment Interests 0 0 0 0 0 0 0 0 0 0 0 0
6003 Disclosure Requirements for In-Office Ancillary Services
Exception to the Prohibition on Physician Self-Referral
for Certain Imaging Services 0 0 0 0 0 0 0 0 0 0 0 0
6004 Prescription Drug Sample Transparency 0 0 0 0 0 0 0 0 0 0 0 0
6005 Pharmacy Benefit Managers Transparency Requirements 0 0 0 0 0 0 0 0 0 0 0 0
Congressional Budget Office Page 12 of 16 3/11/2010

Table 4. Estimate of Effects on Direct Spending and Revenues for Non-Coverage Provisions of H.R. 3590,
the Patient Protection and Affordable Care Act, as Passed by the SenateBy fiscal year, in billions of dollars.
2010 2011 2012 2013 2014 2015 2016 2017 2018 2019
2010-
2014
2010-
2019
Subtitle B—Nursing Home Transparency and Improvement 0 0 0 0 0 0 0 0 0 0 0 0
Subtitle C—Nationwide Program for National and State Background Checks on
Direct Patient Access Employees of Long-term Care Facilities and Providers 0 0.1 * 0 0 0 0 0 0 0 0.1 0.1
Subtitle D—Patient-Centered Outcomes Research
6301 Patient-Centered Outcomes Research
Medicare 0 0 * * * * * * -0.1 -0.2 0.1 -0.3
Non-Medicare * * 0.1 0.1 0.2 0.3 0.4 0.4 0.4 0.5 0.4 2.5
6302 Federal Coordinating Council for Comparative Effectiveness Research 0 0 0 0 0 0 0 0 0 0 0 0
Subtitle E—Medicare, Medicaid, and CHIP Program Integrity Provisions
6401 Provider Screening and Other Enrollment Requirements 0 * * * * * * * * * * -0.1
6402 Enhanced Medicare and Medicaid Program Integrity Provisions * -0.2 -0.3 -0.3 -0.3 -0.3 -0.4 -0.4 -0.4 -0.4 -1.3 -3.2
6403 Elimination of Duplication Between the
Healthcare Integrity and Protection Data Bank and
the National Practitioner Data Bank 0 0 0 0 0 0 0 0 0 0 0 0
6404 Maximum Period for Submission of Medicare Claims 0 0 0 0 0 0 0 0 0 0 0 0
6405 Physicians Who Order Items or Services Required to Be
Medicare-Enrolled Physicians or Eligible Professionals * * * * * * -0.1 -0.1 -0.1 -0.1 -0.2 -0.4
6406 Requirement for Physicians to Provide Documentation on
Referrals to Programs At High Risk of Waste and Abuse 0 0 0 0 0 0 0 0 0 0 0 0
6407 Face to Face Encounter With Patient Required Before
Physicians May Certify Eligibility for Home Health Services or
Durable Medical Equipment * -0.1 -0.1 -0.1 -0.1 -0.1 -0.1 -0.1 -0.1 -0.2 -0.3 -1.0
6408 Enhanced Penalties 0 0 0 0 0 0 0 0 0 0 0 0
6409 Medicare Self-Referral Disclosure Protocol 0 0 0 0 0 0 0 0 0 0 0 0
6410 Adjustments to the Medicare Competitive Acquisition Program
for Durable Medical Equipment, Prosthetics, Orthotics,
and Supplies * * * -0.1 -0.2 -0.2 -0.2 -0.2 -0.2 -0.2 -0.3 -1.4
6411 Expansion of the Recovery Audit Contractor Program 0 0 0 0 0 0 0 0 0 0 0 0
Health Care Fraud Enforcement 0 0 0 0 0 0 0 0 0 0 0 0
Congressional Budget Office Page 13 of 16 3/11/2010

Table 4. Estimate of Effects on Direct Spending and Revenues for Non-Coverage Provisions of H.R. 3590,
the Patient Protection and Affordable Care Act, as Passed by the SenateBy fiscal year, in billions of dollars.
2010 2011 2012 2013 2014 2015 2016 2017 2018 2019
2010-
2014
2010-
2019
Subtitle F—Additional Medicaid Program Integrity Provisions
6501 Termination of Provider Participation Under Medicaid If
Terminated Under Medicare or Other State Plan 0 0 0 0 0 0 0 0 0 0 0 0
6502 Medicaid Exclusion From Participation Relating to Certain
Ownership, Control, and Management Affiliations 0 0 0 0 0 0 0 0 0 0 0 0
6503 Billing Agents, Clearinghouses, or Other Alternate Payees
Required to Register Under Medicaid 0 0 0 0 0 0 0 0 0 0 0 0
6504 Requirement to Report Expanded Set of Data Elements
Under MMIS to Detect Fraud and Abuse 0 0 0 0 0 0 0 0 0 0 0 0
6505 Prohibition on Payments to Institutions or Entities Located
Outside of the United States 0 0 0 0 0 0 0 0 0 0 0 0
6506 Overpayments 0.1 0.1 * * * * * * * * 0.1 0.1
6507 Mandatory State Use of National Correct Coding Initiative 0 * * * * * * * * -0.1 -0.1 -0.3
6508 General Effective Date 0 0 0 0 0 0 0 0 0 0 0 0
Subtitle G—Additional Program Integrity Provisions 0 0 0 0 0 0 0 0 0 0 0 0
10607 State Demonstration Programs: Alternatives to Tort Litigation 0 0 0 0 0 0 0 0 0 0 0 0
10608 Liability Coverage in Free Clinics 0 * * * * * * * * * * 0.1
10609 FDA Labeling Changes * * * * * * * * * * * -0.1
Subtitle H—Elder Justice Act 0 0 0 0 0 0 0 0 0 0 0 0
Subtitle I—Sense of the Senate Regarding Medical Malpractice 0 0 0 0 0 0 0 0 0 0 0 0
TITLE VII—IMPROVING ACCESS TO INNOVATIVE MEDICAL THERAPIES
Subtitle A—Biologics Price Competition and Innovation 0 0 0 * -0.1 -0.4 -0.7 -1.2 -1.9 -2.7 -0.1 -7.1
Subtitle B—More Affordable Medicines for Children and Underserved Communities
7101 Expanded Participation in 340B Program Included in estimate for section 2501.
7102 Improvements to 340B Program Integrity 0 0 0 0 0 0 0 0 0 0 0 0
7103 GAO Study on Improving the 340B Program 0 0 0 0 0 0 0 0 0 0 0 0
TITLE VIII—COMMUNITY LIVING ASSISTANCE SERVICES AND SUPPORTS 0 0 -5.4 -8.8 -10.0 -11.3 -11.1 -9.1 -7.6 -7.0 -24.1 -70.2
Congressional Budget Office Page 14 of 16 3/11/2010

Table 4. Estimate of Effects on Direct Spending and Revenues for Non-Coverage Provisions of H.R. 3590,
the Patient Protection and Affordable Care Act, as Passed by the SenateBy fiscal year, in billions of dollars.
2010 2011 2012 2013 2014 2015 2016 2017 2018 2019
2010-
2014
2010-
2019
TITLE IX—REVENUE PROVISIONS Estimates provided by the Joint Committee on Taxation in a Separate Table (see JCX-61-09)a
INTERACTIONS
Medicare Advantage Interactions 0 0 -0.4 -1.1 -1.8 -1.9 -2.4 -2.8 -3.0 -3.9 -3.3 -17.4
Premium Interactions 0 0.2 0.5 1.2 5.2 3.8 3.7 4.8 5.6 6.6 7.1 31.6
Medicare Part D Interactions with Medicare Advantage Provisions 0 0.1 0.1 0.3 0.3 0.4 0.4 0.4 0.4 0.5 0.8 3.0
Medicare Part B Interactions with Medicare Part D Provisions 0 * 0.1 0.1 0.1 0.1 0.1 0.1 0.1 0.1 0.3 0.8
Medicaid Interactions with Medicare Part D Provisions * * * * * 0.1 0.1 0.1 0.1 0.2 0.1 0.6
Medicare Interaction with 340B * * * * -0.1 -0.1 -0.1 -0.1 -0.1 -0.1 -0.1 -0.5
TRICARE Interaction 0 * -0.1 -0.2 -0.2 -0.3 -0.5 -0.6 -0.8 -0.9 -0.4 -3.5
FEHB Interaction (on-budget) 0 0.1 0.1 0.1 0.2 0.2 0.3 0.5 0.6 0.7 0.4 2.7
FEHB Interaction (off-budget) 0 0.1 0.1 0.1 0.1 0.2 0.2 0.2 0.2 0.3 0.4 1.5
Total, Changes in On-Budget Direct Spending 2.5 -3.3 -13.0 -26.7 -45.1 -53.3 -64.9 -79.2 -90.8 -105.8 -85.7 -479.6
Total, Changes in Unified-Budget Direct Spending 2.5 -3.3 -13.0 -26.6 -45.0 -53.1 -64.7 -79.0 -90.6 -105.5 -85.3 -478.1
Congressional Budget Office Page 15 of 16 3/11/2010
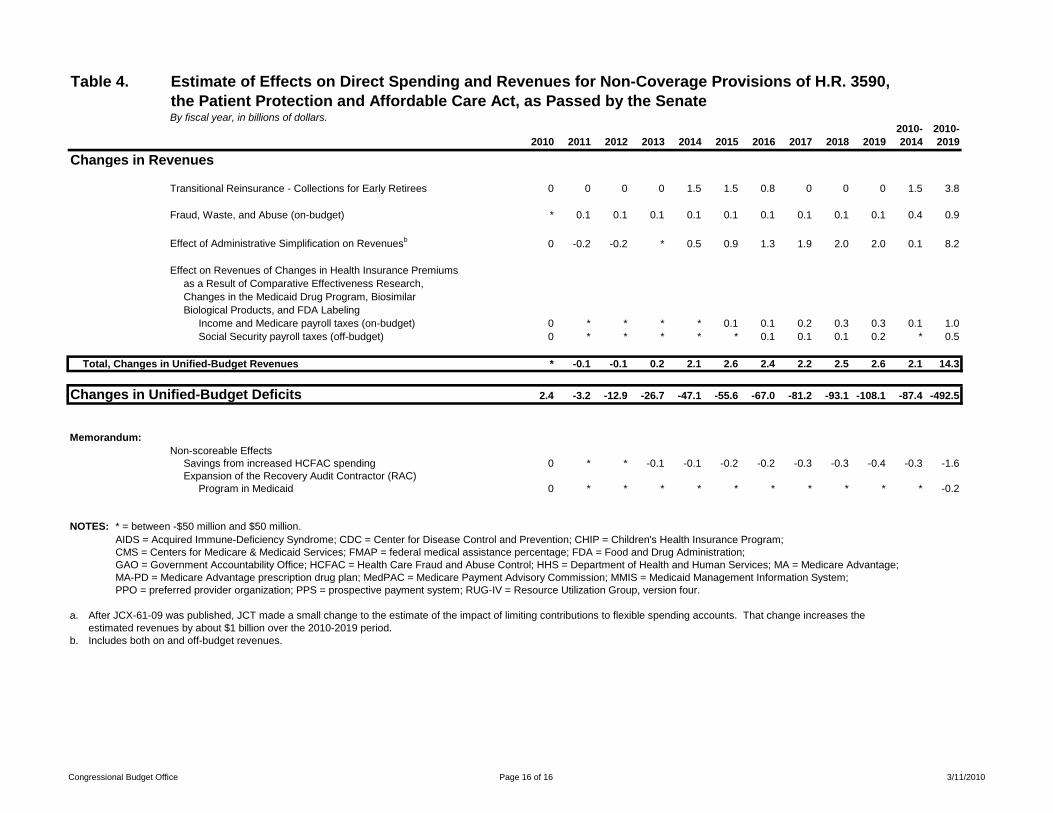
Table 4. Estimate of Effects on Direct Spending and Revenues for Non-Coverage Provisions of H.R. 3590,
the Patient Protection and Affordable Care Act, as Passed by the SenateBy fiscal year, in billions of dollars.
2010 2011 2012 2013 2014 2015 2016 2017 2018 2019
2010-
2014
2010-
2019
Changes in Revenues
Transitional Reinsurance - Collections for Early Retirees 0 0 0 0 1.5 1.5 0.8 0 0 0 1.5 3.8
Fraud, Waste, and Abuse (on-budget) * 0.1 0.1 0.1 0.1 0.1 0.1 0.1 0.1 0.1 0.4 0.9
Effect of Administrative Simplification on Revenuesb
0 -0.2 -0.2 * 0.5 0.9 1.3 1.9 2.0 2.0 0.1 8.2
Effect on Revenues of Changes in Health Insurance Premiums
as a Result of Comparative Effectiveness Research,
Changes in the Medicaid Drug Program, Biosimilar
Biological Products, and FDA Labeling
Income and Medicare payroll taxes (on-budget) 0 * * * * 0.1 0.1 0.2 0.3 0.3 0.1 1.0
Social Security payroll taxes (off-budget) 0 * * * * * 0.1 0.1 0.1 0.2 * 0.5
Total, Changes in Unified-Budget Revenues * -0.1 -0.1 0.2 2.1 2.6 2.4 2.2 2.5 2.6 2.1 14.3
Changes in Unified-Budget Deficits 2.4 -3.2 -12.9 -26.7 -47.1 -55.6 -67.0 -81.2 -93.1 -108.1 -87.4 -492.5
Memorandum:
Non-scoreable Effects
Savings from increased HCFAC spending 0 * * -0.1 -0.1 -0.2 -0.2 -0.3 -0.3 -0.4 -0.3 -1.6
Expansion of the Recovery Audit Contractor (RAC)
Program in Medicaid 0 * * * * * * * * * * -0.2
NOTES: * = between -$50 million and $50 million.
AIDS = Acquired Immune-Deficiency Syndrome; CDC = Center for Disease Control and Prevention; CHIP = Children's Health Insurance Program;
CMS = Centers for Medicare & Medicaid Services; FMAP = federal medical assistance percentage; FDA = Food and Drug Administration;
GAO = Government Accountability Office; HCFAC = Health Care Fraud and Abuse Control; HHS = Department of Health and Human Services; MA = Medicare Advantage;
MA-PD = Medicare Advantage prescription drug plan; MedPAC = Medicare Payment Advisory Commission; MMIS = Medicaid Management Information System;
PPO = preferred provider organization; PPS = prospective payment system; RUG-IV = Resource Utilization Group, version four.
a. After JCX-61-09 was published, JCT made a small change to the estimate of the impact of limiting contributions to flexible spending accounts. That change increases the
estimated revenues by about $1 billion over the 2010-2019 period.
b. Includes both on and off-budget revenues.
Congressional Budget Office Page 16 of 16 3/11/2010