congestion free operation of competitive energy market
TRANSCRIPT

IOSR Journal of Electrical and Electronics Engineering (IOSR-JEEE)
ISSN: 2278-1676 Volume 2, Issue 5 (Sep-Oct. 2012), PP 17-29 www.iosrjournals.org
www.iosrjournals.org 17 | Page
Congestion Free Operation of Competitive Energy Market
1Uma. B,
2Ravi Kumar. M,
1Student, 2Assistant Professor, Department of Electrical and Electronics, Prasad.V.Potluri Siddhartha Institute
of Technology, India
Abstract: The competition and deregulation of electricity markets has increased competition and electricity may be produced and consumed in amounts that would cause the transmission system to operate beyond
transfer limits-the system is congested. Hence, congestion management is a fundamental transmission problem.
Congestion can be alleviated by adopting suitable solutions. In some inevitable cases moderating the congestion
by the load shedding is only the solution which is not economically good in practice. Hence, this paper
addresses a solution for congestion management, i.e optimal re-dispatch. The validations of this solution in real
time during abnormalities like (N-1) line outages are also considered. To predict the effects of line outages, the
required amount of load curtailment is going to optimize with optimal re-dispatch method. The approaches are
analyzed with IEEE-14 bus system.
Keywords: Congestion management, Contingency, Day-ahead market, Load curtailment, Optimal re-dispatch
I. Introduction The electricity industry throughout the world, which has long been dominated by vertically integrated
utilities, is undergoing enormous changes. Restructuring has necessitated the decomposition of the three
components of electric power industry: generation, transmission, and distribution. An independent operational
control of transmission grid in a restructured industry would facilitate a competitive market for power
generation and direct retail access. The independent operation of the grid cannot be guaranteed without an
independent entity such as the Independent System Operator (ISO). The ISO is required to be independent of
individual market participants, such as transmission owners, generators, distribution companies, and end-users.
The role of an ISO in a competitive market environment would be to facilitate the complete dispatch of the power that gets contracted among the market players. The total generation schedules and dispatch will decided
by ISO from the bids submitted by GENCOS and DISCOS. The framing of ground rules by system operators to
prevent the bad use of the market by participants in order to achieve their maximum profit are discussed in[1].
The different methods of bidding of strategic bid, multipart bid, iterative and demand side bid are also explained
in this literature review. The importance of decision marking in the bidding process and his influence in the
future market is described in [2].
In order to achieve market goals, several models for the market structure have been considered. In
single auction pool based model only GENCOS submit their bids to ISO. In double auction model both
GENCOS and DISCOS submit their bids to ISO. Bilateral model contracts are negotiable agreements on
delivery and receipt of power between two traders. Hybrid model combines various features of previous two
models. Congestion management is one of the most challenging operational problems in deregulated power systems. Transmission networks are one of the main sources of difficulties on fair implementation of electricity
restructuring. With open access transmission in deregulated environment, poorly scheduled generation patterns
and load patterns from competitive bidding, will be seen more and more often which results transmission line
overloads. Transmission congestion may be defined as the condition where more power is scheduled or flows
across transmission lines and transformers than the physical limits of those lines (or) it is the operating condition
in which there is no enough transmission capacity to implement all the traded transactions simultaneously due to
some un expected contingencies. Transmission line overload may prevent the existence of new contracts, lead to
additional outages, increase the electricity prices in some regions of the electricity markets, and can threaten
system security and reliability. Hence an effective control action strategy is necessary to reduce the line
overloads to the security limits in the minimum time. There are significant congestion management schemes
suitable for various electricity market structures are described in. Congestion may be alleviated by incorporating
line capacity constraints in the dispatch and scheduling process. In order to alleviate congestion, some cheap generators have to reduce their dispatch and some expensive generators in the congested zone have to increase
their dispatch. This will impose additional cost to the market participants. The minimization of re-dispatch in the
pool therefore ensures that the deviation from the economical settlement of the market is minimized [3, 4].
Contingency analysis is abnormal condition in electrical network. It put whole system or a part of the
system under stress. It occurs due to sudden opening of a transmission line. Generator tripping. Sudden change
in generation. Sudden change in load value. Contingency analysis provides tools for managing, creating,
Congestion Free Operation of Competitive Energy Market
www.iosrjournals.org 18 | Page
analyzing, and reporting lists of contingencies and associated violations [5].This study aims at investigating the
changes in generation schedule levels when taking into account transmission network loadability consideration
in the market settlement scheme. An IEEE 14-bus test system is used in the study in which three separate cases
are analyzed, i.e. hourly based market settlement in over 24 hour period, re-dispatch scheduled in case of
congestion and contingency , load curtailment, bid curtailment methods for keeping the security margin in the
transmission system while maximizing social welfare are included. This paper is organized as follows: Following the introduction, different market models are described
in section II. Then in section III day-ahead market organization is described. In section IV various congestion
relief schemes are described. The results with Variable Bid Curtailment (VBC) for congestion relief methods in
real time are carried out are given in section V. Section VI follows the conclusion.
II. Market models 2.1. Pool Co market
A pool Co is defined as a centralized market place that clears the market for buyers and sellers. An ISO
within a Pool Co would implement the economic dispatch and produce a single (spot) price to a competitive level that is equal to the marginal cost of most efficient bidders. Generally this market may be operated in two
modes i.e. single auction or double auction. In single auction market, the bids received from the GENCOs only
and are stacked in increased order of prices. The market will cleared at the intersection point of stacked bid
curve and forecasted demand. The highest accepted sell bid price at required demand will treat as Market
Clearing Price (MCP) [6]. In double auction market, the bids from DISCOs are also considered for market
clearing and these bids are stacked in decreased order of prices. The intersection point of these two bid curves
will settle the market.
2.2. Bilateral contracts market
Bilateral contracts are negotiable agreements on delivery and receipt of power between two traders.
These contracts set the terms and conditions of agreements independent of the ISO. However, in this model the
ISO would verify that a sufficient transmission capacity exists to complete the transactions and maintain the transmission security. The bilateral contract model is very flexible as trading parties specify their desired
contract terms. However, its disadvantages stem from the high cost of negotiating and writing contracts, and the
risk of the credit worthiness of counter parties.
2.3. Hybrid market
The hybrid market combines various features of the previous two markets. In the hybrid market, the
utilization of a Pool Co is not obligatory, and any customer would be allowed to negotiate a power supply
agreement directly with suppliers or choose to accept power at the spot market price. In this market, pool Co
would serve all participants who choose not to sign bilateral contracts.
Here single auction pool Co market is chosen. I.e. only GENCOs submit their bids to ISO. In all the
market mechanisms the ISO has to execute the schedules and ensure the reliability and security as well as handling the emergencies like congestion in the system [7].
III. Day-ahead market organization In many real markets there is a day-ahead market (DA). Most transactions are cleared in the DA
market for each hour of the next day. The selling bids are ordered by increasing prices, and the demand bids are
ordered by decreasing prices, resulting in an aggregated supply curve and an aggregated demand curve. The
intersection of these curves determines the market clearing price (that of the last accepted selling bid).The day-
ahead (DA) market is organized as a sequence of twenty-four independent hourly single auctions. The bid prices
decided by each GENCO are generally given by
: λi,j = 2 γi Pi,j + βi (Rs./MWhr) (1)
Where ai and bi are cost coefficients of generator i.
The optimization problem of DA for a particular hour will carried out by ISO as follows:
: Minimize Ct (m) = λMCP Pg (2)
Subjected to equality constraint
: Pg = Pd = Pi,ja
k
j=1
n
i=1
N
a=1
(3)
The total generation of unit i will be calculated by
∶ Pg,i = Pi,j
k
j=1
≤ Pi,max (4)
The total generation of an area „a‟ will be calculated by

Congestion Free Operation of Competitive Energy Market
www.iosrjournals.org 19 | Page
: Pg,a = Pg,i ni=1 (5)
The profit for an Nth area GENCO company will given by
: Cpr ,N m = λMCP Pi.max − λi,j Pi,j
k
j=1
n
i=1
6
: =
n
i=1
k
j=1
λ i, j P i, j (7)
: = λMCP − λi,j
k
j=1
n
i=1
Pi,max − Pi,j (8)
The percentage of market share of each GENCO is in an area „a‟ will be given by
:%MSa = 𝑃𝑔 ,𝑖
𝑃𝑑 * 100% (9)
IV. Congestion management schemes 4.1. Technical methods
1) Out aging of congested lines
2) Transformer tap changers 3) Operation of FACTS devices
4.2. Non-technical Methods
4.2.1. Market-based
4.2.1.1. Auctioning: In auctioning the available capacity of a normally constrained path is auctioned by the ISO
receiving bids from parties willing to use the path. The lowest marginal bid accepted becomes the price for
transmission on the path.
4.2.1.2. Market Splitting: In market splitting the market is first settled without constraints applied. If the
resulting schedules cause congestion on some line(s) the market is then split and settled separately with the transfer limit applied.
4.2.1.3. Counter trading: Counter trading is a modified form of re-dispatching the difference being that up and
down regulation power is obtained from the market.
4.2.1.4. Re-dispatching: In this method the market is settled without the constraints of the transmission system
being applied. If congestion occurs the ISO re-dispatches the generation in such a way that congestion is gotten
rid of. The ISO directly commands generators to up regulate or down regulate without the use of the market [8].
4.2.1.5. Load curtailment: By managing load, congestion can also be effectively relieved.
4.2.1.6. Nodal pricing: In the nodal pricing scheme every bus in the grid is treated as zone. The Locational Marginal Price (LMP) for each bus is determined by the ISO.
4.2.1.7. Zonal pricing: In Zonal pricing system buses with similar LMPs are aggregated into zones. The market
is first settled constrained free. In
the case that congestion occurs the ISO receives supplementary bids for increase and decrease of generation.
4.2.2. Non-market based
1) Pro rata
2) First come, first serve

Congestion Free Operation of Competitive Energy Market
www.iosrjournals.org 20 | Page
No
Yes
Yes
No
Fig 1: Flow chart of optimal re-dispatches method
The market settlement process has been carried out as explained in [9]. The spot trading session of
National Power Exchange Limited (NPEX) generally starts at 10:00AM and ends at 12:00PM.
As the single auction pool market is considered only GENCOs submit their bids to ISO. The bids are presented in the following Table 1 and the forecasted load which should be considered as trading power at each
hour is given in Table 2.
Table 1: GENCO‟s Submitted Bids
The bids submitted by the each GENCO are divided into blocks. Here bids are divided into three blocks. Table 2
shows the Load Scaling Factor (LSF) for 24 hours.
Generator I
Block J
Block Size Pii(MW)
Unit Price λii (Rs./MWhr)
1
1 100 208.5
2 75 358.5
3 125 608.5
2
1 20 161.5
2 100 841.5
3 30 1045.5
3
1 10 600.0
2 5 850.0
3 5 1100.0
Start
Perform day-ahead market settlement
Run Load Flow
Congestion?
Select optimal pair of GENCOs for bid curtailment
Decrease last selected bid volume at one GENCO
Increase the same amount at another GENCO‟s last
selected bid
Run Load Flow
Congestion?
Print market schedule
End

Congestion Free Operation of Competitive Energy Market
www.iosrjournals.org 21 | Page
Table 2: Load Scaling Factors for 24 hours
The allocated schedules by ISO for the bids submitted by the GENCOs for 24 hours are as in Table 3.
Table 3: Schedule of generation over 24 hours period
The generation schedule in Table 3 is in p.u. on a 100MVA base. The forecasted peak load on the system is 259
MW for base load and this may considered as variable in each trading hour.
V. Results 5.1. Congestion results
5.1.1. Base case
In this case for the given schedules by running load flow congestion existence is checked and
congestion relief is done by Load Curtailment and Variable Bid Curtailment (VBC) i.e. Re-dispatch. By running
load flow along with the power flows the system performance index and the losses are also taken. As generator
1 is taken as slack bus it should take care of the loss compensation. For this case the Load Curtailment (LC) is
taken as zero. Table 4 shows the results for congestion checkup.
Hour LSF Hour LSF Hour LSF
1 0.80 9 1.00 17 0.86
2 0.79 10 0.96 18 0.88
3 0.79 11 0.95 19 0.94
4 0.79 12 0.92 20 0.93
5 0.81 13 0.90 21 0.91
6 0.85 14 0.88 22 0.89
7 0.92 15 0.86 23 0.79
8 1.00 16 0.87 24 0.79
Hour Generator
1 2 3
1 1.86 0.20 -
2 1.84 0.20 -
3 1.84 0.20 -
4 1.85 0.20 -
5 1.79 0.20 0.10
6 1.91 0.20 0.10 7 2.10 0.20 0.10 8 2.29 0.20 0.10 9 2.28 0.20 0.10
10 2.19 0.20 0.10 11 2.148 0.20 0.10 12 2.09 0.20 0.10 13 2.03 0.20 0.10 14 1.97 0.20 0.10 15 1.94 0.20 0.10 16 1.95 0.20 0.10 17 1.92 0.20 0.10 18 1.99 0.20 0.10 19 2.12 0.20 0.10 20 2.11 0.20 0.10 21 2.07 0.20 0.10 22 2.00 0.20 0.10 23 1.84 0.20 -
24 1.84 0.20 -

Congestion Free Operation of Competitive Energy Market
www.iosrjournals.org 22 | Page
Table 4: Congestion checkup
5.1.2. Load curtailment
All hours are congested so congestion has to relieve. Below Table 5 gives the results of congestion relief by
Load Curtailment. In this case Load Curtailment is increased until the congestion is relived. The corresponding
Performance Index (PI) and losses are tabulated in Table 5.
Table 5: Congestion relief by Load Curtailment
Hour PG1 PG2 PG3 PI Loss Congestion
1 196.127 20 0 4.9198 8.927 Yes
2 193.296 20 0 4.5664 8.686 Yes
3 193.296 20 0 4.5664 8.686 Yes
4 193.296 20 0 4.5664 8.686 Yes
5 187.912 20 10 3.9043 8.122 Yes
6 199.219 20 10 5.2696 9.069 Yes
7 219.151 20 10 8.5987 10.8713 Yes
8 242.164 20 10 14.357 13.164 Yes
9 242.164 20 10 14.357 13.164 Yes
10 230.626 20 10 11.1747 11.986 Yes
11 227.752 20 10 10.4778 11.702 Yes
12 219.151 20 10 8.5987 10.871 Yes
13 213.437 20 10 7.5078 10.337 Yes
14 207.738 20 10 6.5337 9.818 Yes
15 202.055 20 10 5.6663 9.315 Yes
16 204.895 20 10 6.0872 9.565 Yes
17 202.055 20 10 5.6663 9.315 Yes
18 207.738 20 10 6.5337 9.818 Yes
19 224.881 20 10 9.8171 11.421 Yes
20 222.014 20 10 9.1913 11.144 Yes
21 216.292 20 10 8.0379 10.6023 Yes
22 210.586 20 10 7.0067 10.076 Yes
23 193.296 20 0 4.5664 8.686 Yes
24 193.296 20 0 4.5664 8.686 Yes
Hour LC PG1 PG2 PG3 PI Loss
1 0.22 146.793 20 0 1.122 5.18
2 0.22 144.627 20 0 1.0257 5.031
3 0.22 144.627 20 0 1.0257 5.031
4 0.22 144.627 20 0 1.0257 5.031
5 0.18 147.133 20 10 1.1214 5.108
6 0.22 146.8 20 10 1.1086 5.086
7 0.28 146.634 20 10 1.1023 5.076
8 0.34 145.97 20 10 1.0772 5.033
9 0.34 145.97 20 10 1.0772 5.033
10 0.31 146.634 20 10 1.1023 5.076
11 0.3 147.354 20 10 1.13 5.122
12 0.28 146.634 20 10 1.1023 5.076
13 0.27 145.141 20 10 1.0465 4.981
14 0.25 145.97 20 10 1.0772 5.033
15 0.23 146.579 20 10 1.1002 5.072
16 0.24 146.302 20 10 1.0897 5.054
17 0.23 146.579 20 10 1.1002 5.072

Congestion Free Operation of Competitive Energy Market
www.iosrjournals.org 23 | Page
5.1.3 Re-dispatch
By adjusting the generation schedules at generating stations the congestion can be relived. The results are
tabulated in Table 6. In this case also the Load Curtailment (LC) is taken as zero.
Table 6: Congestion relief by re-dispatch
5.2. Contingency results
For contingency case only the peak load hour is considered. Here the peak load hour is 8th hour. So, the
following results are for the hour 8.
The following table 7 gives the results for contingency i.e. outage of a line which may leads to congestion for
peak hour in this hour the Load Scaling Factor (LSF) is one.
Table 7: Contingency results
18 0.25 145.97 20 10 1.0772 5.033
19 0.3 145.417 20 10 1.0566 4.998
20 0.29 146.053 20 10 1.0803 5.039
21 0.27 147.16 20 10 1.1225 5.109
22 0.26 145.583 20 10 1.0628 5.009
23 0.22 144.627 20 0 1.0257 5.031
24 0.22 144.627 20 0 1.0257 5.031
Hour PG1 PG2 PG3 PI Loss
1 154.739 59.8 0 7.3393 7.339
2 154.314 57.5 0 1.3272 7.204
3 154.314 57.5 0 1.3272 7.204
4 154.314 57.5 0 1.3272 7.204
5 154.052 52.6 10 1.3172 6.862
6 155.846 61.7 10 1.3968 7.396
7 159.093 77.6 10 1.5832 8.413
8 162.799 95.9 10 1.8807 9.699
9 162.799 95.9 10 1.8807 9.699
10 160.98 86.7 10 1.7206 9.04
11 160.428 84.5 10 1.6805 8.878
12 159.093 77.6 10 1.5832 8.413
13 158.214 73 10 1.5258 8.114
14 157.24 68.5 10 1.4695 7.82
15 156.378 63.9 10 1.4228 7.538
16 156.808 66.2 10 1.4455 7.678
17 156.378 63.9 10 1.4228 7.538
18 157.24 68.5 10 1.4695 7.82
20 159.536 79.9 10 1.6141 8.566
21 158.653 75.3 10 1.5538 8.263
22 157.674 70.8 10 1.4948 7.964
23 154.314 57.5 0 1.3272 7.204
24 154.314 57.5 0 1.3272 7.204
LO PG1 PG2 PG3 PI Loss
1.2 276.928 20 10 193.2217 47.931
1.5 250.003 20 10 101.5821 21.003
2.3 250.982 20 10 13.5972 21.984
2.4 244.027 20 10 11.1422 15.027
2.5 243.009 20 10 10.0584 14.009
3.4 242.328 20 10 16.5452 13.328

Congestion Free Operation of Competitive Energy Market
www.iosrjournals.org 24 | Page
The results of congestion relief due to contingency for the worst case with Load Curtailment (LC) and Re-
Dispatch are given in the Table 8 and Table 9.
Table 8: Congestion relief by Load Curtailment for worst contingency
Table 9: Congestion relief by re-dispatch for worst contingency
Below is the graphical representation of Performance Index (PI) for all line outages. The Performance
Index (PI) for the line outage 1.2 is high, so it is considered as the worst contingency case. The case which is having high Performance Index (PI) is taken as worst contingency case. The Performance Index (PI) of 1.2
outage is 193.2217 that is observed in Fig 2 given below.
Fig 2: Performance Index for line outages
In the case of Re-Dispatch the Load Curtailment is taken as zero. The Fig 3 is the graph for the
Performance Index (PI) for base, Load Curtailment and Re-Dispatch cases.
0
50
100
150
200
250
1.2 2.3 2.5 4.5 4.9 6.11 6.13 7.9 9.14 12.13
4.5 244.779 20 10 26.5906 15.779
4.7 242.452 20 10 14.9202 13.452
4.9 242.205 20 10 14.8142 13.205
5.6 245.208 20 10 22.6431 16.208
6.11 242.323 20 10 14.6394 13.323
6.12 242.41 20 10 14.8709 13.41
6.13 243.148 20 10 14.8875 14.148
7.8
7.9 242.538 20 10 15.0988 13.538
9.10 242.303 20 10 14.359 13.303
9.14 242.677 20 10 15.1147 13.677
10.11 242.202 20 10 14.463 13.202
12.13 242.172 20 10 14.414 13.172
13.14 242.293 20 10 14.4314 13.293
LO LC PG1 PG2 PG3 PI Loss
1.2 0.53 97.261 20 10 0.9907 5.537
LO PG1 PG2 PG3 PI Loss
1.2 99.951 150 18.2 1.7776 9.151
Per
form
ance
I
nd
ex (
PI)
Line Outage

Congestion Free Operation of Competitive Energy Market
www.iosrjournals.org 25 | Page
Fig 3: Performance Index (PI) for base case and after load curtailment and re-dispatch
When observed the Fig 3 the Performance Index (PI) is decreased with Load Curtailment and Re-Dispatch by
that the contingency is relived.
5.3. Production Cost for congestion and contingency
Production cost is calculated by using two methods.
1) Pay As Bid (PAB) method
2) System Marginal Price (SMP) method
5.3.1. Pay As Bid method
Table 10: Total production cost for congestion
0
50
100
150
200
250
1.2 1.2 1.2
Hour Base Case Load Curtailment Re-Dispatch
1 63,823.28 40,855.29 77,195.63
2 62,100.62 40,078.77 75,107.81
3 62,100.62 40,078.77 75,107.81
4 62,100.62 40,078.77 75,107.81
5 64,824.45 46,977.18 76,890.54
6 71,704.76 46,857.80 85,191.34
7 83,833.38 46,798.28 99,735.24
8 97,836.79 46,560.24 116,463.29
9 97,836.79 46,560.24 116,463.29
10 90,815.92 46,798.28 108,069.38
11 89,067.09 47,056.40 106,020.18
12 83,833.38 46,798.28 99,735.24
13 80,356.41 46,263.04 95,549.21
14 76,888.57 46,560.24 91,413.29
15 73,430.46 46,778.57 87,233.36
16 75,158.60 46,679.26 89,322.96
17 73,430.46 46,778.57 87,233.36
18 76,888.57 46,560.24 91,413.29
19 87,320.08 46,361.99 103,924.48
20 85,575.51 46,590 101,829.50
21 82,093.68 46,986.86 97,642.05
22 78,621.58 46,421.50 93,504.32
23 62,100.62 40,078.77 75,107.81
24 62,100.62 40,078.77 75,107.81
Per
form
ance
Index
(P
I)
Line Outage
Base case
Load Curtailment
Re-Dispatch

Congestion Free Operation of Competitive Energy Market
www.iosrjournals.org 26 | Page
Following Fig 4 shows the graphical representation of total production Re-Dispatch for congestion case and its
relief cases
Fig 4: Total production cost graph for congestion
Table 11: Total production cost for contingency
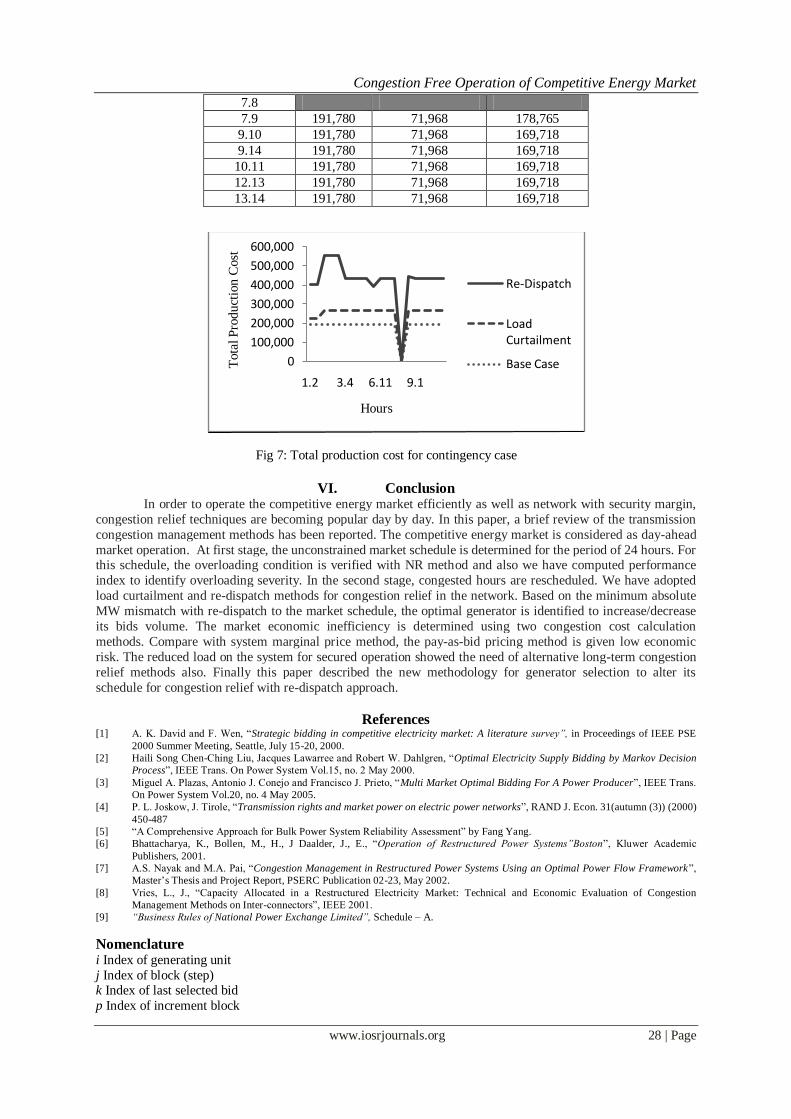
Following Fig 5 shows the graphical representation of total production cost of Base Case, Load Curtailment and
Re-Dispatch for contingency case.
Fig 5: Total production cost for contingency case
0.00
100,000.00
200,000.00
300,000.00
1 5 9 13 17 21To
tal P
rod
uct
ion
Co
st
Hours
Re-Dispatch
Load curtailment
Base Case
0.00
100,000.00
200,000.00
300,000.00
400,000.00
1.2 3.4 6.11 9.1
Tota
l P
roduct
ion
Cost
Hours
Re-Dispatch
Load Curtailment
Base Case
Line outage Base Case Load curtailment Re-Dispatch
1.2 118,949.91 29,509 153,354.78
1.5 102,606.82 29,660.28 154,709.49
2.3 103,202.54 51,848.83 116,824.49
2.4 98,970.42 51,867.47 111,195.13
2.5 98,350.97 51,682.13 110,336.42
3.4 97,936.58 45,587.63 118,699.33
4.5 99,428.02 40,915.30 126,767.12
4.7 98,012.04 44,595.73 116,332.20
4.9 97,861.74 46,567.41 116,338.10
5.6 99,689.07 45,980.19 146,985.40
6.11 97,933.54 46,581.03 116,748.88
6.12 97,986.48 46,595.37 116,643.42
6.13 98,435.55 46,691.81 117,275.03
7.8
7.9 98,064.37 46,600.39 154,126.10
9.1 97,921.37 46,585.34 116,468.76
9.14 98,148.95 46,636.96 116,650.42
10.11 97,859.91 46,565.62 116,567.77
12.13 97,841.66 46,561.32 116,465.80
13.14 97,915.29 46,576.73 116,646.19

Congestion Free Operation of Competitive Energy Market
www.iosrjournals.org 27 | Page
5.3.2. System Marginal Price method
Table 12: Total production cost for congestion
Fig 6: Total production cost for congestion case
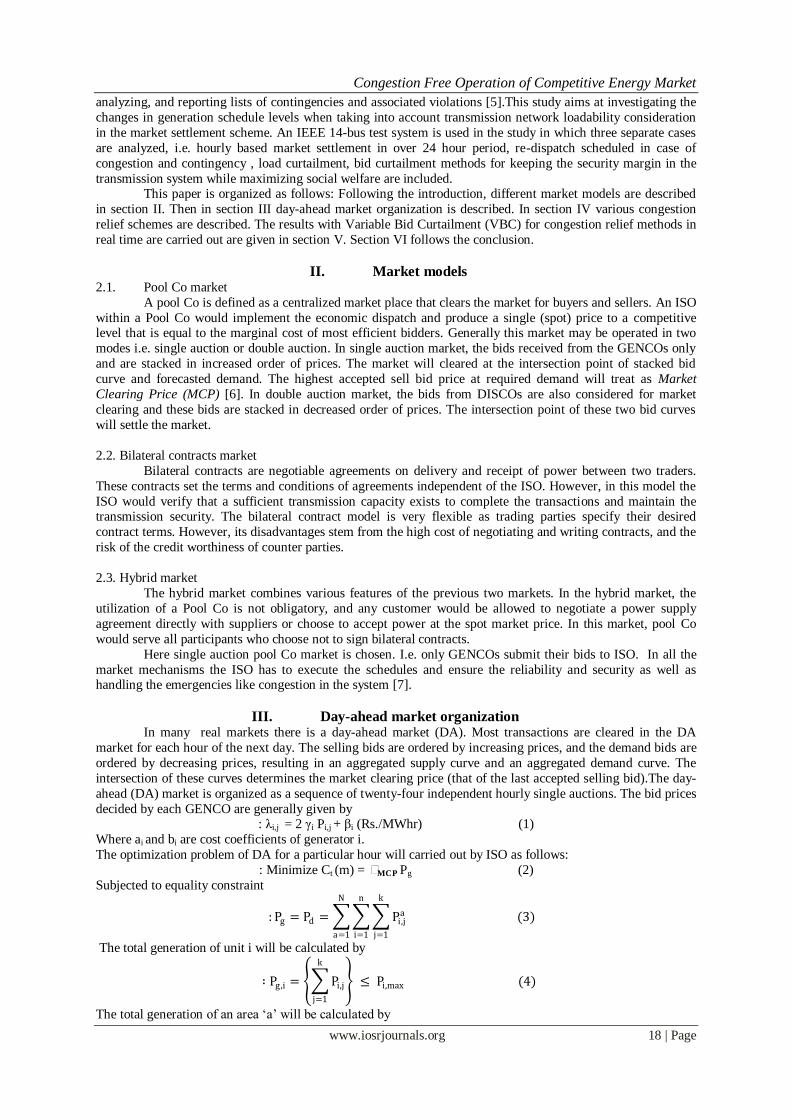
Table 13: Total production cost for contingency case
0
100,000
200,000
300,000
400,000
500,000
1 4 7 1013161922Tota
l P
rod
uct
ion
Cost
Hours
Re-Dispatch
Load Curtailment
Base Case
Hour Base Case Load Curtailment Re-Dispatch
1 185,780 65,967.50 163,717.50
2 185,780 65,967.50 163,717.50
3 185,780 65,967.50 163,717.50
4 185,780 65,967.50 163,717.50
5 191,780 71,967.50 169,717.50
6 191,780 71,967.50 169,717.50
7 191,780 71,967.50 169,717.50
8 191,780 71,967.50 169,717.50
9 191,780 71,967.50 169,717.50
10 191,780 71,967.50 169,717.50
11 191,780 71,967.50 169,717.50
12 191,780 71,967.50 169,717.50
13 191,780 71,967.50 169,717.50
14 191,780 71,967.50 169,717.50
15 191,780 71,967.50 169,717.50
16 191,780 71,967.50 169,717.50
17 191,780 71,967.50 169,717.50
18 191,780 71,967.50 169,717.50
19 191,780 71,967.50 169,717.50
20 191,780 71,967.50 169,717.50
21 191,780 71,967.50 169,717.50
22 191,780 71,967.50 169,717.50
23 185,780 65,967.50 163,717.50
24 185,780 65,967.50 163,717.50
Line outage Base Case Load curtailment Re-Dispatch
1.2 191,780 30,080 178,765
1.5 191,780 30,080 178,765
2.3 191,780 71,968 289,530
2.4 191,780 71,968 289,530
2.5 191,780 71,968 289,530
3.4 191,780 71,968 169,718
4.5 191,780 71,968 169,718
4.7 191,780 71,968 169,718
4.9 191,780 71,968 169,718
5.6 191,780 71,968 127,830
6.11 191,780 71,968 169,718
6.12 191,780 71,968 169,718
6.13 191,780 71,968 169,718
Congestion Free Operation of Competitive Energy Market
www.iosrjournals.org 28 | Page
Fig 7: Total production cost for contingency case
VI. Conclusion In order to operate the competitive energy market efficiently as well as network with security margin,
congestion relief techniques are becoming popular day by day. In this paper, a brief review of the transmission
congestion management methods has been reported. The competitive energy market is considered as day-ahead
market operation. At first stage, the unconstrained market schedule is determined for the period of 24 hours. For this schedule, the overloading condition is verified with NR method and also we have computed performance
index to identify overloading severity. In the second stage, congested hours are rescheduled. We have adopted
load curtailment and re-dispatch methods for congestion relief in the network. Based on the minimum absolute
MW mismatch with re-dispatch to the market schedule, the optimal generator is identified to increase/decrease
its bids volume. The market economic inefficiency is determined using two congestion cost calculation
methods. Compare with system marginal price method, the pay-as-bid pricing method is given low economic
risk. The reduced load on the system for secured operation showed the need of alternative long-term congestion
relief methods also. Finally this paper described the new methodology for generator selection to alter its
schedule for congestion relief with re-dispatch approach.
References [1] A. K. David and F. Wen, “Strategic bidding in competitive electricity market: A literature survey”, in Proceedings of IEEE PSE
2000 Summer Meeting, Seattle, July 15-20, 2000.
[2] Haili Song Chen-Ching Liu, Jacques Lawarree and Robert W. Dahlgren, “Optimal Electricity Supply Bidding by Markov Decision
Process”, IEEE Trans. On Power System Vol.15, no. 2 May 2000.
[3] Miguel A. Plazas, Antonio J. Conejo and Francisco J. Prieto, “Multi Market Optimal Bidding For A Power Producer”, IEEE Trans.
On Power System Vol.20, no. 4 May 2005.
[4] P. L. Joskow, J. Tirole, “Transmission rights and market power on electric power networks”, RAND J. Econ. 31(autumn (3)) (2000)
450-487
[5] “A Comprehensive Approach for Bulk Power System Reliability Assessment” by Fang Yang.
[6] Bhattacharya, K., Bollen, M., H., J Daalder, J., E., “Operation of Restructured Power Systems”Boston”, Kluwer Academic
Publishers, 2001.
[7] A.S. Nayak and M.A. Pai, “Congestion Management in Restructured Power Systems Using an Optimal Power Flow Framework”,
Master‟s Thesis and Project Report, PSERC Publication 02-23, May 2002.
[8] Vries, L., J., “Capacity Allocated in a Restructured Electricity Market: Technical and Economic Evaluation of Congestion
Management Methods on Inter-connectors”, IEEE 2001.
[9] “Business Rules of National Power Exchange Limited”, Schedule – A.
Nomenclature i Index of generating unit
j Index of block (step) k Index of last selected bid
p Index of increment block
0
100,000
200,000
300,000
400,000
500,000
600,000
1.2 3.4 6.11 9.1
Tota
l P
roduct
ion
Cost
Hours
Re-Dispatch
Load Curtailment
Base Case
7.8
7.9 191,780 71,968 178,765
9.10 191,780 71,968 169,718
9.14 191,780 71,968 169,718
10.11 191,780 71,968 169,718
12.13 191,780 71,968 169,718
13.14 191,780 71,968 169,718

Congestion Free Operation of Competitive Energy Market
www.iosrjournals.org 29 | Page
q Index of decrement block
b Number of blocks in offer bid
k Number of selected blocks in offer bid (DA)
n Number of generating units in one area
N Number of areas (GENCOs)
Pg,i Total generation of unit i, in MW Pg,a Total generation in area a, in MW
Pd,a Total demand in area a, in MW
Pg System total generation, in MW
Pd System total load, in MW
Pi,j Offer quantity of block j of unit i, in MW
Pi,min Minimum generation of unit i, in MW
Pi,max Maximum generation of unit i, in MW
λij Marginal cost of step j of unit i, in Rs./MWhr
λij,min Minimum marginal cost of step j of unit
i, in Rs./MWhr
λij,max Maximum marginal cost of step j of unit
i, in Rs./MWhr λMCP Market Clearing Price, in Rs./MWhr
PMCQ Market Clearing Quantity, in MW
P i, p,a Increment block p of unit i in area a, in MW
P i,q, a Decrement block q of unit i in area a, in MW
Ct(m) Total system production cost at mth hour, in Rs.
%Cpr,N(m) Percentage of Nth GENCO profit at mth hour.
%MSa Percentage of market share of an area a