conformed dimensions of data quality – an organized approach to data quality measurement
TRANSCRIPT

Conformed Dimensions of Data Quality –An Organized Approach to Data Quality Measurement
-Dan Myers ([email protected])
8/15/20171
Agenda Introduction▪4 W’s
-What are the Dimensions of Data Quality?-Why do organizations use the dimensions?-Where to use them in the SDLC?-Which set do I use?
▪Disagreement in the Industry about Definition & Scope▪Reasons to Agree Upon a Cross-Industry Standard▪Conformed Dimensions Website▪Annual Dimensions of Data Quality Survey & Report▪Q & A
2

What Are The Dimensions of Data Quality?
3
Definition: The Conformed Dimensions of Data Quality are categories used to characterize data and it’s fitness for use.Application: These can be applied in any industry to assess, measure, track and communicate information and data quality.
Why do I need the Dimensions of Data Quality?
4
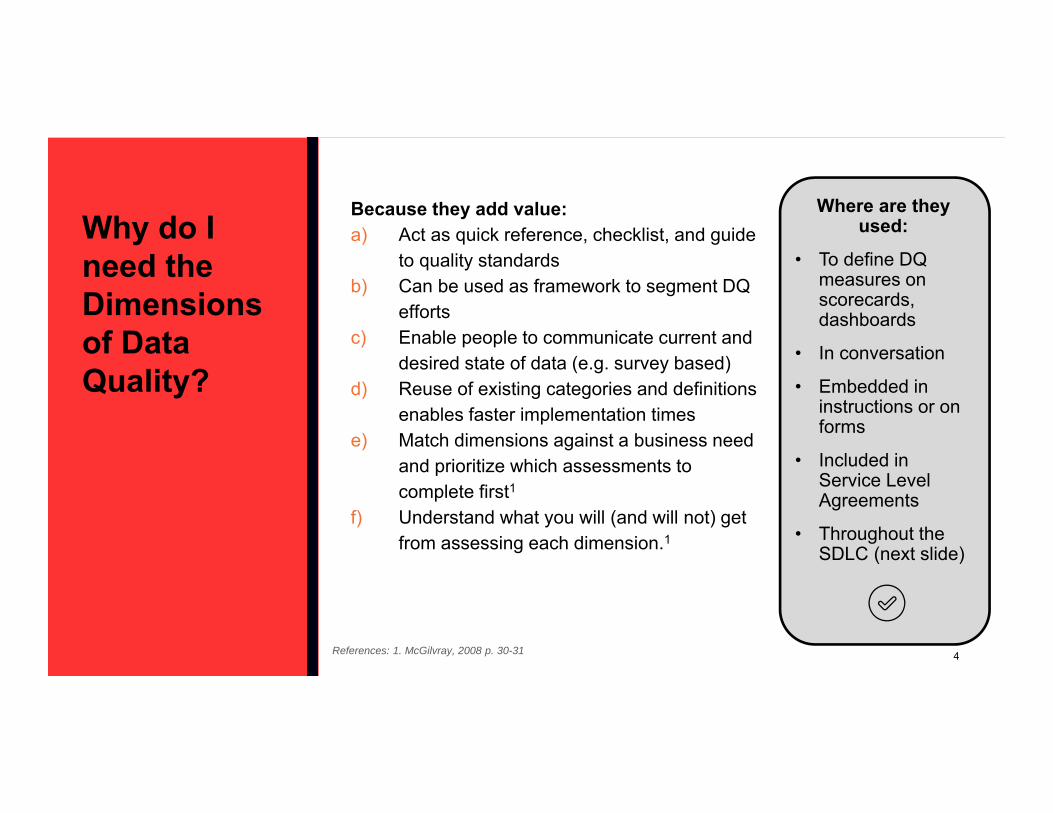
Because they add value:a) Act as quick reference, checklist, and guide
to quality standardsb) Can be used as framework to segment DQ
effortsc) Enable people to communicate current and
desired state of data (e.g. survey based)d) Reuse of existing categories and definitions
enables faster implementation timese) Match dimensions against a business need
and prioritize which assessments to complete first1
f) Understand what you will (and will not) get from assessing each dimension.1
Where are they used:
• To define DQ measures on scorecards, dashboards
• In conversation
• Embedded in instructions or on forms
• Included in Service Level Agreements
• Throughout the SDLC (next slide)
References: 1. McGilvray, 2008 p. 30-31

Where to use them in the SDLC?
5
• Innovation starts with the customer and data• Know thy data (using quality lens ensures success)Ideation
• Improved customer service comes from minor enhancements• Innovative product development comes from meeting unmet need (connecting the dots)
Conceptualization & Initiation
• New application development (eyes wide open about data available)• Discussion about why need quality->improved process design and execution
Requirements
• Data models and levels of abstraction accomplished faster• Strong focus on error handling inevitably benefits functionality too!Design
• If sample data is available, unit testing outcomes are improved• Data inherently forces focus on desired outcome, not intermediate functionality
Build
• Similar to build phase, test cases; usability increased with high and low quality sample data and engages business users more to see their own data (use cases) during UATTest
• Go live is focused on customer and improvement if prior steps include data quality focus in prior phases. This means faster response to customers and more agile organization
Go Live & Support

6
Which set do I use?
6
Wang & Strong, 1996 or 2002Or JDQ 2006
DanetteMcGilvray
(2008)
English (2009) & Redman (1996)
ISO/IEC 25012:2008
Dimensions of Data Quality
Dimensions ofData Quality
Solid, but Confusion between Timeliness & Currency
Practical andintegrated with Ten
Steps MethodologyTM
Strong technical and logical basis.Lacks complete descriptions and hierarchy
Interconnected to other ISO standards => Strong Systems
Focus.Lacks hierarchy and
overly context sensitive
ICIQ Research Due Oct, 6, 2017
Brian Blake&
Dan Myers
Title: An Evaluation of the Conformed Dimensions of Data Quality in Application to an Existing Information Quality Privacy-Trust Research Framework

7
Disagreement in the Industry about Definition & Scope
Confusion between the meaning of each dimension led me to write a series of articles for Information-Management.com, titled “The Value of Using the Dimensions of Data Quality” (2013)• Compared six author’s definitions of the dimensions of data quality• Proposed initial version of a Conformed set of Dimensions of Data Quality
http://dqm.mx/imdm2013

Reasons to Agree Upon a Cross-Industry Standard
8
▪Communication--Provide language to communicate DQ requirements
▪Efficiency--Enables faster implementation times based on decreased argument between implementation team members (local)-Discourages repetitive philosophical arguments on the same topic (global)
▪Measurement- if it isn’t measured it can’t be managed-Consistency between organizations enables comparisons used to benchmark and improve-Provides framework to define more detailed measurements associated with sub-concepts
▪Teaching- Provides a solid framework for teaching
Survey conducted 3 years in a row shows general consistency of 45-55% Very Interested Respondents 29-39% Somewhat Interested Respondents

9
WebsiteSite:http:DimensionsOfDataQuality.com
Blog Site:http:DimensionsOfDataQuality.com/blog
Blog Signup:http://eepurl.com/cEgkJj
Summary Level
Detailed Level
Blog
Blog History
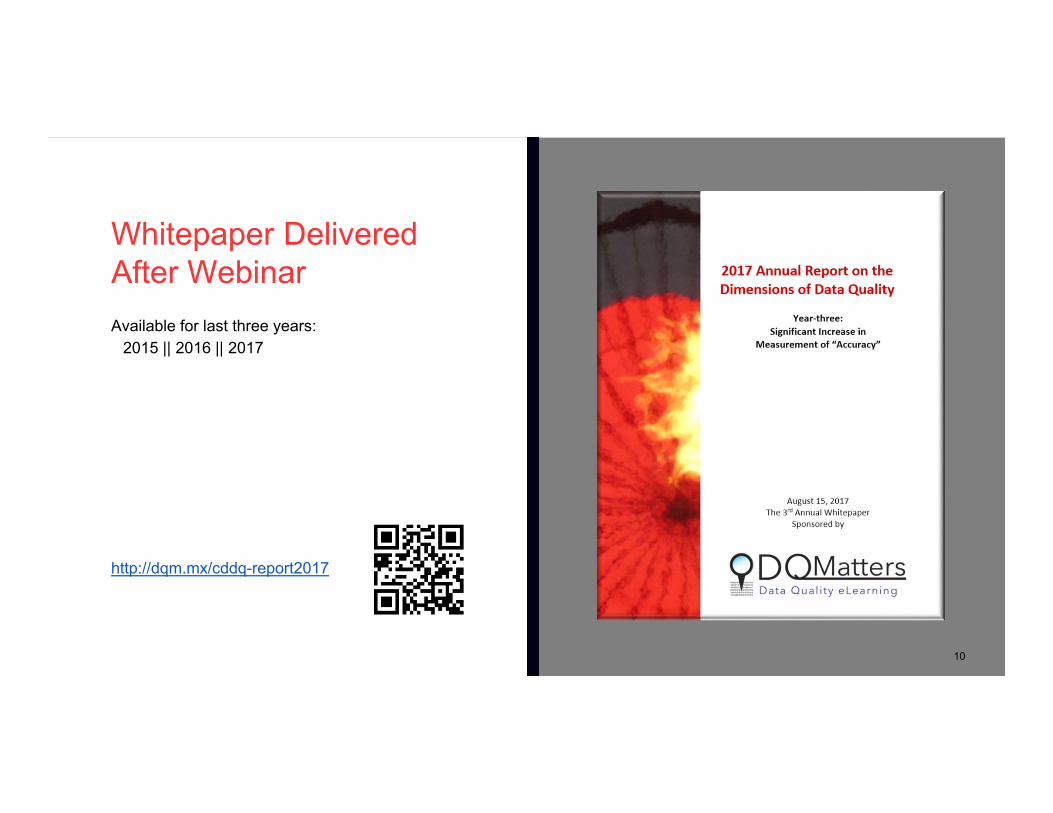
Whitepaper Delivered After Webinar
10
Available for last three years:2015 || 2016 || 2017
http://dqm.mx/cddq-report2017

Survey Methodology
How was the survey conducted?
11
▪ Web-based survey over a one-month (April 2017) period of time▪ Advertised via LinkedIn, Twitter, CDDQ Website, referral and prior-year sign-up▪ 48 Complete survey responses▪ Near-zero dollar budget to promote the survey▪ There is likely a response bias- given that only respondents (organizations) aware of the dimensions of data quality concept may feel comfortable completing the survey, and they may naturally over-represent organizations that have already implemented a version of the dimensions.

▪ Where does your organization fit into this picture? Why?▪ Get a copy of the Conformed Dimensions from the website and start today if
you haven’t already.
12
Results of the 2017 Annual Dimensions of Data Quality Survey

13
▪How well is your set of dimensions governed?▪Would it help if they were better documented? Consider the Conformed Dimensions.

Results of the Survey
▪How many of these dimensions does your organization use?
14

15
Take care with inferring too much meaning in ranks due to small sample size of the survey as a whole

Results of the Survey
16
Grouping List of Industries in Group
Tier 1 Finance/Banking/Accounting (19.1%) Healthcare/Medical/Pharmaceutical/Biotech (10.6%) Insurance/Legal/Real Estate (8.5%)
Tier 2 (Industries at 6%)
Government – State/Retail/Manufacturing/Software Development/Application Development/Consultant/Business Service/Other
Tier 3 (Industries from 2-4%)
Utilities/Chemicals/Mining/Petroleum/Textiles/Government – Federal/Media/Entertainment/Transportation/Logistics
Tier 4 (No representation 0%)
Entrepreneur/ISP/Web Host/IT Services Outsourcer/Education/Government/Military/Public Administration

Professional Profile
17
Dan Myers is Principal Info Quality Educator at DQMatters- an eLearning organization focused on Information Quality training and consulting.
In previous roles Dan has managed business intelligence teams, and lead architecture reviews of data management (metadata, data quality…etc) tools and implemented associated governance programs. In his role at Farmers Insurance, he authored the Finance led data governance policies for integration/sourcing, metadata, and data quality. Previously Dan has worked as an independent Oracle Certified Professional consultant in both front and back-end development capacities. Dan's fluency in Japanese enabled him to work in both the public and private sector in Japan. Dan received his MBA from the U.S.C. Marshall School of Business in 2009.
Contact: [email protected]: @kiwidankun or @dqmatters

18
Q&A
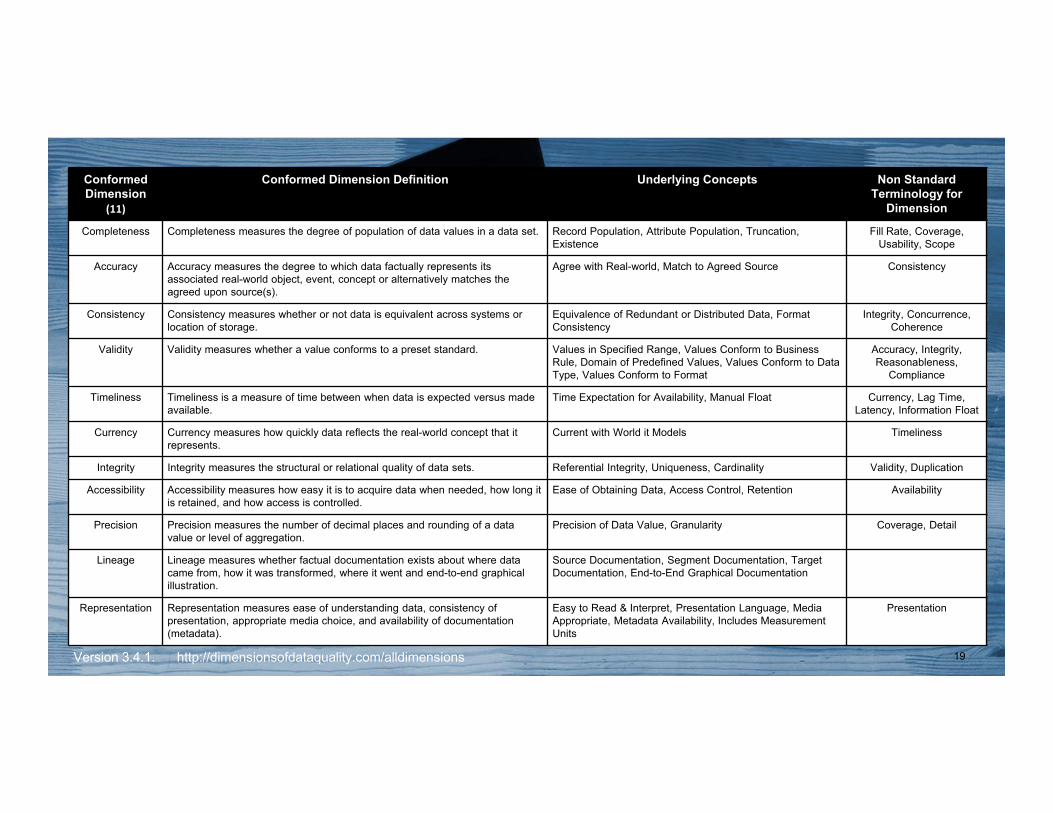
19Version 3.4.1. http://dimensionsofdataquality.com/alldimensions
Conformed Dimension
(11)
Conformed Dimension Definition Underlying Concepts Non Standard Terminology for
Dimension
Completeness Completeness measures the degree of population of data values in a data set. Record Population, Attribute Population, Truncation, Existence
Fill Rate, Coverage, Usability, Scope
Accuracy Accuracy measures the degree to which data factually represents its associated real-world object, event, concept or alternatively matches the agreed upon source(s).
Agree with Real-world, Match to Agreed Source Consistency
Consistency Consistency measures whether or not data is equivalent across systems or location of storage.
Equivalence of Redundant or Distributed Data, Format Consistency
Integrity, Concurrence, Coherence
Validity Validity measures whether a value conforms to a preset standard. Values in Specified Range, Values Conform to Business Rule, Domain of Predefined Values, Values Conform to Data Type, Values Conform to Format
Accuracy, Integrity, Reasonableness,
Compliance
Timeliness Timeliness is a measure of time between when data is expected versus made available.
Time Expectation for Availability, Manual Float Currency, Lag Time, Latency, Information Float
Currency Currency measures how quickly data reflects the real-world concept that it represents.
Current with World it Models Timeliness
Integrity Integrity measures the structural or relational quality of data sets. Referential Integrity, Uniqueness, Cardinality Validity, Duplication
Accessibility Accessibility measures how easy it is to acquire data when needed, how long it is retained, and how access is controlled.
Ease of Obtaining Data, Access Control, Retention Availability
Precision Precision measures the number of decimal places and rounding of a data value or level of aggregation.
Precision of Data Value, Granularity Coverage, Detail
Lineage Lineage measures whether factual documentation exists about where data came from, how it was transformed, where it went and end-to-end graphical illustration.
Source Documentation, Segment Documentation, Target Documentation, End-to-End Graphical Documentation
Representation Representation measures ease of understanding data, consistency of presentation, appropriate media choice, and availability of documentation (metadata).
Easy to Read & Interpret, Presentation Language, Media Appropriate, Metadata Availability, Includes Measurement Units
Presentation

20
Conformed Dimension
Underlying Concepts Definition of Underlying Concept
Completeness Record Population This measures whether a row is present in a data set (table).
Attribute Population This measures whether a value is present (not null) for an attribute (column).
Truncation This measures whether the value contains all characters of the correct value.
Existence Existence identifies whether a real-life fact has been captured as data.
Accuracy Agree with Real-world Degree that data factually represents its associated real-world object, event, or concept.
Match to Agreed Source Measure of agreement between data and the source of that data. This is used when the data represent intangible objects or transactions that can't be observed visually.
Consistency Equivalence of Redundant or Distributed Data
The measure of similarity with other sources of data that represent the same concept.
Format Consistency This measures the conformity of format of the same data in different places.
Logical Consistency Logical consistency measures whether two attributes of related data are conceptually in agreement, even though they may not record the same characteristic of a fact.
Validity Values in Specified Range Values must be between some lower number and some higher number.
Values Conform to Business Rule
Validity measures whether values adhere to some declarative formula.
Domain of Predefined Values
This is a set of permitted values.
Values Conform to Data Type
Validity measures whether values have a specific characteristic (e.g. Integer, Character, Boolean). Data types restrict what values can exist, the operations that can be use on it, and the way that the data is stored.
Values Conform to Format Validity measures whether the data are arranged or composed in a predefined way.
Timeliness Time Expectation for Availability
The measure of time between when data is expected versus made available.
Manual Float Manual float is a measure of the time from when an observation is made to the point it is recorded in electronic format.
Currency Current with World it Models Data is current if it reflects the present state of the concept it models.
Conformed Dimension
Underlying Concepts Definition of Underlying Concept
Integrity Referential Integrity Referential integrity measures whether if when a value (foreign key) is used it must reference an existing key (primary key) in the parent table.
Uniqueness Uniqueness measures whether each fact is uniquely represented.
Cardinality Cardinality describes the relationship between one data set and another, such as one-to-one, one-to-many, or many-to-many.
Accessibility Ease of Obtaining Data This measures how easy it is to obtain data.
Access Control Access control includes the identification of a person that wants to access data, authentication of their identity, review and approval to access required data, and lastly auditing the access of that data.
Retention Retention refers to the period of time that data is kept before being removed from a database through purge or archive processing.
Precision Precision of Data Value The measure of preciseness of numeric data using decimal places, rounding and truncation.
Granularity The detail or summary of data defines the granularity measured by the number of attributes used to represent a single concept.
Lineage Source Documentation Source documentation provides data provenance which describes the origin of the data.
Segment Documentation Segment documentation provides how data is transformed and transported from one location to another.
Target Documentation Documentation about the target explains where the data moved to and how it is stored.
End-to-End Graphical Documentation
End-to-End documentation provides diagrammatic visual representation of how the data flows from beginning to end.
Representation
Easy to Read & Interpret Illustrations and charts should be self-explanatory and presented with appropriate labels, providing context.
Presentation Language Data that is represented well is simple but elegantly formed with good grammar and presented in a standard way.
Media Appropriate The appropriate media (e.g. Web-based, hardcopy, or audio…etc) are provided.
Metadata Availability Comprehensive descriptions and other information about the characteristics of the data are provided in plain language.
Includes Measurement Units
Well represented data includes the scale of measurement, such as weight, height, distance…etc.
Version 3.4.1. http://dimensionsofdataquality.com/content/list-underlying-concepts