confidentiality statement - find statement the information contained in this document, especially...
TRANSCRIPT


2
CONFIDENTIALITY STATEMENT The information contained in this document, especially unpublished data, is the property of FIND
(or under its control) and may not be reproduced, published or disclosed to others without prior
written authorization from FIND.
CONFLICT OF INTEREST STATEMENT
FIND is a non-for-profit foundation, whose mission is to find diagnostic solutions to overcome
diseases of poverty in lower- and middle-income countries. It works closely with the private and
public sectors and receives funding from donors and some of its industry partners. It has an
independent Scientific Advisory Committee and organizational firewalls to protect it against any
undue influences in its work or the publication of its findings.
All industry partnerships (including Cepheid in this case) are subject to review by FIND’s Scientific
Advisory Committee, or another independent review body; selection criteria for technologies and
partnerships include due diligence, TPPs and public sector requirements. FIND catalyses
research and development for diagnostics, leads evaluations, takes positions, and accelerates
access to tools identified as serving its mission.
FIND also supports the evaluation of publicly-prioritized TB assays and the implementation of
WHO-approved (guidance & PQ) assays. In order to carry out test evaluations, FIND has product
evaluation agreements with several private sector companies for TB and other diseases, which
strictly define its independence and neutrality vis-a-vis the companies whose products get
evaluated, and describes roles and responsibilities.
More information on our policy and guidelines for working with private sector partners can be
found here: https://www.finddx.org/wp-content/uploads/2017/01/Tech-Partner-Selection-
Guidelines_QG-05-00-01_V1.0.pdf

3
Table of Contents
Table of Contents ........................................................................................................................................ 3
Investigators and partner institutions ...................................................................................................... 5
Acknowledgements .................................................................................................................................... 8
Executive Summary .................................................................................................................................... 9 Background .......................................................................................................................................... 9 Methods ................................................................................................................................................ 9 Results .................................................................................................................................................. 9 Conclusion .......................................................................................................................................... 10
1. Introduction ....................................................................................................................................... 11 Background ........................................................................................................................................ 11 Description of Comparator test ........................................................................................................... 11 Description of Index test and analytical results .................................................................................. 11 Purpose of the study........................................................................................................................... 12
2. Methods ............................................................................................................................................. 13 2.1 Study design ............................................................................................................................ 13
Study outcomes .................................................................................................................................. 13 Primary outcomes............................................................................................................................... 13 Secondary outcomes .......................................................................................................................... 13 Study sites .......................................................................................................................................... 13 Study population ................................................................................................................................. 15
2.2 Study procedures .................................................................................................................... 16 2.3 Analysis plan and statistical methods .................................................................................. 19
Definitions of test results .................................................................................................................... 19 Exclusion criteria for MTB and RIF detection analyses...................................................................... 19 Reference standards and case definitions (per-patient basis) for MTB and RIF ............................... 20 Metrics: sensitivity, specificity and predictive values .......................................................................... 21 Methodology to demonstrate non-inferiority ....................................................................................... 21 Sample size and enrolment targets .................................................................................................... 22
2.4 Quality assurance .................................................................................................................... 22 External controls testing ..................................................................................................................... 22 Swab testing ....................................................................................................................................... 22 Data management .............................................................................................................................. 22
3. Results ............................................................................................................................................... 24 3.1 Study population ..................................................................................................................... 24 3.2 Primary analyses ............................................................................................................................ 26
3.2.1 Non-inferiority analysis for MTB detection ................................................................................ 26 3.2.2 Non-inferiority analysis for RIF detection .................................................................................. 28 Summary of findings for primary analyses (MTB/RIF non-inferiority) ................................................ 30
3.3 Key secondary analyses ................................................................................................................ 31 3.3.1 Factors influencing Xpert/Ultra sensitivity ................................................................................. 31 3.3.2 MTB accuracy............................................................................................................................ 32 3.3.3 RIF accuracy ............................................................................................................................. 34 3.3.4 Effect of TB history on specificity for MTB detection ................................................................. 34 3.3.5 Analyses reclassifying ‘trace’ call .............................................................................................. 36 3.3.6 Analyses of re-testing patients with ‘trace’ call on first sample ................................................. 38 Summary of findings for key secondary analyses .............................................................................. 39
3.4 Data on CE-mark, extra-pulmonary TB, elimination in non-HBDC & paediatric cases ........... 40 3.4.1 CE-mark data ............................................................................................................................ 40 3.4.2 Extra-pulmonary ........................................................................................................................ 44 3.4.3 TB elimination efforts non-HBDC .............................................................................................. 45

4
3.4.4 Paediatric data........................................................................................................................... 47 Summary of findings for non-HBDC data, extra-pulmonary & paediatric data .................................. 49
3.5 Additional secondary analyses ..................................................................................................... 50 3.5.1 Analyses by site ........................................................................................................................ 50 3.5.2 Ultra on samples 2 and 3 .......................................................................................................... 51 3.5.3 Root-cause analysis of FP results ............................................................................................. 52 3.5.4 Mixed infections ......................................................................................................................... 55 Summary of findings for other secondary analyses ........................................................................... 56
3.6 Shelf life ........................................................................................................................................... 56
4. Summary & Discussion ................................................................................................................... 57 Summary ................................................................................................................................................ 57 Discussion ............................................................................................................................................. 57
5. References ........................................................................................................................................ 60
6. APPENDIX ......................................................................................................................................... 63 APPENDIX A. Details of statistical methods and sample size ......................................................... 63 APPENDIX B. Additional data on RIF ................................................................................................. 66 APPENDIX C. Line listings of patients with RIF discordant results ................................................ 67 APPENDIX D. Differences between Ultra and NEJM Xpert study .................................................... 68 APPENDIX E. Additional data on MTB Sensitivity............................................................................. 69 APPENDIX F. Additional data on MTB Specificity ............................................................................. 72 APPENDIX G. Culture contamination and smear-positive/culture-negative rates ......................... 73 APPENDIX H. Line listings of patients with MTB discordant results .............................................. 74 APPENDIX I. Line listings of patients with mixed infections ........................................................... 76 APPENDIX J. Population-level projections ........................................................................................ 77 APPENDIX K. Predictive values .......................................................................................................... 80 APPENDIX L. Semiquantitative results .............................................................................................. 82

5
Investigators and partner institutions
Principal Investigators
Claudia Denkinger, MD
Foundation for Innovative New Diagnostics, 9 Chemin des Mines, 1202 Geneva, Switzerland
Email: [email protected] Tel: +41 022 749 29 31
Susan E. Dorman, MD
Johns Hopkins University, 1550 Orleans St, CRB2, 1M-12, Baltimore, Maryland, USA 21231
Email: [email protected] Tel: +1 410-502-2717
Partner institutions
FIND, Geneva, Switzerland (organizing site)
Johns Hopkins University School of Medicine, Baltimore, Maryland, USA (organizing site)
Boston Medical Center, Boston, Massachusetts (organizing site)
Rutgers New Jersey Medical School, Newark, New Jersey, USA (organizing site) National Reference Laboratory Republican Scientific and Practical Centre for Pulmonology
and Tuberculosis, Minsk, Belarus (FIND-coordinated trial site)
Núcleo de Doenças Infecciosas, UFES Vitória, Brazil (CDRC-coordinated trial site)
Division of Medical Microbiology, Health Sciences Faculty University of Cape Town, South
Africa (CDRC-coordinated trial site)
Henan Provincial Chest Hospital Zhengzhou, Henan Province, China (CDRC-coordinated trial
site)
National Center for Tuberculosis and Lung Diseases, Tbilisi, Georgia (FIND-coordinated trial
site)
National Health Laboratory Service, Johannesburg, South Africa (FIND-coordinated trial site)
CDC-Kenya, Kenya Medical Research Institute / U.S. Centers for Disease Control and
Prevention Research and Public Health Collaboration Kisumu, Kenya (CDRC-coordinated
trial site)
PD Hinduja Hospital and Medical Research Centre, Mumbai, India (FIND-coordinated trial
site)
State TB Training & Demonstration Centre, New Delhi, India (FIND-coordinated trial site)
Infectious Diseases Institute-Makerere University, Mulago Hospital Complex, Kampala,
Uganda (CDRC-coordinated trial site)

6
Co-Investigators
Dr. Jerrold Ellner Boston Medical Center, 650 Albany St, 6th floor, Boston, Massachusetts, USA 02118 Email: [email protected] Tel: +1617-414-3501 Dr. David Alland Rutgers-New Jersey Medical School, 185 South Orange Avenue, Newark, New Jersey, USA 07103 Email: [email protected] Tel: +1973 (972) 2179 Dr. Camilla Rodrigues PD Hinduja Hospital and Medical Research Centre, Veer Savarkar Marg, Mahim, Mumbai-400 016, India Email: [email protected] Tel: +91 22 24447795 / 94 Dr. Nestani Tukvadze National Center for Tuberculosis and Lung Diseases, 50 Maruashvili str. 0101 Tbilisi, Georgia Email: [email protected] Tel: +99 5322 910 769 Dr. Alena Skrahina National Reference Laboratory Republican Scientific and Practical Centre for Pulmonology and Tuberculosis, Dolginovsky Tract 157, 220053 Minsk, Belarus Email: [email protected] Tel: +375 (17) 289-83-56 Dr. K.K. Chopra State TB Training & Demonstration Centre Jawahar Lal Nehru Marg, Delhi Gate, New Delhi, 110002, India Email: [email protected] Tel: +91 11 23236923 Dr. Wendy Stevens National Health Laboratory Service Modderfontein Road. Sandringham, Johannesburg, South Africa Email: [email protected] Tel: +27 11 489 8567 Dr. Lydia Nakiyingi Infectious Diseases Institute-Makerere University, Mulago Hospital Complex, Kampala, Uganda Email: [email protected] Tel: +256 772 468 045 Dr. Yukari Manabe Infectious Diseases Institute-Makerere University Johns Hopkins University, 1830 East Monument St., 4th floor, Baltimore, Maryland, USA 21231 Email: [email protected] Tel: 410-955-8571 Dr. Mark Nicol Division of Medical Microbiology, 5th floor, Falmouth Building, Health Sciences Faculty University of Cape Town Anzio Road, Observatory, 7925, Cape Town, South Africa. Email: [email protected] Tel: +27 21 406 6083

7
Dr. Kevin Cain CDC-Kenya, Kenya Medical Research Institute / U.S. Centers for Disease Control and Prevention Research and Public Health Collaboration Kisumu, Kenya Email: [email protected] Tel: +254-710-602-786 Dr. Yuan Xing President, Henan Provincial Chest Hospital Zhengzhou, Henan Province, China Email: [email protected] Tel: +86 371 6566 2939 Dr. Reynaldo Dietze Núcleo de Doenças Infecciosas - UFES Vitória, Brazil Email: [email protected] Tel: +55-27-3335-7204

8
Acknowledgements
First and foremost, we would like to thank all study participants, without whom this work would not have been possible. We would also like to thank the clinical and laboratory teams at the participating trial sites for their time and effort in conducting the study and for their work on the root cause analysis. We thank Dr David Allan, Dr Susan Dorman, Dr Jerrold Ellner, Dr Derek Armstrong, Dr Bonnie King, Dr Sandra Armakovitch and others at the Tuberculosis Clinical Diagnostics Research Consortium (CDRC) for their invaluable support in planning, training, conducting and completing this study at five out of the ten trial sites. Additionally we acknowledge to Dr David Boulware, Dr Daniella Cirillo, Dr Mark Nicol, Dr Heather Zar and Dr Andrea Rachow and their teams for the timely completion of all additional studies and for providing unpublished data to enhance the current report. Moreover, we thank Dr Kate Shearer for her review of the analysis plan and statistical code; and Dr David Dowdy and Dr Emily Kendall for their modelling work (report on modelling provided separately).
FIND study team
9
Executive Summary
Background
The development of the Xpert MTB/RIF (Xpert) was a major step forward for improving diagnosis of tuberculosis (TB) and resistance to rifampicin (RIF) globally. However, Xpert sensitivity is imperfect, particularly in smear-negative and HIV-associated TB, and some limitations remain in the determination of RIF-resistance status. The Ultra Xpert MTB/RIF (Ultra) was developed as a next-generation assay to overcome these limitations.
Methods
The main study comprised a 10-site, 8-country prospective multi-centre diagnostic accuracy study in adults with signs/symptoms of pulmonary TB. Xpert and Ultra were performed from the same specimen and accuracy was determined with four cultures as the reference standard for TB detection (two MGIT tubes + two LJ slants, performed on two specimens obtained on separate days) and phenotypic drug-susceptibility testing as well as sequencing for RIF-resistance detection. In parallel to the main study, several retrospective studies were performed to assess the performance of Ultra in extrapulmonary (EPTB) and paediatric samples as well as in non-high burden developing country (HBDC) settings. Decision analytic modelling (full report provided separately) assessed the trade-offs of the assay based on the performance seen in the main study.
Results
In the main study, 1,520 patients were enrolled. Sensitivity of the Ultra was 5% higher than that of Xpert (95%CI +2.7, +7.8) but specificity was 3.2% lower (95%CI -2.1, -4.7). Sensitivity-increases were highest among smear-negative patients (+17%, 95%CI +10, +25) and among HIV-infected patients (+12%, 95%CI +4.9, +21). Specificity-decreases were higher in patients with a history of TB (-5.4%, 95%CI -9.1, -3.1) than in patients with no history of TB (-2.4%, 95%CI -4.0, -1.3). Reclassifying 'trace-calls' (the semi-quantitative category of the Ultra assay that corresponds to the lowest bacillary burden) as 'TB-negative', either in all cases or in those with a history, mitigates most of the specificity losses (Specificity –1.0% and -1.9% if trace reclassified for all cases or only cases with TB history, respectively) while maintaining some of the sensitivity gains over Xpert (Sensitivity +7.6% and +15%). Employing Ultra ‘with re-testing of trace-calls’ (i.e. patients with trace-calls re-tested and considered tuberculosis-negative if result negative upon re-testing) yields similar results to reclassifying 'trace-calls' as 'TB-negative' in those patients with a history (Specificity –2.0%, Sensitivity +15% compared to Xpert). Ultra performed as well as Xpert in detection of RIF-resistant. The number of patients with RIF-resistance enrolled was insufficient to confirm analytical results that suggested a superior performance of Ultra for RIF-resistance detection. The additional retrospective studies demonstrate that in settings where there is very limited TB transmission, (i) specificity of Ultra is close to perfect (99.3%, 95%CI 96-99) and (ii) the increased sensitivity can possibly aid TB elimination efforts. For EPTB and paediatric TB, studies highlighted the benefit of the increased sensitivity (primarily due to the ‘trace-call’) with a sensitivity of 95% for Ultra versus 45% for Xpert in TB meningitis and 71% for Ultra on respiratory samples in children versus 47% for Xpert. The modelling demonstrated that Ultra could improve pulmonary TB case detection and outcomes. Depending on the patient population, Ultra could detect 1 additional TB case per 100 to 1000 individuals evaluated, and prevent one additional TB death per 500 to 10,000 individuals

10
evaluated. However, the increased in case detection comes at a cost: 1 false TB diagnosis and unnecessary treatment per 40 to 70 individuals evaluated and 10 to 500 unnecessary treatments per TB death prevented. The acceptable level of unnecessary treatments per prevented death (or per additional or earlier diagnosis) is likely to vary between settings. A similar trade-off exists regardless of whether the trace-call is used. Conclusion
Ultra has higher sensitivity than Xpert particularly in smear-negative and HIV-infected patients and at least as good accuracy for RIF detection. However, as a result of the increased sensitivity, Ultra also detects non-viable bacilli present particularly in patients with recent history of TB. This results in reduced specificity predominantly in adult patients with pulmonary TB in high burden settings, while in low transmission settings, EPTB and paediatric TB it does not appear to be a problem. Thus, impact of this trade-off between overtreatment and increased diagnosis/decreased TB deaths varies substantially between different settings with variable populations determined by HIV, prior TB history, and prevalence. The willingness to accept this trade-off has to be considered and implementation challenges have to be addressed.

11
1. Introduction
Background
Tuberculosis (TB) causes over 10.4 million cases and 1.5 million deaths per year. Over 95% of new TB cases and deaths occur in developing countries [1]. Culture is the gold standard for TB detection, but remains restricted to higher levels of health infrastructure because of expertise and equipment requirements. Furthermore, it takes weeks to obtain a result. Smear microscopy is still the most prevalent up-front diagnostic in most countries, but it only detects about half of TB infections [2].
Description of Comparator test
The Xpert® MTB/RIF Assay (‘Xpert’) on the GeneXpert platform has shown the potential of molecular tests to provide rapid, sensitive diagnosis and has now been rolled out in over 120 countries [3]. The assay provides a result for TB detection and rifampicin (RIF) resistance within two hours and requires minimal hands-on time [4]. The sensitivity for TB detection is demonstrated to be 98% for smear-positive and 67% for smear-negative, with a specificity of 99% based upon 27 studies with close to 10,000 participants. The performance characteristics for RIF-resistance detection are 95% sensitivity and 98% specificity [5, 6]. In 2010 the WHO endorsed the Xpert Assay for use as the initial diagnostic test in individuals suspected of multidrug-resistant TB or HIV-associated TB and in 2014 expanded the recommendation for use in all patients (including also extra-pulmonary TB [EPTB]) if resources allow [6]. Despite these exciting results, Xpert also has demonstrated limitations. Its sensitivity in HIV-patients, while much improved over smear microscopy, is estimated to be about 10% lower than for HIV-negative patients (i.e. 79%) [5]. Similarly, sensitivity is decreased in those with paucibacillary disease (e.g. early presentation, children) [7-9]. The lack of sensitivity particularly in these subgroups still results in a substantial amount of empiric treatment and possibly overtreatment that undermines the effect of the test [10, 11]. Furthermore, a number of issues have been demonstrated in the sensitivity of RIF-resistance detection, particularly as it relates to heteroresistance, as well as related to specificity due to silent mutation detection and also cross-reactivity with NTMs [12,13]. That being said, initial concerns around specificity of RIF-resistance detection have been largely refuted, as poor clinical outcomes have been associated with Xpert RIF-resistant and phenotypically sensitive isolates. In this context the reference standard of phenotypic drug susceptibility testing has been put into question [14,15]. Operational issues concerning the GeneXpert platform have also become manifest and have resulted in increased error rates and module failure in settings where environmental temperature and humidity are high and cannot be controlled, and where abundant dust is present [16].
Description of Index test and analytical results
Overall, the roll out of Xpert has been successful but a need for improvement in both performance and operational characteristics has been demonstrated. Limit of detection: The Xpert MTB/RIF Ultra (Ultra) addresses many of these issues. To improve assay sensitivity for the detection of M. tuberculosis, the Ultra incorporates two different multi-copy amplification targets (IS6110 and 1081) and a larger DNA reaction chamber than the Xpert (50mcl enter the PCR versus 25mcl in Xpert). The Ultra also incorporates fully nested nucleic acid amplification, more rapid thermal cycling, and improved fluidics and enzymes. This has resulted

12
in Ultra having a limit of detection (LOD) of 15.6 bacterial colony-forming units per ml (compared to 114 colony-forming units per ml for Xpert). Specificity testing: Exclusivity testing confirmed excellent specificity for Ultra (improved upon Xpert). No cross-reactivity was observed with 30 NTMs that were tested at concentration > 5 x 10⁷ CFU/ml with the FAM probe used to identify M. tuberculosis. In addition, no NTM cross reacted with more than 2 rpoB probes. Resistance detection: To improve the accuracy of Rifampicin (RIF) resistance detection, the Ultra incorporates melting temperature-based analysis instead of real-time PCR. Specifically, four probes identify RIF-resistance mutations in rpoB by shifting the melting temperature away from the wild type reference value. Analytic studies have demonstrated that these probes reliably distinguish between wild type (RIF susceptible) and mutant (RIF-resistant) rpoB sequences, and that the melting temperature profiles are robust over a wide range (108 to 5 colony-forming units/ml) of M. tuberculosis concentrations. The Ultra is able to better differentiate the silent mutations Q513Q and F514F from resistance conferring mutations. The rare false positive results for RIF-resistance detection in paucibacillary samples has been resolved. In addition, detection of mixtures in spiking studies particularly for the most common mutations such as S531L has been substantially improved (detection of 1% of mutant if wildtype makes up 99% WT. Less common mutations are detected if at least 10-40% of the mixture is mutant). Test interpretation: The analytics and algorithms were modified to improve specificity. Mycobacterium tuberculosis (MTB) detection on Ultra is defined as: one or both of the FAM-labelled probes that detect the multi-copy targets are positive with cycle thresholds (CTs) <37) and ≥2 rpoB probes have CTs <40. An additional semi-quantitative category (‘trace’) was added to take into account the higher sensitivity (updated categories are high, medium, low, very low and trace). For a trace-call one or both of the FAM-labelled probes are positive with cycle thresholds (CTs) <37 and no more than 1 rpoB probes have CT <40. A result is declared 'TB not detected' if neither of the two FAM-labelled probes is positive and the SPC probe is positive with CT <35 For RIF detection, RIF-resistance is considered absent if MTB is detected (not trace) and all four rpoB probes have identifiable melt temperature (Tm) peaks in wild type windows. RIF-resistance is detected if MTB is detected (not trace) and all four rpoB probes have identifiable Tms and at least one of the rpoB probes has a Tm in a mutant window. If MTB is detected with a trace-call, then no call can be made on RIF-resistance and results are reported as ‘MTB detected, trace, RIF indeterminate’. Purpose of the study
The study described herein was intended to confirm analytical data for the Ultra test and results from testing of frozen samples. The study was intended to provide information for a WHO review and assess clinical performance data in geographically diverse high-burden settings of intended use under rigorous clinical trial conduct. The study compared the performance of Ultra for detection of TB and RIF-resistance in adults suspected of having pulmonary TB against the performance of the existing Xpert test non-inferiority of Ultra compared to Xpert MTB/RIF.

13
2. Methods
2.1 Study design
This was a blinded, multicentre, prospective non-inferiority study where Ultra was the index test, Xpert the comparator, and culture and phenotypic drug susceptibility (DST) testing, as well as sequencing, the reference standard. Participants suspected of pulmonary TB were enrolled prospectively and tested with both the index and comparator test (on the same specimen) in order to estimate differences in sensitivity and specificity.
Study outcomes
Primary outcomes
MTB detection o ∆ Sensitivity: difference in sensitivity (among smear-negative/culture-positive
patients) between Xpert and Ultra o ∆ Specificity: difference in specificity between Xpert and Ultra
RIF detection o ∆ Sensitivity: difference in sensitivity (among smear-negative/culture-positive
patients) between Xpert and Ultra o ∆ Specificity: difference in specificity between Xpert and Ultra
Secondary outcomes
Estimates of accuracy for MTB detection o Overall/pooled o By smear-status o By HIV status o By TB history & time since treatment completion o By site o On secondary study samples
Root-cause analysis of discordant results between Ultra and culture
Analyses reclassifying the ‘trace’ call
Analysis of NTMs
Analysis of semi-quantitative results
Study sites
Ten sites in eight countries covering a variety of geographic locations with differences in TB, MDR and HIV prevalence were selected (see Figure 2.1 and Table 2.1). Seven of the countries are considered high TB burden countries by the WHO, based on absolute number of incident cases, MDR cases or TB/HIV cases[1]. Georgia is not ranked as a high burden country though it does suffers from a significant MDR epidemic.

14
Figure2.1. Map of participating sites/countries
1. National Reference Laboratory Republican Scientific and Practical Centre for Pulmonology
and Tuberculosis, Minsk, Belarus
2. Núcleo de Doenças Infecciosas, UFES Vitória, Brazil
3. Division of Medical Microbiology, Health Sciences Faculty University of Cape Town, South
Africa
4. Henan Provincial Chest Hospital Zhengzhou, Henan Province, China
5. National Center for Tuberculosis and Lung Diseases, Tbilisi, Georgia
6. National Health Laboratory Service, Johannesburg, South Africa
7. CDC-Kenya, Kenya Medical Research Institute / U.S. Centers for Disease Control and
Prevention Research and Public Health Collaboration Kisumu, Kenya
8. PD Hinduja Hospital and Medical Research Centre, Mumbai, India
9. State TB Training & Demonstration Centre, New Delhi, India
10. Infectious Diseases Institute-Makerere University, Mulago Hospital Complex, Kampala,
Uganda

15
Table 2.1. Site characteristics
Country / Site TB
(rate per 100K)*
MDR (rate per
100K)*
HIV+TB (rate per 100K)*
Primary use
Level of the health system
Average # samples per day**
Ultra testing area
Belarus, Minsk
55 37 3.2 MDR detection
Referral centre
78 Molecular testing
Brazil, Vitória 41 1.1 6.3 Case detection
Referral centre & primary care
15 Microbiology
RSA, Cape Town
834 37 473 Case detection
Primary care 100 Microbiology
China, Henan Province
67 5.1 1.1 MDR detection
Primarily referral centre; some primary care
20 Microbiology
Georgia, Tbilisi
99 25 6.4 Case detection
Referral centre
120 Microbiology
RSA, Johannesburg
834 37 473 Case detection
District & provincial centres (2)
15 Microbiology
Kenya, Kisumu
233 4.3 78 Case detection
Primary care 35 Microscopy
India, Mumbai 217 9.9 8.6 MDR detection
Referral centre
110 Molecular testing
India, New Delhi
217 9.9 8.6 Case detection
District centre
65 Microscopy
Uganda, Kampala
202 49 66 Case detection
Hospital inpatient & primary care (2)
35 Microscopy
*WHO Report 2016 **Including diagnostic and treatment monitoring sputum samples
Study population
Participants were recruited consecutively, in both outpatient clinic settings and inpatient hospital settings (Uganda only), and enrolled into one of two groups, namely a ‘Case Detection Group’ and a ‘Drug-Resistant TB Group’. Study participants met all of the Inclusion Criteria and none of the Exclusion Criteria (see Table 2.2 for eligibility criteria).

16
Table 2.2. Eligibility criteria per study group
Case Detection Group Drug-Resistant TB Group
Inclusion criteria Inclusion criteria
Age 18 years or above
Provision of informed consent
Willingness to provide 4 sputum specimens at enrolment
Willingness to have a study follow-up visit approximately 42 to 70 days after enrolment
Clinical suspicion of pulmonary TB (including cough ≥2 weeks and at least 1 other symptom typical of TB)
Age 18 years or above
Provision of informed consent
Willingness to provide 4 sputum specimens at enrolment
Non-converting PTB cases (category I and category II failures) or MDR-suspect (based on WHO definition), i.e. at least one of the following:
o microbiologically-confirmed pulmonary TB with documented RIF-resistance who has received anti-tuberculosis therapy for 31 days or less;
o known pulmonary TB with suspected treatment failure;
o history of drug-resistant TB AND off anti-TB therapy for ≥ 3 months
Exclusion criteria Exclusion criteria
Receipt of any dose of TB treatment within 6 months prior to enrolment
Participants for whom, at the time of enrolment, the follow-up visit was poorly feasible (e.g. individuals planning to relocate)
None
Additionally, participants who provided consent and who were enrolled, but who at enrolment did not provide at least three sputum specimens of sufficient volume (2-2.5 ml for each sputum sample), were classified as early withdrawals and removed from the study.
2.2 Study procedures
After obtaining informed consent, participants were enrolled by the study team. The following evaluations were performed and information was captured using standardised case report forms:
Collection of demographic information
Targeted medical history
Review of medical record including (if performed for routine clinical care purposes and results available) chest imaging results, CD4 T lymphocyte enumeration results, mycobacteriology laboratory results
HIV test, unless any one or more of the following were available: written results of a positive HIV antibody test, written results of a positive HIV viral load, documentation in the medical record of positive HIV status by a treating clinician, immediate/verifiable documentation of HIV negativity within the preceding one month. HIV testing was performed using any test method approved by local health authorities following pre-test HIV counselling as per local guidelines

17
Participants were asked to provide four sputum samples (S1, S2, S3, S4) over Days 1 and 2 (Figure 2.2). Each specimen had to be of at least 2-2.5 ml in volume. For the Case Detection Group, all samples needed to be collected before the subject was started on TB treatment
Laboratory testing was performed by index and reference standard tests as per sample flow (Figure 2.2). Quality assured smear microscopy, culture and drug susceptibility testing was performed on-site. Dedicated GeneXpert IV systems were provided for Ultra testing and included the software version 4.7b and specific Ultra assay definition file (ADF)
o S1: a smear was prepared directly[17], after which sample reagent (SR) was added to
the leftover sputum in 2:1 ratio. The pipetting order was randomised following a randomisation list by which 2 ml of sample mix were transferred first to either an Xpert [4] or Ultra cartridge and another 2 ml were then transferred to the other assay cartridge
o S2: following NALC-NaOH decontamination[18] (1% final NaOH concentration at all sites
and 1.25% at New Delhi from July to October) the pellet was re-suspended in Phosphate-buffered saline solution, 2 ml final volume. Ultra (2:1 SR[19]), smear, solid and liquid culture[20] were then performed
o S3: if sample volume was 3 ml or higher, samples were homogenised with sterile glass
beads and mix by vortex. 1 ml (1.5 ml at CDRC sites) was then used for Ultra (2:1 SR) and the remaining volume underwent NALC-NaOH decontamination as per S2. Smear, solid and liquid culture were then performed
o S4: if Xpert and Ultra results on S1 were discordant, solid and liquid culture were
performed on S4. Otherwise, S4 was stored (frozen) for subsequent testing in case of culture-discordant cases
o All positive cultures underwent M. tuberculosis complex identification using either MPT64
antigen detection tests or line probe assay (see Table 2.3 for details)
o MGIT DST was performed from the first positive culture (either solid or liquid) per sample on S2 and/or S3
o All positive Xpert and Ultra cartridges were stored (refrigerated or frozen) at FIND-
coordinated sites to allow for sequencing from DNA amplicons where needed. Additionally, any leftover sputum, pellet, NTM+ or MTB+ culture isolates were stored (frozen)

18
Figure 2.2. Sample flow at enrolment
1 At FIND sites if >5 ml, split sample, use 2.5 ml and store leftover sputum. At CDRC sites whole volume was used. 2 At FIND sites if <3 ml, process all for NALC/NaOH; if ≥3-5 ml, use 1 ml for Ultra, rest NALC/NaOH. At CDRC sites minimum volume 2 ml, if >3 use 1.5 ml for Ultra, rest NALC/NaOH. 3 Consider pos/neg result vs. invalid result in the other test as discordant. Same for CDRC, but discarded otherwise. * At the site in Johannesburg LPA from S2 (500ul pellet) was performed as part of the standard of care in South Africa
Table 2.3. Reference standard test & index test procedures
Test Notes* Smear Fluorescence microscopy (Auramine-O) at all sites, light microscopy (Ziehl
Neelsen) in Belarus. Testing and reporting as per WHO/IUATLD guidelines [17].
Xpert MTB/RIF 2:1 sample reagent added to raw sputum. In case of invalid, error or no result, testing was repeated if enough sample was available
Ultra MTB/RIF 2:1 sample reagent added to raw sputum and pellet [19]. In case of invalid,
error or no result, testing was repeated if enough sample was available.
Liquid culture Mycobacteria Growth Indicator Tube (MGIT) 960 culture; BD Microbiology Systems
Solid culture Löwenstein Jensen. Testing and reporting done as per GLI mycobacteriology laboratory manual and local guidelines
MGIT DST BD MGIT AST SIRE Test kit
LPA Genotype MTBDR plus, Hain Lifescience in Johannesburg as per standard of care
MTB identification MPT-64 by SD Bioline (Belarus, China, Georgia, Kenya, New Delhi, Uganda), BD (Cape Town, Hinduja) or Bioeasy (Brazil). LPA Hain CM (Johannesburg)
*Testing done as per manufacturer’s instructions unless otherwise specified
Follow-up & assessment of discrepant cases At CDRC-coordinated sites, all participants underwent a follow-up visit approximately two months after enrolment. At FIND-coordinated sites, only culture-negative participants with discrepant

19
Xpert and Ultra results, as well as a subset of participants who were negative on all tests (30% randomly selected), underwent a follow-up visit approximately two months after enrolment. In all cases, the aim was to assess TB treatment status and clinical evolution. Additionally, a fifth spot sputum sample was obtained at the two months visit for smear, solid and liquid culture from participants who were not on TB therapy at follow-up. All FIND-coordinated sites were instructed to store positive Ultra cartridges as well as culture isolates for further assessment of discrepant cases. Available samples from discordant cases for TB detection and the same number of randomly selected non-discordant cases were shipped either to Italy (Ospedale San Raffaele, Milan) or India (PD Hinduja Hospital, Mumbai) for testing by next generation sequencing (Illumina Miniseq System, analysis by PhyResSe [21]) and pyrosequencing (Qiagen PyroMark Q96 ID, analysis by IdentiFire [22]), respectively. Additionally, sequencing of RIF discordant cases was done from culture isolates from all sites by next generation sequencing (NGS), pyrosequencing or Sanger (ABI platform, analysis by SeqMan, SeqManPro, Sequencher or DNAMAN).
2.3 Analysis plan and statistical methods
Definitions of test results
Definitions of test results are described in tTable 2.4. Table 2.4. Definitions of test results
Exclusion criteria for MTB and RIF detection analyses
Patients with any of the following criteria were excluded from the primary analyses of diagnostic test accuracy:
no valid Xpert result
no valid Ultra result
Test result Description
Smear-positive ≥ 1 positive smear (inclusive of scanty positive smears) using WHO grading
Culture-positive ≥ 1 LJ and/or MGIT culture growth confirmed MTB complex
Culture-negative At least 2 LJ or MGIT have no culture growth after >56 days and >42 days
Contaminated culture
LJ: Cultures completely overgrown by bacterial or fungal contaminations within 3 weeks (discarded). In case of mixed cultures, isolated MTB colonies transferred to new LJ tube (repeat culture) MGIT: Instrument positivity without detection of AFB
Xpert-positive MTB positive on Xpert® MTB/RIF
Xpert-negative MTB negative on Xpert® MTB/RIF
Xpert invalid Any test run that is invalid, error, or inability to produce a result from a single Xpert® MTB/RIF run
Xpert RIF- indeterminate
MTB positive on Xpert® MTB/RIF with indeterminate for RIF-detection only
Ultra-positive MTB positive on Xpert® Ultra
Ultra- negative MTB negative on Xpert® Ultra
Ultra invalid Any test run that is invalid, error, or inability to produce a result from a single Xpert® Ultra run
Ultra RIF-indeterminate
MTB positive on Xpert® Ultra with indeterminate for RIF-detection only

20
no valid culture result
no valid phenotypic DST result for RIF (for RIF analysis only)
2 contaminated cultures unless other criteria for culture-positivity/negativity are met
smear-positive-culture-negative
single positive culture with ≤20 colonies (LJ) or >28 days’ time to positivity (MGIT)
culture-positive but no MTB speciation available
specimens with growth of mycobacteria other than MTB complex only
Reference standards and case definitions (per-patient basis) for MTB and RIF
The case definitions used for the analyses of MTB and RIF detection are shown in the Table 2.5. For MTB detection, main analyses were done with TB defined based on microbiological tests. For RIF detection, main analyses were based on phenotypic test results; genotypic test results were used for discordant resolution. Table 2.5. Case definitions
Diagnosis Description
Smear-positive, culture-positive pulmonary TB
Patient with ≥ 1 positive smear (inclusive of scanty positive smears) and any positive culture result as per definitions of test results
Smear-negative, culture-positive pulmonary TB
Patient with all negative smears and any positive culture result as per definitions of test results
Microbiologically non-TB case
Culture-negative case as per definitions of test results
Non-TB case Smear-negative, Xpert-negative and culture-negative and not started on TB treatment on the basis of clinical criteria For Ultra+/Culture-discordant cases, a follow-up with repeated clinical and bacteriological work-up will be required to exclude TB with the highest possible likelihood. Only if the bacteriological work-up remains negative, the participant is called Non-TB
Clinical TB case Any participant who tests smear-negative, Xpert-negative, culture-negative but is started on TB treatment on the basis of clinical criteria and possibly other diagnostic tests such as chest-X-ray
NTM Culture-positive with NTM on rapid speciation test AND no other culture-positive for MTB
Phenotypic RIF-resistant Culture-positive and growth for Rif in conventional DST testing
Phenotypic RIF-sensitive Culture-positive and no growth for Rif in conventional DST testing
Genotypic RIF-resistant Sequencing identifies mutations recognized to be associated with resistance (defined based on consultation with WHO prior to analysis)
Genotypic RIF-sensitive Sequencing identifies no mutations recognized to be associated with resistance (defined based on consultation with WHO prior to analysis)
Composite reference standard RIF-resistant
If phenotypic DST shows sensitivity but sequencing identifies mutations recognized to be associated with resistance, the composite reference standard will be considered Rif-resistant
If phenotypic DST shows resistance but sequencing does not identify mutations to be associated with resistance, the composite reference standard will be considered Rif-resistant (as mutations will be assumed outside of the region sequenced)
Composite reference standard RIF-sensitive
If phenotypic DST shows sensitivity and sequencing shows either no mutations or only mutations that are not associated with resistance

21
In addition to the above-described case definitions, we explored two alternative case definitions for sensitivity analyses. The main aim of this was to conduct analyses that are as similar as possible to those done in studies included in the Cochrane review to obtain results that can be compared directly (i.e., un-confounded by differing case definitions and reference standards):
a) Smear and culture as in Cochrane review: all studies had culture(s) and smear done on single sample (only exception: Boehme, NEJM)
b) Smear as in NEJM paper: sample declared SSM+ if at least one of 3 smears was at least 1+ or if at least 2 smears were scanty (old WHO/IUTLD smear classification)
A caveat to these analyses is that (with very few exceptions) microscopy was done with ZN in the old studies, making results from the Ultra-study that used fluorescence microscopy (FM) almost exclusively not directly comparable to the NEJM / Cochrane results. From comparative studies of FM and ZN microscopy one would expect at least a 10% higher sensitivity of FM [23].
Metrics: sensitivity, specificity and predictive values
Sensitivity and specificity
Sensitivity: proportion positive by reference standard that are detected as positive by
index test
Specificity: proportion negative by reference standard that are detected as negative by
index test
Predictive values vary depending on disease prevalence and will be provided at three exemplary
levels of prevalence to provide estimates for varying scenarios of interest.
Positive predictive value (PPV): proportion positive by index test that are positive by
reference standard
Negative predictive value (NPV): proportion negative by index test that are negative by
reference standard
Results are presented with 95% confidence intervals (95%CI). Different methods were used to compute confidence intervals, depending on the data structure. For simple proportions (e.g., sensitivity of Ultra) Clopper-Pearson 95%CI were used. For differences in proportions of paired samples (e.g., difference in sensitivity delta between Ultra and Xpert), 95%CI around delta were calculated using Tango's score confidence interval for a difference of proportions with matched pairs, which takes into account that the two tests were performed on the same sample. More details are provided in Appendix A. Methodology to demonstrate non-inferiority
Non-inferiority was assessed by comparing the 95%CI for a difference in the parameter of interest against the pre-defined non-inferiority margin (Table 2.6). If the lower limit of this confidence interval lies above (i.e., is higher than) the non-inferiority margin, non-inferiority has been demonstrated with respect to the chosen margin[24, 25]. More details are provided in Appendix A. A margin was not defined for specificity.

22
Table 2.6. Non-inferiority margins for comparison between Xpert and Ultra
Smear-negative MTB RIF-resistance
Sensitivity Specificity Sensitivity Specificity
Non-inferiority margin -7% None pre-specified -3% -3%
Sample size and enrolment targets
According to the primary trial objective, sample size calculations were based on proving non-inferiority of Ultra compared to Xpert. This was evaluated on two key endpoints, (i) sensitivity for TB detection among the subset of culture-confirmed TB patients whose smears all are negative (i.e., per-patient analysis, smear-negatives only) and (ii) sensitivity and specificity for RIF detection among all patients. Generic sample size formulas do not account for the correlation between tests that is present when testing samples from the same patient with two tests. Additionally, such formulas rely on asymptotic theory that yield biased results for small sample sizes. We therefore carried out sample size calculations via Monte-Carlo Simulation. More details are provided in Appendix A. Based on our assumptions about test performance, the non-inferiority margin, prevalence of TB, smear-negative TB and RIF-resistance, as well as inflation to account for expected losses, the final sample size was computed as 1,143.
2.4 Quality assurance
External controls testing
External controls used (two positive controls (Wild type and mutant) and one negative control (Maine Molecular Quality Controls, Inc.) were used to try to exclude DNA amplicon contamination that could affect the Ultra and possibly Xpert performance throughout the study. A set of three controls (two positive and one negative) were run on Ultra daily for the first month and weekly afterwards. Troubleshooting of unexpected results included repeat testing as well as additional cleaning steps.
Swab testing
In addition to the testing of external controls, swabs were tested on Ultra on a weekly basis to identify potential DNA amplicon contamination of the working areas. Briefly, separate sterile swabs dipped in sterile water were used to sample the Ultra processing area and GeneXpert system surfaces. The swabs were then placed in a tube containing SR, incubated and processed by Ultra. Same as for the external controls testing troubleshooting of unexpected swab results included repeat testing as well as additional cleaning steps.
Data management
At FIND coordinated sites, data were capture through double data entry at the sites onto FIND’s online clinical trials platform from paper-based case report forms (CRF). At CDRC coordinated sites, paper CRF were completed, scanned and uploaded onsite using a secure method and read into the database via Teleform at the CDRC Data Coordinating Center. Both systems were password protected and data quality checks were performed on a regular basis to identify data
23
that appear inconsistent, incomplete, or inaccurate. FIND was ultimately responsible for compiling data and conducting the analysis. Key sections of statistical code were completely re-written and re-run by an independent statistician. Additionally, the entire statistical code was checked, analyses rerun and results confirmed. The full study protocols can be shared upon request.

24
3. Results
3.1 Study population
Between February and October 2016, 2,041 patients met the eligibility criteria for enrolment into the study across the ten study sites and 1,520 of them were eligible for inclusion in the analysis (Figure 3.1). Of the 2,041 patients, 182 patients did not submit a third sputum sample and were thus excluded from further study as per protocol (since the reference standard would have been incomplete in these patients; see section 2.1). Of the enrolled 1,859 patients, 339 were excluded from the main analyses as per analysis plan (see section 2.3), mainly due to outstanding culture results (127 did not have any culture results yet at time of analysis; 97 had insufficient culture results to fulfil the case definition) or non-determinate results on Xpert or Ultra. Most patients (82%, n=1,243) were included in the case detection group for analysis of accuracy for MTB detection and RIF detection; most of the additional 277 patients enrolled in the MDR risk group were already on treatment for TB at time of enrolment and patients in this group were only eligible for the for analysis of accuracy for RIF detection.
Figure3.1. Participant exclusions
Note that Xpert and Ultra non-determinate results are excluded from the accuracy analyses but are reported separately.
Demographic and clinical characteristics of the patient population enrolled are shown in Table 3.1 by site and in total. Median age was 30-34 years in the African and Indian sites (with the exception of Cape Town) and between 42-50 years in the Eastern European sites, China and Brazil. Most participants were men, with women making up ~40% in most sites, with the exception of Cape Town (where women predominated, 57%) and China and Georgia (where women made up an even smaller proportion, 25 and 28% respectively).

25
As expected based on country-level data, HIV prevalence was high in the African sites and low in the non-African sites, although HIV-infection status was unknown in many patients in these countries. The prevalence of a TB history was 21% in the case detection group and 60% in the MDR risk group on average, with large variation between sites. The TB prevalence (estimated based on the reference standard) was 32% in the case detection group and 68% in the MDR risk group on average. TB prevalence was high in China (79%, 26/33), Mumbai (69%, 29/42) and Belarus (54%, 22/41) because these sites are TB referral centres and enrolled a larger percentage of patients into the MDR risk group. Among the 403 culture-positive patients in the case detection group, 30% (n=119) tested negative on smear microscopy on all of the three specimens tested. The proportion of culture-positive TB testing smear-negative appeared markedly higher than average in Belarus (59%, 13/22) and Cape Town (52%, 14/27) and less common in Brazil (15%, 5/34), China (15%, 4/26) and New Delhi (19%, 7/37); while some of this variation may be due to differences in patient spectrum, the number of TB cases (and smear-negative/culture-positive cases) were small in any single site and some variation due to chance variability would also be expected. The prevalence of a RIF-resistance was 19% among new cases and 64% among re-treatment cases on average; as expected, there was large variation between sites with high rates of RIF-resistance in Eastern European sites as well as the sites in Mumbai and China, which are referral centres and see a lot of MDR patients. Table 3.1. Demographic and clinical characteristics of patient population enrolled
Site Case
detection MDR risk
Total Median
age (IQR)
Female sex [%]
HIV [%]
TB history
[%]4
Cult.+
[%]4
SSM-Cult.+
[%] 4,5
RIF-r new [%]
RIF-r retr. [%]
Belarus 41 62 103 42 (29-56) 41% ≤4.0%1
12% 54% 59% 56% 100%
Brazil 127 0 127 50 (37-59) 36% 5% 7% 27% 15% 3% NE
Cape Town 150 2 152 41 (34-49) 59% 57% 39% 18% 52% 5% 20%
China 33 68 101 47 (34-57) 25% 0% 3% 79% 15% 20% 70%
Georgia 290 23 313 45 (34-56) 28% ≤4.0%1
29% 29% 36% 19% 79%
Jo’burg 142 0 142 34 (29-43) 38% 68%2
28% 34% 31% 3% 0%
Kenya 136 0 136 34 (27-44) 49% 58% 15% 21% 21% 0% 0%
Mumbai 42 121 163 30 (22-45) 45% 4.0%1
13% 69% 31% 46% 73%
New Delhi 101 1 102 30 (21-45) 42% 4.0%1
26% 38% 19% 28% 25%
Uganda 181 0 181 30 (26-39) 36% 46% 8% 37% 24% 0% 0%
Total 1,243 277 1,520 38 (28-50) 39% 25%3
21% 32% 30% 19% 64%
1 Country-level HIV prevalence in TB cases used as infection status was unknown for >50% of study participants 2 HIV-infection status was unknown for 13 individuals 3 Estimated using country-level HIV prevalence in TB cases for sites with very incomplete HIV-infection status data 4 Numbers shown for patients in the ‘case detection group’ 5 Calculated as n(SSM-Cult+)/n(Cult+)

26
3.2 Primary analyses
The primary analyses focused on assessing the question of non-inferiority of the performance of Ultra compared to that of Xpert. We show results for MTB detection in the first sub-section, RIF detection in the second sub-section and conclude with a summary of findings. Note that absolute values for sensitivity and specificity of Xpert and Ultra are reported in secondary analyses. 3.2.1 Non-inferiority analysis for MTB detection
Non-determinate (ND) rates were 1.5% for Xpert and 4.1% for Ultra (Table 3.2) and re-testing leftover sputum-sample-reagent-mixes resolved 90% and 88% of initially ND results, respectively. Ultra ND-rates were 3.4% when excluding instrument-related errors. Culture contamination rates averaged 5% to 8% depending on sample and culture type. Table 3.2. Non-determinate (ND) results
ND results in initial test runs ND after repeat runs1
Xpert 1.5% (20/1,316) 2
0.2% (2/1,316)
Ultra 4.1% (54/1,316)2
0.5% (2/1,313)3
1 ND-rate with rerun testing for invalids included 2 ND-rates were 1.4% for Xpert and 3.2% for Ultra when excluding instrument-related errors 3 No repeat test done for 3 “Ultra ND samples” because of insufficient volume to re-test both assays (priority for re-testing was given to Xpert in the study as results were relevant for clinical decision-making)
The direct head-to-head comparison of performance for MTB detection shows superior sensitivity but lower specificity of Ultra compared to Xpert (Table 3.3, Figure 3.2). Overall sensitivity (i.e., taking smear-positive and smear-negative cases together) of Ultra was 5% higher than Xpert (95%CI +2.7%, +7.8%); the increase among smear-negative/culture-positive cases was 17% (95%CI +10%, +25%). The lower limit of the 95%CI (+10%) lies above the non-inferiority margin of -7% (red broken line in Figure 3.2, Panel A), demonstrating non-inferiority of Ultra to Xpert; in fact, the lower limit of the 95%CI also lies above 0% (the point of no difference, black broken line in Figure 3.2, Panel A), thus also showing superiority of Ultra sensitivity over Xpert. Specificity of Ultra was 3.2% lower than that of Xpert (95%CI -4.7%, -2.1%). A non-inferiority margin had not been pre-specified for specificity, so an assessment of non-inferiority could not be done. However, the upper limit of the 95%CI lies below 0% (the point of no difference, black broken line in Figure 3.2, Panel B), suggesting that specificity of Ultra was inferior to that of Xpert.

27
Table 3.3. Non-inferiority analysis for MTB detection
Overall Sensitivity
(95%CI) Sensitivity in smear-negative TB
(95%CI) Specificity (95%CI)
Difference (Ultra – Xpert)
+5.0% (+2.7%, +7.8%)
+17% (+10%, +25%)
-3.2% (-4.7%, -2.1%)
NI-margin None set -7% None set
Interpretation Superior Superior Inferior
Figure 3.2. MTB non-inferiority analysis
A
B
The difference in sensitivity/specificity (∆ = Ultra – Xpert) is displayed as horizontal lines with the point representing the point estimate and whiskers representing the upper and lower limit of the 95%CIs of ∆. The black vertical dotted line indicates zero difference in sensitivity/specificity and the red vertical broken line indicates the non-inferiority margin. Panel A Shows the difference in sensitivity in smear-negative/culture-positive TB. The lower limit of the 95%CI (+10%)
lies above the non-inferiority margin of -7% (red broken line), demonstrating non-inferiority of Ultra to Xpert; the lower limit of the 95%CI also lies above 0% (the point of no difference, black broken line), thus also showing superiority of Ultra sensitivity over Xpert. Panel B Shows the difference in specificity. A non-inferiority margin had not been pre-
specified for specificity, so an assessment of non-inferiority could not be done (and no non-inferiority margin is shown in this plot). However, the upper limit of the 95%CI lies below 0% (the point of no difference, black broken line), suggesting that specificity of Ultra was inferior to that of Xpert.
MTB Non-inferiority analysis
34
Se
ns.
(po
ole
d)
Se
ns.
(S-C
+)
Sp
ecif
icit
y
∆ Sensitivity = +17% (95%CI +10%, +25%) à Sensitivity superior
∆ Specificity = -3.2% (95%CI -4.7%, -2.1%) à Specificity inferior
∆ Sensitivity = +5.0% (95%CI +2.7%, +7.8%)
●
NI−
marg
in
−8 −4 0 +4 +8 +12 +16 +20 +24 +28
delta Sensitivity
Sensitivity for S−C+ TB
●
NI−
ma
rgin
−8 −4 0 +4 +8 +12 +16 +20 +24 +28
delta Sensitivity
Sensitivity for S−C+ TB
●
NI−
ma
rgin
−8 −4 0 +4 +8 +12 +16 +20 +24 +28
delta Sensitivity
Sensitivity for S−C+ TB
●
−6 −5 −4 −3 −2 −1 0 +1 +2
delta Specificity
Specificity for TB
●
−6 −5 −4 −3 −2 −1 0 +1 +2
delta Specificity
Specificity for TB
●
−6 −5 −4 −3 −2 −1 0 +1 +2
delta Specificity
Specificity for TB
CONFIDENTIAL
One Ultra-”FP”/Xpert-”TN” patient had a non-study culture+ result (from a specimen collected 1 month post-enrolment; all study cultures were negative)

28
3.2.2 Non-inferiority analysis for RIF detection
Tables 3.4 and 3.5 show Xpert-RIF and Ultra-RIF results for all samples with available phenotypic drug-susceptibility testing results. Overall Ultra provided RIF-results on four more patients than Xpert. This is a result of Xpert missing TB more often entirely (i.e. they tested negative for MTB on Xpert; see the cross-tabulation of Xpert-RIF and Ultra-RIF results in Appendix B). The apparent higher ND-rate for RIF calls in the Ultra assay is a result of Ultra detecting more TB in the first place but only with its trace-call (i.e. based on multi-copy targets, which by definition leads to a RIF-indeterminate result). Table 3.4. Xpert-RIF results for all samples with available phenotypic DST results
MGIT DST
Xpert RIF-r (n=187)
RIF-s (n=416)
MTB--/invalid
12.8% (24) 14.9% (62)
MTB+
RIFND
0.5% (1) 0.7% (3)
MTB+
RIFR
82.9% (155) 1.7% (7)1
MTB+
RIFS
3.7% (7)2 82.7% (344)
ND = non-determinate, + = positive, - = negative, R = resistant, S = susceptible 1 Sequencing detected a resistance-conferring mutation in 6/7 which would thus be classified as RIF-r. 2 Sequencing did not detect any mutations in 6/7.
Table 3.5. Ultra-RIF results for all samples with available phenotypic DST results
MGIT DST
Ultra RIF-r (n=187)
RIF-s (n=416)
MTB--/invalid
11.2% (21) 12.3% (51)
MTB+
RIFND
2.1% (4) 2.4% (10)
MTB+
RIFR
81.3% (152) 1.7% (7)1
MTB+
RIFS
5.4% (10)2 83.7% (348)
ND = non-determinate, + = positive, - = negative, R = resistant, S = susceptible 1 Sequencing detected a resistance-conferring mutation in 7/7 which would thus be classified as RIF-r. 2 Sequencing did not detect any mutations in 6/10.

29
The direct head-to-head comparison of performance for RIF-detection showed very similar performance of the two assays, with differences in sensitivity and specificity smaller than 1%. Table 3.6 and Figure 3.3 show non-inferior specificity of Ultra compared to Xpert. For sensitivity of RIF-resistance detection Ultra is likely at least as good as Xpert in detecting RIF-resistance however because the targeted sample size was not achieved (155 accrued vs. 195 planned), this cannot be stated with confidence. Had these additional 40 RIF-resistant patients been recruited and led to concordant results between Xpert and Ultra, the lower limit of the 95%CI for the difference in sensitivity would have been -2.9% , demonstrating non-inferiority. It is important to note that this is due to a single patient who was defined as RIF-resistant on phenotypic DST, and who tested RIF-resistant on Xpert but RIF-sensitive on Ultra. Sequencing results were available for all of the RIF-resistant samples that tested RIF-sensitive by either Xpert or Ultra or both (i.e., false-negative test results see Appendix C). In six of these, no mutation was found, three had a 531TTG mutation and one had a 513CCA mutation. Since the interpretation of the composite reference standard would not be different to that of the phenotypic DST based on these results, this would not change accuracy estimates or results of the NI analysis presented above. Sequencing results were also available for all RIF-sensitive samples that tested RIF-resistant by either Xpert or Ultra or both (i.e., false-positive test results, see Appendix C). In all cases sequencing showed a mutation associated with RIF-resistance (either minimal or moderate confidence of association with resistance). Specificity-estimates of both Xpert and Ultra would improve to >99% when reclassifying these seven patients according to the fact that these are known resistance-conferring mutations. The results from the non-inferiority analysis would not be affected by this. A complete line listing of discordants is available in Appendix C. Table 3.6. Non-inferiority analysis for RIF detection
Sensitivity (95%CI)
Specificity (95%CI)
Difference (Ultra – Xpert)
-0.6% (-3.6%, +1.8%)
+0.3% (-0.9%, +1.7%)
Ni-margin -3% -3%
Interpretation Not non-inferior Non-inferior

30
Figure 3.3. RIF non-inferiority analysis
A
B
The difference in sensitivity/specificity (∆ = Ultra – Xpert) is displayed as horizontal lines with the point representing the point estimate and whiskers representing the upper and lower limit of the 95%CIs of ∆. The black vertical dotted line indicates zero difference in sensitivity/specificity and the red vertical broken line indicates the non-inferiority margin. Panel A Shows the difference in sensitivity (detection of RIF-resistance). The lower limit of the 95%CI (-3.6%) lies below the non-inferiority margin of -3% (red broken line), thus non-inferiority of Ultra to Xpert was not shown. Panel B
Shows the difference in specificity (detection of RIF-susceptibility). The lower limit of the 95%CI (-0.9%%) lies above the non-inferiority margin of -3% (red broken line), demonstrating non-inferiority of Ultra to Xpert.
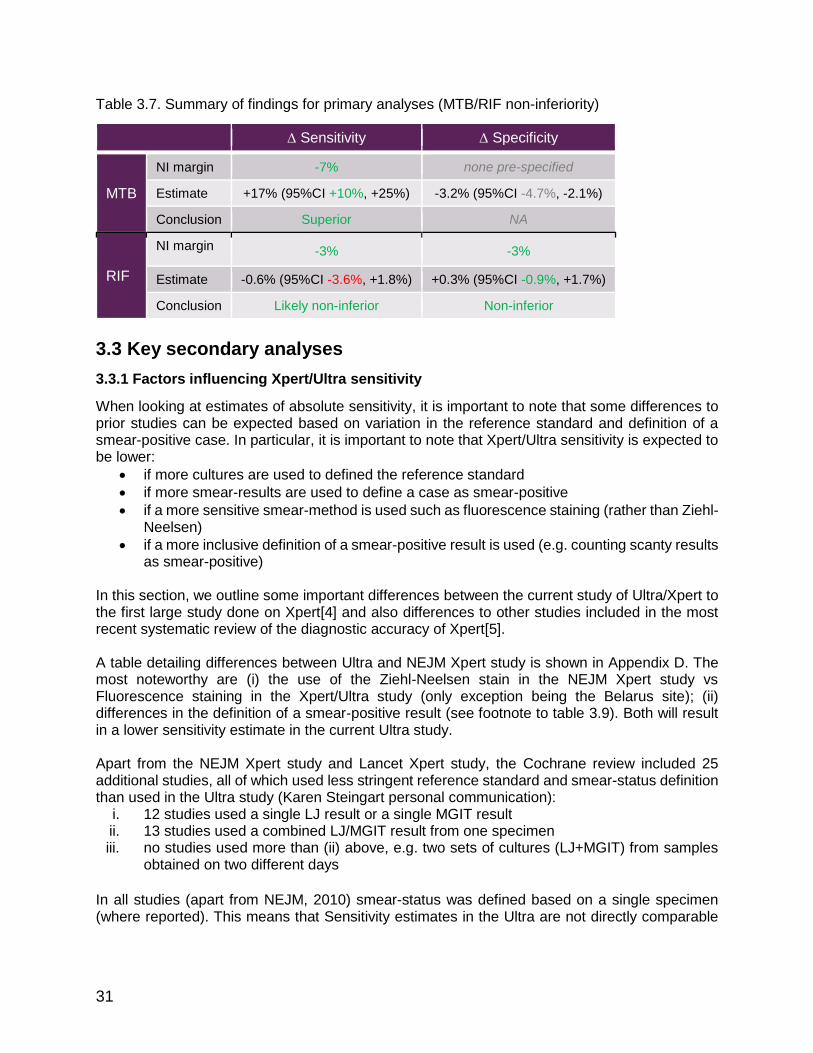
Summary of findings for primary analyses (MTB/RIF non-inferiority)
Table 3.7. Summarizes the results of the primary analyses. For MTB detection, Ultra shows improved sensitivity but reduced specificity. Performance for RIF detection is very similar, with non-inferiority met for specificity and missed by a small margin for sensitivity.
Non-inferiority analysis (Ultra vs Xpert)Denominator based on valid RIF-calls on both assays
39
Se
nsit
ivit
y (R
IF-r
)S
pe
cif
icit
y (R
IF-s
)
∆ Sensitivity = -0.6% (95%CI -3.6%, +1.8%) à sensitivity not non-inferior
∆ Specificity = +0.3% (95%CI -0.9%, +1.7%) à specificity non-inferior
●
NI−
ma
rgin
−4 −3 −2 −1 0 +1 +2 +3 +4
delta Specificity
Specificity for Rif
●
NI−
marg
in
−4 −3 −2 −1 0 +1 +2 +3 +4
delta Specificity
Specificity for Rif
●
NI−
ma
rgin
−4 −3 −2 −1 0 +1 +2 +3 +4
delta Specificity
Specificity for Rif
●
NI−
ma
rgin
−4 −3 −2 −1 0 +1 +2 +3 +4
delta Sensitivity
Sensitivity for Rif
●
NI−
marg
in
−4 −3 −2 −1 0 +1 +2 +3 +4
delta Sensitivity
Sensitivity for Rif
●
NI−
ma
rgin
−4 −3 −2 −1 0 +1 +2 +3 +4
delta Sensitivity
Sensitivity for RifCONFIDENTIAL
For the FNs: note that the only mutation detected in the single Xpert-RIF-r/Ultra-RIF-s result is a 513CCA mutation (silent mutation)
For the FPs: sequencing results available on 4/7, of which 1 is WT (the one that is Xpert-FP/Ultra-TN), 2x 511CCG, 1x 533CCG
à Specificity-estimates of both Xpert and Ultra would improve specificity-estimates of both assays by ~1%
à This confirms the improved specificity of Ultra (based on the single Xpert-FP/Ultra-TN) and would not change results of the NI analysis
31
Table 3.7. Summary of findings for primary analyses (MTB/RIF non-inferiority)
∆ Sensitivity ∆ Specificity
MTB
NI margin -7% none pre-specified
Estimate +17% (95%CI +10%, +25%) -3.2% (95%CI -4.7%, -2.1%)
Conclusion Superior NA
RIF
NI margin -3% -3%
Estimate -0.6% (95%CI -3.6%, +1.8%) +0.3% (95%CI -0.9%, +1.7%)
Conclusion Likely non-inferior Non-inferior
3.3 Key secondary analyses
3.3.1 Factors influencing Xpert/Ultra sensitivity
When looking at estimates of absolute sensitivity, it is important to note that some differences to prior studies can be expected based on variation in the reference standard and definition of a smear-positive case. In particular, it is important to note that Xpert/Ultra sensitivity is expected to be lower:
if more cultures are used to defined the reference standard
if more smear-results are used to define a case as smear-positive
if a more sensitive smear-method is used such as fluorescence staining (rather than Ziehl-Neelsen)
if a more inclusive definition of a smear-positive result is used (e.g. counting scanty results as smear-positive)
In this section, we outline some important differences between the current study of Ultra/Xpert to the first large study done on Xpert[4] and also differences to other studies included in the most recent systematic review of the diagnostic accuracy of Xpert[5]. A table detailing differences between Ultra and NEJM Xpert study is shown in Appendix D. The most noteworthy are (i) the use of the Ziehl-Neelsen stain in the NEJM Xpert study vs Fluorescence staining in the Xpert/Ultra study (only exception being the Belarus site); (ii) differences in the definition of a smear-positive result (see footnote to table 3.9). Both will result in a lower sensitivity estimate in the current Ultra study. Apart from the NEJM Xpert study and Lancet Xpert study, the Cochrane review included 25 additional studies, all of which used less stringent reference standard and smear-status definition than used in the Ultra study (Karen Steingart personal communication):
i. 12 studies used a single LJ result or a single MGIT result ii. 13 studies used a combined LJ/MGIT result from one specimen iii. no studies used more than (ii) above, e.g. two sets of cultures (LJ+MGIT) from samples
obtained on two different days
In all studies (apart from NEJM, 2010) smear-status was defined based on a single specimen (where reported). This means that Sensitivity estimates in the Ultra are not directly comparable

32
to those of prior studies of the Xpert assay and are expected to be substantially lower in Ultra study. Additional data on reasons for differences in sensitivity are shown in Appendix E. 3.3.2 MTB accuracy
Estimates for the sensitivity and specificity of Xpert and Ultra for MTB detection are shown in Table 3.8. Sensitivity in smear-negative/culture-positive TB was estimated to be 44.5% for Xpert vs. 61.3% for Ultra (reflecting the difference in sensitivity of +17% shown in the non-inferiority analysis). Sensitivity in HIV-negative individuals was similar (89% vs 91%), whereas Ultra clearly had substantially higher sensitivity in HIV-positive individuals (76% vs 88%; difference=12%, 95%CI +4.9%, +21%) independent of smear status. Specificity was estimated to be 98% and 95% for Xpert and Ultra respectively (reflecting the difference in sensitivity of -3% shown in the non-inferiority analysis). Table 3.8. Sensitivity and specificity of Xpert and Ultra for MTB detection
Sensitivity (95%CI) Specificity (95%CI) Pooled
Smear-negative
HIV- HIV+
Xpert 82.9%
(78.8, 86.4) 44.5%
(35.4, 53.9) 89.3%
(83.1, 93.7) 75.5%
(65.8, 83.6) 98%
(96.8, 98.8)
Ultra 87.8%
(84.2, 90.9) 61.3%
(52, 70.1) 90.6%
(84.7, 94.8) 87.8%
(79.6, 93.5) 94.8%
(93, 96.2)
The estimates of Xpert sensitivity were lower than those previously reported. To gauge what effect the differences in case definition (described in the previous section) would have on sensitivity estimates, we re-analysed the data applying case definitions relating to the NEJM study and those used in other Xpert studies included in the Cochrane review. The results of this analysis are shown in Table 3.9 but essentially show that:
• Sensitivity estimates increase by ~10-20% with less rigorous reference standard • Sensitivity estimates increase by ~10% with changing smear definition • These effects appear to be independent/additive, such that together the change is ~20-
30%

33
Table 3.9. Variation of estimates for sensitivity to detect smear-negative/culture-positive TB in the
Ultra study depending on the definition of the reference standard and smear-result
Definition of reference standard
2 MGIT + 2 LJ
1 MGIT + 1 LJ
1 MGIT
Xpert
45% 61% 62% 3 smears
1
Definition of smear-result
50% 66% 68% 3 smears
2
58% 73% 75% 1 smear
3
Ultra
61% 76% 76% 3 smears
1
65% 80% 80% 3 smears
2
71% 84% 85% 1 smear
3
The cells highlighted in pink represent the estimates of the current study. 1 Spot, spot, morning 2 Smear-definition based on NEJM paper: SSM+ if at least 1 of 3 smears, at least 1+ or at least 2 smears scanty 3 S1, i.e. same sample Notes: 77% had ≥4 valid culture results; 85% had valid culture results from samples collected on two different days; 4% had an additional MGIT and LJ on S4; Xpert and Ultra results are from S1, single MGIT result is from S2; Xpert specificity was 98% for all definitions; Ultra specificity was 95% when using two MGITs and two LJs and 94% when using only one MGIT culture
Additional data on Ultra-FP patients There were 44 false-positive results for Ultra detection of MTB (see Appendix H). Sequencing of amplicons removed from the Ultra cartridge was done (without prior target-specific amplification or capture) in 19 of the 44 false-positives. The sequencing reaction failed in one case. In 16 out of the 18 with valid results, sequencing confirmed that the DNA amplified originated from MTBC (i.e. false-positives were not a result of cross-reactivity with NTMs or other species or a result of a similar assay failure). In one of the remaining two cases, sequencing was done using NGS, showing no evidence of DNA from MTBC, thus suggesting that this was a “real false-positive” call by the assay. This false-positive had a very late CT-value on one probe and an analysis will be done with the manufacturer to explore if a minor adjustment of the CT cut-point in a future version of the assay could overcome this issue, while not compromising on sensitivity. In the other remaining case, the IS6110/1081 probe provided a clear signal on Ultra. Pyrosequencing was done and IS6110 sequences were not detected. However, since (i) primers aiming for IS1081 were not used in the Pyrosequencing reaction, and (ii) strains not containing IS6110 but IS1081 are not uncommon in India, this result does not provide conclusive evidence of either the presence or absence of MTBC DNA in the original patient specimen. Among the 44 false-positives, 16 were also positive by Xpert. Of the remaining 28 patients, seven had chest X-ray results suggestive of TB but only two had a final diagnosis of TB assigned and were started on TB treatment. Of the 26 patients not Xpert-positive and not started on therapy, follow-up information on symptoms at approximately two months was available for 19: symptoms had either completely resolved (9), improved (9) or stayed the same (1).

34
3.3.3 RIF accuracy
Estimates for the sensitivity and specificity of Xpert and Ultra for RIF detection were similar to one another and to estimates from the Xpert Cochrane review (Table 3.10). Sensitivity for detection of RIF-resistance was estimated to be 95.5% for Xpert and 94.8% for Ultra; specificity for detection of RIF-resistance was estimated to be 97.9% for Xpert and 98.2% for Ultra. Reclassifying Xpert/Ultra-RIF-FPs (i.e., RIF-resistant by Xpert/Ultra but RIF-sensitive by culture) based on sequencing data, leads to improved specificity estimates of >99% for both assays (Table 3.10). For more details on the sequencing results refer to results section 1.2 and for a complete line listing of discordant results to Appendix C. Table 3.10. Sensitivity and specificity of Xpert and Ultra for RIF detection
Phenotypic DST Phenotypic DST with discordant
resolution by sequencing*
Sensitivity (95%CI) Specificity (95%CI)
Sensitivity (95%CI) Specificity (95%CI)
Xpert 95.5%
(90.9, 98.2) 97.9%
(95.7, 99.1) 95.5%
(90.9, 98.2) 99.4%
(97.8, 99.9)
Ultra 94.8%
(90.1, 97.7)
98.2% (96.1, 99.3)
94.4% (89.6, 97.4)
99.7% (98.3, 100.0)
*For the FPs: sequencing results were available for all seven cases, of which two had a 526AAC mutation, two had a 511CCG mutation, two had a 533CCG mutation, and one had a 526TGC mutation. See Appendix C
3.3.4 Effect of TB history on specificity for MTB detection
There has been some evidence in prior studies that Xpert can give false-positive results in patients with a prior history of TB[26,27]. This is also biologically plausible since standard molecular approaches to diagnosis do not differentiate between replicating/alive and non-replicating/dead bacilli. While Xpert and Ultra presumably should do better than standard molecular tests as a filter step is supposed to capture only whole cells, the method is not is not entirely perfect. Therefore, the effect of TB history on the specificity of Xpert and Ultra was investigated. Table 3.11 shows how specificity varies between patients with and without a history of prior treatment for TB. Specificity of both Xpert and Ultra is affected by history, though the effect appears to be greater for Ultra than for Xpert (difference in specificity between patients with vs without history is 4.4% and 1.5% respectively). This is to be expected as the substantially higher sensitivity of Ultra will also detect minimal amounts of dead bacilli. The difference in specificity between the assays is thus greater among patients with a history of TB (5.4%) than in patients without a history (2.4%).

35
Table 3.11. Specificity overall and by treatment history status
Analysis group (Culture- neg. cases)
Xpert Specificity (95%CI)
Ultra Specificity (95%CI)
Delta Specificity (95%CI)
Pooled (840) 98.0% (96.8, 98.8) 94.8% (93.0, 96.2) -3.2% (-2.1%, -4.7%)
No History of TB (615) 98.4% (97.0, 99.2) 95.9% (94.1, 97.4) -2.4% (-4.0%, -1.3%)
Any history of TB (224) 96.9% (93.7, 98.7) 91.5% (87.1, 94.8) -5.4% (-9.1%, -3.1%)
Figure 3.4 shows a more detailed breakdown of specificity as a function of time since treatment completion (i.e. specificity depending on how recent the prior episode of TB was). The figure demonstrates that:
The drop in specificity is greatest for patients with a recent history
Specificity of Ultra is affected more than specificity of Xpert
For Xpert, specificity is similar to that in patients without a history if the prior episode dates back ~4 years or more, whereas this appears to take longer for Ultra (~6 years)
Figure 3.4. Specificity among patients with a history of TB as a function of time since treatment
completion
Diamonds do not relate to the x-axis: Diamonds on the left show specificity for the tests in patients without reported TB history; diamonds in the centre show average specificity for the tests in all patients; diamonds on the right show average specificity for the tests in patients with any reported TB history. Lines are running-line least squares (mean) smoothers using a bandwidth of 0.8 (Cleveland, JASA, 1979). Appendix F shows the same figure including the actual data points of the Ultra assay; this is to show that there was a reasonable amount of data to inform this analysis. There were cases with a TB history dating back more than 10 years but data were very sparse beyond this time point and were therefore excluded from this figure to avoid over-extrapolating.

36
3.3.5 Analyses reclassifying ‘trace’ call
We conducted additional analyses to assess whether some of these reductions in the specificity of Ultra can be mitigated by utilising the information in the semi-quantitative results available. This post-hoc analysis appeared plausible because the analysis of specificity by TB history suggested that the Ultra assay picks up minute amounts of TB DNA from non-replicating or dead bacilli still present in the lung from a prior TB episode. By ignoring MTB-calls for cases with only very little TB DNA detected, specificity could potentially be improved. Naturally, one would expect this also to reduce sensitivity. As outlined in the background section, the Ultra assay has an additional semi-quantitative category below the lower end of the spectrum currently captured with Xpert. That is to say that samples that are even more paucibacillary than those in the current ‘very low’ category of Xpert, and that are captured by Ultra are classified as ‘trace’. The analysis in this section shows how accuracy estimates change when handling this trace call differently. We considered three different options for handling trace-call and Table 3.12 shows the accuracy for these three options: a) Ultra ‘with trace’ (i.e., results as shown so far) b) Ultra ‘no trace’ (i.e., reclassifying all ‘trace’ patients as TB-negative) c) Ultra ‘conditional trace’ (reclassifying ‘trace’ patients as TB-negative conditional on TB history
status), meaning o In patients without TB history: interpret trace call as TB-positive o In patients with TB history: interpret trace call as TB-negative
Table 3.12. Sensitivity and specificity (and difference to Xpert) for MTB detection, depending on
the usage of the trace-call
TB History
Parameter1 Xpert Ultra
with trace
Ultra ‘no
trace’ 2
Ultra ‘cond.
trace’ 3
Delta with trace
Delta ‘no
trace’ 2
Delta ‘cond.
trace’ 3
Pooled
Sens. S+/- (n=403)
82.9% 87.8% 85.1% 87.3% +4.9 +2.2 +4.4%
Sens. S- (n=119)
44.5% 61.3% 52.1% 59.7% +16.8% +7.6% +15%
Spec. (n=840)
98.0% 94.8% 97.0% 96.1% -3.2% -1.0% -1.9%
No TB history
Spec. (n=615)
98.4% 95.9% 97.2% 95.9% -2.5% -1.1% -2.4%
Any TB history
Spec. (n=224)
96.9% 91.5% 96.4% 96.4% -5.4% -0.4% -0.4%
1 Sensitivity varies little by TB history and not systematically and is thus not shown stratified on history; Specificity does
not vary between Smear-negative patients and Smear-positive patients and is thus not shown stratified by smear-status 2 Trace-calls reclassified as MTB-negative
3 Trace-calls reclassified as MTB-negative for patients with TB history only
Note: Data on history was missing for two patients
As expected, not using the trace-call (or only using it in patients without history) results in higher specificity but lower sensitivity. While specificity is still lower than that of Xpert, the difference is markedly smaller, especially among patients with a history of TB. The sensitivity increases seen

37
when ‘with trace’ (17%) are reduced when using ‘no trace’ (8%) or ‘conditional trace’ (15%); nevertheless, the sensitivity of Ultra, even with ‘no trace’ is still higher than that of Xpert (Figure 3.5). At the same time, while the specificity is markedly improved, it is still lower than Xpert. The reasons for the persistent reduced specificity could be due to imperfect confirmation of TB history or due to Ultra picking up paucibacillary cross-contamination with TB that Xpert does not detect (see section on root cause analysis for false-positive results). False amplification of targets is unlikely as sequencing from the cartridges in false-positives confirmed MTB in almost all cases (17 out of 19 with valid results). Figure 3.5. MTB non-inferiority analysis (Ultra without trace)
A
B
The difference in sensitivity/specificity (∆ = Ultra – Xpert) is displayed as horizontal lines with the point representing the point estimate and whiskers representing the upper and lower limit of the 95%CIs of ∆. The black vertical dotted line indicates zero difference in sensitivity/specificity and the red vertical broken line indicates the non-inferiority margin. Panel A Shows the difference in sensitivity in smear-negative/culture-positive TB. The lower limit of the 95%CI (+0.4%)
lies above the non-inferiority margin of -7% (red broken line), demonstrating non-inferiority of Ultra to Xpert; the lower limit of the 95%CI also lies above 0% (the point of no difference, black broken line), thus also showing superiority of Ultra sensitivity over Xpert. Panel B Shows the difference in specificity. A non-inferiority margin had not been pre-
specified for specificity, so an assessment of non-inferiority could not be done (and no non-inferiority margin is shown in this plot). However, the upper limit of the 95%CI lies below 0% (the point of no difference, black broken line), suggesting that specificity of Ultra was inferior to that of Xpert.
Figure 3.6 shows a more detailed breakdown of specificity as a function of time since treatment completion (i.e., specificity depending on how recent the prior episode of TB was). It shows the same pattern as the previous figure but also shows that among patients with a history of TB Ultra reclassifying the trace-call as TB-negative in all patients or only in those with TB history (conditional trace) gives very similar specificity results to Xpert.
MTB Non-inferiority analysisUltra without trace
63
Se
ns.
(po
ole
d)
Se
ns.
(S-C
+)
Sp
ecif
icit
y
∆ Sensitivity = +7.6% (95%CI +0.4%, +15%) à Sensitivity superior
∆ Specificity = -1.0% (95%CI -2.0%, -1.7%) à Specificity inferior
∆ Sensitivity = +2.2% (95%CI +0.01%, +4.8%)
CONFIDENTIAL
One Ultra-”FP”/Xpert-”TN” patient had a non-study culture+ result (from a specimen collected 1 month post-enrolment; all study cultures were negative)
●
NI−
ma
rgin
−8 −4 0 +4 +8 +12 +16 +20 +24 +28
delta Sensitivity
Sensitivity for S−C+ TB
●
NI−
ma
rgin
−8 −4 0 +4 +8 +12 +16 +20 +24 +28
delta Sensitivity
Sensitivity for S−C+ TB
●
NI−
ma
rgin
−8 −4 0 +4 +8 +12 +16 +20 +24 +28
delta Sensitivity
Sensitivity for S−C+ TB
●
−6 −5 −4 −3 −2 −1 0 +1 +2
delta Specificity
Specificity for TB
●
−6 −5 −4 −3 −2 −1 0 +1 +2
delta Specificity
Specificity for TB
●
−6 −5 −4 −3 −2 −1 0 +1 +2
delta Specificity
Specificity for TB

38
Figure 3.6. Specificity among patients with a history of TB as a function of time since treatment
completion
Diamonds do not relate to the x-axis: Diamonds on the left show specificity for the tests in patients without reported TB history; diamonds in the centre show average specificity for the tests in all patients; diamonds on the right show average specificity for the tests in patients with any reported TB history. Lines are running-line least squares (mean) smoothers using a bandwidth of 0.8 (Cleveland, JASA, 1979).
3.3.6 Analyses of re-testing patients with ‘trace’ call on first sample
We conducted an additional post-hoc analysis to those in section 3.3.5 to assess the effect of re-testing patients, who tested ‘trace’ on the initial sample (S1). For these analyses, we used results from S2 (see sample flow in Figure 2.2, Section 2.2) among the patients testing ‘trace’ on the initial sample (S1). The results are based on retesting of 26 patients with ‘trace’ results on S1 (30 total but only 26 with valid Ultra result for sample S2). We explored how overall Ultra accuracy estimates would change based on the results and interpretation of the Ultra results of S2. We considered two options for the interpretation:
Option 1: Patients considered MTB-negative if result on S2 is negative – i.e., patients testing trace twice in a row are still called MTB-positive
Option 2: Patients considered MTB-negative if result on S2 is negative or trace – i.e., patients testing trace twice in a row are also called MTB-negative
Based on ‘Option 1’, 12 of the 26 patients that tested trace on S1 would be re-classified as “not MTB”, as their result on S2 was negative on Ultra. Of these twelve, ten were culture-negative and two were culture-positive.
Based on ‘Option 2’ the same twelve patients would be re-classified as “not MTB” and an additional nine patients in whom the repeat-test on S2 also yielded a trace-call. Of these nine, six were culture-negative and three were culture-positive.
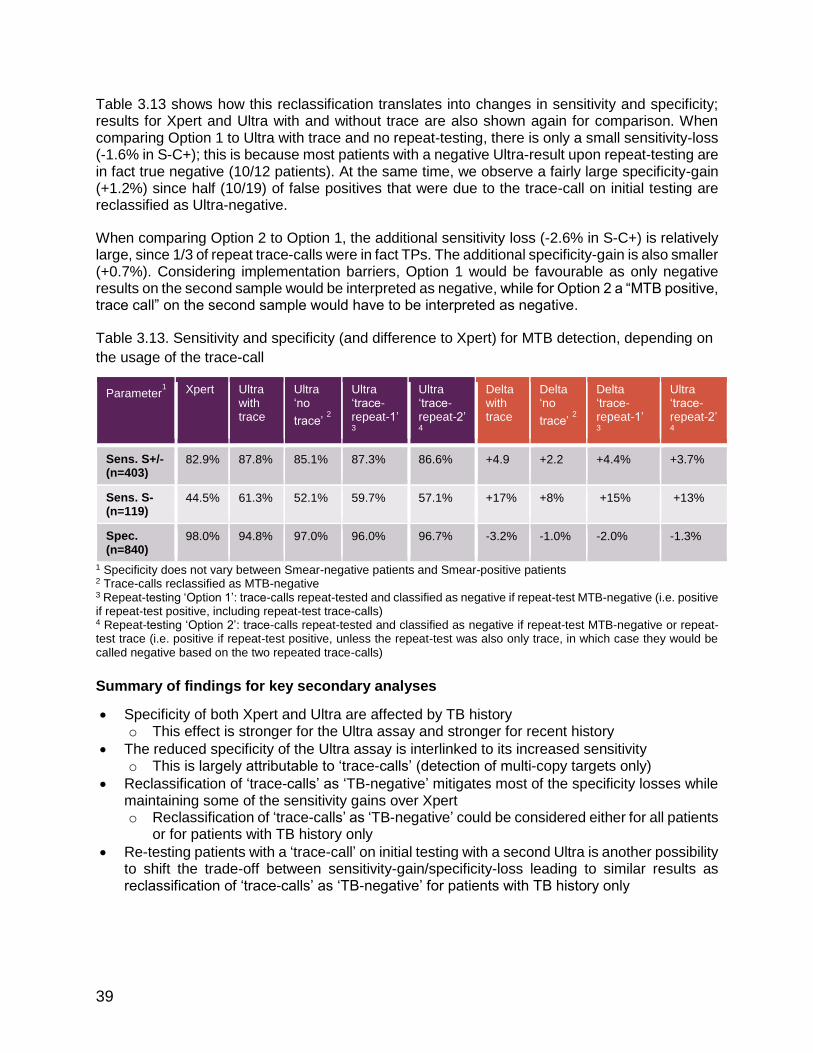
39
Table 3.13 shows how this reclassification translates into changes in sensitivity and specificity; results for Xpert and Ultra with and without trace are also shown again for comparison. When comparing Option 1 to Ultra with trace and no repeat-testing, there is only a small sensitivity-loss (-1.6% in S-C+); this is because most patients with a negative Ultra-result upon repeat-testing are in fact true negative (10/12 patients). At the same time, we observe a fairly large specificity-gain (+1.2%) since half (10/19) of false positives that were due to the trace-call on initial testing are reclassified as Ultra-negative.
When comparing Option 2 to Option 1, the additional sensitivity loss (-2.6% in S-C+) is relatively large, since 1/3 of repeat trace-calls were in fact TPs. The additional specificity-gain is also smaller (+0.7%). Considering implementation barriers, Option 1 would be favourable as only negative results on the second sample would be interpreted as negative, while for Option 2 a “MTB positive, trace call” on the second sample would have to be interpreted as negative.
Table 3.13. Sensitivity and specificity (and difference to Xpert) for MTB detection, depending on
the usage of the trace-call
Parameter1 Xpert Ultra
with trace
Ultra ‘no
trace’ 2
Ultra ‘trace-repeat-1’ 3
Ultra ‘trace-repeat-2’ 4
Delta with trace
Delta ‘no
trace’ 2
Delta ‘trace-repeat-1’ 3
Ultra ‘trace-repeat-2’ 4
Sens. S+/- (n=403)
82.9% 87.8% 85.1% 87.3% 86.6% +4.9 +2.2 +4.4% +3.7%
Sens. S- (n=119)
44.5% 61.3% 52.1% 59.7% 57.1% +17% +8% +15% +13%
Spec. (n=840)
98.0% 94.8% 97.0% 96.0% 96.7% -3.2% -1.0% -2.0% -1.3%
1 Specificity does not vary between Smear-negative patients and Smear-positive patients 2 Trace-calls reclassified as MTB-negative 3 Repeat-testing ‘Option 1’: trace-calls repeat-tested and classified as negative if repeat-test MTB-negative (i.e. positive if repeat-test positive, including repeat-test trace-calls) 4 Repeat-testing ‘Option 2’: trace-calls repeat-tested and classified as negative if repeat-test MTB-negative or repeat-test trace (i.e. positive if repeat-test positive, unless the repeat-test was also only trace, in which case they would be called negative based on the two repeated trace-calls)
Summary of findings for key secondary analyses
Specificity of both Xpert and Ultra are affected by TB history o This effect is stronger for the Ultra assay and stronger for recent history
The reduced specificity of the Ultra assay is interlinked to its increased sensitivity o This is largely attributable to ‘trace-calls’ (detection of multi-copy targets only)
Reclassification of ‘trace-calls’ as ‘TB-negative’ mitigates most of the specificity losses while maintaining some of the sensitivity gains over Xpert o Reclassification of ‘trace-calls’ as ‘TB-negative’ could be considered either for all patients
or for patients with TB history only
Re-testing patients with a ‘trace-call’ on initial testing with a second Ultra is another possibility to shift the trade-off between sensitivity-gain/specificity-loss leading to similar results as reclassification of ‘trace-calls’ as ‘TB-negative’ for patients with TB history only

40
3.4 Data on CE-mark, extra-pulmonary TB, elimination in non-HBDC &
paediatric cases
3.4.1 CE-mark data
Data provided by Cepheid PI: Pamela Johnson Team: David Persing, Bob Kwiatkowski, Marie Simmons, Scott Campbell Methods: The performance characteristics of the Ultra Assay were evaluated for the detection of MTB-complex DNA and for the detection of RIF-resistance associated mutations in sputum specimens relative to results from culture (solid and/or liquid media) and drug susceptibility testing (DST), respectively. This multi-center study used prospective and archived direct (raw) sputum or concentrated sediment specimens collected from subjects 18 years or older. Subjects included pulmonary TB suspects on no TB treatment or less than three days of treatment within six months of the study start (TB suspects) as well as previously TB treated subjects who were suspected of multi-drug resistant TB (MDR TB suspects). The sensitivity and specificity of the Ultra assay for MTB detection were evaluated using data from only the TB suspects; whereas the data from the MDR TB suspects were combined to evaluate the performance of RIF-resistance. The study was conducted at sites worldwide: (i) within the main study in Belarus, Brazil, China, Georgia, India, Kenya, South Africa, Uganda; and separately from the main study in (ii) Vietnam, Peru (from archived samples, testing done in Italy); and (iii) testing on archived and prospective samples in Germany, Italy and the United States. Up to three sputum specimens were collected from each study subject for use in the clinical study. For prospective specimens collected and tested in the main study, the first sputum specimen was tested by the Ultra and the second two specimens were used for TB culture. For archived specimens, culture results were available from the standard of care method and Ultra was performed using the first specimen with sufficient volume. The acid fast bacilli (AFB) smear status for a subject was determined by auramine-O (AO) fluorescent and for a small subset Ziehl-Nielson (ZN) smear stain from the specimen with the corresponding Ultra result. The MTB culture status for all subjects was defined based on the MTB culture result of all specimens collected within a seven day period for that subject. If the Ultra result was non-determinate (ERROR, INVALID or NO RESULT), the specimen was retested if there was sufficient volume.
Results:
a. Ultra non-determinate (ND) rate: A total of 1854 eligible specimens were tested by the Ultra (2767 identified specimens minus 325 with contaminated or incomplete culture, 160 with improper storage prior to Xpert testing, 87 tested with an invalid Xpert lot, 12 subjects previously treated for TB, 6 subjects <18 years of age, 3 duplicates, and 2 non-TB suspects, 6 Xpert not done, 310 subjects in the MDR group, and 2 subjects with no group assigned). Ultra assays for 96.6% (1791/1854) of specimens were successful on the first attempt (initial ND rate = 3.4%). Forty-four of the 63 non-determinate cases were retested, all of which yielded valid results upon repeat testing; 19 specimens were not retested. The overall rate of assay success was 99.2% (1835/1854). The overall non-determinate rate was 1.0% (19/1854; 95%CI: 0.7, 1.6).
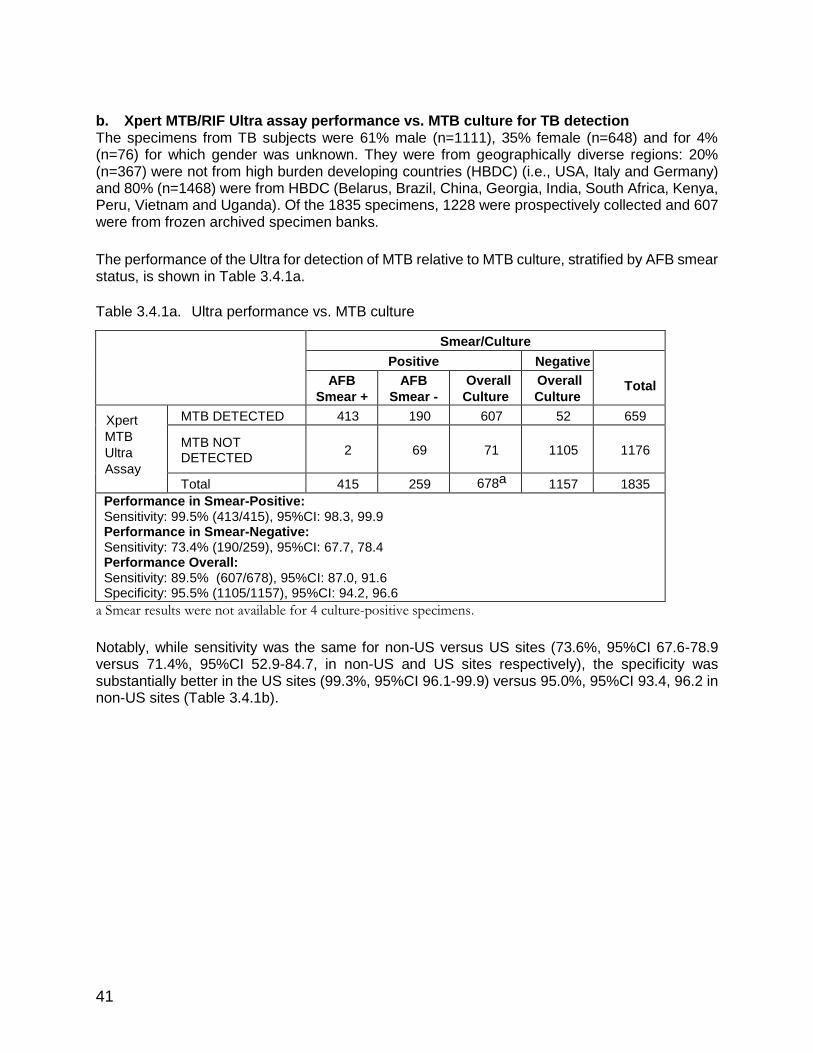
41
b. Xpert MTB/RIF Ultra assay performance vs. MTB culture for TB detection The specimens from TB subjects were 61% male (n=1111), 35% female (n=648) and for 4% (n=76) for which gender was unknown. They were from geographically diverse regions: 20% (n=367) were not from high burden developing countries (HBDC) (i.e., USA, Italy and Germany) and 80% (n=1468) were from HBDC (Belarus, Brazil, China, Georgia, India, South Africa, Kenya, Peru, Vietnam and Uganda). Of the 1835 specimens, 1228 were prospectively collected and 607 were from frozen archived specimen banks.
The performance of the Ultra for detection of MTB relative to MTB culture, stratified by AFB smear status, is shown in Table 3.4.1a.
Table 3.4.1a. Ultra performance vs. MTB culture
Smear/Culture
Positive Negative
Total AFB
Smear +
AFB
Smear -
Overall
Culture
+
Overall
Culture
- Xpert
MTB
Ultra
Assay
MTB DETECTED 413 190 607 52 659
MTB NOT DETECTED
2 69 71 1105 1176
Total 415 259 678a 1157 1835
Performance in Smear-Positive: Sensitivity: 99.5% (413/415), 95%CI: 98.3, 99.9 Performance in Smear-Negative: Sensitivity: 73.4% (190/259), 95%CI: 67.7, 78.4 Performance Overall: Sensitivity: 89.5% (607/678), 95%CI: 87.0, 91.6 Specificity: 95.5% (1105/1157), 95%CI: 94.2, 96.6
a Smear results were not available for 4 culture-positive specimens.
Notably, while sensitivity was the same for non-US versus US sites (73.6%, 95%CI 67.6-78.9 versus 71.4%, 95%CI 52.9-84.7, in non-US and US sites respectively), the specificity was substantially better in the US sites (99.3%, 95%CI 96.1-99.9) versus 95.0%, 95%CI 93.4, 96.2 in non-US sites (Table 3.4.1b).

42
Table 3.4.1b. Ultra performance vs. MTB culture in US vs non-US sites
c. Ultra performance vs. culture by specimen type The performance of the Ultra for detection of MTB was determined relative to MTB culture in unprocessed sputum and concentrated sputum sediment specimens. Results are shown in Table 3.4.1c. Among 1835 specimens, there were 1393 unprocessed sputum specimens and 442 concentrated sputum sediment specimens. Note: This analysis was conducted using the same specimens used in the sensitivity and specificity analysis for MTB detection (i.e., prospective fresh (sputum 1 only from main study) and all of the archived specimens). It does not include the second or third specimen (sediment and direct specimens, respectively) from the prospective study.
Table 3.4.1c. Ultra vs MTB Culture by Specimen Type
Direct Sputum Sputum Sediments
N % (95%CI) N % (95%CI)
Sensitivity
Smear-Positive 310/311
99.7%
(98.2,99.9) 103/104
99.0%
(94.8, 99.8)
Sensitivity
Smear-Negative 158/215
73.5%
(67.2, 78.9) 32/44
72.7%
(58.2, 83.7)
Overall Sensitivitya
472/530 89.1%
(86.1, 91.4) 135/148
91.2%
(85.6, 94.8)
Overall
Specificity 820/863
95.0%
(93.4, 96.3) 283/294
96.9%
(94.3, 98.4)
a Smear results were not available for 4 culture-positive specimens.
d. Ultra performance vs. drug susceptibility testing for RIF MTB positive culture isolates were tested for drug susceptibility (DST) to rifampicin using the agar proportion method with Middlebrook or Lowenstein-Jensen media, the Thermo Scientific Sensititre™ Mycobacterium tuberculosis MIC Plate or the BD BACTECTM MGIT TM 960 SIRE assay. The performance of the Ultra for detection of RIF-resistance associated mutations was
determined relative to the DST results of the MTB culture isolates. Results for the detection of RIF-resistance associated mutations are reported by the Ultra only when the rpoB gene sequence of MTB-complex was detected by the device. The performance of RIF susceptibility/resistance are reported in Table 3.4.1d. Specimens with DST not done, MTB NOT DETECTED and MTB DETECTED; RIF-RESISTANCE INDETERMINATE were excluded
Non-US US
N % (95%CI) N % (95%CI) Sensitivity S+ 367/369 99.5%
(98.0, 99.9) 46/46 100% (92.3, 100)
Sensitivity S- 170/231 73.6%
(67.6,78.9) 20/28 71.4% (52.9, 84.7)
Overall Sens 541/604 89.6%
(86.9,91.8) 66/74 89.2% (80.1, 94.4)
Overall Spec 963/1014 95.0%
(93.4, 96.2) 142/143 99.3% (96.1, 99.9)
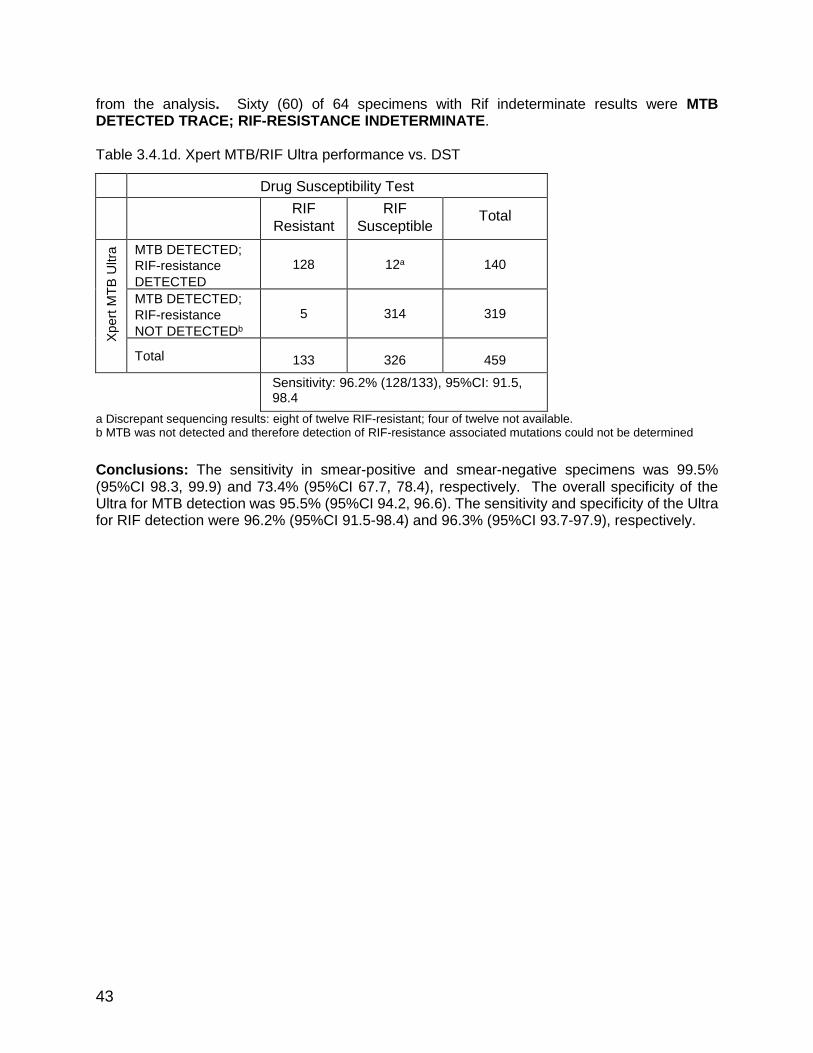
43
from the analysis. Sixty (60) of 64 specimens with Rif indeterminate results were MTB DETECTED TRACE; RIF-RESISTANCE INDETERMINATE. Table 3.4.1d. Xpert MTB/RIF Ultra performance vs. DST
Drug Susceptibility Test
RIF
Resistant
RIF
Susceptible Total
Xpert
MT
B U
ltra
MTB DETECTED;
RIF-resistance
DETECTED
128 12a 140
MTB DETECTED;
RIF-resistance
NOT DETECTEDb
5 314 319
Total 133 326 459
Sensitivity: 96.2% (128/133), 95%CI: 91.5, 98.4
Specificity: 96.3% (314/326), 95%CI: 93.7, 97.9
a Discrepant sequencing results: eight of twelve RIF-resistant; four of twelve not available. b MTB was not detected and therefore detection of RIF-resistance associated mutations could not be determined
Conclusions: The sensitivity in smear-positive and smear-negative specimens was 99.5% (95%CI 98.3, 99.9) and 73.4% (95%CI 67.7, 78.4), respectively. The overall specificity of the Ultra for MTB detection was 95.5% (95%CI 94.2, 96.6). The sensitivity and specificity of the Ultra for RIF detection were 96.2% (95%CI 91.5-98.4) and 96.3% (95%CI 93.7-97.9), respectively.

44
3.4.2 Extra-pulmonary
TB meningitis (TBM) study in Uganda PI: David Boulware Team: Nathan Bahr, Edwin Nuwagira, Phillip Bystrom, Emily Evans, Fiona Cresswell, Ananta Bangdiwala, David Meya, Conrad Muzoora, on behalf of the ASTRO Team, Uganda.
Background: TB meningitis remains notoriously difficult to diagnose. The World Health Organization recommends Xpert MTB/RIF (Xpert) as the initial TB meningitis diagnostic. However, sensitivity of culture (~60%) and Xpert (~50-70%) are inadequate. On this basis the diagnostic performance of the second-generation Xpert MTB/RIF Ultra (Ultra) was evaluated. Methods: From March 2015 through November 2016, 129 HIV-infected adults with meningitis were prospectively evaluated for TB in Mbarara, Uganda. We centrifuged CSF, re-suspended the pellet in 2mL of CSF, and tested with Mycobacteria growth indicator tube culture 0.5mL, Xpert MTB/RIG 1mL, and cryopreserved 0.5mL, which was later tested using Xpert MTB/RIF Ultra. Diagnostic performance was measured against a composite reference standard of any positive CSF TB test (“definite TB”) and the consensus clinical case definition. Results: Definite TB meningitis was detected in 17% (22/129). Ultra had higher sensitivity of 95% (21/22) than either Xpert 45% (10/22; P<0.001) or culture 45% (10/22, P=0.003) for definite TB meningitis. Six participants (27%) were positive by all three modalities. Of twenty-one participants positive by Ultra, thirteen were positive by culture and/or Xpert, and eight were only Ultra positive. Of those eight, four would have been categorized as probable and three as possible TB meningitis if Ultra were not included as constituting definite TB. Testing >6mL of CSF more frequently yielded TB (25% (18/72)) than testing <6mL (7% (3/43); P=0.023) (Figure 3.4.2). Of the twenty samples positive by Ultra, nine (45%) were ‘trace’, seven (33%) were ‘very low’, and five (25%) were ‘low.’ Of the nine samples categorized as ‘trace’ by Ultra, only one (11%) was positive by Xpert and only two by culture (22%). Of the six categorized as ‘very low’ by Ultra, three (50%) were positive by Xpert and two (33%) were positive by culture. Of the five samples categorized as ‘low’ by Ultra, five (100%) were positive by Xpert and four (80%) were positive by culture. Of the eight samples that were positive only by Ultra, six were ‘trace’ and two were ‘very low.’ Figure 3.4.2a. Venn diagram of overlap in TB meningitis diagnostics
Conclusions: Ultra detected significantly more TB meningitis than either first-generation Xpert or culture. Adequate CSF testing volume is critical.
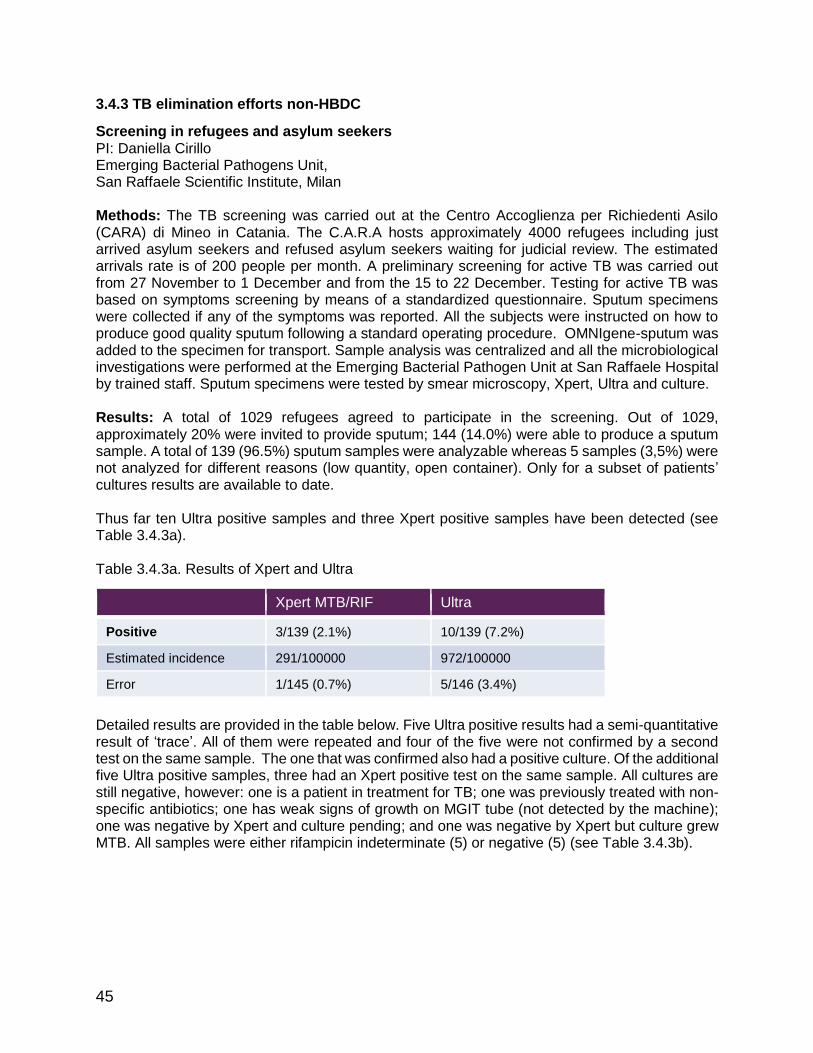
45
3.4.3 TB elimination efforts non-HBDC
Screening in refugees and asylum seekers PI: Daniella Cirillo Emerging Bacterial Pathogens Unit, San Raffaele Scientific Institute, Milan Methods: The TB screening was carried out at the Centro Accoglienza per Richiedenti Asilo (CARA) di Mineo in Catania. The C.A.R.A hosts approximately 4000 refugees including just arrived asylum seekers and refused asylum seekers waiting for judicial review. The estimated arrivals rate is of 200 people per month. A preliminary screening for active TB was carried out from 27 November to 1 December and from the 15 to 22 December. Testing for active TB was based on symptoms screening by means of a standardized questionnaire. Sputum specimens were collected if any of the symptoms was reported. All the subjects were instructed on how to produce good quality sputum following a standard operating procedure. OMNIgene-sputum was added to the specimen for transport. Sample analysis was centralized and all the microbiological investigations were performed at the Emerging Bacterial Pathogen Unit at San Raffaele Hospital by trained staff. Sputum specimens were tested by smear microscopy, Xpert, Ultra and culture. Results: A total of 1029 refugees agreed to participate in the screening. Out of 1029, approximately 20% were invited to provide sputum; 144 (14.0%) were able to produce a sputum sample. A total of 139 (96.5%) sputum samples were analyzable whereas 5 samples (3,5%) were not analyzed for different reasons (low quantity, open container). Only for a subset of patients’ cultures results are available to date. Thus far ten Ultra positive samples and three Xpert positive samples have been detected (see Table 3.4.3a). Table 3.4.3a. Results of Xpert and Ultra
Xpert MTB/RIF Ultra
Positive 3/139 (2.1%) 10/139 (7.2%)
Estimated incidence 291/100000 972/100000
Error 1/145 (0.7%) 5/146 (3.4%)
Detailed results are provided in the table below. Five Ultra positive results had a semi-quantitative result of ‘trace’. All of them were repeated and four of the five were not confirmed by a second test on the same sample. The one that was confirmed also had a positive culture. Of the additional five Ultra positive samples, three had an Xpert positive test on the same sample. All cultures are still negative, however: one is a patient in treatment for TB; one was previously treated with non-specific antibiotics; one has weak signs of growth on MGIT tube (not detected by the machine); one was negative by Xpert and culture pending; and one was negative by Xpert but culture grew MTB. All samples were either rifampicin indeterminate (5) or negative (5) (see Table 3.4.3b).

46
Table 3.4.3b. Detailed results for ten Ultra positive cases
sample 20143 27041 24154 26356 20149 24615 20739 19659 24129 27894
Xpert + + + - - - - - - -
Ultra + + + med + trace
+ trace
+ trace
+ + trace
+ trace
+
Ultra Repeat same
sample
nd nd
+ - -
- -
LJ P P P P P P P P P P
MGIT P P P + MTB P P P P P + MTB
Notes Anti-biotics for 2 weeks
TB on Rx
MGIT : Some growth TBC
The subjects with a positive Ultra and a negative culture will be monitored monthly for six months by clinical interview and collection of a new sputum sample. Conclusion: From this preliminary analysis and sets of data, we can say that Ultra increases the number of positives from three to ten compared to Xpert. Five of the ten cases are considered TB cases (for others classification is pending).

47
3.4.4 Paediatric data
3.4.4.1 Paediatric study South Africa PIs: Mark Nicol and Heather Zar Division of Medical Microbiology and Institute for Infectious Diseases and Molecular Medicine, University of Cape Town; National Health Laboratory Service & Department of Paediatrics and Child Health; MRC Unit on Child & Adolescent Health, University of Cape Town; and Red Cross War Memorial Children’s Hospital, Cape Town, South Africa Team: Lesley Workman, Layla Hendricks, Slee Mbhele Funding: NIH R01 and TB RePORT (SA MRC and NIH)
Background: Rapid microbiologic confirmation of pulmonary TB (PTB) in children is desirable for diagnosis and implementation of effective therapy. A meta-analysis reported a pooled sensitivity and specificity for Xpert MTB/RIF on induced sputum (IS) of 62% and 98% respectively, compared to culture in children with PTB. Ultra can detect disease with fewer bacilli than Xpert and therefore may offer an improved rapid diagnostic, given the paucibacillary nature of childhood PTB. We investigated the diagnostic yield of Ultra compared to liquid culture from an induced sputum sample in children hospitalised for suspected PTB in a high HIV and TB prevalence area. Methods: Children hospitalised for suspected PTB in Cape Town, South Africa were prospectively enrolled from December 2011 to September 2016. One to three induced sputum samples were collected; the first was split for culture in liquid medium (MGIT) and Xpert MTB/ RIF; the second was split for culture and Xpert or storage; the third was stored. Ultra was performed in December 2016 on a single IS specimen from the batched stored 2nd or 3rd IS specimen. The accuracy of Ultra was compared to culture as the reference standard. Results: A total of 391 samples with valid culture results were available from 378 children. The median (25th-75th percentile) age of children was 32.9 (15.2-74) months; 77 children (20.4 %) were HIV-infected. On per sample analysis, culture was positive in 74 (18.9%) and Ultra in 67 (17.1%). Xpert MTB/RIF, available for 120 samples was positive in 18 (15%). The sensitivity and specificity of Ultra on the per sample analysis (culture and Ultra on the same sample) were 75.7% and 96.5% respectively which was similar in HIV-infected (sensitivity 70.6%; specificity 98.2%) and HIV-uninfected children (sensitivity 77.2%; specificity 96.1%). Ultra was positive in 10 children with negative culture results of whom 7 were clinically diagnosed as ‘unconfirmed TB’ per NIH revised consensus classification and treated. The sensitivity and specificity of Ultra on a per patient analysis (Ultra from one IS sample compared to culture results from multiple IS samples) were 67.5% and 96.6% respectively. Conclusion: Ultra provides rapid detection of M. tuberculosis complex from a single IS in most children with culture confirmed TB. Ultra may detect an additional group of children with TB, who are not detected by culture.

48
3.4.4.2 TB paediatric study Tanzania Evaluation of the Ultra assay in a paediatric TB study from Tanzania Andrea Rachow1,2, Daniel Adon Mapamba3, Issa Sabi3, Elmar Saathoff1,2, Nyanda Elias Ntinginya3, Michael Hoelscher1,2 and Klaus Reither4 1 Division of Infectious Diseases and Tropical Medicine, Medical Centre of the University of Munich (LMU), Munich, Germany 2 German Centre for Infection Research (DZIF), partner site Munich, Germany 3 NIMR- Mbeya Medical Research Center, Mbeya, Tanzania 4 Swiss Tropical and Public Health Institute, Basel, Switzerland
Background: A next-generation test for TB infection, the Xpert® MTB/RIF Ultra, to aid in detection of patients with smear-negative TB, often associated with childhood TB, is now available. Methods: A prospective clinical diagnostic study was performed from May 2011 until September 2012 to assess the performance of Xpert MTB/RIF assay (i.e. Xpert) in children with clinical symptoms suggestive for TB. Up to four sputum samples were collected at baseline from each child. In small children, sputum induction was performed. At least one sputum sample per child was used for immediate Xpert testing, using fresh sputum. All sputum samples were processed for culture and smear after NaOH-decontamination. All participants were followed up for at least 6 months to confirm cure after TB treatment or establish an alternative diagnosis in TB negative children. For the evaluation of the Xpert Ultra MTB/RIF (i.e. Ultra) one decontaminated sputum pellet, stored at -80°C, of each participant were used. For the same sputum pellet culture, Xpert and smear results were obtained from the main study data base. The diagnostic performance of Ultra was calculated in a per sample analysis using culture positivity in the same sample as reference standard for confirmed TB. Results: In total, 169 children were enrolled in Mbeya Tanzania. The majority of children were between two and ten years old, about 50% was below five. HIV-prevalence was about 44%. Only 146 Ultra results out of 169 samples tested (from 169 children) could be matched with previous culture results. These 146 samples were included in the final analysis. Among these 146 samples, 17 samples were positive for MTB culture. Out of these, 7 samples (7/17= 41%) were also smear positive. There were 12 out of 17 MTB culture positive samples which were positive in Ultra and 8 out of 17 MTB culture positive samples which were detected by Xpert (Table 3.4.4.2a). Five samples which were MTB positive in culture were not detected by Xpert and Ultra. As per smear status, we have a sensitivity of 20% for Xpert in smear negatives. One sample which was smear positive was not detected by Xpert resulting in a sensitivity of 85.9% in this subgroup. Sensitivity for Ultra was 50% in smear negatives and 100% in smear positive children (Table 3.4.4.2a). The distribution of quantitative readouts is summarized in Table 3.4.4.2b. Conclusion: The sensitivity of Ultra was higher than that of Xpert. The majority of additional TB cases (3 out of 4) found by Ultra were among sputum negative children. No additional TB case
was detected by Ultra in the group of children with highly probably TB.

49
Table 3.4.4.2a: Sensitivity and specificity of Ultra and Xpert
Xperta Ultraa
Status
Subgroup
Sensitivity
Specificity
Sensitivity
Specificity
% (n/N) % (n/N) % (n/N) % (n/N)
All TB cases (17) 47.1b (8/12) - 70.6c (12/17) -
Culture positive (n=17)
Smear + (7) 85.7d (6/7) - 100.0e (7/7) -
Smear - (10) 20.0f (2/10) - 50.0g (5/10) -
Culture negative (n=129)
N/A - 100h
(120/120)* -
100i (128/128)**
a=per sample analysis b= 95%CI = 23.0% to 72.2% c= 95%CI = 44.0% to 89.7% d= 95%CI = 42.1% to 99.6% e= 95%CI = 59.0% to 100.0% f= 95%CI = 2.5% to 55.6% g= 95%CI = 18.7% to 81.3% h= 95%CI = 96.9% to 100.0%
i= 95%CI = 97.2% to 100.0% *= nine results missing for Xpert **= one error for Ultra
Table 3.4.4.2b: Quantitative readouts for Ultra (N=12)
High Moderate Low Very low Trace
1 6 1 2 2
Summary of findings for non-HBDC data, extra-pulmonary & paediatric data
The additional studies performed on the side of the parent study by independent investigators shows a significant increase of sensitivity for Ultra in patients with TB meningitis and suggests an increase also in other patients with likely paucibacillary disease (i.e., children and active case finding in asylum seekers). The increase in sensitivity is primarily attributable to the ‘trace-call’ of Ultra. Furthermore, the data from the US indicates perfect specificity in a population that has likely minimal recent TB history.

50
3.5 Additional secondary analyses
3.5.1 Analyses by site
Table 3.14 shows site-specific estimates of sensitivity in smear-negative TB and specificity stratified by presence/absence of a history of TB. Estimates of sensitivity show a large degree of variation, as would be expected based on differences in patient spectrum and chance variation (see also forest plot from Xpert Cochrane review in Appendix E). Specificity estimates for Xpert were generally very high (≥97%) among patients without a history of TB for all sites, with two exceptions: Belarus (94%) and New Delhi (91%). The imperfect specificity in Belarus was due to a single false-positive; this patient also had another non-study culture done per request of the treating clinician (~1 month post enrolment), which grew MTBC. Upon further inspection of data from New Delhi it was found that 5.8% of negative cultures were smear-positive at this site (excluded from the primary analyses), a rate much higher than any other site (see further details in Appendix G). This suggested harsh decontamination practices, which can give rise to false-negative cultures, especially in paucibacillary specimens. Indeed it was found that New Delhi had applied a higher concentration of NaOH for a period of time during the study in order to control the contamination rate for routine purposes (5% NaOH rather than 4%). The lowest specificity of Ultra was also found in New Delhi. Table 3.14. Site-specific estimates of sensitivity and specificity (by TB history)
Site Parameter (denominator)1
Xpert Ultra
No TB history
Any TB history
No TB history
Any TB history
Belarus Sensitivity (n=13) 46% 62%
Specificity (n=17/2) 94%2 100% 94%2 100%
Brazil Sensitivity (n=5) 60% 60%
Specificity (n=84/9) 100% 100% 100% 94%
Cape Town Sensitivity (n=14) 64% 64%
Specificity (n=70/53) 100% 96% 100% 89%
China Sensitivity (n=4) 0% 0%
Specificity (n=7/0) 100% NE 100% NE
Georgia Sensitivity (n=30) 57% 67%
Specificity (n=125/81) 100% 94% 98% 94%
Jo’burg Sensitivity (n=15) 27% 60%
Specificity (n=63/31) 100% 100% 98% 97%
Kenya Sensitivity (n=6) 33% 50%
Specificity (n=91/17) 98% 100% 95% 88%
Mumbai Sensitivity (n=9) 67% 78%
Specificity (n=10/2) 100% 100% 90% 100%
New Delhi Sensitivity (n=7) 43% 57%
Specificity (n=46/17) 91%3 100% 87%3 82%
Uganda Sensitivity (n=16) 19% 63%
Specificity (n=102/12) 97% 100% 91% 83%
Pooled Sensitivity (n=119) 44.5% 61.3%
Specificity (n=615/224) 98.4% 96.9% 95.9% 91.5%

51
1 Sensitivity estimates are shown for smear-negative/culture-positive cases; denominators for specificity estimates are shown as (# of patients without history/ # of patients with history)
2 Note that this estimate is based on a only 17 culture-negative patients, one of which was false-positive on both Xpert and Ultra.
3 Note that this estimate is based on 46 culture-negative patients. Upon further inspection, it was found that 5.8% of negative cultures were smear-positive in New Delhi (excluded from the primary analyses), suggesting harsh decontamination practices, which can give rise to false-negative cultures, especially in paucibacillary specimens.
Table 3.15 shows an exploratory analysis of specificity estimates with and without New Delhi data. Overall specificity estimates of both Xpert and Ultra increase by ~0.3-0.7% when excluding the data from New Delhi. However, this effect is overall stronger for Ultra. Thus, specificity differences between Xpert and Ultra decrease when excluding New Delhi. Table 3.15. Specificity estimates with and without New Delhi data
Sites Xpert Ultra with trace
Ultra ‘no trace’
2
Ultra ‘cond. trace’
3
Delta with trace
Delta ‘no trace’
2
Delta ‘cond. trace’
3
All sites (n=1,243)
98.0% 94.8% 97.0% 96.1% -3.2% -1.0% -1.9%
Excluding New Delhi (n=1,142)
98.3% 95.5% 97.6% 96.5% -2.8% -0.7% -1.8%
Specificity increase
+0.3% +0.7% +0.6% +0.4% +0.4% +0.3% +0.1%
1 Sensitivity varies little by TB history and not systematically; Specificity does not vary between Smear-negative patients and Smear-positive patients
2 Trace-calls reclassified as MTB-negative 3 Trace-calls reclassified as MTB-negative for patients with TB history only
3.5.2 Ultra on samples 2 and 3
As pre-defined in the protocol and analysis plan, all analyses so far were based on S1, the first sputum sample obtained from participants. Table 3.16 shows estimates of sensitivity (in smear-negative TB) and specificity for the additional samples that were tested with Ultra (on samples S2 and S3). Sensitivity appeared somewhat higher on S2 than on S1/S3, whereas specificity on S2 and S3 appeared lower than on S1.
Table 3.16. MTB accuracy in S1/S2/S3
Sensitivity in smear-negative TB (95%CI) Specificity (95%CI)
Xpert (S1) 43.8% (33.6, 54.3) 98.1% (96.8, 99)
Ultra (S1) 60.4% (49.9, 70.3) 95% (93.1, 96.4)
Ultra (S2) 66.7% (56.3, 76) 92.9% (90.8, 94.7)
Ultra (S3) 61.5% (51, 71.2) 92.2% (90.1, 94.1)
Specificity estimates stratified by TB history are shown in table 3.17 and Figure 3.7. Specificity estimates of Ultra on S1, S2 and S3 appear consistent in patients with a history of TB; the decrease in specificity in samples S2 and S3 is seen mainly in patients without a prior TB episode and figure 3.7 further supports this impression. The reduced specificity in samples S2 and S3 that

52
was not explained by a history of TB was investigated in more detail in a root cause analysis, results of which are reported in the following section. Table 3.17. Specificity of Ultra in samples S1, S2 and S3 stratified by history of TB
Analysis group (Culture- neg.
cases)
Xpert Specificity (95%CI)
Ultra S1 Specificity (95%CI)
Ultra S2 Specificity (95%CI)
Ultra S3 Specificity (95%CI)
Pooled (734) 98.1% (96.8, 99.0)
95.0% (93.1, 96.4)
92.9% (90.8, 94.7)
92.2% (90.1, 94.1)
No History of TB (535)
98.5% (97.1, 99.4)
95.9% (93.8, 97.4)
93.3% (90.8, 95.2)
92.5% (90.0, 94.6)
Any history of TB (198)
97.0% (93.5, 98.9)
92.4% (87.8, 95.7)
91.9% (87.2, 95.3)
91.4% (86.6, 94.9)
Note: Restricted to samples with results on all specimens (S1, S2, S3)
Figure 3.7. Specificity of Ultra on samples S1, S2 and S3 depending on time since prior TB history
Lines are running-line least squares (mean) smoothers using a bandwidth of 0.8 (Cleveland, JASA, 1979)
3.5.3 Root-cause analysis of FP results
Despite the fact that the sensitivity estimates for Ultra may not be directly comparable to those of prior studies on Xpert, the results of this study show a clear increase in sensitivity. This is in line with the improvements compared to the Xpert assay which include multi-copy amplification targets, larger PCR tube and a more efficient fully nested nucleic acid amplification. Thus, the Ultra is also more likely to yield false positive results in patients with TB history (as shown above) but also in samples that are cross-contaminated with minimal amount of bacteria that do not amplify in culture after decontamination.

53
The further decrease in specificity in S2 and S3 in this study suggests that reasons other than TB history are at play. Given that S2 and S3 were more heavily manipulated, cross-contamination appears likely. We proceeded with a root-cause analysis to identify potential issues that could have led to the false-positive Ultra results for TB detection beyond following an interim analysis. Given that Xpert was not done on S2 and S3, it was not possible to assess whether the specificity of Xpert would have been affected. Figure 3.8 shows four main categories of possible root causes identified and the steps that were taken to assess their likelihood.
Figure 3.8. Root-cause analysis scheme
Ref. standard: reference standard; S+C-: smear-positive, culture-negative; S4: sputum 4; TB Hx: TB history; NC: negative controls
Imperfect reference standard We monitored the culture contamination and smear-positive, culture-negative rates as possible indicators of procedures being followed at each participating laboratory. In New Delhi 5% NaOH was used instead of 4% during a period of four months in order to control the contamination rate for routine purposes. This likely contributed to the disproportionately low specificity in New Delhi (see analysis by site above). Excluding New Delhi in the analysis of specificity would have improved the specificity from 98.0% to 98.3% for Xpert and from 94.8% to 95.5% for Ultra (see Table 3.15).
In order increase the yield of culture recovery, a third set of cultures was done on sputum 4 (solid and liquid) in case of discrepant results within Xpert and Ultra and this yielded two additional TB cases which had not tested positive on any of the prior cultures. Another example of the imperfect nature of culture was found in Belarus where the single false-positive case was found to be culture-positive one month after enrolment in a non-study sample. However, all S5 follow-up

54
cultures otherwise were negative. We also conducted follow-up visits as specified under “Other study procedures” to identify cases started on TB therapy based on clinical grounds. Overall, the results suggested that an imperfect reference standard may be responsible for individual false-positive results. However, this is probably not an important cause for false-positive results overall since Ultra sensitivity in paucibacillary cases was not very close to that of the reference standard and no patient had positive follow-up cultures (aside from one patient from Belarus) and few were started on therapy.
Non-viable MTB A secondary analysis was conducted on the basis of the evidence showing the impact of prior history of TB in the specificity of molecular assays. See “Effect of TB history on specificity for MTB detection”. The results confirm that Ultra detects more false-positive cases than Xpert in patients with recent history of TB. Assay issues In order to assess possible issues with the assay such as cross reactivity with another substance or pathogen, detailed analyses of the Ultra melt curves using archived .gxx files were conducted by Cepheid and Rutgers and presented to FIND. The melt-curves were highly suggestive of these false-positive results being compatible with true TB. DNA amplicons obtained from the stored false-positive cartridges were used for confirmation by sequencing. Detailed results are shown in Appendix H and are also discussed in section 3.3.2. Briefly, 19 out of 44 false-positive samples were sent for sequencing. For one sample, sequencing from the amplicon failed. TB was confirmed in 16 cases, one case was determined to be a likely “real false-positive” (i.e. MTB-call despite there being no MTB DNA in patient sample) and one case yielded inconclusive results. Notably, no other pathogen was identified in the sequencing. Overall, both the melt curve and the sequencing analysis confirmed presence of TB DNA in almost all cases and suggested that false-positives were not due to cross reactivity of the assay. Cross-contamination Testing of external controls and swab testing of the instrument and the surrounding area by Ultra was performed throughout the study to identify potential cases of cross-contamination. No external negative control tested positive throughout the study. However, overall 13 positive swabs were found at 5 sites during the study duration (1 to 3 positive per site). Of these, seven were found at the study start and all 13 were negative after cleaning with bleach as per the manual of procedures. The positive swab testing on Ultra (in contrast to negative routine testing on Xpert), points towards the need for more thorough cleaning of surfaces in laboratories that operate Ultra.
At the time of the interim analysis, false-positive results on samples from the study had been observed at all sites and an analysis of the time and site (of false-positive results) was performed to identify potential “clusters” that would suggest possible cross contamination (in contrast false-positive results due to patient history of TB would have been expected more randomly). The time/site analysis identified clusters of unexplained false-positive results at four sites (two to four events per site). None of the identified clusters of false-positive results correlated with the positive results on swab testing of surfaces. Given the higher false-positive rates in S2 and S3 and the decreased correlation of false-positive results in these samples with TB history compared to S1, we considered contamination in the context of the sample preparation and processing. This was also likely given that these samples were more heavily manipulated than the S1, with the latter undergoing a more routine sample

55
flow (aside from the random pipetting to allow for Xpert and Ultra testing in parallel). The most likely sources of contamination were considered to be:
Preparation in the same areas/hoods that are used for smear or culture, other molecular tests or even drug susceptibility testing
Contamination of reagents such as NALC/NaOH
Contamination of beads used for homogenization in S3
Contamination through air or other fomites in the process of sample handling To try to assess which step(s) during processing of S2 and S3 samples were prone to cross-contamination, we introduced the testing of additional external negative controls (ENCs) using artificial sputum samples in four sites and sterile distilled water procured locally in three other sites for which recruitment was still ongoing. The ENCs were processed on a daily basis together with each study sputum in the same way the respective study sputum was to be processed. Positive ENCs were observed at three sites: three on sputum 2 and three on sputum 3. On further root cause analysis, it was demonstrated that the contamination found on S3 came from the glass tubes containing the glass beads used for homogenisation. Ultra was positive in five out of 11 tests done within 3 days when the contaminated glass beads were used. No more false-positives were found after improved measures were introduced to avoid cross-contamination of beads. For one of the three positive results on S2 it was found that the biosafety cabinet used for sample processing of Ultra was sometimes shared by staff working on DST and LPA testing. Indeed, the ENC culture yielded similar results (MTB positive, RIF-resistant) than one of the samples processed for DST just before and sequencing of these samples to assess whether it is the same strain was in progress at the time of report preparation. Although the GeneXpert is a closed system, the proximity of the biosafety cabinet to the GeneXpert systems at this site was considered to pose an extra risk for contamination. No further ENCs were found after a clear separation of use of biosafety cabinet was instituted and the GeneXpert systems were removed from that room. No apparent cause was identified for the other positive result on S2 and no further false-positive results were found following a monitoring visit with focus on laboratory procedures. Summary of results from root cause analysis The results of the root-cause analysis suggest cross-contamination as a cause for false-positive results on Ultra for samples S2/S3. The Ultra, due to its increased sensitivity, is more likely to pick up paucibacillary contamination. Some of the cross-contamination was due to procedures that are not part of routine care (i.e., beads homogenization) and are therefore unlikely to occur in real-world implementation. Other cross-contamination events are more likely to occur in busy reference laboratories that also process other TB molecular or culture tests. Given that most Xpert testing is performed in laboratories that do not have culture or other molecular test facilities, the issue of increased detection due to cross-contamination with Ultra may have a lower impact. Nevertheless, precautions should be taken in order to minimize the risk of cross-contamination based on our experience.
3.5.4 Mixed infections
As pre-defined in the protocol and analysis plan, all analyses reported here excluded patients in whom NTM were cultured. Table 3.18 shows test results in patients with mixed infections.
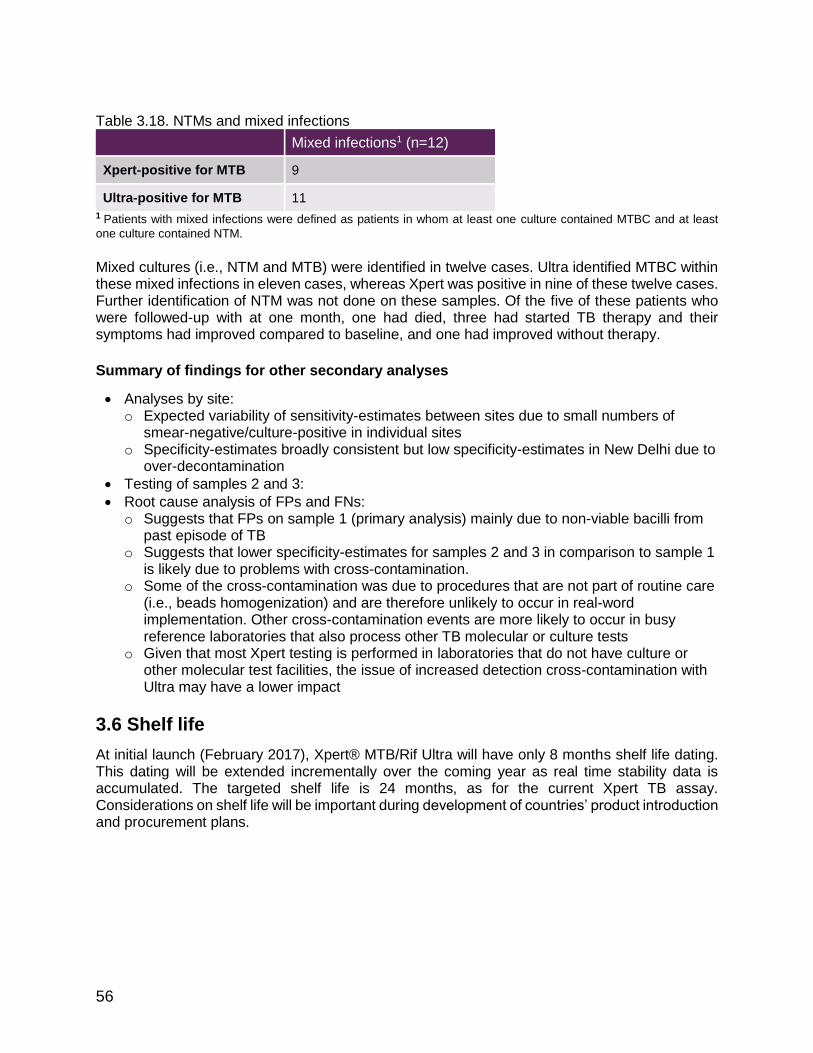
56
Table 3.18. NTMs and mixed infections
Mixed infections1 (n=12)
Xpert-positive for MTB 9
Ultra-positive for MTB 11
1 Patients with mixed infections were defined as patients in whom at least one culture contained MTBC and at least
one culture contained NTM.
Mixed cultures (i.e., NTM and MTB) were identified in twelve cases. Ultra identified MTBC within these mixed infections in eleven cases, whereas Xpert was positive in nine of these twelve cases. Further identification of NTM was not done on these samples. Of the five of these patients who were followed-up with at one month, one had died, three had started TB therapy and their symptoms had improved compared to baseline, and one had improved without therapy.
Summary of findings for other secondary analyses
Analyses by site: o Expected variability of sensitivity-estimates between sites due to small numbers of
smear-negative/culture-positive in individual sites o Specificity-estimates broadly consistent but low specificity-estimates in New Delhi due to
over-decontamination
Testing of samples 2 and 3:
Root cause analysis of FPs and FNs: o Suggests that FPs on sample 1 (primary analysis) mainly due to non-viable bacilli from
past episode of TB o Suggests that lower specificity-estimates for samples 2 and 3 in comparison to sample 1
is likely due to problems with cross-contamination. o Some of the cross-contamination was due to procedures that are not part of routine care
(i.e., beads homogenization) and are therefore unlikely to occur in real-word implementation. Other cross-contamination events are more likely to occur in busy reference laboratories that also process other TB molecular or culture tests
o Given that most Xpert testing is performed in laboratories that do not have culture or other molecular test facilities, the issue of increased detection cross-contamination with Ultra may have a lower impact
3.6 Shelf life
At initial launch (February 2017), Xpert® MTB/Rif Ultra will have only 8 months shelf life dating. This dating will be extended incrementally over the coming year as real time stability data is accumulated. The targeted shelf life is 24 months, as for the current Xpert TB assay. Considerations on shelf life will be important during development of countries’ product introduction and procurement plans.

57
4. Summary & discussion
Summary
The main study demonstrated that sensitivity of the Ultra was 5% higher than that of Xpert (95%CI +2.7, +7.8) but specificity was 3.2% lower (95%CI -2.1, -4.7). Sensitivity-increases were highest among smear-negative patients (+17%, 95%CI +10, +25) and among HIV-infected patients (+12%, 95%CI +4.9, +21). Specificity-decreases were higher in patients with a history of TB (-5.4%, 95%CI -9.1, -3.1) than in patients with no history of TB (-2.4%, 95%CI -4.0, -1.3). Reclassifying 'trace-calls' (the semi-quantitative category of the Ultra assay that corresponds to the lowest bacillary burden) as 'TB-negative', either in all cases or in those with TB history, mitigates most of the specificity losses (Specificity –1.0% and -1.9% if trace reclassified for all cases or only cases with TB history, respectively) while maintaining some of the sensitivity gains over Xpert (Sensitivity +7.6% and +15%). Employing Ultra ‘with re-testing of trace-calls’ (i.e. patients with trace-calls re-tested and considered tuberculosis-negative if result negative upon re-testing) yields qualitatively similar results (Specificity –2.0%, Sensitivity +15%). Ultra performed similarly well than Xpert in detection of RIF-resistance. The number of enrolled patients with RIF-resistance was insufficient to confirm analytical results that suggested a superior performance of Ultra for RIF-resistance detection. The additional retrospective studies demonstrate that in settings where there is very limited TB transmission, (i) specificity of Ultra is close to perfect (99.3%, 95%CI 96-99), and (ii) the increased sensitivity can possibly aid TB elimination efforts. For EPTB and paediatric TB, studies highlighted the benefit of the increased sensitivity (primarily due to the ‘trace-call’), with a sensitivity of 95% for Ultra versus 45% for Xpert in TB meningitis and 71% for Ultra on respiratory samples in children versus 47% for Xpert. The modelling (report provided separately) demonstrated that Ultra is expected to improve pulmonary TB case detection and outcomes. Depending on the patient population, Ultra could detect one additional TB case per 100 to 1000 individuals evaluated, and prevent one additional TB death per 500 to 10,000 individuals evaluated. However, the increase in case detection comes at a cost: one false TB diagnosis and unnecessary treatment per 40 to 70 individuals evaluated and 10 to 500 unnecessary treatments per TB death prevented. The acceptable level of unnecessary treatments per prevented death (or per additional or earlier diagnosis) is likely to vary between settings. A similar trade-off exists regardless of whether the trace-call is used. The benefits of an earlier diagnosis and reduced deaths for patients suffering from EPTB and children are not considered within this model.
Discussion
The results of this combined work demonstrate that Ultra has higher sensitivity than Xpert particularly in smear-negative adults and children and HIV-infected patients with pulmonary TB, as well as in TB meningitis and at least as good accuracy for RIF detection. However, as a result of the increased sensitivity, Ultra also detects remnant bacilli (that are not detected by culture) present particularly in patients with recent history of TB. This results in reduced specificity predominantly in adult patients with pulmonary TB and prior TB history in high burden settings, while in low transmission settings, EPTB and paediatric TB it does not appear to be a problem. Thus, the impact of this trade-off on patient important outcomes like overtreatment on the one hand and increased diagnosis as well as decreased TB deaths varies substantially between different settings. For settings were the HIV prevalence is high, as in Sub-Saharan Africa, the increased diagnosis and reduced transmission and deaths are likely to outweigh the downsides

58
of overtreatment. Furthermore, the benefits for patients with EPTB, who suffer from substantially delayed diagnosis and high death rates (particularly patients with TB meningitis), also need to be considered. In populations with high prevalence of HIV, EPTB can make up to 25% of all TB. In addition, children also often face a delayed diagnosis and high death rate from TB. While substantial empiric treatment in the absence of microbiological confirmation captures many patients with EPTB and paediatric TB, autopsy studies have repeatedly shown that much TB is still missed [25]. In countries with limited ongoing TB transmission (and thus recent TB history), the specificity issues appears to be much less of a concern and Ultra could be considered for active case findings to support TB elimination efforts. For other settings with lower HIV prevalence, the amount of overtreatment per additional patient detected and death prevented is substantially higher, and the willingness to accept this trade-off has to be considered. Alternatively, more complex implementation algorithms could be considered. This could include re-testing patients who are positive based on a ‘trace-call’ or a different interpretation of the ‘trace-call’ for patients with TB history versus those without. The latter would require that all operators are familiar and able to interpret the semi-quantitative measurement of Ultra, which would certainly come with implementation challenges. Alternatively, one could consider to request an Ultra test without ‘trace-call’ (effectively reclassifying those with the ‘trace-call’ as non-TB), however then the opportunities the test offers for people living with HIV, children and those with presumed EPTB, would have been largely forgone (as much of the sensitivity-gain in these populations is a result of the ‘trace-call’). Conceivable, one could also have two separate assay definition files on one instrument, however, here again, the operator would have to know, which assay to implement in which patient (for example, decide based on whether the patient has TB history). Independent of the considerations around sensitivity, there are several arguments that speak for an implementation of the Ultra (with or without trace) over the current G4 Xpert cartridge. Those include the potential for improved specificity in patients with infections with non-tuberculous mycobacteria and improved detection of RIF-resistance with improved differentiation of mixed infections and improved specificity in paucibacillary disease. While the data from the current study are limited in support of these other improvements (due to sample size constraints), the analytical/laboratory data in their support are strong. The main study also highlighted issues around cross-contamination in laboratories that process culture and other molecular tests at the same time. Compared to Xpert, Ultra may be more likely to detect this low-level cross-contamination because of its higher sensitivity. This will need to be considered in the implementation guidance. However, most laboratories/clinics that use Xpert currently, do not have culture or molecular facilities, and therefore this will be a problem restricted to larger referral laboratories. Limitations of the main study and the presented retrospective studies in select subgroups include limited data points on patients with RIF-resistance, patients with EPTB other than TB meningitis and paediatric TB. Thus, additional data on these subgroups would help to further improve the estimates of performance and trade-offs in these select patient groups. However, the data obtained for the main group of interest, adult pulmonary TB, is sufficient to draw conclusions. Conceivably, further data on subgroups of patients with adult pulmonary TB, such as patients with prior TB history, would help to narrow the confidence intervals around estimates, but conclusions are unlikely to change. Further data on the benefits of repeat testing after an initial trace-result will help to strengthen the confidence in this strategy to reduce the rate of false-positives.

59
Notably the considerations put forward here with Ultra with regards to specificity reduction due to prior TB will apply to other molecular tests that aim to improve sensitivity through the detection of multi-copy targets (e.g. Abbott, Molbio). Only a further improvement on sample processing that allows the differentiation between live and dead bacilli may be able to overcome these issues. However, several attempts with filters (i.e., for Cepheid) or intercalating dyes have proven insufficient (i.e., for Cepheid) or ineffective (FIND unpublished data on intercalating dyes). Nevertheless, molecular tests today are the only tests in the pipeline with reliable performance on TB detection (and in addition the possibility for genotypic resistance detection). The absence of novel non-molecular tests that could improve TB detection, while overcoming limitations of molecular tests, means that the TB stakeholder community must face difficult decisions on trade-offs for implementation of molecular tests. At initial launch (February 2017), Xpert® MTB/Rif Ultra will have only 8 months shelf life dating. This means that initial implementation will need to be restricted to countries that have rapid import procedures and high cartridge utilisation rates. The targeted shelf life is 24 months, as for the current Xpert TB assay and implementation in a wider range of settings will become possible over time. In summary, the Ultra offers opportunities for increased TB detection with its substantially increased sensitivity but implementation needs to be considered carefully in light of the reduced specificity in patients with prior history of TB.

60
5. References
1. World Health Organization. Global tuberculosis report 2016. 2016.
doi:10.15760/honors.242
2. Steingart KR, Ramsay ARC, Pai MP. Optimizing sputum smear microscopy for the diagnosis of pulmonary tuberculosis. Expert Rev Anti Infect Ther. 2014;5: 327–331. doi:10.1586/14787210.5.3.327
3. World Health Organization. WHO monitoring of Xpert MTB/RIF roll-out. WHO. World Health Organization; 2014.
4. Boehme CC, Nabeta P, Hillemann D, Nicol MP, Shenai S, Krapp F, et al. Rapid Molecular Detection of Tuberculosis and Rifampicin Resistance. N Engl J Med. 2010;363: 1005–1015. doi:10.1056/NEJMoa0907847
5. Steingart, K. R., Schiller, I., Horne, D. J., Pai, M. P., Boehme, C. C., & Dendukuri, N. (2014). Xpert® MTB/RIF assay for pulmonary tuberculosis and rifampicin resistance in adults. Cochrane Database of Systematic Reviews (Online), (1), CD009593. http://doi.org/10.1002/14651858.CD009593.pub3
6. World Health Organization. (2013). Xpert MTB/RIF assay for the diagnosis of pulmonary and extrapulmonary TB in adults and children: policy update. Geneva: World Health Organization.
7. Nicol MP, World Health Organization, Isaacs W, Munro J, Black F, Eley B, et al. Accuracy of the Xpert MTB/RIF test for the diagnosis of pulmonary tuberculosis in children admitted to hospital in Cape Town, South Africa: a descriptive study. The Lancet infectious diseases. 2011;11: 819–824. doi:10.1016/S1473-3099(11)70167-0
8. Peter JG, Theron G, Pooran A, Thomas J, Pascoe M, Dheda K. Comparison of two methods for acquisition of sputum samples for diagnosis of suspected tuberculosis in smear-negative or sputum-scarce people: a randomised controlled trial. The Lancet Respiratory Medicine. 2013. doi:10.1016/S2213-2600(13)70120-6
9. Sohn H, Aero AD, Menzies D, Behr M, Schwartzman K, Alvarez GG, et al. Xpert MTB/RIF testing in a low tuberculosis incidence, high-resource setting: limitations in accuracy and clinical impact. Clin Infect Dis. 2014;58: 970–976. doi:10.1093/cid/ciu022
10. Theron, G., Peter, J., Dowdy, D., Langley, I., Squire, S. B., & Dheda, K. (2014a). Do high rates of empirical treatment undermine the potential effect of new diagnostic tests for tuberculosis in high-burden settings? The Lancet Infectious Diseases, 14(6), 527–532. http://doi.org/10.1016/S1473-3099(13)70360-8
11. Theron, G., Zijenah, L., Chanda, D., Clowes, P., Rachow, A., Lesosky, M., et al. (2014b). Feasibility, accuracy, and clinical effect of point-of-care Xpert MTB/RIF testing for tuberculosis in primary-care settings in Africa: a multicentre, randomised, controlled trial. The Lancet, 383(9915), 424–435. http://doi.org/10.1016/S0140-6736(13)62073-5
12. Rufai SB, Kumar P, Singh A, Prajapati S, Balooni V, Singh S. Comparison of Xpert MTB/RIF with line probe assay for detection of rifampicin-monoresistant Mycobacterium

61
tuberculosis. J Clin Microbiol. American Society for Microbiology; 2014;52: 1846–1852. doi:10.1128/JCM.03005-13
13. Luetkemeyer AF, Firnhaber C, Kendall MA, Wu X, Mazurek GH, Benator DA, et al. Evaluation of Xpert MTB/RIF Versus AFB Smear and Culture to Identify Pulmonary Tuberculosis in Patients With Suspected Tuberculosis From Low and Higher Prevalence Settings. Clin Infect Dis. Oxford University Press; 2016;62: 1081–1088. doi:10.1093/cid/ciw035
14. van Deun A, Aung KJM, Bola V, Lebeke R, Hossain MA, de Rijk WB, et al. Rifampicin Drug Resistance Tests for Tuberculosis: Challenging the Gold Standard. J Clin Microbiol. 2013;51: 2633–2640. doi:10.1128/JCM.00553-13
15. Somoskovi A, Deggim V, Ciardo D, Bloemberg GV. Diagnostic Implications of Inconsistent Results Obtained with the Xpert MTB/Rif Assay in Detection of Mycobacterium tuberculosis Isolates with an rpoB Mutation Associated with Low-Level Rifampicin Resistance. J Clin Microbiol. 2013;51: 3127–3129. doi:10.1128/JCM.01377-13
16. Raizada N, Sachdeva KS, Sreenivas A, Vadera B, Gupta RS, Parmar M, et al. Feasibility of Decentralised Deployment of Xpert MTB/RIF Test at Lower Level of Health System in India. Chaturvedi V, editor. 2014;9: e89301. doi:10.1371/journal.pone.0089301
17. Lumb R, Van Duen A, Bastian I, Fitz-Gerald M. The Handbook - Laboratory Diagnosis of Tuberculosis by Sputum Microscopy. 2015;: 1–88.
18. Kent PT, Kubica GP. Public Health Mycobacteriology: A Guide for the Level III Laboratory. US Dept. Public Health and Human Services; 1985.
19. Dharan NJ, Amisano D, Mboowa G, Ssengooba W, Blakemore R, Kubiak RW, et al. Improving the Sensitivity of the Xpert MTB/RIF Assay on Sputum Pellets by Decreasing the Amount of Added Sample Reagent: a Laboratory and Clinical Evaluation. Forbes BA, editor. J Clin Microbiol. American Society for Microbiology; 2015;53: 1258–1263. doi:10.1128/JCM.03619-14
20. Siddiqi S, Rüsch-Gerdes S. MGIT Procedure Manual. For BACTEC MGIT 960 TB System (Also applicable for Manual MGIT). Mycobacteria Growth Indicator Tube (MGIT) Culture and …. 2012.
21. Feuerriegel S, Schleusener V, Beckert P, Kohl TA, Miotto P, Cirillo DM, et al. PhyResSE: a Web Tool Delineating Mycobacterium tuberculosis Antibiotic Resistance and Lineage from Whole-Genome Sequencing Data. Carroll KC, editor. J Clin Microbiol. American Society for Microbiology; 2015;53: 1908–1914. doi:10.1128/JCM.00025-15
22. Ajbani K, Lin S-YG, Rodrigues C, Nguyen D, Arroyo F, Kaping J, et al. Evaluation of pyrosequencing for detecting extensively drug-resistant Mycobacterium tuberculosis among clinical isolates from four high-burden countries. Antimicrobial Agents and Chemotherapy. American Society for Microbiology; 2015;59: 414–420. doi:10.1128/AAC.03614-14
23. Steingart KR, Henry M, Ng V, Hopewell PC, Ramsay ARC, Cunningham J, et al. Fluorescence versus conventional sputum smear microscopy for tuberculosis: a

62
systematic review. The Lancet infectious diseases. 2006;6: 570–581. doi:10.1016/S1473-3099(06)70578-3
24. Rothmann MD. Design and Analysis of Non-Inferiority Trials. 2014;: 1–442.
25. FDA. Guidance for Industry Non-Inferiority Clinical Trials. 2010;: 1–66.
26. Metcalfe JZ, Makamure B, Mutetwa R, Peñaloza RA, Sandy C, Bara W, et al. Suboptimal specificity of Xpert MTB/RIF among treatment-experienced patients. 2015;: 1–3. doi:10.1183/09031936.00214114
27. Theron G, Venter R, Calligaro G, Smith L, Limberis J, Meldau R, et al. Xpert MTB/RIF Results in Patients With Previous Tuberculosis: Can We Distinguish True From False Positive Results? Clin Infect Dis. Oxford University Press; 2016;: civ1223. doi:10.1093/cid/civ1223
28. Reither K, Manyama C, Clowes P, Rachow A, Mapamba D, Steiner A, et al. Xpert MTB/RIF assay for diagnosis of pulmonary tube... [J Infect. 2014] - PubMed - NCBI. Journal of Infection. 2014. doi:10.1016/j.jinf.2014.10.003
29. Bates M, Mudenda V, Shibemba A, Kaluwaji J, Tembo J, Kabwe M, et al. Burden of tuberculosis at post mortem in inpatients at a tertiary referral centre in sub-Saharan Africa: a prospective descriptive autopsy study. The Lancet infectious diseases. 2015. doi:10.1016/S1473-3099(15)70058-7

63
6. APPENDIX
APPENDIX A. Details of statistical methods and sample size
Methodology for inferential statistics and to demonstrate non-inferiority Different methods will be used to compute 95% confidence intervals (95%CI), depending on the data structure. Confidence intervals for simple proportions For simple proportions (e.g., sensitivity of Ultra) Clopper-Pearson 95%CI will be calculated. Confidence intervals for the difference in proportions of paired samples For differences in proportions of paired samples (e.g., difference in sensitivity ∆ between Ultra and Xpert), 95%CI around ∆ will be calculated using Tango's score confidence interval for a difference of proportions with matched pairs, which takes into account that the two tests were performed on the same sample. This is done by considering the off-diagonal cells (cells b and c) of a table such as that shown below, which contains N reference-standard-positive test results for comparisons of sensitivity and N reference-standard-negative test results for comparisons of specificity:
Xpert Totals
+ -
Ultra + a b a+b
- c d c+d
Totals a+c b+d N
Methodology to demonstrate non-inferiority For each of the analyses of comparative accuracy, tables and figures similar to the one shown below (dummy table 1 and dummy figure 1) will be prepared applying test definitions and patient classification/reference standard outlined in section 2.1. The table will show the absolute values of sensitivity/specificity as well as the difference in sensitivity/specificity between Ultra and Xpert. The difference will be calculated as:
∆ sensitivity = sensitivity(Ultra) - sensitivity(Xpert) and ∆ specificity = specificity(Ultra) - specificity(Xpert)
such that any positive values of ∆ will reflect Ultra performing better than Xpert. To assess if non-inferiority has been demonstrated, the lower limit of the CI of ∆ is then compared to the pre-defined non-inferiority margin. Non-inferiority is achieved if the lower limit of the CI of ∆ is no lower than the non-inferiority margin. This can be assessed numerically based on dummy table 1 or visually based on dummy figure 1.

64
Dummy table 1: Diagnostic accuracy and difference in diagnostic accuracy
Sensitivity (95%CI)
Specificity (95%CI)
Difference (Ultra – Xpert)
xx.x% (xx.x, xx.x) [a,b,c,d]
xx.x% (xx.x, xx.x) [a,b,c,d]
Ni-margin -x% -x%
Dummy figure 1: Difference in diagnostic accuracy and non-inferiority margin
Figure legend: The difference in sensitivity/specificity (∆ = Ultra – Xpert) is displayed as horizontal lines with the point representing the point estimate and whiskers representing the upper and lower limit of the 95%CIs of ∆. The black vertical dotted line indicates zero difference in sensitivity/specificity and the red vertical broken line indicates the non-inferiority margin. Non-inferiority is demonstrated for a given comparison if the lower limit of the 95%CI of ∆ does not cross the red broken line (non-inferiority margin).
Sample size and enrolment targets According to the primary trial objective, sample size calculations will be based on proving non-inferiority of Ultra compared to Xpert. This was evaluated on two key endpoints: (i) sensitivity for TB detection among the subset of culture-confirmed TB patients whose smears all are negative (i.e., per-patient analysis, smear-negatives only); and (ii) sensitivity and specificity for RIF-resistance detection among all patients. Generic sample size formulas do not account for the correlation between tests that is present when testing samples from the same patient with two tests. Additionally such formulas rely on asymptotic theory that yield biased results for small sample sizes. We therefore carried out sample size calculations via Monte-Carlo Simulation. For all simulations we conservatively assumed a moderate correlation of 0.5 between the tests. Using the parameter values specified in the table we generated 10,000 correlated binary data sets for each simulation. Our criterion for choosing the final size was that the desired study outcome (non-inferiority or superiority) was shown in at least 80% of simulated data sets. As per the FDA guidance document on non-inferiority trials, non-inferiority was based on comparing the lower level of the 95% confidence interval to the non-inferiority margin for a given comparison. For example, if the non-inferiority margin for TB sensitivity is specified as -7%, the lower level of the 95% confidence interval of the difference in sensitivity between Xpert and Ultra must be lower than -7% in order to show non-inferiority.

65
Once a sample size was found to fulfil this criterion, at least two additional simulations were run using the same parameter inputs to verify the stability of the simulation result. If results were unstable between repeated simulations, the process was repeated with an increased number of simulated data sets (e.g., 50,000) per simulation. The same was done if the simulation results did not calibrate well with input parameters or if the histograms of output parameters did not have a smooth distribution. Sample size for TB detection (non-inferiority) Given a sensitivity for TB detection of 75% for Xpert MTB/RIF of and 85% for Ultra and a non-inferiority margin of 7%, the simulations showed that 48 smear-negative culture-positive cases would be required to show non-inferiority. Assuming that on average 30% of all TB cases are smear-negative and that 20% of all enrolled participants have TB, the total number of participants presumed to have TB that would need to be enrolled is 800. Sample size for RIF-resistance detection (non-inferiority) Given a sensitivity for RIF-resistance detection of 95% for both Xpert MTB/RIF and Ultra and a non-inferiority margin of 3%, the simulations showed that 185 RIF-resistant cases would be required to show non-inferiority. Given a specificity for RIF-resistance detection of 98% for both Xpert MTB/RIF and Ultra and a non-inferiority margin of 3%, the simulations showed that 125 RIF-sensitive cases would be required to show non-inferiority. Variability between sites and accounting for losses The populations from the trial sites will differ in their TB epidemic, particularly in respect to HIV prevalence and MDR prevalence. This means that the prevalence for the various study groups will vary from site to site. Trial sites with a high HIV prevalence will see more smear-negative, culture-positive patients and have a high MDR rate, but lower than for Eastern Europe. Due to the high HIV prevalence, it is also expected that a higher number of patients will have to be excluded from the analysis, as TB cannot be ruled out. The highest MDR rate will be expected from sites in Eastern Europe. At sites where there is a higher MDR prevalence, a higher smear-positivity rate is observed. In addition, it has to be considered that patients are lost-to-follow-up from the clinical study. In addition, some patients (particularly MDR patients) will be pre-treated and do not contribute to the accuracy calculations. To account for indeterminate results on any of the three tests (contaminated cultures, indeterminate/invalid Xpert MTB/RIF or Ultra) and pre-treated patients we inflate this number by 20% and 10% respectively, based on experience from previous studies. This leads to a final sample size of 1,143.
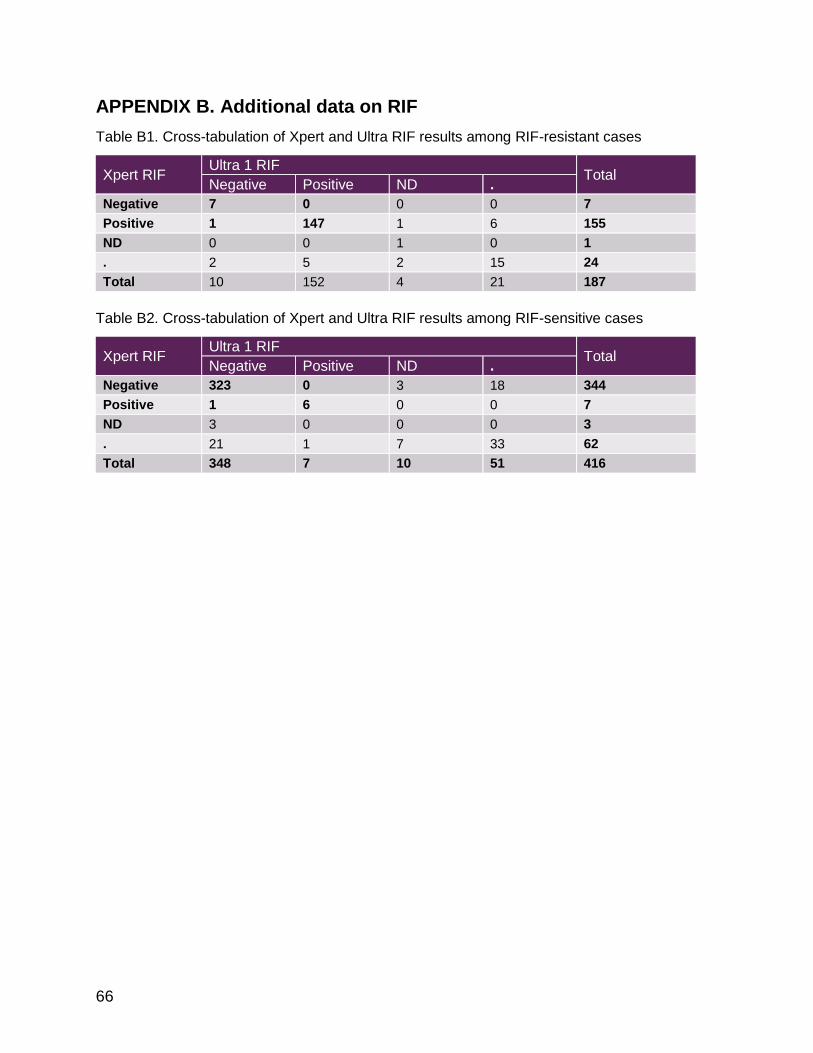
66
APPENDIX B. Additional data on RIF
Table B1. Cross-tabulation of Xpert and Ultra RIF results among RIF-resistant cases
Xpert RIF Ultra 1 RIF
Total Negative Positive ND .
Negative 7 0 0 0 7
Positive 1 147 1 6 155
ND 0 0 1 0 1
. 2 5 2 15 24
Total 10 152 4 21 187
Table B2. Cross-tabulation of Xpert and Ultra RIF results among RIF-sensitive cases
Xpert RIF Ultra 1 RIF
Total Negative Positive ND .
Negative 323 0 3 18 344
Positive 1 6 0 0 7
ND 3 0 0 0 3
. 21 1 7 33 62
Total 348 7 10 51 416

67
APPENDIX C. Line listings of patients with RIF discordant results
Table C1. Ultra “false-positives” for RIF detection
Red: Xpert or Ultra RIF-resistant results BEL: Belarus; CHI: China; DEL: New Delhi; GEO: Georgia; JBR: Johannesburg; MGIT: liquid culture result; LJ: solid culture result, Pos: positive; (pos): culture growth but identification not done for that particular culture; Neg: negative; Cont: contaminated, NA: not available; DST: MGIT drug susceptibility testing; Sens: RIF-sensitive; Xp: Xpert RIF result (were applicable); Ultra: Ultra RIF result (where applicable); RR: RIF-resistant; HIV: HIV status; TBHx: TB history (year treatment end where available); Seq: sequencing; Mutation: observed by sequencing (E. coli numbering convention); Confidence: mutation confidence of association with resistance (based upon systematic review of the literature and a statistical based likelihood and odds ratio approach)
Table C2. Ultra false-negatives for RIF detection
Red: Xpert RIF-resistant results, rpoB mutations detected by sequencing BEL: Belarus; CHI: China; DEL: New Delhi; GEO: Georgia; JBR: Johannesburg; MGIT: liquid culture result; LJ: solid culture result, Pos: positive; Neg: negative; DST: MGIT drug susceptibility testing; RR: RIF-resistant; Xp: Xpert RIF result (were applicable); Sens: RIF-sensitive; NA: not applicable; Ultra: Ultra RIF result (where applicable); Indet: RIF-indeterminate; HIV: HIV status; Seq: sequencing; Mutation: observed by sequencing (E. coli numbering convention); WT: wild type; Confidence: mutation confidence of association with resistance (based upon systematic review of the literature and a statistical based likelihood and odds ratio approach)
The rpoB sequencing at FIND sites was done for all discordant cases and the same number of non-discordant cases (results not shown). At CDRC sites, sequencing for RIF was done on one MTB positive isolate per participant independent of RIF results from DST or any Xpert testing. All results were available at the time of report preparation.
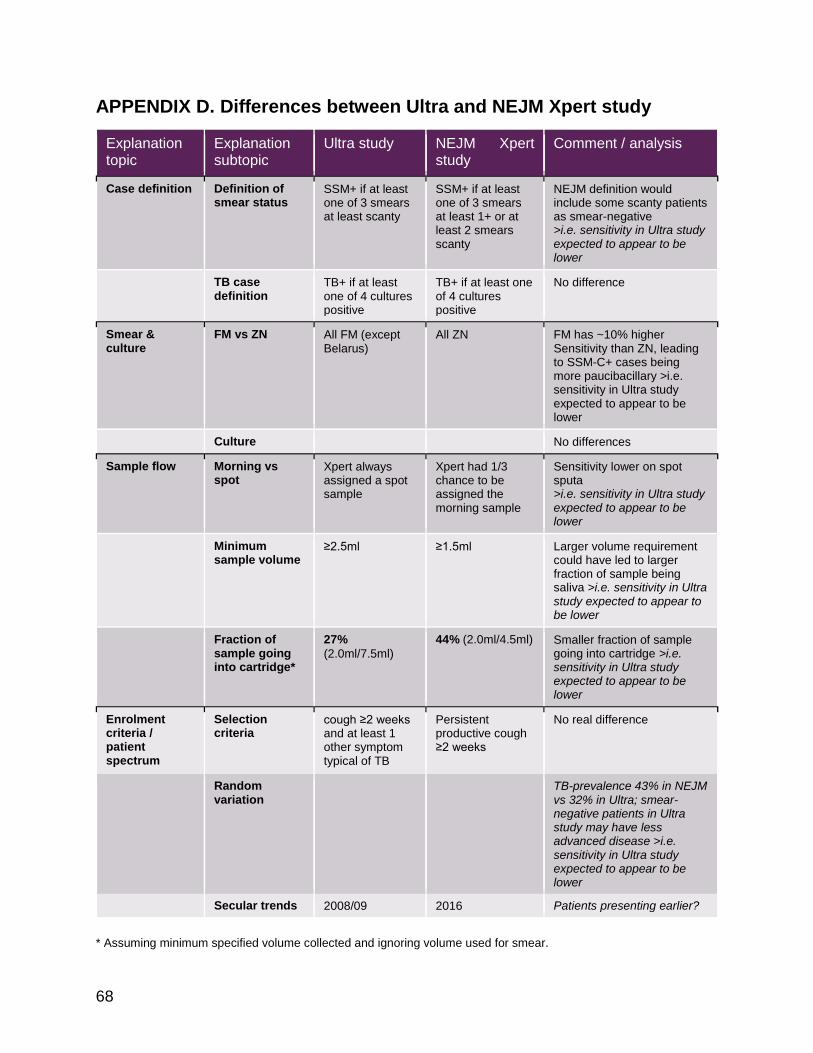
68
APPENDIX D. Differences between Ultra and NEJM Xpert study
* Assuming minimum specified volume collected and ignoring volume used for smear.
Explanation topic
Explanation subtopic
Ultra study NEJM Xpert study
Comment / analysis
Case definition Definition of smear status
SSM+ if at least one of 3 smears at least scanty
SSM+ if at least one of 3 smears at least 1+ or at least 2 smears scanty
NEJM definition would include some scanty patients as smear-negative >i.e. sensitivity in Ultra study expected to appear to be lower
TB case definition
TB+ if at least one of 4 cultures positive
TB+ if at least one of 4 cultures positive
No difference
Smear & culture
FM vs ZN All FM (except Belarus)
All ZN FM has ~10% higher Sensitivity than ZN, leading to SSM-C+ cases being more paucibacillary >i.e. sensitivity in Ultra study expected to appear to be lower
Culture
No differences
Sample flow Morning vs spot
Xpert always assigned a spot sample
Xpert had 1/3 chance to be assigned the morning sample
Sensitivity lower on spot sputa >i.e. sensitivity in Ultra study expected to appear to be lower
Minimum sample volume
≥2.5ml ≥1.5ml Larger volume requirement could have led to larger fraction of sample being saliva >i.e. sensitivity in Ultra study expected to appear to be lower
Fraction of sample going into cartridge*
27%
(2.0ml/7.5ml)
44% (2.0ml/4.5ml) Smaller fraction of sample going into cartridge >i.e. sensitivity in Ultra study expected to appear to be lower
Enrolment criteria / patient spectrum
Selection criteria
cough ≥2 weeks and at least 1 other symptom typical of TB
Persistent productive cough ≥2 weeks
No real difference
Random variation
TB-prevalence 43% in NEJM vs 32% in Ultra; smear-negative patients in Ultra study may have less advanced disease >i.e. sensitivity in Ultra study expected to appear to be lower
Secular trends 2008/09 2016 Patients presenting earlier?

69
APPENDIX E. Additional data on MTB sensitivity
Table E1. Xpert performance estimates across studies
Study Pooled Sens S-C+ Sens Spec RIF Sens RIF Spec
NEJM (2010) 92% (90-94) 73% (65-79) 99% (98-100) 98% (94-99) 98% (97-99)
Lancet (2011) 90% (88-92) 77% (72-81) 98% (97-99) 94% (91-97) 98% (97-99)
Cochrane (2014) 89% (85-92) 67% (60-74) 99% (98-99) 95% (90-97) 98% (97-99)
Ultra study 83% (79-86) 45% (35-54) 98% (97-99) 95% (91-98) 98% (96-99)
Figure E2. Reproduced from Cochrane review: Xpert performance estimates across studies
Figure 8. Forest plots of Xpert MTB/RIF for TB detection in studies reporting data for smear-negative
patients. We also used these data as a proxy for the accuracy of Xpert MTB/RIF used as an add-on test
following a negative smear microscopy result. TP = True Positive; FP = False Positive; FN = False Negative; TN
= True Negative. Between brackets the 95% CI of sensitivity and specificity. The figure shows the estimated
sensitivity and specificity of the study (blue square) and its 95% CI (black horizontal line).
In the meta-analysis, the pooled sensitivity was 67% (95% CrI
60% to 74%) and thepooled specificity was99% (95% CrI 98%
to 99%; 21 studies, 6950 participants; Table1). Therefore, 67%
of smear-negative culture-confirmed TB cases were detected us-
ing Xpert MTB/RIF following smear microscopy, increasing case
detection by 67% (95% CrI, 60% to 74%) in thisgroup.
Figure 9 presents thepooled and predicted sensitivity and speci-
ficity estimatestogether with thecredibleand prediction regions
for thisanalysis. Thesummary point isrelatively far from theup-
per left-handcorner of theplot, suggestinglower accuracyof Xpert
MTB/RIF when used asan add-on test than asareplacement test.
The95% credibleregion around thesummary valueof sensitivity
and specificity isrelatively wide.
20Xpert® MTB/RIF assay for pulmonary tuberculosis and rifampicin resistance in adults (Review)
Copyright © 2014 The Cochrane Collaboration. Published by John Wiley & Sons, Ltd.

70
Figure E3. Reproduced from Cochrane review: Summary ROC curve of Xpert performance
estimates across studies
Solid line/ellipse is 95% confidence interval, broken line/ellipse is 95% prediction interval. Red lines indicate lower levels of prediction interval for sensitivity and specificity.
Figure E4. Sensitivity depending on sputum bacillary load (time to culture positivity)
Lines are running-line least squares (mean) smoothers using a bandwidth of 0.8 (Cleveland, JASA, 1979)

71
Figure E5. Distribution days to culture-positivity A across all study sites, B by HIV- status and C
by smear status
A
B C
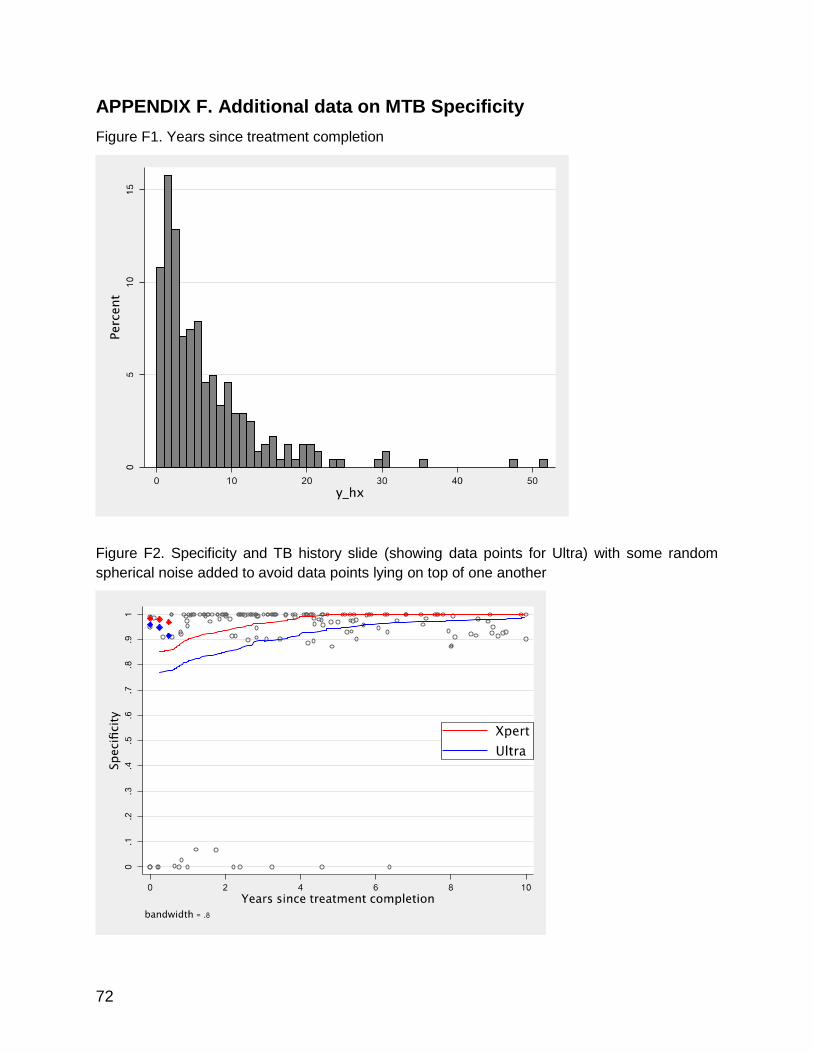
72
APPENDIX F. Additional data on MTB Specificity
Figure F1. Years since treatment completion
Figure F2. Specificity and TB history slide (showing data points for Ultra) with some random
spherical noise added to avoid data points lying on top of one another

73
APPENDIX G. Culture contamination and smear-positive/culture-
negative rates
Table G1. Culture contamination and smear-positive/culture-negative rates
Site MGIT on S2 MGIT on S3 LJ on S2 LJ on S3 S+/C-
Belarus 4.9% 4.9% 2.4% 0.0% 0.0%
Brazil 2.4% 3.2% 13.6% 11.0% 1.0%
Cape Town 2.7% 1.3% 4.7% 4.0% 0.0%
China 0.0% 0.0% 3.0% 3.0% 0.0%
Georgia 2.4% 1.7% 7.9% 10.7% 0.0%
Jo’burg 6.3% 14.5% 2.1% 4.4% 1.0%
Kenya 2.9% 5.2% 22.8% 21.6% 1.7%
Mumbai 0.0% 0.0% 0.0% 0.0% 0.0%
New Delhi 5.3% 5.3% 0.0% 2.2% 5.8%
Uganda 11.6% 6.1% 3.3% 2.8% 0.0%
Pooled 4.5% 4.6% 7.2% 7.7% 0.9%
Note: Culture contamination rate is shown for case detection group; S+C- rate is shown as proportion of patients testing culture-negative and smear-positive (combining all culture and smear results)

74
APPENDIX H. Line listings of patients with MTB discordant results
Table H1. Ultra false-positives for TB detection
Gray: Patients for whom clinical information suggested TB (X-ray, diagnosis at follow-up, anti-TB therapy, symptoms compared to baseline). Red: Xpert positive; sequencing was successful and detected TB DNA. *ID 730058 was culture-positive after 1 month (outside study) BEL: Belarus; BOM: Mumbai; CPT: Cape Town; DEL: New Delhi; GEO: Georgia; JBR: Johannesburg; KEN: Kenya; UGN: Uganda; MGIT: liquid culture result; LJ: solid culture result, Pos: positive; Neg: negative; Cont: contaminated, NA: not available; Xp: Xpert result; Ultra: Ultra semi-quantitative result (where applicable); TBHx: TB history (year treatment end where available); HIV: HIV status; CXR: Chest X-ray (where done); TB+: TB likely; Not TB: TB unlikely; FU_DX: diagnosis at follow-up; LTFU: lost to follow-up; PTB: pulmonary TB; FU_ATT: anti-TB therapy at follow-up; ATT: on anti-TB therapy, FU_Sx: symptoms at follow.up; No sx: symptoms completely recovered; Imprvd: symptoms improved; Seq: sequencing results; MTB+: MTB DNA detected; Not interp: results not interpretable (in cases where the quality of DNA is poor or due to the presence of inhibitors the sequencing results show a score of less than 95%; as per laboratory protocol any score below 95% is to be reported as Non-interpretable (NI); the ideal score being 100 for a valid result; all NI were repeated twice before reporting them as N)
Sequencing for MTB was done only at FIND sites. There were overall 44 false-positives and sequencing was done for 19 cases (see Table H1). Among the 49 false-negatives, 23 were sent for sequencing and results were available for 14 at the time of report preparation (see Table H2). In both groups, the same number of non-discordant cases were sent for sequencing. Outstanding results will be available by end-February 2017.

75
Table H2. Ultra false-negatives for TB detection
Gray: Patients with only negative Xpert and Ultra results Red: Xpert positive; Ultra positive BEL: Belarus; BOM: Mumbai; BRA: Brazil; CHI: China; CPT: Cape Town; DEL: New Delhi; GEO: Georgia; JBR: Johannesburg; KEN: Kenya; UGN: Uganda; Pos: positive; Neg: negative; MGIT: liquid culture result; TTP: time to positivity for corresponding culture (in days); LJ: solid culture result; (pos): culture growth but identification not done for that particular culture; Cont: contaminated; NA: not available; Xp: Xpert result; Ultra: Ultra semi-quantitative result (where applicable); TBHx: TB history (year treatment end where available); HIV: HIV status; Seq: sequencing results; MTB+: MTB DNA detected; *: sequencing in progress
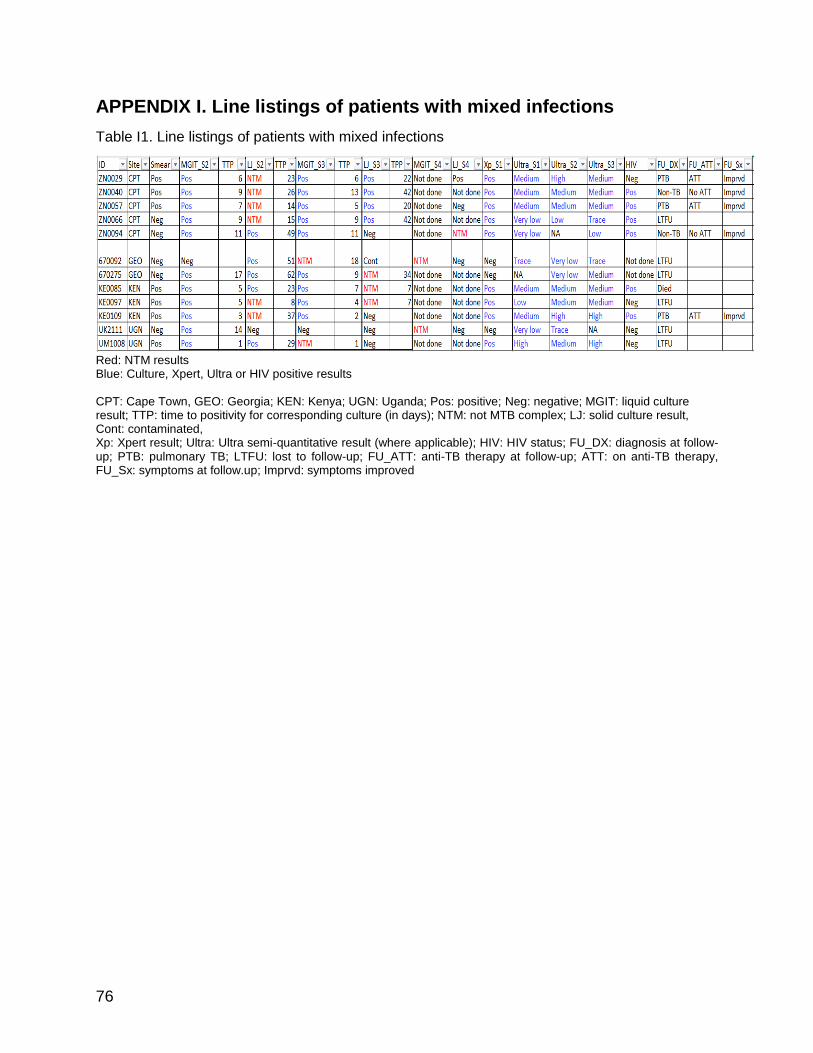
76
APPENDIX I. Line listings of patients with mixed infections
Table I1. Line listings of patients with mixed infections
Red: NTM results Blue: Culture, Xpert, Ultra or HIV positive results CPT: Cape Town, GEO: Georgia; KEN: Kenya; UGN: Uganda; Pos: positive; Neg: negative; MGIT: liquid culture result; TTP: time to positivity for corresponding culture (in days); NTM: not MTB complex; LJ: solid culture result, Cont: contaminated, Xp: Xpert result; Ultra: Ultra semi-quantitative result (where applicable); HIV: HIV status; FU_DX: diagnosis at follow-up; PTB: pulmonary TB; LTFU: lost to follow-up; FU_ATT: anti-TB therapy at follow-up; ATT: on anti-TB therapy, FU_Sx: symptoms at follow.up; Imprvd: symptoms improved

77
APPENDIX J. Population-level projections
Table J1. Population-level projection using TB prevalence of 15%
Note: Accuracy estimates are based on S-C+ rate among TB cases 30% and prevalence of prior TB episode 21% (as in Ultra study) 1 Computed as (# Ultra FPs - # Xpert FPs)/(# Ultra TPs - # Xpert TPs). Can be interpreted as ”How many additional FPs I get over and above Xpert per additional TP detected with Ultra (over and above Xpert)”.
Table J2. Population-level projection using TB prevalence of 15% among HIV-positive patients
Note: Accuracy estimates are based on S-C+ rate among TB-HIV cases 38% and prevalence of prior TB episode 21% (as in Ultra study) 1 Computed as (# Ultra FPs - # Xpert FPs)/(# Ultra TPs - # Xpert TPs). Can be interpreted as ”How many additional FPs I get over and above Xpert per additional TP detected with Ultra (over and above Xpert)”.

78
Table J3. Population-level projection using TB prevalence of 10%
Note: Accuracy estimates are based on S-C+ rate among TB cases 30% and prevalence of prior TB episode 21% (as in Ultra study) 1 Computed as (# Ultra FPs - # Xpert FPs)/(# Ultra TPs - # Xpert TPs). Can be interpreted as ‘How many additional FPs I get over and above Xpert per additional TP detected with Ultra (over and above Xpert)’.
Table J4. Population-level projection using TB prevalence of 20%
Note: Accuracy estimates are based on S-C+ rate among TB cases 30% and prevalence of prior TB episode 21% (as in Ultra study) 1 Computed as (# Ultra FPs - # Xpert FPs)/(# Ultra TPs - # Xpert TPs). Can be interpreted as ”How many additional FPs I get over and above Xpert per additional TP detected with Ultra (over and above Xpert)”.

79
Table J5. Population-level projection using TB prevalence of 5%
Note: Accuracy estimates are based on S-C+ rate among TB cases 49% (as in prevalence surveys); prevalence of prior TB episode 21% (Ultra study) 1 Computed as (# Ultra FPs - # Xpert FPs)/(# Ultra TPs - # Xpert TPs). Can be interpreted as ”How many additional FPs I get over and above Xpert per additional TP detected with Ultra (over and above Xpert)”.
Table J6. Population-level projection using TB prevalence of 0.5%
Note: Accuracy estimates are based on S-C+ rate among TB cases 49% (as in prevalence surveys); prevalence of prior TB episode 21% (Ultra study) 1 Computed as (# Ultra FPs - # Xpert FPs)/(# Ultra TPs - # Xpert TPs). Can be interpreted as ”How many additional FPs I get over and above Xpert per additional TP detected with Ultra (over and above Xpert)”.

80
APPENDIX K. Predictive values
Table K1. Predictive values for MTB detection with varying pre-test probability
Prevalence (pre-test probability)
Test
1% 5% 10% 20% 30% 60%
Xpert PPV 29% 68% 82% 91% 95% 98%
NPV 100% 99% 98% 96% 93% 79%
Ultra PPV 15% 47% 65% 81% 88% 96%
NPV 100% 99% 99% 97% 95% 84%
Ultra w/o trace PPV 22% 60% 76% 88% 93% 98%
NPV 100% 99% 98% 96% 94% 81%
Ultra cond. trace PPV 18% 54% 71% 85% 91% 97%
NPV 100% 99% 99% 97% 95% 84%
Note: Accuracy estimates are pooled estimates with 30% of TB cases being smear-negative/culture-positive.
Table K2. Predictive values for MTB detection in smear-negative individuals with varying pre-test
probability
Prevalence (pre-test probability)
Test
10% 15% 20%
Xpert PPV 71% 80% 85%
NPV 94% 91% 88%
Ultra PPV 57% 67% 75%
NPV 96% 93% 91%
Ultra w/o trace PPV 66% 76% 81%
NPV 95% 92% 89%
Ultra cond. trace PPV 63% 73% 79%
NPV 96% 93% 91%
Note: Accuracy estimates are pooled estimates with 30% of TB cases being smear-negative/culture-positive.

81
Table K3. Predictive values for MTB detection in smear-negative individuals with varying pre-test
probability
Prevalence (pre-test probability)
Test
10% 15% 20%
Xpert PPV 92% 95% 96%
NPV 97% 96% 94%
Ultra PPV 65% 75% 81%
NPV 99% 98% 97%
Ultra w/o trace PPV 80% 87% 90%
NPV 98% 97% 96%
Ultra cond. trace PPV 76% 84% 88%
NPV 99% 98% 97%
Note: Accuracy estimates are pooled estimates with 38% of TB cases being smear-negative/culture-positive.

82
APPENDIX L. Semiquantitative results
Figure L1. Ultra semiquantitative results compared to culture time to positivity
X-axis is time to culture positivity. Y-axis is showing Ultra semi-quantitative results (5=high, 4=medium, 3=low, 2=very low, 1=trace)
Figure L2. Ultra semiquantitative results compared to Xpert semiquantitative results
Some random spherical noise has been added to avoid data points lying on top of one another.