confidential offering - do not disturb tenant! · expanded profile. 2000-2010 census, 2018...
TRANSCRIPT

PROPERTY HIGHLIGHTS SITE PLAN / AVAILABILITY AERIAL CONTACT DEMOGRAPHICS
Brian [email protected]
Brian [email protected]
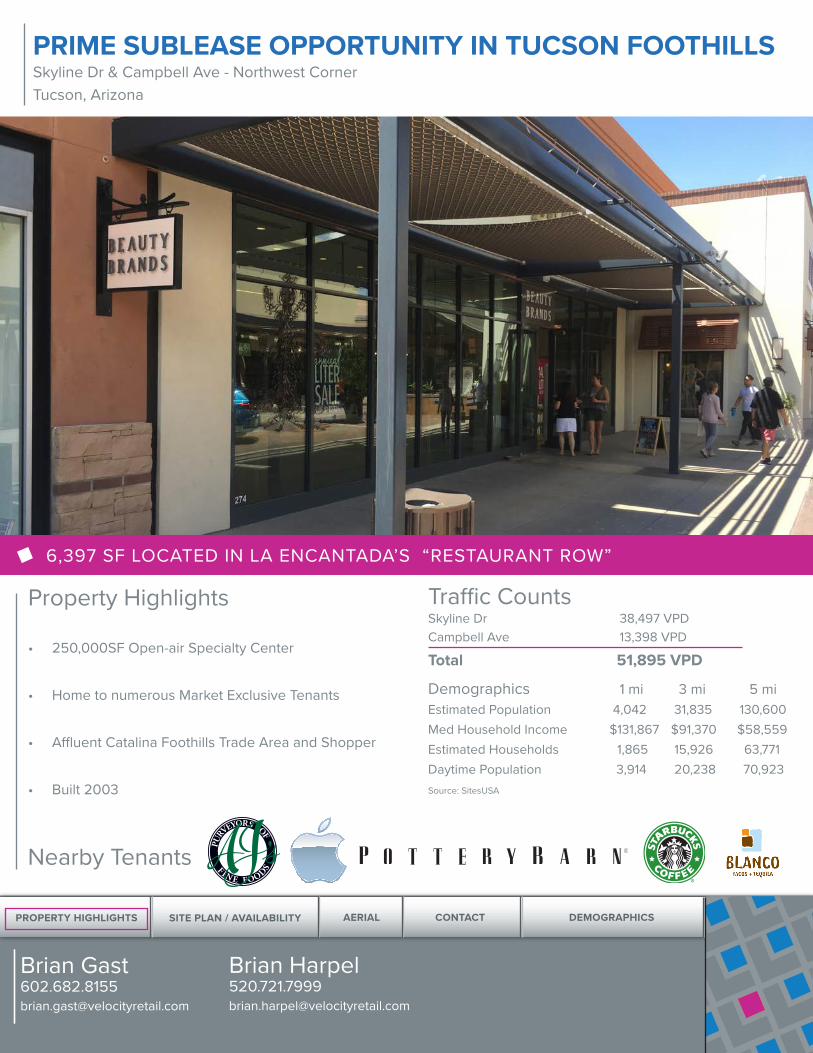
PRIME SUBLEASE OPPORTUNITY IN TUCSON FOOTHILLSSkyline Dr & Campbell Ave - Northwest CornerTucson, Arizona
CONFIDENTIAL OFFERING - DO NOT DISTURB TENANT!
PROPERTY HIGHLIGHTS SITE PLAN / AVAILABILITY AERIAL CONTACT DEMOGRAPHICS
Brian [email protected]
Brian [email protected]
Property Highlights
• 250,000SF Open-air Specialty Center
• Home to numerous Market Exclusive Tenants
• Affluent Catalina Foothills Trade Area and Shopper
• Built 2003
Traffic CountsSkyline Dr 38,497 VPDCampbell Ave 13,398 VPD
Total 51,895 VPD
Demographics 1 mi 3 mi 5 miEstimated Population 4,042 31,835 130,600Med Household Income $131,867 $91,370 $58,559Estimated Households 1,865 15,926 63,771Daytime Population 3,914 20,238 70,923Source: SitesUSA
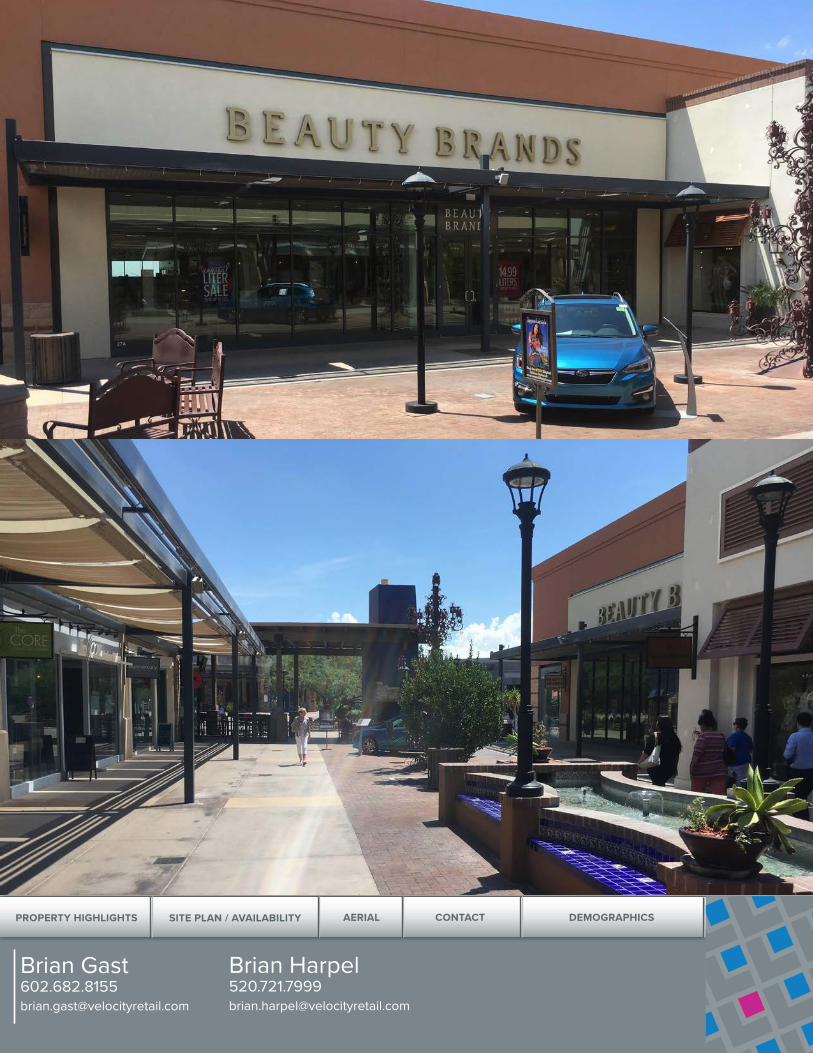
6,397 SF LOCATED IN LA ENCANTADA’S “RESTAURANT ROW”
PRIME SUBLEASE OPPORTUNITY IN TUCSON FOOTHILLSSkyline Dr & Campbell Ave - Northwest CornerTucson, Arizona
Nearby Tenants

PROPERTY HIGHLIGHTS SITE PLAN / AVAILABILITY AERIAL CONTACT DEMOGRAPHICS
Brian [email protected]
Brian [email protected]

PROPERTY HIGHLIGHTS SITE PLAN / AVAILABILITY AERIAL CONTACT DEMOGRAPHICS
Brian [email protected]
Brian [email protected]
PROPERTY HIGHLIGHTS SITE PLAN / AVAILABILITY AERIAL CONTACT DEMOGRAPHICS
Brian [email protected]
Brian [email protected]

PROPERTY HIGHLIGHTS SITE PLAN / AVAILABILITY AERIAL CONTACT DEMOGRAPHICS
Brian [email protected]
Brian [email protected]
Demographic Source: Applied Geographic Solutions 04/2018, TIGER Geography page 1 of 5©2018, Sites USA, Chandler, Arizona, 480-491-1112
Thi
s re
port
was
pro
duce
d us
ing
data
from
priv
ate
and
gove
rnm
ent s
ourc
es d
eem
ed to
be
relia
ble.
The
info
rmat
ion
here
in is
pro
vide
d w
ithou
t rep
rese
ntat
ion
or w
arra
nty.
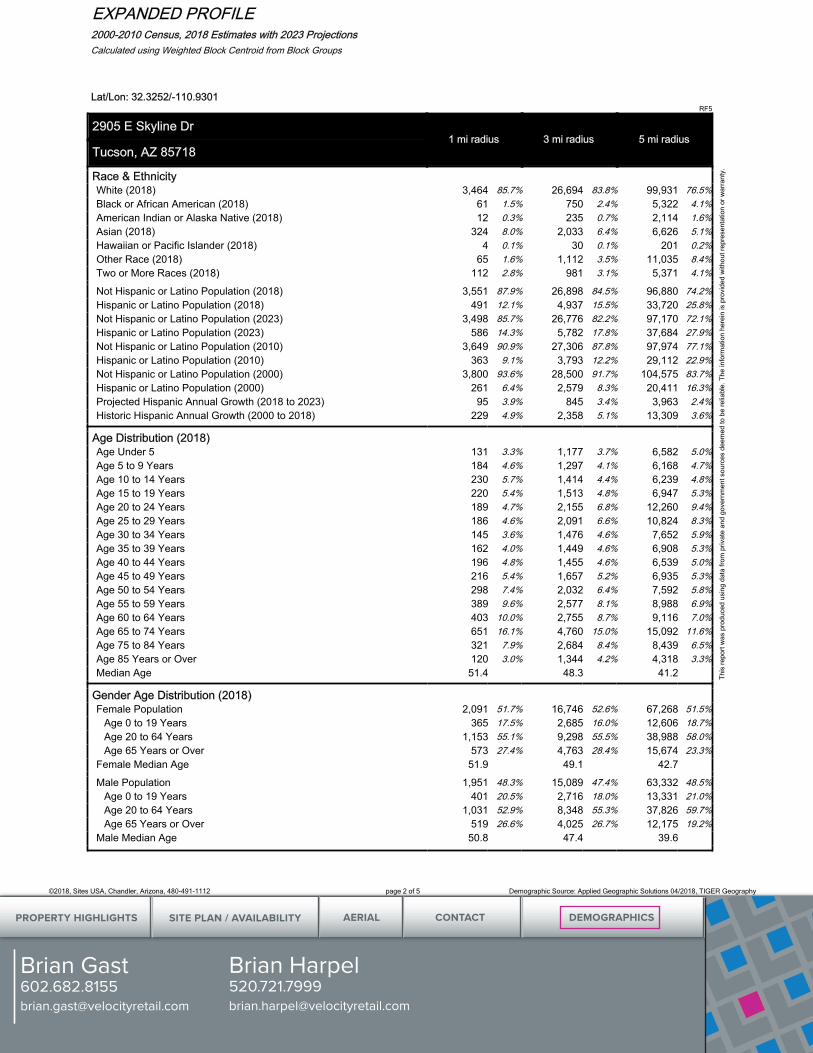
EXPANDED PROFILE2000-2010 Census, 2018 Estimates with 2023 ProjectionsCalculated using Weighted Block Centroid from Block Groups
Lat/Lon: 32.3252/-110.9301RF5
2905 E Skyline Dr1 mi radius 3 mi radius 5 mi radius
Tucson, AZ 85718
PopulationEstimated Population (2018) 4,042 31,835 130,600Projected Population (2023) 4,084 32,558 134,853Census Population (2010) 4,013 31,099 127,086Census Population (2000) 4,062 31,078 124,986Projected Annual Growth (2018 to 2023) 42 0.2% 723 0.5% 4,253 0.7%
Historical Annual Growth (2010 to 2018) 29 0.1% 736 0.3% 3,514 0.3%
Historical Annual Growth (2000 to 2010) -49 -0.1% 21 - 2,100 0.2%
Estimated Population Density (2018) 1,286 psm 1,126 psm 1,664 psm
Trade Area Size 3.14 sq mi 28.26 sq mi 78.51 sq mi
HouseholdsEstimated Households (2018) 1,865 15,926 63,771Projected Households (2023) 1,898 16,413 66,364Census Households (2010) 1,786 14,965 59,756Census Households (2000) 1,732 14,549 58,041Estimated Households with Children (2018) 386 20.7% 2,713 17.0% 12,480 19.6%
Estimated Average Household Size (2018) 2.16 1.98 2.02
Average Household IncomeEstimated Average Household Income (2018) $173,286 $127,872 $78,201Projected Average Household Income (2023) $215,094 $155,555 $91,429
Estimated Average Family Income (2018) $215,519 $178,115 $108,890
Median Household IncomeEstimated Median Household Income (2018) $131,867 $91,370 $58,559Projected Median Household Income (2023) $150,533 $104,483 $66,699
Estimated Median Family Income (2018) $180,822 $139,407 $89,091
Per Capita IncomeEstimated Per Capita Income (2018) $79,974 $64,061 $38,300Projected Per Capita Income (2023) $99,965 $78,507 $45,105Estimated Per Capita Income 5 Year Growth $19,991 25.0% $14,446 22.6% $6,806 17.8%
Estimated Average Household Net Worth (2018) $2,067,909 $1,418,923 $802,649
Daytime Demos (2018)Total Businesses 360 2,259 7,524Total Employees 3,914 20,238 70,923Company Headquarter Businesses 2 0.7% 13 0.6% 26 0.3%
Company Headquarter Employees 317 8.1% 770 3.8% 3,255 4.6%
Employee Population per Business 10.9 9.0 9.4Residential Population per Business 11.2 14.1 17.4
PROPERTY HIGHLIGHTS SITE PLAN / AVAILABILITY AERIAL CONTACT DEMOGRAPHICS
Brian [email protected]
Brian [email protected]
Demographic Source: Applied Geographic Solutions 04/2018, TIGER Geography page 2 of 5©2018, Sites USA, Chandler, Arizona, 480-491-1112
Thi
s re
port
was
pro
duce
d us
ing
data
from
priv
ate
and
gove
rnm
ent s
ourc
es d
eem
ed to
be
relia
ble.
The
info
rmat
ion
here
in is
pro
vide
d w
ithou
t rep
rese
ntat
ion
or w
arra
nty.
EXPANDED PROFILE2000-2010 Census, 2018 Estimates with 2023 ProjectionsCalculated using Weighted Block Centroid from Block Groups
Lat/Lon: 32.3252/-110.9301RF5
2905 E Skyline Dr1 mi radius 3 mi radius 5 mi radius
Tucson, AZ 85718
Race & EthnicityWhite (2018) 3,464 85.7% 26,694 83.8% 99,931 76.5%Black or African American (2018) 61 1.5% 750 2.4% 5,322 4.1%American Indian or Alaska Native (2018) 12 0.3% 235 0.7% 2,114 1.6%Asian (2018) 324 8.0% 2,033 6.4% 6,626 5.1%Hawaiian or Pacific Islander (2018) 4 0.1% 30 0.1% 201 0.2%Other Race (2018) 65 1.6% 1,112 3.5% 11,035 8.4%Two or More Races (2018) 112 2.8% 981 3.1% 5,371 4.1%
Not Hispanic or Latino Population (2018) 3,551 87.9% 26,898 84.5% 96,880 74.2%Hispanic or Latino Population (2018) 491 12.1% 4,937 15.5% 33,720 25.8%Not Hispanic or Latino Population (2023) 3,498 85.7% 26,776 82.2% 97,170 72.1%Hispanic or Latino Population (2023) 586 14.3% 5,782 17.8% 37,684 27.9%Not Hispanic or Latino Population (2010) 3,649 90.9% 27,306 87.8% 97,974 77.1%Hispanic or Latino Population (2010) 363 9.1% 3,793 12.2% 29,112 22.9%Not Hispanic or Latino Population (2000) 3,800 93.6% 28,500 91.7% 104,575 83.7%Hispanic or Latino Population (2000) 261 6.4% 2,579 8.3% 20,411 16.3%Projected Hispanic Annual Growth (2018 to 2023) 95 3.9% 845 3.4% 3,963 2.4%Historic Hispanic Annual Growth (2000 to 2018) 229 4.9% 2,358 5.1% 13,309 3.6%
Age Distribution (2018)Age Under 5 131 3.3% 1,177 3.7% 6,582 5.0%Age 5 to 9 Years 184 4.6% 1,297 4.1% 6,168 4.7%Age 10 to 14 Years 230 5.7% 1,414 4.4% 6,239 4.8%Age 15 to 19 Years 220 5.4% 1,513 4.8% 6,947 5.3%Age 20 to 24 Years 189 4.7% 2,155 6.8% 12,260 9.4%Age 25 to 29 Years 186 4.6% 2,091 6.6% 10,824 8.3%Age 30 to 34 Years 145 3.6% 1,476 4.6% 7,652 5.9%Age 35 to 39 Years 162 4.0% 1,449 4.6% 6,908 5.3%Age 40 to 44 Years 196 4.8% 1,455 4.6% 6,539 5.0%Age 45 to 49 Years 216 5.4% 1,657 5.2% 6,935 5.3%Age 50 to 54 Years 298 7.4% 2,032 6.4% 7,592 5.8%Age 55 to 59 Years 389 9.6% 2,577 8.1% 8,988 6.9%Age 60 to 64 Years 403 10.0% 2,755 8.7% 9,116 7.0%Age 65 to 74 Years 651 16.1% 4,760 15.0% 15,092 11.6%Age 75 to 84 Years 321 7.9% 2,684 8.4% 8,439 6.5%Age 85 Years or Over 120 3.0% 1,344 4.2% 4,318 3.3%Median Age 51.4 48.3 41.2
Gender Age Distribution (2018)Female Population 2,091 51.7% 16,746 52.6% 67,268 51.5%
Age 0 to 19 Years 365 17.5% 2,685 16.0% 12,606 18.7%Age 20 to 64 Years 1,153 55.1% 9,298 55.5% 38,988 58.0%Age 65 Years or Over 573 27.4% 4,763 28.4% 15,674 23.3%
Female Median Age 51.9 49.1 42.7
Male Population 1,951 48.3% 15,089 47.4% 63,332 48.5%Age 0 to 19 Years 401 20.5% 2,716 18.0% 13,331 21.0%Age 20 to 64 Years 1,031 52.9% 8,348 55.3% 37,826 59.7%Age 65 Years or Over 519 26.6% 4,025 26.7% 12,175 19.2%
Male Median Age 50.8 47.4 39.6

PROPERTY HIGHLIGHTS SITE PLAN / AVAILABILITY AERIAL CONTACT DEMOGRAPHICS
Brian [email protected]
Brian [email protected]
Demographic Source: Applied Geographic Solutions 04/2018, TIGER Geography page 3 of 5©2018, Sites USA, Chandler, Arizona, 480-491-1112
Thi
s re
port
was
pro
duce
d us
ing
data
from
priv
ate
and
gove
rnm
ent s
ourc
es d
eem
ed to
be
relia
ble.
The
info
rmat
ion
here
in is
pro
vide
d w
ithou
t rep
rese
ntat
ion
or w
arra
nty.
EXPANDED PROFILE2000-2010 Census, 2018 Estimates with 2023 ProjectionsCalculated using Weighted Block Centroid from Block Groups
Lat/Lon: 32.3252/-110.9301RF5
2905 E Skyline Dr1 mi radius 3 mi radius 5 mi radius
Tucson, AZ 85718
Household Income Distribution (2018)HH Income $200,000 or More 578 31.0% 2,984 18.7% 5,156 8.1%HH Income $150,000 to $199,999 230 12.3% 1,424 8.9% 3,331 5.2%HH Income $100,000 to $149,999 350 18.8% 2,432 15.3% 6,753 10.6%HH Income $75,000 to $99,999 132 7.1% 1,430 9.0% 5,700 8.9%HH Income $50,000 to $74,999 201 10.8% 2,343 14.7% 10,047 15.8%HH Income $35,000 to $49,999 186 10.0% 1,754 11.0% 9,023 14.1%HH Income $25,000 to $34,999 49 2.6% 1,018 6.4% 6,502 10.2%HH Income $15,000 to $24,999 78 4.2% 1,222 7.7% 7,371 11.6%HH Income Under $15,000 61 3.3% 1,321 8.3% 9,889 15.5%
HH Income $35,000 or More 1,677 89.9% 12,365 77.6% 40,010 62.7%HH Income $75,000 or More 1,290 69.2% 8,269 51.9% 20,940 32.8%
Housing (2018)Total Housing Units 2,103 17,557 69,323Housing Units Occupied 1,865 88.7% 15,926 90.7% 63,771 92.0%
Housing Units Owner-Occupied 1,501 80.5% 10,226 64.2% 31,875 50.0%Housing Units, Renter-Occupied 364 19.5% 5,700 35.8% 31,896 50.0%
Housing Units, Vacant 237 11.3% 1,631 9.3% 5,551 8.0%
Marital Status (2018)Never Married 745 21.3% 7,549 27.0% 40,877 36.6%Currently Married 2,093 59.8% 14,444 51.7% 43,049 38.6%Separated 131 3.7% 913 3.3% 4,456 4.0%Widowed 174 5.0% 1,630 5.8% 7,033 6.3%Divorced 353 10.1% 3,411 12.2% 16,195 14.5%
Household Type (2018)Population Family 3,278 81.1% 23,016 72.3% 88,465 67.7%Population Non-Family 757 18.7% 8,537 26.8% 40,574 31.1%Population Group Quarters 7 0.2% 282 0.9% 1,561 1.2%
Family Households 1,222 65.5% 8,694 54.6% 31,257 49.0%Non-Family Households 643 34.5% 7,232 45.4% 32,514 51.0%Married Couple with Children 309 14.8% 1,927 13.3% 6,877 16.0%Average Family Household Size 2.7 2.6 2.8
Household Size (2018)1 Person Households 536 28.8% 6,094 38.3% 26,245 41.2%2 Person Households 849 45.5% 6,518 40.9% 22,278 34.9%3 Person Households 219 11.7% 1,638 10.3% 7,366 11.6%4 Person Households 178 9.5% 1,110 7.0% 4,738 7.4%5 Person Households 62 3.4% 388 2.4% 1,964 3.1%6 or More Person Households 20 1.1% 177 1.1% 1,181 1.9%
Household Vehicles (2018)Households with 0 Vehicles Available 31 1.6% 655 4.1% 6,321 9.9%Households with 1 Vehicles Available 559 30.0% 6,012 37.8% 26,298 41.2%Households with 2 or More Vehicles Available 1,275 68.4% 9,259 58.1% 31,152 48.9%
Total Vehicles Available 3,879 29,155 102,538Average Vehicles Per Household 2.1 1.8 1.6

PROPERTY HIGHLIGHTS SITE PLAN / AVAILABILITY AERIAL CONTACT DEMOGRAPHICS
Brian [email protected]
Brian [email protected]
Demographic Source: Applied Geographic Solutions 04/2018, TIGER Geography page 4 of 5©2018, Sites USA, Chandler, Arizona, 480-491-1112
Thi
s re
port
was
pro
duce
d us
ing
data
from
priv
ate
and
gove
rnm
ent s
ourc
es d
eem
ed to
be
relia
ble.
The
info
rmat
ion
here
in is
pro
vide
d w
ithou
t rep
rese
ntat
ion
or w
arra
nty.
EXPANDED PROFILE2000-2010 Census, 2018 Estimates with 2023 ProjectionsCalculated using Weighted Block Centroid from Block Groups
Lat/Lon: 32.3252/-110.9301RF5
2905 E Skyline Dr1 mi radius 3 mi radius 5 mi radius
Tucson, AZ 85718
Labor Force (2018)Estimated Labor Population Age 16 Years or Over 3,450 27,673 110,499Estimated Civilian Employed 1,782 51.6% 15,562 56.2% 63,719 57.7%Estimated Civilian Unemployed 22 0.7% 343 1.2% 2,507 2.3%Estimated in Armed Forces - - 38 0.1% 182 0.2%Estimated Not in Labor Force 1,646 47.7% 11,730 42.4% 44,091 39.9%Unemployment Rate 0.7% 1.2% 2.3%
Occupation (2015)Occupation: Population Age 16 Years or Over 1,775 15,494 63,838Management, Business, Financial Operations 389 21.9% 2,954 19.1% 8,705 13.6%Professional, Related 761 42.9% 6,075 39.2% 19,356 30.3%Service 169 9.5% 1,991 12.9% 12,816 20.1%Sales, Office 378 21.3% 3,443 22.2% 14,934 23.4%Farming, Fishing, Forestry - - 10 0.1% 77 0.1%Construct, Extraction, Maintenance 36 2.0% 525 3.4% 3,756 5.9%Production, Transport Material Moving 43 2.4% 496 3.2% 4,194 6.6%
White Collar Workers 1,528 86.1% 12,472 80.5% 42,995 67.4%Blue Collar Workers 248 13.9% 3,022 19.5% 20,843 32.6%
Consumer Expenditure (2018)Total Household Expenditure $196 M $1.33 B $3.71 B
Total Non-Retail Expenditure $106 M 53.9% $710 M 53.4% $1.95 B 52.6%Total Retail Expenditure $90.2 M 46.1% $620 M 46.6% $1.76 B 47.4%
Apparel $6.93 M 3.5% $46.8 M 3.5% $130 M 3.5%Contributions $11.3 M 5.8% $71.1 M 5.3% $173 M 4.7%Education $9.12 M 4.7% $57.9 M 4.4% $144 M 3.9%Entertainment $11.2 M 5.7% $75.4 M 5.7% $207 M 5.6%Food and Beverages $26.8 M 13.7% $186 M 14.0% $539 M 14.5%Furnishings and Equipment $7.15 M 3.7% $47.5 M 3.6% $127 M 3.4%Gifts $5.91 M 3.0% $38.0 M 2.9% $96.3 M 2.6%Health Care $14.2 M 7.3% $100 M 7.5% $297 M 8.0%Household Operations $6.50 M 3.3% $42.0 M 3.2% $108 M 2.9%Miscellaneous Expenses $2.73 M 1.4% $18.9 M 1.4% $54.6 M 1.5%Personal Care $2.48 M 1.3% $17.0 M 1.3% $48.0 M 1.3%Personal Insurance $1.76 M 0.9% $11.3 M 0.8% $28.5 M 0.8%Reading $442 K 0.2% $3.00 M 0.2% $8.33 M 0.2%Shelter $40.9 M 20.9% $277 M 20.9% $771 M 20.7%Tobacco $892 K 0.5% $6.74 M 0.5% $22.2 M 0.6%Transportation $34.4 M 17.6% $238 M 17.9% $685 M 18.4%Utilities $13.0 M 6.7% $92.3 M 6.9% $276 M 7.4%
Educational Attainment (2018)Adult Population Age 25 Years or Over 3,087 24,279 92,404Elementary (Grade Level 0 to 8) 10 0.3% 252 1.0% 2,858 3.1%Some High School (Grade Level 9 to 11) 39 1.3% 558 2.3% 4,327 4.7%High School Graduate 208 6.7% 2,966 12.2% 17,094 18.5%Some College 410 13.3% 3,918 16.1% 21,050 22.8%Associate Degree Only 138 4.5% 1,401 5.8% 6,439 7.0%Bachelor Degree Only 884 28.6% 6,994 28.8% 21,016 22.7%Graduate Degree 1,399 45.3% 8,191 33.7% 19,619 21.2%

PROPERTY HIGHLIGHTS SITE PLAN / AVAILABILITY AERIAL CONTACT DEMOGRAPHICS
Brian [email protected]
Brian [email protected]
Demographic Source: Applied Geographic Solutions 04/2018, TIGER Geography page 5 of 5©2018, Sites USA, Chandler, Arizona, 480-491-1112
Thi
s re
port
was
pro
duce
d us
ing
data
from
priv
ate
and
gove
rnm
ent s
ourc
es d
eem
ed to
be
relia
ble.
The
info
rmat
ion
here
in is
pro
vide
d w
ithou
t rep
rese
ntat
ion
or w
arra
nty.
EXPANDED PROFILE2000-2010 Census, 2018 Estimates with 2023 ProjectionsCalculated using Weighted Block Centroid from Block Groups
Lat/Lon: 32.3252/-110.9301RF5
2905 E Skyline Dr1 mi radius 3 mi radius 5 mi radius
Tucson, AZ 85718
Units In Structure (2015)1 Detached Unit 1,408 78.9% 9,473 63.3% 30,746 51.5%1 Attached Unit 122 6.8% 1,627 10.9% 7,162 12.0%2 to 4 Units 48 2.7% 648 4.3% 4,673 7.8%5 to 9 Units 176 9.9% 1,375 9.2% 4,607 7.7%10 to 19 Units 23 1.3% 883 5.9% 4,257 7.1%20 to 49 Units 14 0.8% 490 3.3% 2,976 5.0%50 or More Units 37 2.1% 821 5.5% 4,425 7.4%Mobile Home or Trailer 32 1.8% 519 3.5% 4,941 8.3%Other Structure 1 0.1% 5 - 60 0.1%
Homes Built By Year (2015)Homes Built 2010 or later 41 2.3% 181 1.2% 356 0.6%Homes Built 2000 to 2009 219 12.2% 1,904 12.7% 7,823 13.1%Homes Built 1990 to 1999 364 20.4% 2,888 19.3% 10,234 17.1%Homes Built 1980 to 1989 546 30.6% 4,174 27.9% 14,340 24.0%Homes Built 1970 to 1979 427 23.9% 3,902 26.1% 15,150 25.4%Homes Built 1960 to 1969 158 8.9% 1,494 10.0% 6,106 10.2%Homes Built 1950 to 1959 61 3.4% 788 5.3% 6,181 10.3%Homes Built Before 1949 32 1.8% 342 2.3% 2,426 4.1%
Home Values (2015)Home Values $1,000,000 or More 87 6.0% 520 5.3% 704 2.3%Home Values $500,000 to $999,999 453 31.5% 2,796 28.7% 4,572 15.1%Home Values $400,000 to $499,999 196 13.7% 1,328 13.6% 2,388 7.9%Home Values $300,000 to $399,999 297 20.6% 1,964 20.2% 4,493 14.8%Home Values $200,000 to $299,999 232 16.1% 1,559 16.0% 6,574 21.6%Home Values $150,000 to $199,999 98 6.8% 761 7.8% 3,992 13.1%Home Values $100,000 to $149,999 44 3.1% 540 5.6% 3,849 12.7%Home Values $70,000 to $99,999 23 1.6% 178 1.8% 1,691 5.6%Home Values $50,000 to $69,999 5 0.3% 63 0.6% 703 2.3%Home Values $25,000 to $49,999 14 1.0% 108 1.1% 724 2.4%Home Values Under $25,000 12 0.9% 194 2.0% 1,962 6.5%Owner-Occupied Median Home Value $429,246 $427,919 $285,051Renter-Occupied Median Rent $1,109 $848 $749
Transportation To Work (2015)Drive to Work Alone 1,423 78.4% 11,380 78.8% 45,390 75.2%Drive to Work in Carpool 194 10.7% 1,137 7.9% 5,533 9.2%Travel to Work by Public Transportation 3 0.2% 178 1.2% 2,095 3.5%Drive to Work on Motorcycle 10 0.6% 57 0.4% 226 0.4%Walk or Bicycle to Work 20 1.1% 321 2.2% 2,538 4.2%Other Means 21 1.2% 132 0.9% 768 1.3%Work at Home 143 7.9% 1,246 8.6% 3,823 6.3%
Travel Time (2015)Travel to Work in 14 Minutes or Less 250 14.9% 3,533 26.8% 17,007 30.1%Travel to Work in 15 to 29 Minutes 934 55.8% 7,125 54.0% 27,323 48.3%Travel to Work in 30 to 59 Minutes 428 25.6% 3,100 23.5% 13,596 24.0%Travel to Work in 60 Minutes or More 21 1.3% 397 3.0% 1,759 3.1%Average Minutes Travel to Work 23.2 20.5 20.0

PROPERTY HIGHLIGHTS SITE PLAN / AVAILABILITY AERIAL CONTACT DEMOGRAPHICS
Brian [email protected]
Brian [email protected]
2415 East Camelback Road, Suite 400Phoenix, Arizona 85016602.682.8100
Brian [email protected]
The information contained in this brochure has been obtained from sources believed reliable. We have not verified the information, and make no guaran-tee, warranty or representation about it. Any financial projections, assumptions or estimates used are for example only and do not represent the current or future performance of the property. We recommend that you and/or your advisors conduct a complete analysis of the property and make your own deter-mination on the suitability of the property for your specific needs. Velocity Retail Group, LLC and the VRG logo are service marks of Velocity Retail Group, LLC. All other marks displayed in this document are the property of their respective owners.
Brian [email protected]