conference topic: africa beyond covid-19: acceleration
TRANSCRIPT
Conference Topic: Africa beyond COVID-19: acceleration towards inclusive
sustainable development
Theme, Pillar 3: Acceleration towards inclusive and sustainable development
Topic: Trade and Industrialization
Tittle: Rethinking China-Africa trade relations: The impact of a
Sino-Africa FTA on trade balance
Author 1 Ms. Mila Malavoloneke (28 yrs)
International Trade Lawyer.
Fellow, China Institute for WTO
Studies, University of
International Business and
Economics; China.
Email:
Tel: +244 938 405 464
(Angola)
Author 2 Ms. LiuYing (28 yrs)
PhD Candidate, China Institute
for WTO Studies, University of
International Business and
Economics, China.
Email: [email protected]
Tel: +86 186 660 358 530
(China)
ABSTRACT
Amid COVID-19 and other global uncertainties particularly concerning for the present
and future of international trade, this paper looks into Sub-Saharan Africa’s trade
relations with China, its biggest commercial partner. The chapter, a feasibility study,
analyses whether a Free Trade Agreement could have an effective impact in decreasing
Sub-Saharan African countries’ trade deficit with China, and/or consequently boost
other macroeconomic factors. Using the GTAP model, three assumptions are set forth
referring to 30%, 50% and 100% reduction cuts in tariff-lines. The simulation results
proved to reduce the trade deficit and outlined an improvement in GDP and social
welfare gains. For an effective implementation, a phased-out application of the
proposed agreement is recommended, along with five other considerations, crucial in
laying down the foundation for a resilient and sustainable continent post crisis.

1. Introduction
The contemporaneous economic relationship between China and the African continent
is well-known. In 2009 China surpassed the United States and the European Union and
became Africa’s main trade partner. At its peak in 2014, the total trade value between
the two regions reached US$ 220 billion1. Nevertheless, as with most commercial
partnerships, despite the cheering numbers, there is evident room for improvement. Last
year, in 2019, China’s total import and export volume with Africa reached US$ 208.7
billion.2 China’s imports fell by 3.8% in the mean period to US$ 95.5 billion, while
exports rose 7.9% to US$ 113.2 billion. Africa’s trade deficit with China run at
US$ 17.7 billion. These figures were disappointing for African economies even though
unsurprisingly expected.
Over the past decades, the Sino-African trade flow has been highly moved by China’s
interests in Africa’s primary commodities which is in turn fuelled by Africa’s own
overdependency on the export of such natural resources. Therefore, while Africa’s
imports from China are diversified and a combination of its various sectors, from goods
to services, Africa’s exports to China are largely concentrated in minerals and other raw
commodities. As a result, China’s principal trade partners in the African continent are
resource-rich nations, leading to a Sino-Africa pattern of trade that is geographically
uneven. In addition, the current volatility in the commodities’ market signifies that not
always a raise in volumes of exports, leads to higher profits. Actually, a decline in
commodity prices since 2014 has severely impacted the value of African exports to
China, whereas the contrary, the value of China’s exports to Africa, remains steady.
This means that although SAA does not run a sustained trade deficit with China,
because much of the trade direction and flow of their components depends on the
commodities market, its exports’ performance is unstable.
1 National Bureau of Statistics of China
2 Ibid
This is particularly concerning because after forty years of rapid growth, for the last
decade China seems to be reaching the peak of industrial development. Although this
stage was much anticipated by analysts, the effects of a deteriorating external
environment, associated by a global slowdown, the US-China trade tensions and now
the pandemic, aggravated the Chinese economic slowdown. Given China's importance
in SSA’s economy, particularly due to its vigorous demand for commodities, unless
African economies diversify their export baskets to the Chinese market, any decrease
in commodity demand at the moment, is likely to have far-reaching consequences for
the region.3
Considering these loopholes, suggestions have been made, calling for China and
African countries to consider launching sector-specific reciprocal Free Trade
Agreements (FTAs) that would reduce tariffs on certain product lines.4 But, these
suggestions have not been without refutations. Those pushing for such deals argue that
if China and African countries sign FTAs in sectors where African imports cover
mainly industries not yet matured locally or perhaps in sectors where China’s demand
for African imports is higher, there is a great probability that the existing trade
imbalance between the two regions could diminish.5 On the other hand, those arguing
against it, claim that by opening- up completely to Chinese producers, even if in sectors
where Africa currently does not have booming industries, African countries may
compromise the growth and rise of infant industries, leading them to be inevitable
struck-down by the overwhelming presence of Chinese companies in the foresaid
sectors.6
Be that as it may, fact is that the time to reconsider Sino-African trade relations has
never been more appropriate. After all, the unveiling of current global events, with
3 Ana Nicolaci da Costa, ‘China's economic slowdown: How bad is it?’, BBC News, also available at:
https://www.bbc.com/news/business-49791721
4 Fu Jing, ‘An FTA between China, African nations will boost global trade’, China Daily.
http://www.chinadaily.com.cn/a/201809/04/WS5b8dbd97a310add14f3895cd.html
5 Garth Shelton, ‘Trading with the dragon: Prospects for a China‐South Africa FTA’, South African
Journal of International Affairs (2004)
6 Ibid

particular focus to the emergence of COVID-19 as well as the ongoing US-China trade
tension has put African governance, once again, to the test.
At the beginning of 2020, when COVID-19 reached the continent, Africa was on a
continued path of economic expansion, with growth projected to rise from 2.9% in 2019
to 3.2% in 2020, and 3.5% in 2021.7 Yet, as it stands today, more than halfway through
2020, the impact of this ‘invisible virus’ is expected to shrink global economy by an
estimate of 5.2% this year alone. Emerging market and developing economies (EMDEs)
are expected to shrink by 2.5% (World Bank, Global Economic Prospects). In Africa,
the prolonged lack of investment in critical health systems and decades of economic
growth unevenly distributed, make our chances to fight the economic impact of the
virus, much harder. And, even if it may still be a little too early to measure the full
impact of the pandemic in the African continent, the initial measures of containment,
which included a confinement that put a halt on most economic activities, is expected
to cause an economic and humanitarian fallout.
In addition, the ongoing US-China trade tensions could also have significant impact to
Sino-Africa trade flows. Even if currently in limbo, on Phase One trade deal between
the United States and China, signed in January 2019, China pledged to buy over US$ 50
billion of US energy supplies. To meet this target Beijing would need to renegotiate or
outright cancel its standing long-term energy contracts with other suppliers. It is then
that African countries like Angola, heavily dependent on oil exports to China, could
take quite a hit.
It is therefore, under the umbrella of such episodes, that this paper examines China-
Africa trade relations. Using the GTAP model, the chapter forecasts the impact of Sino-
African FTAs in addressing trade imbalances between the two regions. Looking
particularly into the sectors of manufactured goods and agriculture, this paper analyses
whether the proposed FTA could have an effective impact decreasing African countries’
trade deficit with China, and/or consequently boost other macroeconomic factors such
7 World Economic Situation and Prospects 2020, United Nations Department of Economic and Social
Affairs, May 13, 2020
as GDP and social welfare gains. In addition, taking into consideration the impact of
current global uncertainties on the horizons of trade relations, the chapter provides
policy recommendations outlining some of the continent’s best chances to maximise
opportunities brought forward for an inclusive and sustainable future.
2. Literature Review
One of the biggest triggers holding back trade liberalisation between China and Africa,
is certainly the different stages of development undergoing each region. While over the
last 40 years China has built its reputation in global trade as a highly industrialised
nation, continuously pushing for growth in crucial sectors of product development such
as manufacturing, the same cannot be said about Africa. The structure of industrial
activity in SSA remains underdeveloped and dominated by the minimal processing of
local natural resources and simple consumer goods (Oyejide and Wangwe, 2003). For
this reason, fears regarding the implementation of an FTA between these two regions
in totally different stages of economic development is indeed justifiable.
In response however, it has been argued before that different stages of development are
not constraints for the creation of functional FTAs (U.K Department for International
Development, 2015). Research analysing Mexico’s experience with NAFTA concluded
that FTAs signed between developing and industrialised nations did not support fears
of slow economic development in emerging economies (Grace V. Chomo, 2002). One
of the reasons could be that under the theory of comparative advantage, when a nation
reduces barriers to a trading partner, national resources adjust through specialization
towards areas of comparative advantage relative to the trading partner. Thus, in theory,
African countries signing bilateral trade liberalisation deals with China, will inevitably
specialize in their areas of comparative advantage. For instance, SSA countries Relative
Unit Labour Costs (RULC) levels have been declining in comparison to China, as
China’s wages continue to rise faster than production (Ceglowski, 2015). Low RULC
along with a stronger business climate may permit a situation where if a trade deal is

implemented, Africans may specialize their industries in certain manufacturing areas
for purposes of attracting Chinese interest into their markets.
Touching base on the effects of FTAs on trade flows and stressing the role of
regionalization, there is also extensive literature analysing the matter. Except, the
evidence is mixed since most studies assume that the FTA formation (i.e. the choice of
partner countries) is exogenous, whereas some papers highlight the potential
endogeneity bias in estimating the effects of FTAs on trade volumes (Magee, 2003;
Baier and Bergstrand, 2004). An FTA assumes a relative balance in the potential trade
between the partner countries (Grossman and Helpman,1995).
Moreover, whilst addressing trade balance, it is also important to note and deflect a
common misconception that seems to be getting more momentum in recent times. A
trade deficit is not necessarily a sign of weak economy. Some economists argue that
judging the effect of an FTA solely based on the impact of trade balances is highly
misleading.8 Usually other macroeconomic factors come into play once analysing if a
bilaterateral or regional trade agreement leans in any degree more unfavorably to one
side, meanwhile the other, ‘gains in proportion to its declension from the exact
equilibrium’ (Smith, 1776). A recent study which used the Global Trade Analysis
Project (GTAP) model on 57 tradable commodities and nine regions of the world to
understand the likely impact of a possible BRICs FTA, is relevant in emphasizing the
importance of FTAs for partner countries beyond balance of trade (Sharma and
Kallummal, 2012). Non-BRICs members experienced an increase in GDP and all the
components of the GDP from the base run. In terms of absolute value, a highest welfare
gain was attained by most BRICs members, in comparison to Non-BRICs members that
instead registered net welfare loss. But, all the BRICs members except Russia showed
negative trade balance vis-à-vis Non-BRICs members. In sum, the impact of the
proposed FTA, considering all macroeconomic factors would be positive for all
members, despite the trade deficit.
8 William D. Lastrapes: Why trade deficits aren’t so bad, The Conversation.
https://theconversation.com/why-trade-deficits-arent-so-bad-104358
Notwithstanding the aforementioned, even if agreed that in general terms trade deficits
are not indicators of a weak economy, the African context is different. Due to the
continent’s participation in international trade by exporting its natural resources in raw
form, and re-importing them after transformed into intermediary or finished products,
SSA runs an aggregate trade deficit with the rest of the world that goes hand in hand
with a deterioration in the current account.
3. Trade between China and Africa
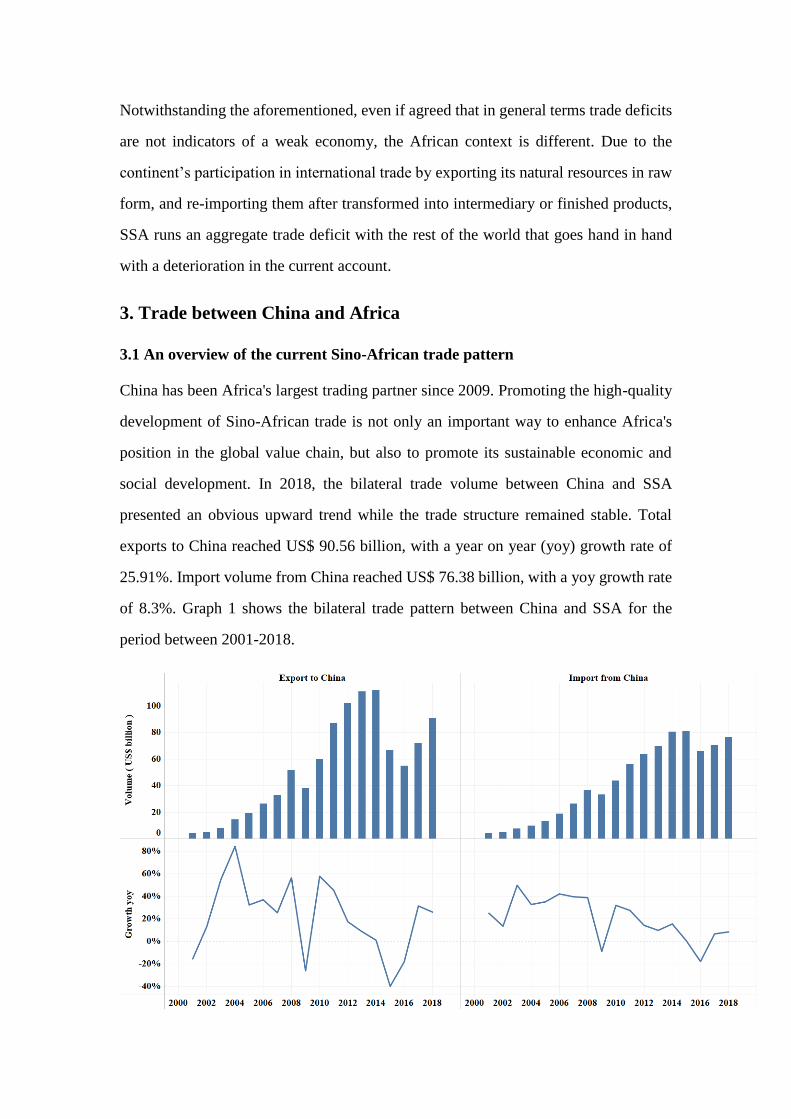
3.1 An overview of the current Sino-African trade pattern
China has been Africa's largest trading partner since 2009. Promoting the high-quality
development of Sino-African trade is not only an important way to enhance Africa's
position in the global value chain, but also to promote its sustainable economic and
social development. In 2018, the bilateral trade volume between China and SSA
presented an obvious upward trend while the trade structure remained stable. Total
exports to China reached US$ 90.56 billion, with a year on year (yoy) growth rate of
25.91%. Import volume from China reached US$ 76.38 billion, with a yoy growth rate
of 8.3%. Graph 1 shows the bilateral trade pattern between China and SSA for the
period between 2001-2018.
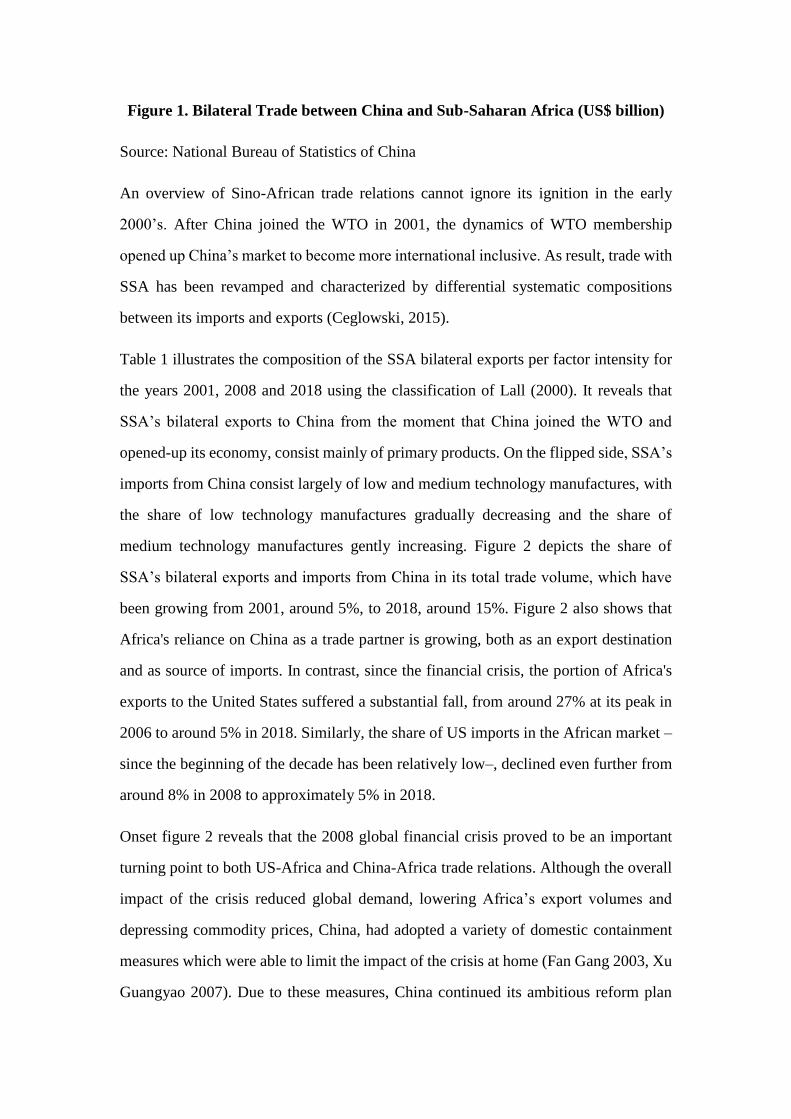
Figure 1. Bilateral Trade between China and Sub-Saharan Africa (US$ billion)
Source: National Bureau of Statistics of China
An overview of Sino-African trade relations cannot ignore its ignition in the early
2000’s. After China joined the WTO in 2001, the dynamics of WTO membership
opened up China’s market to become more international inclusive. As result, trade with
SSA has been revamped and characterized by differential systematic compositions
between its imports and exports (Ceglowski, 2015).
Table 1 illustrates the composition of the SSA bilateral exports per factor intensity for
the years 2001, 2008 and 2018 using the classification of Lall (2000). It reveals that
SSA’s bilateral exports to China from the moment that China joined the WTO and
opened-up its economy, consist mainly of primary products. On the flipped side, SSA’s
imports from China consist largely of low and medium technology manufactures, with
the share of low technology manufactures gradually decreasing and the share of
medium technology manufactures gently increasing. Figure 2 depicts the share of
SSA’s bilateral exports and imports from China in its total trade volume, which have
been growing from 2001, around 5%, to 2018, around 15%. Figure 2 also shows that
Africa's reliance on China as a trade partner is growing, both as an export destination
and as source of imports. In contrast, since the financial crisis, the portion of Africa's
exports to the United States suffered a substantial fall, from around 27% at its peak in
2006 to around 5% in 2018. Similarly, the share of US imports in the African market –
since the beginning of the decade has been relatively low–, declined even further from
around 8% in 2008 to approximately 5% in 2018.
Onset figure 2 reveals that the 2008 global financial crisis proved to be an important
turning point to both US-Africa and China-Africa trade relations. Although the overall
impact of the crisis reduced global demand, lowering Africa’s export volumes and
depressing commodity prices, China, had adopted a variety of domestic containment
measures which were able to limit the impact of the crisis at home (Fan Gang 2003, Xu
Guangyao 2007). Due to these measures, China continued its ambitious reform plan
which triggered a spike in industrialization and an overwhelming need for commodities,
which Africa had plenty. Hence Africa’s exports as from the year of 2008 gained a
momentum in the Chinese market in comparison to the US market (figure 2).
Figure 2. Share of Trade with China and the United States in SSA’s Total Trade
Source: National Bureau of Statistics of China, UNCTAD.
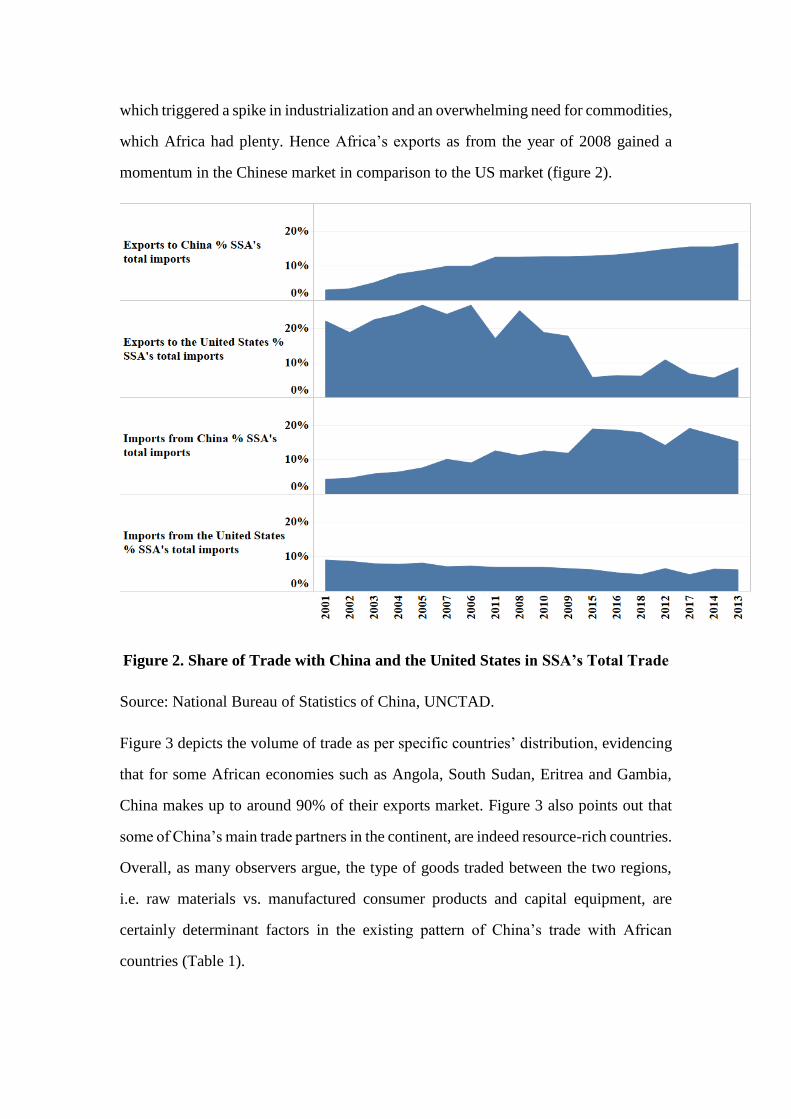
Figure 3 depicts the volume of trade as per specific countries’ distribution, evidencing
that for some African economies such as Angola, South Sudan, Eritrea and Gambia,
China makes up to around 90% of their exports market. Figure 3 also points out that
some of China’s main trade partners in the continent, are indeed resource-rich countries.
Overall, as many observers argue, the type of goods traded between the two regions,
i.e. raw materials vs. manufactured consumer products and capital equipment, are
certainly determinant factors in the existing pattern of China’s trade with African
countries (Table 1).
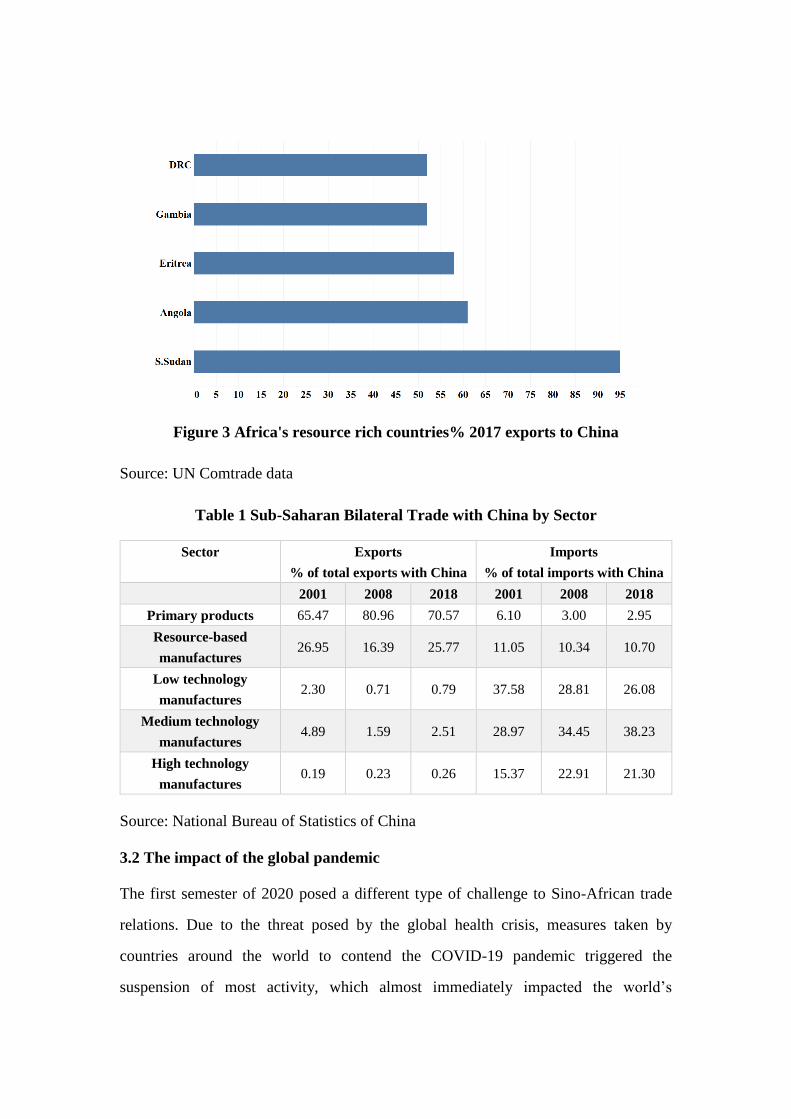
Figure 3 Africa's resource rich countries% 2017 exports to China
Source: UN Comtrade data
Table 1 Sub-Saharan Bilateral Trade with China by Sector
Sector Exports
% of total exports with China
Imports
% of total imports with China
2001 2008 2018 2001 2008 2018
Primary products 65.47 80.96 70.57 6.10 3.00 2.95
Resource-based
manufactures 26.95 16.39 25.77 11.05 10.34 10.70
Low technology
manufactures 2.30 0.71 0.79 37.58 28.81 26.08
Medium technology
manufactures 4.89 1.59 2.51 28.97 34.45 38.23
High technology
manufactures 0.19 0.23 0.26 15.37 22.91 21.30
Source: National Bureau of Statistics of China
3.2 The impact of the global pandemic
The first semester of 2020 posed a different type of challenge to Sino-African trade
relations. Due to the threat posed by the global health crisis, measures taken by
countries around the world to contend the COVID-19 pandemic triggered the
suspension of most activity, which almost immediately impacted the world’s

commodity markets – the crude market being among the most affected. Undermined
energy demand worldwide, but specially in China, currently the number one importer
of crude in the world, signifies a decline in demand. This severely impacted African
countries (Angola, South Sudan, Congo) that have China as their primary crude export
market.
Likewise, the shutdown of economic activities should lead to a sharp decline in
productivity, jobs and revenue, and, with less buying power, African countries will
inevitably import less from China. Figure 4 illustrates how the trade pattern between
China and SAA reacted to the pandemic during the first half of 2020.
Figure 4 Trade between China and SSA from January to June 2020 (US$ billion)
Source: National Bureau of Statistics of China
3.3 A proposed Free Trade Agreement between China and Africa
Focusing on the specific African countries pertinent for this research analysis, in order
to understand how FTAs may influence their economies we first need to understand the
manner in which these economies operate from a bigger African spectrum, that is, their
division through economic and trade blocks.

The African Union (AU), as an economic bloc, corresponds to 54 member States and
recognizes eight regional economic communities (RECs) and five subgroups which
consists primarily of trade blocs (AU, 2015b; UNCTAD, 2015b). All the eight
communities form the pillars of the African Economic Community (AEC), which are
divided as follows: Economic Community of West African States (ECOWAS),
Economic Community of Central African States (ECCAS), Arab Maghreb Union
(UMA), Southern African Development Community (SADC), Common Market for
Eastern and Southern Africa (COMESA), Intergovernmental Authority on
Development (IGAD), Community of Sahel-Saharan States (CEN-SAD) and East
African Community (EAC).
For purposes of studying the effect of Sino-African FTAs, from this point onwards the
chapter shall focus on two economic blocs, namely: SADC,9 and EAC.10 In 2018,
SADC corresponded to 26.5 percent of Africa’s population, about 344, 102,897 million
people, from which 56.9 percent living in urban areas. Its GDP corresponds to
US$ 725,694 billion or US$ 2,109 per capita.11 In 2017, the EAC corresponded to 13.7
percent of Africa’s population, about 172 million people, from which 21.7 percent
living in urban areas. Its GDP corresponds to US$ 172.7 billion or US$ 662.1 per
capita12. For purposes of this chapter, going forward the objective is to scrutinize the
current trade relationship of these regions with China and use GTAP to predict the
impact of a reciprocal agreement reducing tariff lines on two specific sectors:
agriculture and manufacturing. Both regions were chosen, taking into consideration, as
per statistics, the fact that both these two regions have strong commercial bonds with
China. Table 2 and 3 allude to this representation. It demonstrates, the volume of
9 The Southern African Development Community (SADC) is a regional economic community of
fifteen southern African states: Angola, Botswana, Democratic Republic of the Congo, Lesotho,
Madagascar, Malawi, Mauritius, Mozambique, Namibia, Seychelles, South Africa, Swaziland,
Tanzania, Zambia, and Zimbabwe.
10 The East African Community is a regional economic community of five member states: Burundi,
Kenya, Rwanda, Tanzania and Uganda.
11 African Development Bank, 2018
12 EAC, AU, 2017

exports of each member of SADC and EAC with China, as well as the trade balance for
the same time-period. Henceforth, due to the version of GTAP, Africa in this paper
refers to SADC, EAC and part of Eastern Africa (Comoros, Djibouti, Eritrea, Mayotte,
Seychelles, Somalia, Sudan.).13
Table 2. China’s exports to and trade balance with SADC Members
(US$ million)
Country 2001 2008 2018
Exports Balance Exports Balance Exports Balance
Angola 45.72 -676.11 2942.47 -19440.05 2253.14 -23573.37
Botswana 14.23 - 169.15 -14.76 281.6 267.37
Madagascar 72.86 64.02 602.59 537.42 1010.08 810.02
Malawi 4.49 4.09 81.05 72.94 221.6 194.24
Mauritius 87.18 78.23 320.09 314.38 804.18 766.74
Mozambique 22.04 10.85 295.99 170.11 1861.78 1228.25
Namibia 21.22 9.96 243.17 -39.01 323.71 -179.21
Seychelles 1.12 1.07 14.13 10.45 61.33 61.3
South Africa 1049.12 -123.99 8617.62 -617.35 16248.38 -11039.11
Tanzania 90.15 86.86 950.44 818.85 3583.14 3191.88
Congo,
Dem.Rep 13.13 5.44 234.58 -1349.28 1773.25 -3882.29
Zambia 38.84 3.16 264.35 -258.15 969.49 -3113.36
Zimbabwe 33.27 -81.62 133.1 -15.11 445.68 -443.95
Lesotho 16.76 15.63 79.64 77.94 64.14 34.05
Swaziland 2.99 -4.02 20.6 9.32 36.4 8.94
Source: National Bureau of Statistics of China
Table 3. China’s exports to and trade balance with EAC members (US$ million)
Country 2001 2008 2018
Exports Balance Exports Balance Exports Balance
Burundi 1.16 - 17.68 17.56 37.32 25.39
Kenya 138.93 133.05 1249.33 1214.61 5197.2 5023.44
Rwanda 2.89 -3.48 59.37 29.79 165.59 126.26
Tanzania 90.15 86.86 950.44 818.85 3583.14 3191.88
Uganda 16.24 15 230.1 213.04 706.4 660.18
13 This third grouping is a result of the version of GTAP and its representation of the African map due
to the software.
Source: National Bureau of Statistics of China
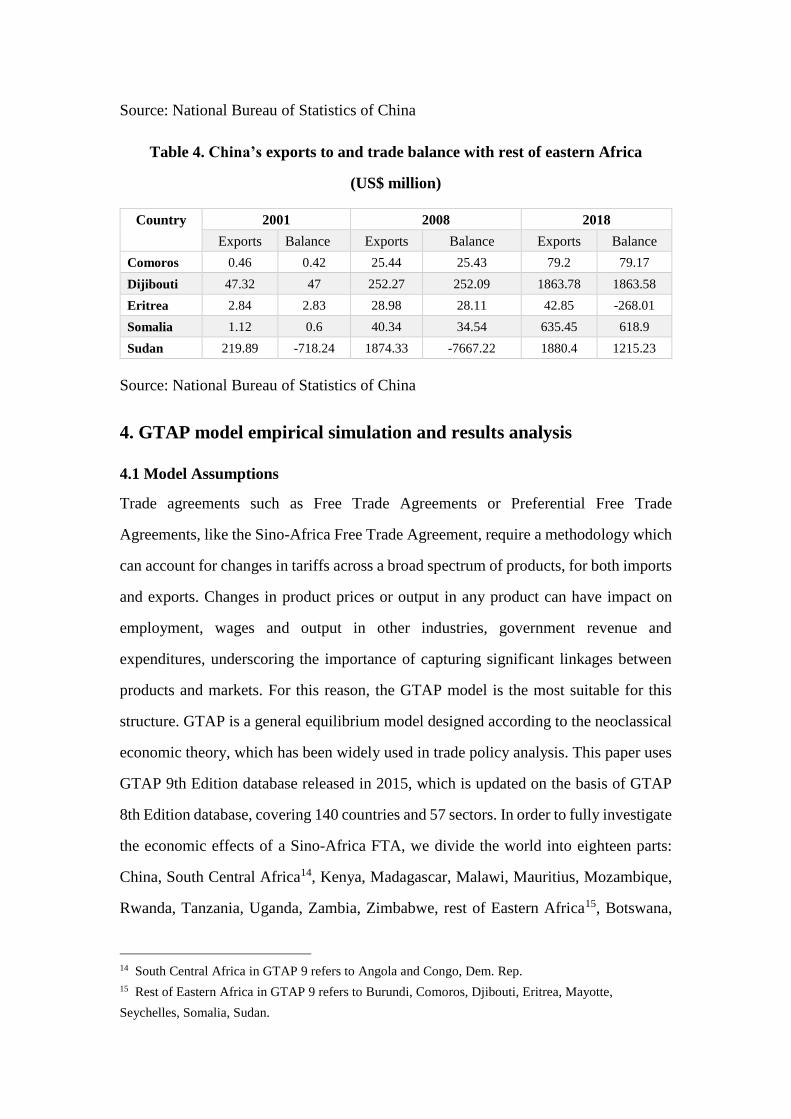
Table 4. China’s exports to and trade balance with rest of eastern Africa
(US$ million)
Country 2001 2008 2018
Exports Balance Exports Balance Exports Balance
Comoros 0.46 0.42 25.44 25.43 79.2 79.17
Dijibouti 47.32 47 252.27 252.09 1863.78 1863.58
Eritrea 2.84 2.83 28.98 28.11 42.85 -268.01
Somalia 1.12 0.6 40.34 34.54 635.45 618.9
Sudan 219.89 -718.24 1874.33 -7667.22 1880.4 1215.23
Source: National Bureau of Statistics of China
4. GTAP model empirical simulation and results analysis
4.1 Model Assumptions
Trade agreements such as Free Trade Agreements or Preferential Free Trade
Agreements, like the Sino-Africa Free Trade Agreement, require a methodology which
can account for changes in tariffs across a broad spectrum of products, for both imports
and exports. Changes in product prices or output in any product can have impact on
employment, wages and output in other industries, government revenue and
expenditures, underscoring the importance of capturing significant linkages between
products and markets. For this reason, the GTAP model is the most suitable for this
structure. GTAP is a general equilibrium model designed according to the neoclassical
economic theory, which has been widely used in trade policy analysis. This paper uses
GTAP 9th Edition database released in 2015, which is updated on the basis of GTAP
8th Edition database, covering 140 countries and 57 sectors. In order to fully investigate
the economic effects of a Sino-Africa FTA, we divide the world into eighteen parts:
China, South Central Africa14, Kenya, Madagascar, Malawi, Mauritius, Mozambique,
Rwanda, Tanzania, Uganda, Zambia, Zimbabwe, rest of Eastern Africa15, Botswana,
14 South Central Africa in GTAP 9 refers to Angola and Congo, Dem. Rep.
15 Rest of Eastern Africa in GTAP 9 refers to Burundi, Comoros, Djibouti, Eritrea, Mayotte,
Seychelles, Somalia, Sudan.
Namibia, South Africa, Southern Africa 16, rest of the World. The three assumptions
set forth refer to 30%, 50% and 100% reduction of bilateral tariffs between China and
Africa. The base year is 2004. In order to clearly show the impact of signing the FTA,
we also re-verified the African part as a whole, and use "Africa" at the end of each table
to refer to these results.
4.2 Overall Impact on Economies
Table 5, table 6 and table 7 illustrate the changes of main economic indicators of the
eighteen economies under the three assumptions respectively. In terms of economic
growth, due to the large scale, the increase in China’s GDP is relatively small (0.05%,
0.1%, 0.23%), while the effect of the FTA on Africa’s side is universally negative.
Under the three circumstances, only Zambia remains a positive growth in value of GDP
(0.05%, 0.06%, 0.02%). The GDP of Malawi also reflects a small growth with 30% cut
(0.02%). When bilateral tariffs are reduced by a 50% cut, the impact of the Sino-Africa
FTA on GDP is more significant than in the first assumption. Furthermore, the FTA
influence is stronger when China and Africa reduce all tariffs of the industries involved
under the third assumption. In terms of the SSA as a whole, the empirical results also
show that the signing of FTA will further expand the trade deficit in Africa, but the
improvement of social welfare is also worthy of attention.
Table 5 Changes in major economic indicators, 30% cut (US$ million, %)
Change
in value
of GDP
Change in
trade
balance
value of
merchandise
imports
value of
merchandise
exports
terms
of
trade
Social
welfare
China 0.05 -302.26 0.10 0.07 0.04 1001.25
South Central
Africa -0.11 -62.65 0.22 0.03 0.00 54.52
Kenya -0.37 12.24 0.28 0.64 -0.28 -15.50
Madagascar -0.13 -10.86 0.77 0.48 -0.11 -1.52
Malawi 0.02 -6.61 0.27 -0.02 0.09 3.54
Mauritius -0.25 6.91 -0.25 -0.21 -0.16 -11.37
Mozambique -0.12 -3.50 0.22 0.22 0.00 0.10
Rwanda -0.11 -0.09 0.13 0.14 0.01 1.37
Tanzania -0.37 -20.42 0.40 0.35 -0.09 -15.96
Uganda -0.21 -1.64 0.18 0.16 -0.05 -0.85
16 Southern Africa in GTAP 9 includes Lesotho and Swaziland.
Zambia 0.05 -12.22 0.22 0.06 0.04 11.79
Zimbabwe -0.27 10.04 0.54 1.53 0.04 -4.23
Rest of Eastern
Africa -0.38 -2.44 0.68 0.74 -0.11 32.20
Botswana -0.03 -11.63 0.41 0.05 0.02 7.77
Namibia -0.13 -3.54 061 0.37 -0.04 5.63
South Africa -0.20 -128.96 0.77 0.71 -0.14 100.81
Southern Africa -0.11 -2.20 0.33 0.15 -0.03 1.67
Rest of
World -0.01 539.84 -0.01 0.00 0.00 -702.98
Africa -0.19 -299.58 0.11 0.07 0.04 1019.01
Source: GTAP 9 simulation results.
Upon the conclusion of the proposed Sino-Africa FTA, there is an obvious positive
effect on the import and export volumes of both sides. In terms of trade balance changes,
due to the great reduction of bilateral tariffs, the import growth on both sides is higher
than that of exports. Under the first assumption, there are only slight changes in both
imports and exports. Under the second assumption, all parties except Mauritius
experience an increase in both imports and exports. Under the third assumption, China's
imports increased by 0.44% and exports increased by 0.30%. The most significant
change in Africa occurs in South Africa, with import growth of 3.91% and export
growth of 3.64%. However, the impact on the import volumes of China and Africa is
more significant than that on exports, so it has a negative impact on trade balance. Only
Kenya, Mauritius and Zimbabwe have trade surplus growth under the three experiments.
Table 6 Changes in major economic indicators, ‘50% cut’ (US$ million, %)
Change
in value
of GDP
Change in
trade
balance
value of
merchandise
imports
value of
merchandise
exports
terms
of
trade
Social
welfare
China 0.10 -544.06 0.18 0.13 0.08 1783.59
South Central
Africa
-0.20 -111.24 0.39 0.07 0.00 86.60
Kenya -0.77 30.56 0.54 1.32 -0.55 -50.21
Madagascar -0.24 -18.98 1.38 0.87 -0.19 -4.04
Malawi -0.02 -10.13 0.47 0.04 0.14 4.97
Mauritius -0.42 11.27 -0.40 -0.34 -0.27 -18.93
Mozambique -0.24 -6.39 0.41 0.41 0.00 -2.00
Rwanda -0.22 -0.22 0.25 0.27 0.02 1.95
Tanzania -0.71 -36.67 0.74 0.67 -0.18 -37.37

Uganda -0.41 -3.11 0.37 0.33 -0.09 -4.49
Zambia 0.06 -22.52 0.42 012 0.08 18.49
Zimbabwe -0.70 23.21 1.00 3.01 -0.01 -19.48
Rest of Eastern
Africa
-0.78 -5.79 1.30 1.42 -0.22 21.08
Botswana -0.06 -20.62 0.75 0.11 0.04 11.65
Namibia -0.25 -6.61 1.10 0.66 -0.07 8.25
South Africa -0.40 -232.81 1.45 1.33 -0.26 75.70
Southern Africa -0.21 -3.96 0.62 0.29 -0.05 2.10
Rest of
World -0.01 958.08 -0.01 -0.01 -0.01 -1215.96
Africa -0.38 -532.21 1.12 0.9 -0.17 211.27
Source: GTAP 9 simulation results.
In terms of social welfare, under the three assumptions, the proposed FTA between
China and Africa promotes the growth of welfare for most of the parties. Due to its
large economic scale, China’s social welfare is significantly improved by US$ 1001.25
million, US$ 1783.59 million and US$ 4189.31 million, in each experiment,
respectively. However, changes on social welfare for African members are not very
optimistic. Only half of the African countries are able to materialize social welfare
growth under the three assumptions. The largest increase of social welfare occurs in
south central Africa (Angola and Congo, Dem. Rep), with social welfare increasing of
US$ 54.52 million, US$ 86.6 million and US$ 142.89 million under the three
experiments. As for the terms of trade, while China's changes for terms of trade are
positive in all three experiments, the terms of trade for most African countries have
declined after the conclusion of the FTA. As far as the SSA as a whole is concerned,
the trade surplus drops sharply in this case and the social welfare deteriorates at the
same time.
Table 7 Changes in major economic indicators, 100% cut (US$ million, %)
Change
in value
of GDP
Change in
trade
balance
value of
merchandise
imports
value of
merchandise
exports
terms
of
trade
Social
welfare
China 0.23 -1344.19 0.44 0.30 0.18 4189.31
South Central
Africa
-0.53 -261.54 0.97 0.18 0.00 142.89
Kenya -2.45 120.26 1.57 4.17 -1.56 -252.40
Madagascar -0.62 -43.29 3.37 2.24 -0.42 -16.93
Malawi -0.49 -12.24 1.09 0.68 0.17 1.89
Mauritius -0.81 19.91 -0.69 -0.56 -0.50 -36.25
Mozambique -0.71 -15.97 1.06 1.04 -0.02 -17.95
Rwanda -0.65 -0.89 0.75 0.77 0.05 1.36
Tanzania -1.93 -88.44 1.95 1.88 -0.49 -136.97
Uganda -1.22 -8.77 1.16 1.09 -0.28 -30.45
Zambia 0.02 -58.15 1.22 0.41 0.17 27.28
Zimbabwe -3.51 99.92 2.79 9.59 -0.64 -155.00
Rest of Eastern
Africa
-2.47 -24.06 3.68 3.95 -0.63 -190.91
Botswana -0.21 -47.27 1.87 0.34 0.09 16.96
Namibia -0.68 -17.52 2.70 1.60 -0.18 9.06
South Africa -1.20 -586.75 3.91 364 -0.67 -496.18
Southern Africa -0.61 -9.79 1.72 0.83 -0.13 -0.34
Rest of
World -0.02 2278.80 -0.03 -0.02 -0.01 -2640.76
Africa -1.11 -1323.8 2.97 2.41 -0.43 -642.77
Source: GTAP 9 simulation results.
From the perspective of an Optimal Situation, for China, Africa and the rest of the world,
the level of tariff reduction applicable to the Optimal case is also different.
Table 8 Optimal situation for major economic indicators
Change in
value of
GDP
Change
in trade
balance
value of
merchandise
imports
value of
merchandise
exports
terms of
trade
Social
welfare
China 0.23 -302.26 0.10 0.30 0.18 4189.31
100% cut 30% cut 30% cut 100% cut 100% cut 100% cut
Rest of world -0.01 2278.80 -0.01 0.00 0.00 -702.98
30/50% cut 100% cut 30/50% cut 30% cut 30% cut 30% cut
Africa -0.19 -299.58 2.97 2.41 0.04 1019.01
30% cut 30% cut 100% cut 100% cut 30% cut 30% cut
4.3 Impact on Industrial Sectors
Table 9, table 10 and table 11 illustrate the changes of output in different industrial
sectors under the respective three assumptions.
For China, among all the sectors, growth in the textile and clothing industry remain the
most significant, with an increase in output worth US$ 1298.38, 2318.88 and 5406
million, under the three assumptions. The output volume changes for industries
involved in the FTA under the first assumption, namely, grains and crops, livestock and
meat products, processed food, textiles and clothing, light manufacturing and heavy

manufacturing, are US$ -56.56, -42.03, -55.44, 1298.38, 956.75 and -2082.50 million,
revealing China’s huge competitiveness in light manufacturing. The above trend has
been further strengthened with the further decline of bilateral tariffs.
Meanwhile for Africa, the output edges up in agricultural sectors. Only four members
are experiencing a decline in output for grains and crops. As for heavy industry, most
members participating in the FTA have decreases in output, with only five African
members having slightly increased under the first assumption. The competitiveness of
African countries varies in different industries which means that not all African
countries benefit from the FTA. Kenya, Zimbabwe, rest of Eastern Africa customs17
and South Africa run top in growth of grains and crops under all assumptions. Most of
African countries gain positive growth in food processing industry, among which South
Africa ranks first with output growth of US$ 63.54 million, US$ 330.09 million and
US$ 1067.06 million under the three assumptions. South Africa also rates number one
in livestock and meat products, followed by rest of Eastern Africa. African countries'
output in the light industry has declined to varying degrees. The output of six countries
in the field of heavy industry has increased, but only notable in South Africa, which has
increased by US$ 499.75, 966.56, 2689.197 million, in the three experiments
respectively. As for heavy manufacturing, remarkable increase occurs in South Africa
and Namibia under the three assumptions. When bilateral tariff concessions rise to
100%, heavy manufacturing output growth in Zimbabwe, Tanzania and Mozambique
are also worth noting. Under the three assumptions, Botswana has positive gains in both
textiles, clothing and light manufacturing. From the perspective of SSA as a whole, the
output of agriculture and heavy industry in Africa increased to varying degrees except
for light industry, which become more obvious with the further decline of tariff levels.
Table 9 Changes in output by sector, 30% cut (US$ million)
Grains
and
Crops
Livestock
and Meat
Products
Processed
Food
Textiles
and
Clothing
Light
Manufac
turing
Heavy
Manufacturi
ng
China -56.56 -42.03 -55.44 1298.38 956.75 -2082.50
17 Rest of Eastern Africa refers to Burundi, Comoros, Djibouti, Eritrea, Mayotte, Seychelles, Somalia,
Sudan.

South Central
Africa
-1.37 3.44 1.86 -20.57 -57.75 -47.59
Kenya 30.05 0.13 2.73 -57.07 -49.61 -19.82
Madagascar -0.48 -0.31 -0.81 7.97 -7.53 -4.08
Malawi 1.19 0.93 0.86 -2.97 -4.65 -1.33
Mauritius 2.14 0.61 6.22 -34.63 0.09 3.94
Mozambique 2.08 -0.28 -0.47 -3.51 -10.20 5.60
Rwanda 0.69 -0.04 0.12 -1.84 -1.08 -1.06
Tanzania 5.08 -1.15 -0.02 -18.78 -13.94 9.53
Uganda 3.48 0.42 1.44 -9.68 -10.61 -2.96
Zambia 5.26 -0.06 -1.14 -2.74 -16.27 -5.83
Zimbabwe 26.11 -1.09 0.33 -27.69 -15.13 4.60
Rest of Eastern
Africa
29.30 23.73 21.83 -40.03 -99.23 -82.49
Botswana -0.01 -0.14 0.50 3.34 1.31 -5.94
Namibia -0.05 1.04 0.04 -17.18 -8.35 22.15
South Africa 22.22 167.42 63.54 -795.03 -137.91 499.75
Southern Africa 0.11 0.06 0.34 -2.52 -0.77 -1.62
Rest of World -36.25 -93.38 -38.00 -91.63 -580.00 1624.00
Africa 140.64 178.61 104.77 -1104.4 -562.75 414.84
Source: GTAP 9 simulation results.
Table 10 Changes in output by sector, 50% cut (US$ million)
Grains
and
Crops
Livestock
and Meat
Products
Processed
Food
Textiles
and
Clothing
Light
Manufac
turing
Heavy
Manufacturi
ng
China -99.00 -85.59 -101.63 2318.88 1793.75 -3788.00
South Central
Africa
-2.67 6.01 2.66 -36.43 -100.77 -82.44
Kenya 54.77 -0.68 2.30 -97.51 -87.07 -29.86
Madagascar -1.00 -0.77 -1.76 15.10 -13.23 -6.62
Malawi 2.83 1.43 1.31 -5.33 -8.35 -1.91
Mauritius 3.50 1.03 10.25 -56.29 -0.13 6.11
Mozambique 3.46 -0.54 -0.99 -6.23 -17.96 10.97
Rwanda 1.18 -0.09 0.17 -3.33 -1.92 -1.80
Tanzania 8.75 -2.58 -0.64 -32.08 -24.51 18.44
Uganda 6.44 0.75 2.37 -17.09 -19.27 -4.52
Zambia 8.61 -0.23 -2.40 -5.18 -29.30 -6.87
Zimbabwe 46.75 -1.86 1.51 -52.48 -27.82 13.53
Rest of Eastern
Africa
54.11 43.07 40.61 -71.23 -179.30 -136.34
Botswana -0.03 -0.39 0.74 6.74 2.56 -10.26
Namibia -0.08 1.89 -0.09 -30.28 -14.36 39.61

South Africa 40.42 330.09 114.75 -1435.74 -241.41 966.56
Southern Africa 0.16 0.08 0.53 -4.21 -1.38 -2.65
Rest of World -79.25 -185.63 -77.00 -62.25 -1061.00 2906.00
Africa 248.68 344.52 182.73 -1973.31 -1004.02 841.02
Source: GTAP 9 simulation results.
Table 11 Changes in output by sector, 100% cut (US$ million)
Grains
and
Crops
Livestock
and Meat
Products
Processed
Food
Textiles
and
Clothing
Light
Manufac
turing
Heavy
Manufacturi
ng
China -226.81 -298.56 -257.81 5406.00 4848.50 -9322.50
South Central
Africa
-7.68 13.51 2.33 -84.84 -226.21 -180.99
Kenya 134.44 -7.01 -10.52 -195.01 -198.93 -40.50
Madagascar -3.36 -2.98 -6.09 42.20 -30.21 -11.63
Malawi 11.83 1.68 1.42 -12.80 -20.28 -1.30
Mauritius 6.27 2.05 18.99 -98.49 -2.21 8.52
Mozambique 6.75 -1.46 -3.44 -14.40 -41.17 32.20
Rwanda 2.48 -0.28 0.08 -8.08 -4.54 -3.69
Tanzania 18.74 -9.03 -5.23 -66.00 -55.83 50.70
Uganda 16.65 1.77 4.31 -38.52 -47.76 -5.81
Zambia 15.64 -1.32 -8.29 -14.21 -71.41 6.66
Zimbabwe 116.52 -4.25 10.37 -145.78 -75.18 78.06
Rest of Eastern
Africa
139.99 107.68 106.60 -160.71 -439.77 -255.71
Botswana -0.18 -1.77 0.64 21.90 6.80 -22.83
Namibia -0.20 4.77 -1.57 -68.45 -31.26 94.01
South Africa 94.43 1067.06 285.52 -3431.13 -590.34 2689.19
Southern
Africa
0.15 0.03 0.68 -7.87 -3.41 -4.81
Rest of World -280.25 -591.50 -243.00 466.75 -2625.00 6938.00
Africa 567.27 1053.96 404.00 -4581.54 -2428.29 2529.06
Source: GTAP 9 simulation results.
Table 12 shows changes on imports for the different sectors. Imports from all sectors
included in the FTA are growing positively for China. The most significant change for
China’s imports occurs in livestock and meat products, with growth rate of 0.61%, 1.21%
and 3.96% under the three assumptions, reflecting the complementary advantages of
China and Africa in the field of Agriculture. The growth of textiles and clothing is
closely followed, with growth rate of 0.31%, 0.57% and 1.39%. Meanwhile for Africa,
the biggest change appears in textiles and clothing. All African members participating
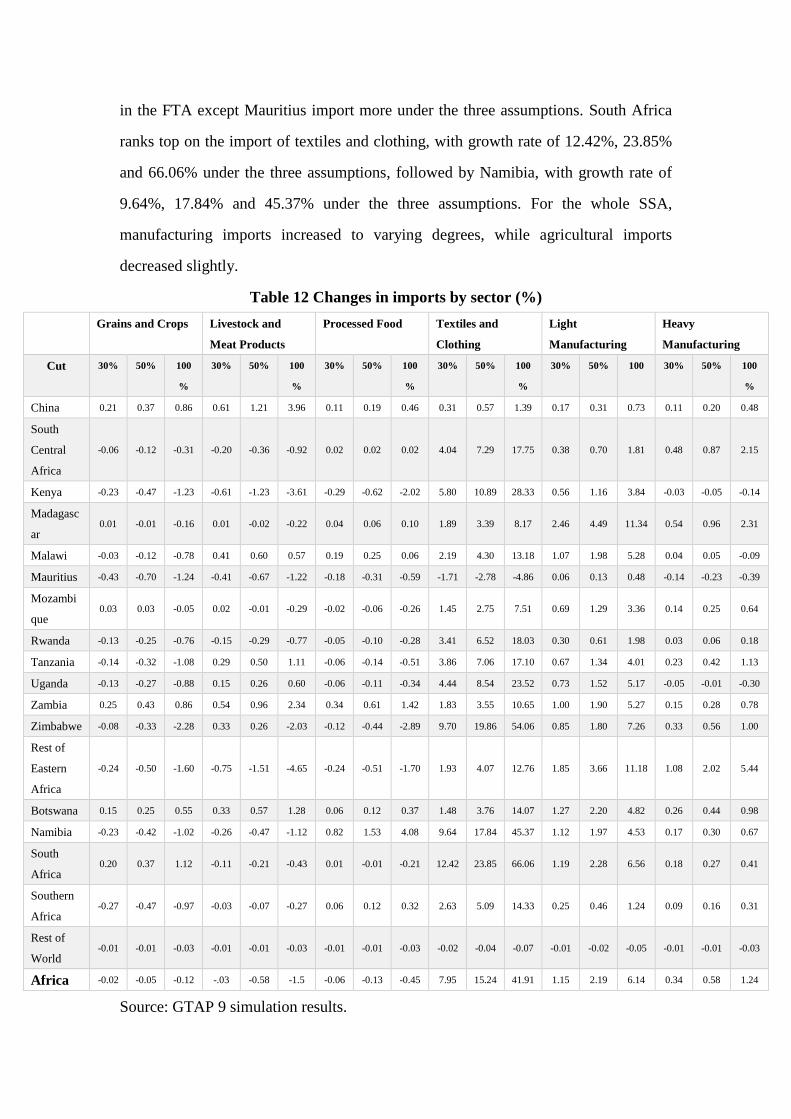
in the FTA except Mauritius import more under the three assumptions. South Africa
ranks top on the import of textiles and clothing, with growth rate of 12.42%, 23.85%
and 66.06% under the three assumptions, followed by Namibia, with growth rate of
9.64%, 17.84% and 45.37% under the three assumptions. For the whole SSA,
manufacturing imports increased to varying degrees, while agricultural imports
decreased slightly.
Table 12 Changes in imports by sector (%)
Grains and Crops Livestock and
Meat Products
Processed Food Textiles and
Clothing
Light
Manufacturing
Heavy
Manufacturing
Cut 30% 50% 100
%
30% 50% 100
%
30% 50% 100
%
30% 50% 100
%
30% 50% 100 30% 50% 100
%
China 0.21 0.37 0.86 0.61 1.21 3.96 0.11 0.19 0.46 0.31 0.57 1.39 0.17 0.31 0.73 0.11 0.20 0.48
South
Central
Africa
-0.06 -0.12 -0.31 -0.20 -0.36 -0.92 0.02 0.02 0.02 4.04 7.29 17.75 0.38 0.70 1.81 0.48 0.87 2.15
Kenya -0.23 -0.47 -1.23 -0.61 -1.23 -3.61 -0.29 -0.62 -2.02 5.80 10.89 28.33 0.56 1.16 3.84 -0.03 -0.05 -0.14
Madagasc
ar 0.01 -0.01 -0.16 0.01 -0.02 -0.22 0.04 0.06 0.10 1.89 3.39 8.17 2.46 4.49 11.34 0.54 0.96 2.31
Malawi -0.03 -0.12 -0.78 0.41 0.60 0.57 0.19 0.25 0.06 2.19 4.30 13.18 1.07 1.98 5.28 0.04 0.05 -0.09
Mauritius -0.43 -0.70 -1.24 -0.41 -0.67 -1.22 -0.18 -0.31 -0.59 -1.71 -2.78 -4.86 0.06 0.13 0.48 -0.14 -0.23 -0.39
Mozambi
que 0.03 0.03 -0.05 0.02 -0.01 -0.29 -0.02 -0.06 -0.26 1.45 2.75 7.51 0.69 1.29 3.36 0.14 0.25 0.64
Rwanda -0.13 -0.25 -0.76 -0.15 -0.29 -0.77 -0.05 -0.10 -0.28 3.41 6.52 18.03 0.30 0.61 1.98 0.03 0.06 0.18
Tanzania -0.14 -0.32 -1.08 0.29 0.50 1.11 -0.06 -0.14 -0.51 3.86 7.06 17.10 0.67 1.34 4.01 0.23 0.42 1.13
Uganda -0.13 -0.27 -0.88 0.15 0.26 0.60 -0.06 -0.11 -0.34 4.44 8.54 23.52 0.73 1.52 5.17 -0.05 -0.01 -0.30
Zambia 0.25 0.43 0.86 0.54 0.96 2.34 0.34 0.61 1.42 1.83 3.55 10.65 1.00 1.90 5.27 0.15 0.28 0.78
Zimbabwe -0.08 -0.33 -2.28 0.33 0.26 -2.03 -0.12 -0.44 -2.89 9.70 19.86 54.06 0.85 1.80 7.26 0.33 0.56 1.00
Rest of
Eastern
Africa
-0.24 -0.50 -1.60 -0.75 -1.51 -4.65 -0.24 -0.51 -1.70 1.93 4.07 12.76 1.85 3.66 11.18 1.08 2.02 5.44
Botswana 0.15 0.25 0.55 0.33 0.57 1.28 0.06 0.12 0.37 1.48 3.76 14.07 1.27 2.20 4.82 0.26 0.44 0.98
Namibia -0.23 -0.42 -1.02 -0.26 -0.47 -1.12 0.82 1.53 4.08 9.64 17.84 45.37 1.12 1.97 4.53 0.17 0.30 0.67
South
Africa 0.20 0.37 1.12 -0.11 -0.21 -0.43 0.01 -0.01 -0.21 12.42 23.85 66.06 1.19 2.28 6.56 0.18 0.27 0.41
Southern
Africa -0.27 -0.47 -0.97 -0.03 -0.07 -0.27 0.06 0.12 0.32 2.63 5.09 14.33 0.25 0.46 1.24 0.09 0.16 0.31
Rest of
World -0.01 -0.01 -0.03 -0.01 -0.01 -0.03 -0.01 -0.01 -0.03 -0.02 -0.04 -0.07 -0.01 -0.02 -0.05 -0.01 -0.01 -0.03
Africa -0.02 -0.05 -0.12 -.03 -0.58 -1.5 -0.06 -0.13 -0.45 7.95 15.24 41.91 1.15 2.19 6.14 0.34 0.58 1.24
Source: GTAP 9 simulation results.

Table 13 illustrates the changes in exports by sectors. After signing the FTA, the biggest
drop for China occurs in the sector of livestock and meat products, with an export
decline of 0.26%, 0.46% and 1.08% under the three assumptions. The biggest growth
occurs in textiles and clothing, with growth rate of 0.36%, 0.64% and 1.5% under the
three assumptions. In the meantime, all the sectors included in the FTA show positive
growth for Madagascar and rest of Eastern Africa. Only Botswana has a decrease in
exports of grains and crops, which reveals its lack of competitiveness in the sector.
Exports in livestock and meat products increased for most African members especially
when bilateral tariffs are reduced to zero.
Table 13 Changes in exports by sector (%)
Grains and
Crops
Livestock and
Meat Products
Processed Food Textiles and
Clothing
Light
Manufacturing
Heavy
Manufacturing
Cut 30% 50% 100
%
30% 50% 100
%
30% 50% 100
%
30% 50% 100
%
30% 50% 100
%
30% 50% 100
%
China 0.06 0.12 0.41 -0.26 -0.46 -1.08 -0.01 -0.01 -0.03 0.36 0.64 1.50 0.27 0.50 1.31 -0.03 -0.07 -0.20
South Central
Africa
0.40 0.73 1.84 1.52 2.75 6.76 0.07 0.14 0.37 1.13 2.10 5.53 -1.61 -2.80 -6.22 0.66 1.19 2.91
Kenya 0.90 1.78 5.17 1.23 2.50 7.74 0.67 1.34 3.98 4.26 8.26 24.27 -1.50 -2.49 -4.73 -0.20 -0.22 0.23
Madagascar 0.01 0.04 0.17 0.04 0.10 0.31 0.08 0.14 0.33 1.98 3.65 9.50 1.65 2.94 6.92 2.41 4.43 11.53
Malawi 0.22 0.47 1.76 -0.21 -0.14 1.27 -0.26 -0.41 -0.55 -1.53 -2.33 -2.86 -3.09 -5.32 -
11.39
-0.18 -0.14 0.90
Mauritius 0.21 0.30 0.23 1.39 2.38 5.01 0.48 0.79 2.46 -3.10 -5.03 -8.81 0.63 1.00 1.67 0.49 0.74 0.90
Mozambique 0.62 1.09 2.52 0.25 0.50 1.53 0.03 0.04 -0.06 -1.23 -1.56 0.66 -0.39 -0.67 -1.45 0.41 0.76 2.02
Rwanda 0.22 0.44 1.33 -0.32 -0.61 -1.56 0.22 0.42 1.17 -2.90 -4.79 -8.58 0.57 1.09 3.05 -0.14 -0.19 -0.07
Tanzania 0.80 1.45 3.52 0.32 0.70 2.28 0.27 0.51 1.31 -2.58 -4.22 -7.38 -0.48 -0.83 -1.74 0.86 1.58 3.99
Uganda 0.35 0.66 1.77 0.38 0.77 2.45 0.29 0.53 1.41 -3.42 -5.32 -7.44 0.86 1.63 4.84 -0.87 -1.49 -3.11
Zambia 1.17 1.97 3.96 -0.71 -1.24 -2.75 -0.27 -0.49 -1.27 -0.23 -0.34 -0.18 -1.14 -2.11 -5.51 0.03 0.08 0.36
Zimbabwe 4.32 7.74 19.06 -0.84 -0.99 1.69 0.31 0.91 5.08 -6.78 -
10.21
-
11.76
-1.10 -1.37 1.78 0.90 2.08 9.20
Rest of
Eastern Africa
3.04 5.56 14.35 1.80 3.56 10.83 1.04 2.02 5.88 8.74 16.92 51.00 4.02 7.69 22.22 2.57 4.93 14.10
Botswana -0.21 -0.37 -0.92 -0.38 -0.76 -2.45 -0.14 -0.37 -1.90 13.99 26.09 69.77 1.07 1.89 4.33 -0.72 -1.26 -2.89
Namibia 0.15 0.27 0.63 0.29 0.54 1.39 0.17 0.30 0.64 -1.34 -2.15 -3.62 -0.75 -1.28 -2.77 1.09 1.94 4.54
South Africa 0.37 0.66 1.47 14.89 29.54 96.33 0.55 0.97 2.21 1.58 3.64 14.47 0.93 1.74 4.56 0.74 1.39 3.59
Southern
Africa
0.16 0.30 0.81 0.37 0.69 1.79 0.09 0.17 0.43 0.97 1.82 4.86 -0.52 -0.90 -1.94 -0.37 -0.61 -1.20
Rest of World -0.01 -0.02 -0.07 -0.04 -0.08 -0.27 -0.01 -0.02 -0.04 -0.06 -0.10 -0.11 -0.03 -0.06 -0.13 0.01 0.01 0.03
Africa 1.02 1.82 4.32 6.06 11.94 38.13 0.46 0.85 2.14 0.01 0.65 5.86 0.54 1.02 2.75 0.85 1.57 3.98
Source: GTAP 9 simulation results.
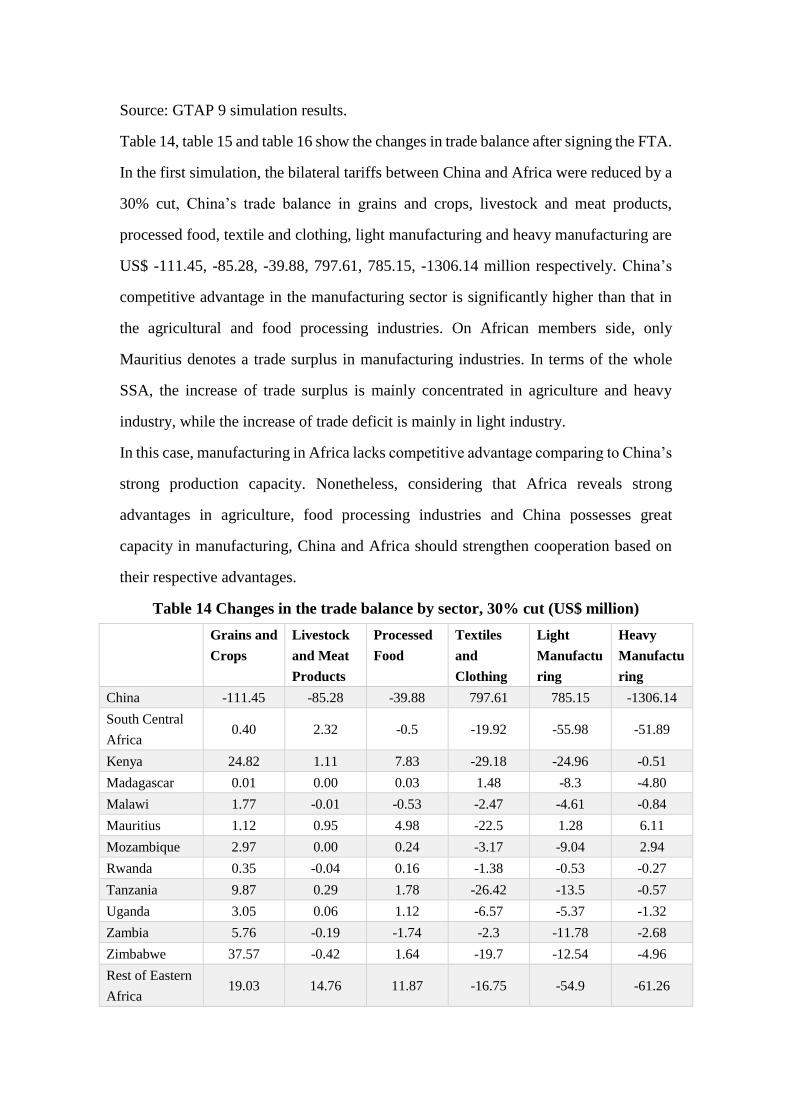
Table 14, table 15 and table 16 show the changes in trade balance after signing the FTA.
In the first simulation, the bilateral tariffs between China and Africa were reduced by a
30% cut, China’s trade balance in grains and crops, livestock and meat products,
processed food, textile and clothing, light manufacturing and heavy manufacturing are
US$ -111.45, -85.28, -39.88, 797.61, 785.15, -1306.14 million respectively. China’s
competitive advantage in the manufacturing sector is significantly higher than that in
the agricultural and food processing industries. On African members side, only
Mauritius denotes a trade surplus in manufacturing industries. In terms of the whole
SSA, the increase of trade surplus is mainly concentrated in agriculture and heavy
industry, while the increase of trade deficit is mainly in light industry.
In this case, manufacturing in Africa lacks competitive advantage comparing to China’s
strong production capacity. Nonetheless, considering that Africa reveals strong
advantages in agriculture, food processing industries and China possesses great
capacity in manufacturing, China and Africa should strengthen cooperation based on
their respective advantages.
Table 14 Changes in the trade balance by sector, 30% cut (US$ million)
Grains and
Crops
Livestock
and Meat
Products
Processed
Food
Textiles
and
Clothing
Light
Manufactu
ring
Heavy
Manufactu
ring
China -111.45 -85.28 -39.88 797.61 785.15 -1306.14
South Central
Africa 0.40 2.32 -0.5 -19.92 -55.98 -51.89
Kenya 24.82 1.11 7.83 -29.18 -24.96 -0.51
Madagascar 0.01 0.00 0.03 1.48 -8.3 -4.80
Malawi 1.77 -0.01 -0.53 -2.47 -4.61 -0.84
Mauritius 1.12 0.95 4.98 -22.5 1.28 6.11
Mozambique 2.97 0.00 0.24 -3.17 -9.04 2.94
Rwanda 0.35 -0.04 0.16 -1.38 -0.53 -0.27
Tanzania 9.87 0.29 1.78 -26.42 -13.5 -0.57
Uganda 3.05 0.06 1.12 -6.57 -5.37 -1.32
Zambia 5.76 -0.19 -1.74 -2.3 -11.78 -2.68
Zimbabwe 37.57 -0.42 1.64 -19.7 -12.54 -4.96
Rest of Eastern
Africa 19.03 14.76 11.87 -16.75 -54.9 -61.26
Botswana -0.08 -0.22 -0.12 3.40 -0.78 -7.83
Namibia 0.20 0.97 -0.36 -13.65 -8.95 17.18
South Africa 9.67 122.88 21.85 -525.81 -138.63 297.04
Southern Africa -111.45 -85.28 -39.88 797.61 785.15 -1306.14
Rest of
World -14.07 -59.71 -7.47 -139.23 -476.74 1098.38
Africa 123.22 139.06 51.43 -741.02 -435.54 258.96
Source: GTAP 9 simulation results.
Table 15 Changes in the trade balance by sector, 50% cut (US$ million)
Grains and
Crops
Livestock
and Meat
Products
Processed
Food
Textiles
and
Clothing
Light
Manufactu
ring
Heavy
Manufactu
ring
China -196.73 -165.77 -71.65 1423.43 1465.73 -2393.42
South Central
Africa 0.75 4.26 -0.68 -35.92 -100.26 -94.3
Kenya 49.02 2.25 16.08 -53.53 -48.61 1.33
Madagascar 0.11 0.01 0.11 3.08 -15.26 -8.47
Malawi 3.96 -0.02 -0.78 -4.61 -8.41 -0.84
Mauritius 1.81 1.61 8.24 -36.57 1.72 966
Mozambique 5.33 0.02 0.52 -5.92 -16.73 5.61
Rwanda 0.7 -0.07 0.31 -2.62 -1.09 -0.51
Tanzania 18.14 0.67 3.62 -47.02 -26.73 -1.35
Uganda 5.77 0.12 2.1 -12.08 -11.36 -1.92
Zambia 9.69 -0.34 -3.13 -4.42 -22.3 -2.75
Zimbabwe 67.96 -0.44 5.34 -38.56 -25.49 -5.09
Rest of Eastern
Africa 36.34 29.29 24.13 -36.06 -109.22 -112.69
Botswana -0.13 -0.42 -0.28 4.89 -1.12 -13.6
Namibia 0.36 1.78 -0.81 -25.13 -15.58 30.68
South Africa 16.97 243.65 40.39 -1004.04 -270.7 583.43
Southern Africa 0.29 0.08 0.35 -4.01 -1.72 3.49
Rest of
World -36.62 -121.8 -21.57 -178.2 -872.38 1966.59
Africa 221.72 273.54 98.69 -1396.5 -828.09 523.98
Source: GTAP 9 simulation results.
Table 16 Changes in the trade balance by sector, 100% cut (US$ million)
Grains and
Crops
Livestock
and Meat
Products
Processed
Food
Textiles
and
Clothing
Light
Manufactu
ring
Heavy
Manufactu
ring
China -445.74 -518.57 -168.98 3310.68 3915.48 -6024.29
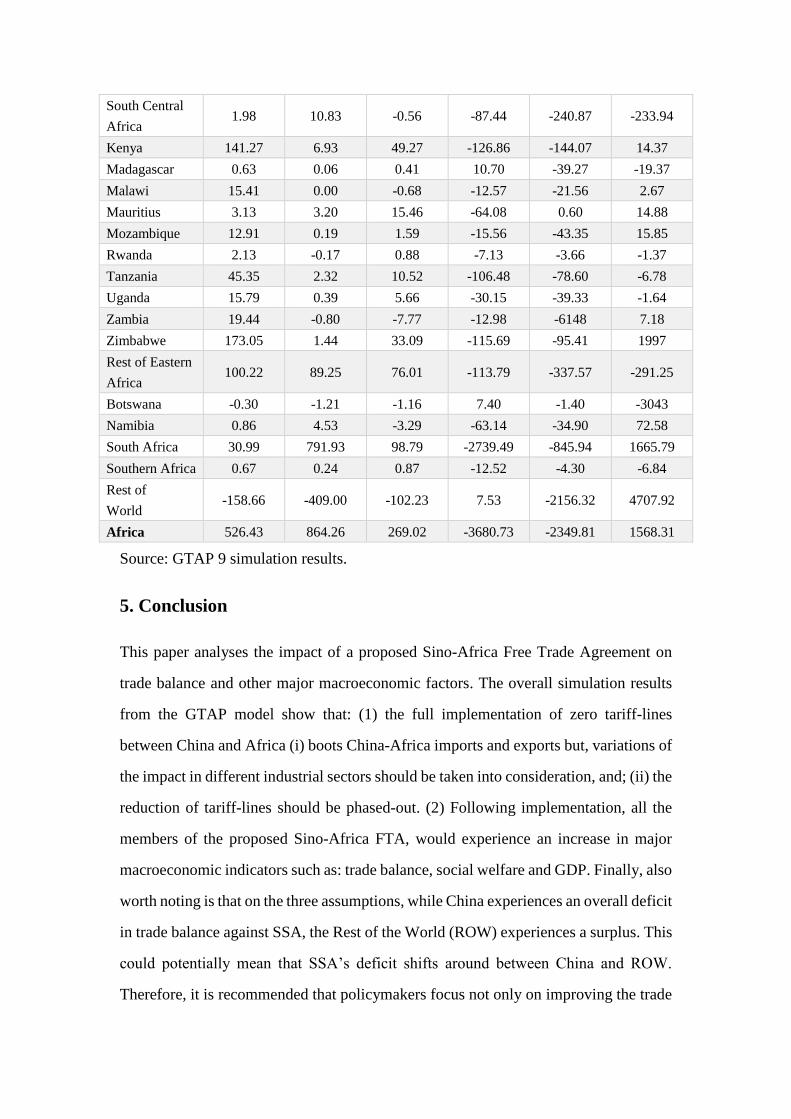
South Central
Africa 1.98 10.83 -0.56 -87.44 -240.87 -233.94
Kenya 141.27 6.93 49.27 -126.86 -144.07 14.37
Madagascar 0.63 0.06 0.41 10.70 -39.27 -19.37
Malawi 15.41 0.00 -0.68 -12.57 -21.56 2.67
Mauritius 3.13 3.20 15.46 -64.08 0.60 14.88
Mozambique 12.91 0.19 1.59 -15.56 -43.35 15.85
Rwanda 2.13 -0.17 0.88 -7.13 -3.66 -1.37
Tanzania 45.35 2.32 10.52 -106.48 -78.60 -6.78
Uganda 15.79 0.39 5.66 -30.15 -39.33 -1.64
Zambia 19.44 -0.80 -7.77 -12.98 -6148 7.18
Zimbabwe 173.05 1.44 33.09 -115.69 -95.41 1997
Rest of Eastern
Africa 100.22 89.25 76.01 -113.79 -337.57 -291.25
Botswana -0.30 -1.21 -1.16 7.40 -1.40 -3043
Namibia 0.86 4.53 -3.29 -63.14 -34.90 72.58
South Africa 30.99 791.93 98.79 -2739.49 -845.94 1665.79
Southern Africa 0.67 0.24 0.87 -12.52 -4.30 -6.84
Rest of
World -158.66 -409.00 -102.23 7.53 -2156.32 4707.92
Africa 526.43 864.26 269.02 -3680.73 -2349.81 1568.31
Source: GTAP 9 simulation results.
5. Conclusion
This paper analyses the impact of a proposed Sino-Africa Free Trade Agreement on
trade balance and other major macroeconomic factors. The overall simulation results
from the GTAP model show that: (1) the full implementation of zero tariff-lines
between China and Africa (i) boots China-Africa imports and exports but, variations of
the impact in different industrial sectors should be taken into consideration, and; (ii) the
reduction of tariff-lines should be phased-out. (2) Following implementation, all the
members of the proposed Sino-Africa FTA, would experience an increase in major
macroeconomic indicators such as: trade balance, social welfare and GDP. Finally, also
worth noting is that on the three assumptions, while China experiences an overall deficit
in trade balance against SSA, the Rest of the World (ROW) experiences a surplus. This
could potentially mean that SSA’s deficit shifts around between China and ROW.
Therefore, it is recommended that policymakers focus not only on improving the trade

balance but also on improving production, employment and social welfare. To that end
further efforts in the following areas should be considered:
5.1 Enhance industrial complementarity
Strengthening the connectivity of competitive goods and complementary industries,
might be the future focus for the trade policy front. According to the current status and
GTAP simulation results, China and Africa have strong complementary characteristics
in the field of agriculture and manufacturing. Bilateral trade should also be further
encouraged by giving full play to the capabilities of advantageous areas. In addition to
reducing tariff barriers, the process of trade facilitation should be promoted. Endorsing
measures such as, single window for customs clearance, for instance, should further
reduce bilateral non-trade barriers. Step by step, the simple bilateral trade relation of
goods should upgrade into a comprehensive partnership base incorporating services and
investment.
5.2 Outline an FTA implementation strategy
Although the overall GTAP results for the proposed FTA are particularly encouraging
for African members for the sectors of agriculture and food processing, the impact is
not homogenous; the output varies for different countries across different sectors. For
example: most African members experience positive growth in processed food output,
whereas SADC members, namely Angola, DRC, Malawi, Zambia, Namibia Lesotho
and Swaziland, display a negative change. Likewise, almost all African members
denote a trade deficit in manufacturing demonstrating China’s strong competitive
advantage, whereas Mauritius becomes the only African member with a trade surplus
in this very sector. The disparity could be a result of different macroeconomic factors
that affect the development criteria of African economies. To maximize the benefits
from the proposed FTA, African members, as per their development levels, should opt
to phase out the elimination of tariff-lines within a timeline of five to ten years. On
sensitive items, i.e. sectors where China holds an overwhelming comparative advantage
such as, manufacturing, the Agreement should phase out tariffs for over a period of
fifteen years. To determine which rates of duty, apply, members should be advised to
establish comprehensive provisions relating to rules of origin. In this context, taking

into account the need to boost Africa’s participation on the value chain development,
members should also negotiate special tariff-quotas for goods that although non-
originating from members’ territories, meet specific conditions of aggregated value
rendering it eligible for preferential treatment under the FTA.
5.3 Maximise benefits from the Belt and Road Initiative
China’s Belt and Road Initiative could be an opportunity for both China and Africa to
increase bilateral trade and cooperation of economic development post COVID.
Despite negotiating Free Trade Agreements, through the Belt and Road Initiative, trade
and economic growth are able to be accelerated through other options, such as: cross-
border economic cooperation zone and overseas economic and trade cooperation zone.
Furthermore, by joining the Belt and Road free trade area network, African members
are given an opportunity to enhance its participation in international trade and promote
its economic development to a greater extent.
5.4 Economic and structural reforms focusing on diversification
African governments should identify potential and productive industries and develop a
plan to stimulate their growth focusing on revealed and latent comparative advantage.
For example: Coffee is a major contributor to the economies of EAC members.
However, export of the crop oscillates often due to internal and external forces of supply
and demand. A proactive plan should neutralize the negative effects of these forces and
instead formulate a strategy around EAC members with a comparative advantage in
coffee. This should be replicated across Sub-Saharan Africa. Such national strategies
should look at not only existing trade flows, but also nascent opportunities. The goal
should be for policy makers to redirect their focus from commodity production and
instead upscale their participation for diversification and value chain development.
5.5 Trade promotion strategies amid COVID-19 and other global uncertainties
Before engaging into further trade openness, it is crucial that SSA countries confront
the reasons why past trials, accompanied by additional factors such as, stronger growth
rates in GDP, and financial flows, have yet to reach their ideal results. The GTAP
simulation reveals that out of all members included on the study, with South Africa
being the exception, SSA’s competitive advantage in agriculture and food processing

is still mild compared to its potential. Furthermore, according to the results, reducing
tariffs in manufacturing, i.e. in subsectors such as textile, light manufacturing and heavy
manufacturing, would prove to be highly disadvantageous for African members. It is
therefore advisable that prior to entering into new trade deals, African governments: (i)
examine existing trade agreements/provisions, such as the Chinese Duty Free Quota
Free market access program for LDCs and utilize them as a trampoline to advance their
comparative advantage on competitive sectors; (ii) boost intra-African trade partnership;
and, (iii) up-scale value chain development by allowing regional partners to collaborate
on the manufacturing of high-end goods with the ultimate goal of reaching external
markets.

References
Baier, S. L. & Bergstrand, J. H. (2004). Trade agreements and trade flows: Estimating
the effect of free trade agreements on trade flows with an application to the
European Union, European Economy-Economic Papers 2008-2015 214,
Directorate General Economic and Financial Affairs (DG ECFIN), European
Commission.
Chomo, G. V. (2002). Free Trade Agreements Between Developing and Industrialized
Countries: Comparing the U.S.-Jordan FTA with Mexico's Experience Under
NAFTA, Working Papers 15868, United States International Trade Commission,
Office of Economics.
Eisenman, J. (2012). China–Africa Trade Patterns: causes and consequences, Journal
of Contemporary China, 21(77), 793-810.
Fan, G. (2003). China's Nonperforming Loans and National Comprehensive Liability,
Asian Economic Papers, 2(1), 145-152.
Garth, S. (2004). Trading with the dragon: Prospects for a China‐South Africa FTA.
South African Journal of International Affairs. 11(2), 59-71.
Golub, S. S., Ceglowski, J., Mbaye, A. A., & Prasad, V. (2015). Can Africa Compete
with China in Manufacturing? The Role of Relative Unit Labor Costs, Working
Papers 201504, University of Cape Town, Development Policy Research Unit.
Magee, C. S. (2003). Endogenous Preferential Trade Agreements: An Empirical
Analysis, Contributions in Economic Analysis & Policy, 2(1), 1-19.
Samaro, Z. (2009). Tried and Tested: Infant Industry Theory and its Relevance for
Africa, Social Science Electronic Publishing. https://ssrn.com/abstract=1489397
Sharma, S. K. & Kallummal, M. (2012). A GTAP Analysis of the Proposed BRICS,
15th Annual Conference on Global Economic Analysis-New Challenges for
Global Trade and Sustainable Development.
Stevens, C., Irfan, I., Massa, I. & Kennan, J. (2015) The Impact of Free Trade
Agreements between Developed and Developing Countries on Economic

Development in Developing Countries: A Rapid Evidence Assessment, Overseas
Development Institute, London.
Xu, G. Y. (2007). Import Trade Structure and Economic Growth Correlation Analysis
of China, Journal of International Trade, 02, 5-9.