conference call presentation - insurance from aig in the … · conference call presentation ......
TRANSCRIPT

Conference Call PresentationFourth Quarter 2016FEBRUARY 15, 2017
©
Cautionary Statement Regarding Forward Looking InformationThis document and the remarks made within this presentation may include, and officers and representatives of American International Group, Inc. (AIG) may from time to time make, projections, goals, assumptions and statements that may constitute “forward-looking statements” within the meaning of the Private Securities Litigation Reform Act of 1995. These projections, goals, assumptions and statements are not historical facts but instead represent only AIG’s belief regarding future events, many of which, by their nature, are inherently uncertain and outside AIG’s control. These projections, goals, assumptions and statements include statements preceded by, followed by or including words such as “will,” “believe,” “anticipate,” “expect,” “intend,” “plan,” “focused on achieving,” “view,” “target,” “goal,” or “estimate.” It is possible that AIG’s actual results and financial condition will differ, possibly materially, from the results and financial condition indicated in these projections, goals, assumptions and statements. Factors that could cause AIG’s actual results to differ, possibly materially, from those in the specific projections, goals, assumptions and statements include: changes in market conditions; negative impacts on customers, business partners and other stakeholders; the occurrence of catastrophic events, both natural and man-made; significant legal proceedings; the timing and applicable requirements of any new regulatory framework to which AIG is subject as a nonbank systemically important financial institution and as a global systemically important insurer; concentrations in AIG’s investment portfolios; actions by credit rating agencies; judgments concerning casualty insurance underwriting and insurance liabilities; AIG’s ability to successfully manage Legacy portfolios; AIG’s ability to successfully reduce costs and expenses and make business and organizational changes without negatively impacting client relationships or AIG’s competitive position; AIG’s ability to successfully dispose of, or monetize, businesses or assets; judgments concerning the recognition of deferred tax assets; judgments concerning estimated restructuring charges and estimated cost savings; and such other factors discussed in Part I, Item 2. Management’s Discussion and Analysis of Financial Condition and Results of Operations (MD&A) in AIG’s Quarterly Report on Form 10-Q for the quarterly period ended September 30, 2016, Part I, Item 2. MD&A and Part II, Item 1A. Risk Factors in AIG’s Quarterly Report on Form 10-Q for the quarterly period ended June 30, 2016, Part I, Item 2. MD&A and Part II, Item 1A. Risk Factors in AIG’s Quarterly Report on Form 10-Q for the quarterly period ended March 31, 2016, and Part II, Item 7. MD&A and Part I, Item 1A. Risk Factors in AIG’s Annual Report on Form 10-K for the year ended December 31, 2016 (which will be filed with the SEC), and Part II, Item 7. MD&A and Part I, Item 1A. Risk Factors in AIG’s Annual Report on Form 10-K for the year ended December 31, 2015.
AIG is not under any obligation (and expressly disclaims any obligation) to update or alter any projections, goals, assumptions or other statements, whether written or oral, that may be made from time to time, whether as a result of new information, future events or otherwise. This document and the remarks made orally may also contain certain non-GAAP financial measures. The reconciliation of such measures to the most comparable GAAP measures in accordance with Regulation G is included in the Fourth Quarter 2016 Financial Supplement available in the Investor Information section of AIG's corporate website, www.aig.com, as well as in the Appendix to this presentation.
2

Introduction
Accomplishments for 2016
Reinsurance and Adverse Development Cover (ADC)
Outlook for 2017
3

Reduced Operating GOE
2016 Accomplishments
Divestitures & Legacy
Strong Consumer Normalized ROE
Commercial BusinessMix Reshaped
Completed or announced over 10 transactions generating approximately $10 billion in liquidity from 2016 activities, most of which was received in 2016.– Core: sales of UGC, Advisor Group, Fuji Life, Ascot, NSM, and other local insurance operations– Legacy: sales of IFC Korea, approximately 30% of the face value of the life settlement portfolio,
PICC and other assets. Executed Whole Life Reinsurance transaction.
Achieved 10%1, or $1.1 billion, reduction in Operating GOE1 in 2016, surpassing targeted 6% reduction.
2016 actions resulted in $1.3 billion of annual run-rate savings.
Consumer Insurance Normalized ROE expansion of 190 bps in 2016. Personal Insurance PTOI growth driven by strategic and portfolio actions to reduce total expenses
while maintaining a strong loss ratio. Continued momentum in high net worth market delivering double digit growth.
Retained leadership position in U.S. Retirement while streamlining distribution and exercising pricing discipline.
Trend of accident year loss ratio, as adjusted, improving after giving effect to the 4Q16 reserve strengthening impact on historical periods.
Maintained global product leadership in Financial Lines and strengthened our multinational capability. Shrunk U.S. Casualty 60% since 2011 to less than 20% of the Commercial portfolio; Adverse
development cover further minimizes reserve risk.
Capital Return toShareholders
Total capital return of $13.1 billion in 2016. Additional $1.2 billion of share repurchases from January 1, 2017 through February 14, 2017.
New share repurchase authorization of $3.5 billion.
1) On a constant dollar basis. Excludes expenses of AIG Advisor Group, w hich has been divested.
4
Expenses
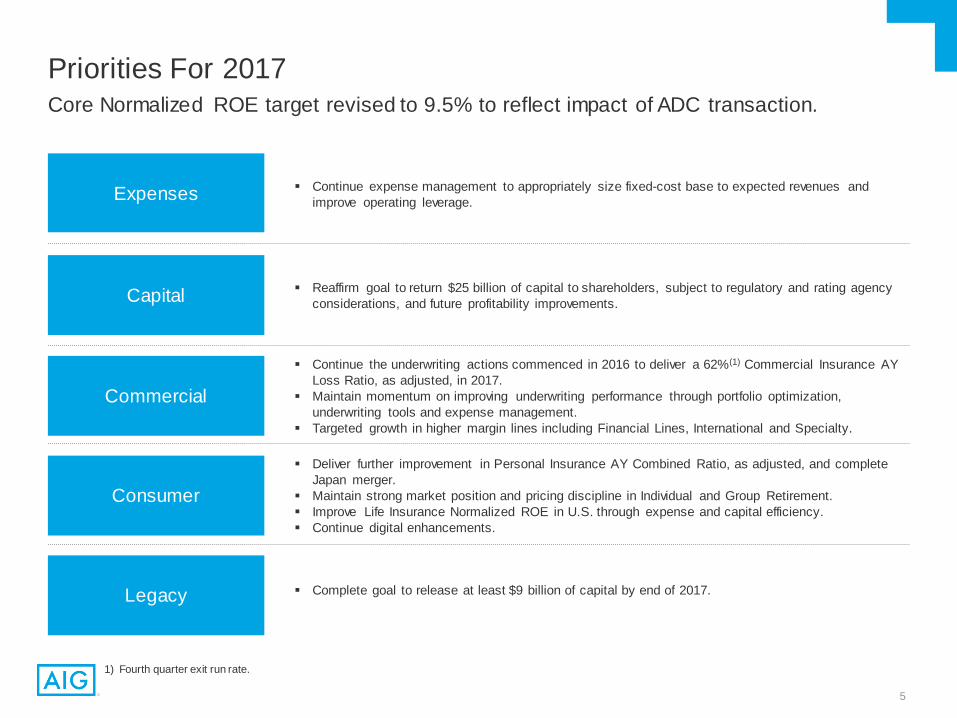
Priorities For 2017
Commercial
Consumer
Legacy
Continue the underwriting actions commenced in 2016 to deliver a 62%(1) Commercial Insurance AY Loss Ratio, as adjusted, in 2017.
Maintain momentum on improving underwriting performance through portfolio optimization, underwriting tools and expense management.
Targeted growth in higher margin lines including Financial Lines, International and Specialty.
Continue expense management to appropriately size fixed-cost base to expected revenues and improve operating leverage.
Deliver further improvement in Personal Insurance AY Combined Ratio, as adjusted, and complete Japan merger.
Maintain strong market position and pricing discipline in Individual and Group Retirement. Improve Life Insurance Normalized ROE in U.S. through expense and capital efficiency. Continue digital enhancements.
Complete goal to release at least $9 billion of capital by end of 2017.
Capital Reaffirm goal to return $25 billion of capital to shareholders, subject to regulatory and rating agency considerations, and future profitability improvements.
Core Normalized ROE target revised to 9.5% to reflect impact of ADC transaction.
1) Fourth quarter exit run rate.
5

Adverse Development Cover Losses above the attachment point are shared 80%/20% between BRK and AIG1
In 2017 and forward, the maximum losses over the current reserves before the ADC limit is exhausted is $9B (the difference between the $25B Reinsured Layer and $16B carried nominal reserve above Attachment), and will be shared $7.2B/$1.8B between BRK and AIG1
1) The gain at inception and in any subsequent period is deferred and amortized over the estimated reinsurance recovery period of paid losses using an effective interest rate method. All reserve charges arising from the covered reserves will continue to reduce AIG’s net income dollar-for-dollar.
25.0
7.5
17.5 17.5
3.2 5.0
12.8
20.05.3
16.0
0
5
10
15
20
25
30
35
40
45
50
YE2015U.S. Long Tail
Reserves
2016Paid
Losses
2016PYD
(Subject toADC)
YE2016U.S. Long Tail
Reserves
YE2016U.S. Long Tail
Reserves
ADC LimitExhaust Point
BRK (80%)
AIG (20%)
AIG (100%)
$25B Attachment
$50B Detachment
Rei
nsur
ed L
ayer
($ B)
10.7
35.7
2017 and Forw ard Scenario
80% Coverage in Excess of $25B
CededNominal
Reserves
(Pre ADC) (Post ADC)
80%
20%
Nominal Subject Reserves at YE15 $35.7B
(-) Attachment Point 25.0
(+) 9M’16 Prior Year Development 0.5
(+) 4Q’16 Prior Year Development 4.8
= Reserve Above Attachment at YE16 16.0
= Ceded Nominal Reserves at YE16 12.8
(-) Consideration with Accrued Interest 10.2
= Pre-tax Deferred Gain before Workers’ Compensation Discounting 2.6
(-) WC Discount in the Ceded Reserves 1.5
= Pre-tax Deferred Gainafter Workers’ Compensation Discounting 1.1
80%
Pre ADC Post ADC
6
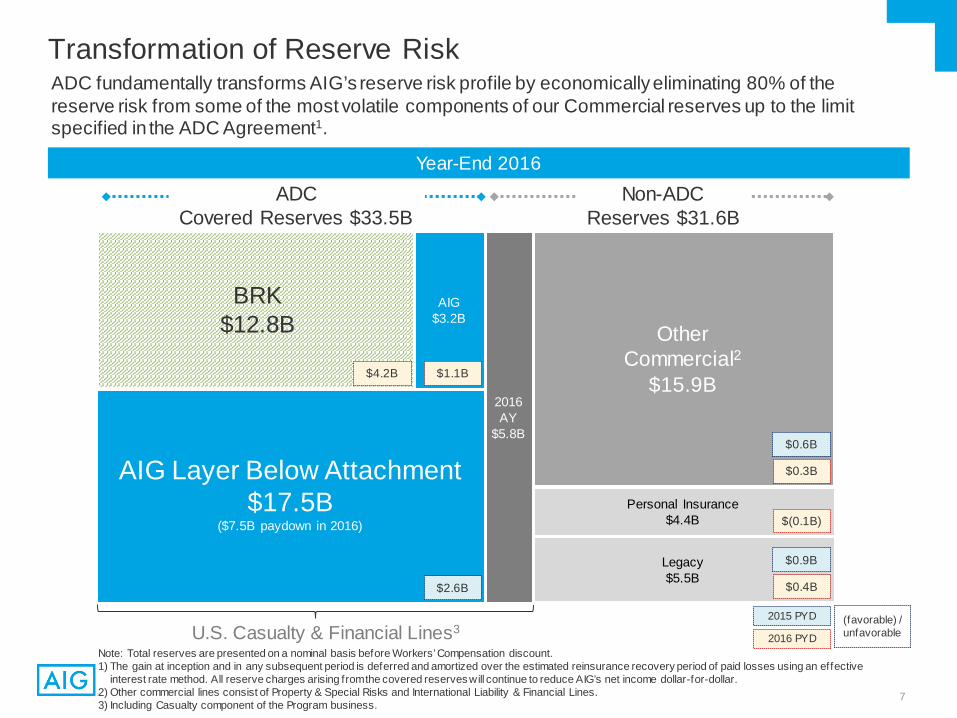
Transformation of Reserve RiskADC fundamentally transforms AIG’s reserve risk profile by economically eliminating 80% of the reserve risk from some of the most volatile components of our Commercial reserves up to the limit specified in the ADC Agreement1.
Note: Total reserves are presented on a nominal basis before Workers’ Compensation discount.1) The gain at inception and in any subsequent period is deferred and amortized over the estimated reinsurance recovery period of paid losses using an effective
interest rate method. All reserve charges arising from the covered reserves will continue to reduce AIG’s net income dollar-for-dollar.2) Other commercial lines consist of Property & Special Risks and International Liability & Financial Lines.3) Including Casualty component of the Program business.
Year-End 2016
U.S. Casualty & Financial Lines3
Legacy$5.5B
Personal Insurance$4.4B
OtherCommercial2
$15.9B
AIG Layer Below Attachment $17.5B
($7.5B paydown in 2016)
BRK$12.8B
AIG$3.2B
ADCCovered Reserves $33.5B
Non-ADCReserves $31.6B
2016 AY
$5.8B
2015 PYD
2016 PYD
$4.2B $1.1B
$0.3B
$0.6B
$0.4B
$0.9B
$2.6B
$(0.1B)
(favorable) /unfavorable
7
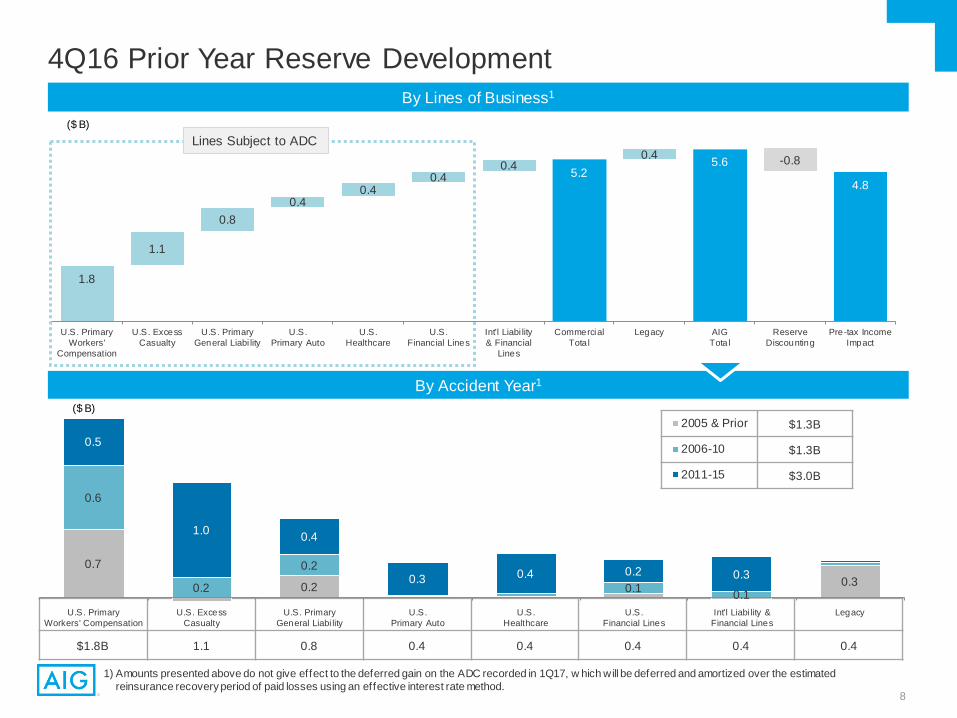
4Q16 Prior Year Reserve Development
1) Amounts presented above do not give effect to the deferred gain on the ADC recorded in 1Q17, w hich will be deferred and amortized over the estimated reinsurance recovery period of paid losses using an effective interest rate method.
$1.8B 1.1 0.8 0.4 0.4 0.4 0.4 0.4
1.8
5.2 5.25.6
4.8
1.1
0.80.4
0.40.4
0.40.4 -0.8
U.S. PrimaryWorkers'
Compensation
U.S. ExcessCasualty
U.S. PrimaryGeneral Liabi lity
U.S.Primary Auto
U.S.Healthcare
U.S.Financial Lines
Int'l Liabi lity& Financial
Lines
CommercialTota l
Legacy AIGTota l
ReserveDiscounting
Pre-tax IncomeImpact
By Lines of Business1
($ B)
By Accident Year1
0.7
0.2 0.3
0.6
0.2
0.2
0.1 0.1
0.5
1.0 0.4
0.3 0.4 0.2 0.3
U.S. PrimaryWorkers' Compensation
U.S. ExcessCasualty
U.S. PrimaryGeneral Liabi lity
U.S.Primary Auto
U.S.Healthcare
U.S.Financial Lines
Int'l Liabi lity &Financial Lines
Legacy
2005 & Prior
2006-10
2011-15
$1.3B
$1.3B
$3.0B
($ B)
Lines Subject to ADC
8
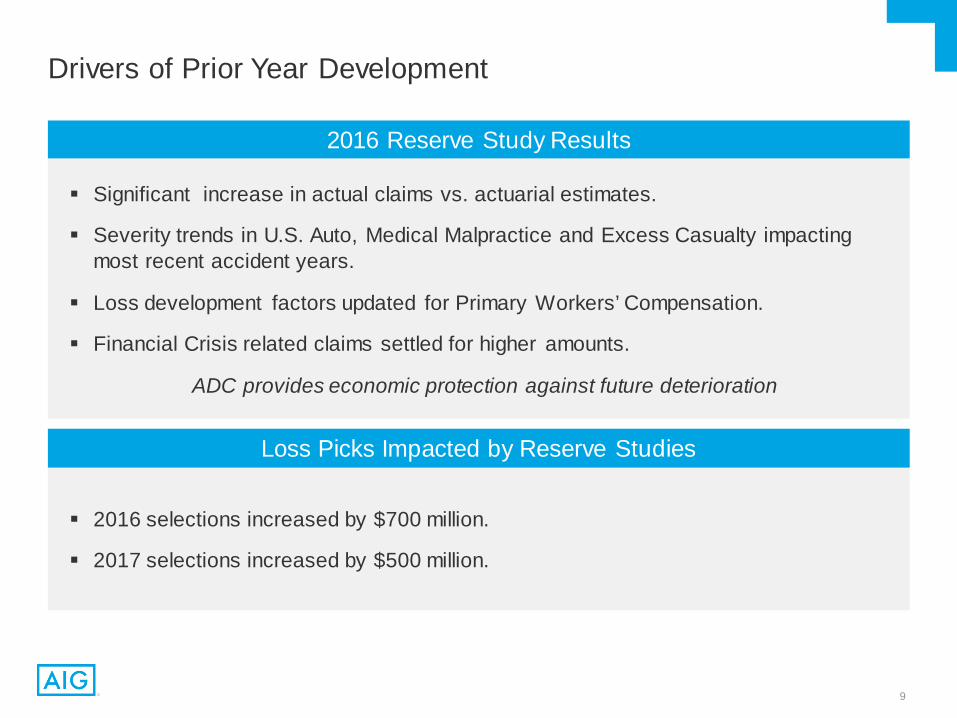
Drivers of Prior Year Development
Significant increase in actual claims vs. actuarial estimates.
Severity trends in U.S. Auto, Medical Malpractice and Excess Casualty impacting most recent accident years.
Loss development factors updated for Primary Workers’ Compensation.
Financial Crisis related claims settled for higher amounts.
ADC provides economic protection against future deterioration
2016 Reserve Study Results
2016 selections increased by $700 million.
2017 selections increased by $500 million.
Loss Picks Impacted by Reserve Studies
9

Consolidated Operating Financial Highlights($ in millions, except per share amounts) 4Q15 4Q16 FY'15 FY'16Pre-tax operating income (loss):Commercial Insurance
Liability and Financial Lines ($2,479) ($4,981) ($661) ($2,649)Property and Special Risks 53 (42) 1,226 (86)
Total Commercial Insurance (2,426) (5,023) 565 (2,735)Consumer Insurance
Individual Retirement 397 542 1,812 2,269 Group Retirement 228 261 1,100 931 Life Insurance 24 (10) (51) (37)Personal Insurance (27) 176 68 686
Total Consumer Insurance 622 969 2,929 3,849 Other Operations (123) (141) (643) (706)
Total Core (1,927) (4,195) 2,851 408 Legacy (175) 1,101 1,133 1,007 Total pre-tax operating income ($2,102) ($3,094) $3,984 $1,415 After-tax operating income attributable to AIG ($1,318) ($2,787) $2,872 $406 After-tax operating income attributable to AIG per diluted share ($1.07) ($2.72) $2.15 $0.36 Normalized Return On Equity:Consolidated 6.6% 4.8% 6.9% 7.5% Core 7.6% 3.8% 7.2% 7.8% Legacy 3.3% 10.2% 5.7% 6.3% Book Value Per Common Share (BVPS):BVPS $75.10 $76.66 Adjusted BVPS1 $58.94 $58.57 Adjusted BVPS, including dividend growth $59.26 $59.79
1) Book value per common share, ex. AOCI & DTA.
10

1) On a constant dollar basis. Excludes expenses of AIG Advisor Group, w hich has been divested.2) Adjusted for dividend grow th.3) The ratio represents quarter-end exit run rate.
2016 Financial Targets
Objective FY 2016Target FY 2016 Comments
Reduce Operating GOE
6% Reduction(~$700mm) Exceeded target by ~$400 million
IncreaseNormalized ROE
Consolidated8.4 – 8.9%
Core9.3 – 9.7%
GOE discipline, capital management actions and improved Personal Insurance underwriting margins drove improvements Shortfall against target largely driven by 4Q16
strengthening of Commercial AY 2016 losses
Adjusted Book Value Per Common Share2 14 – 16% Experienced 1% annual growth reflecting reserve
strengthening
Return Capital toShareholders $12.5B Exceeded 2016 target due to higher divestitures of
non-core assets
ImproveCommercial AYLR,
As Adjusted3~623
The 4Q16 AYLR, as adjusted, of 78.2, includes 10.8 points arising from the impact of the reserve studies on premiums earned in the first three quarters of 2016.
C a te g or y 1
C a te g or y 1
C a te g or y 1
C a te g or y 1
C a te g or y 1
10%1
($1.1B)
7.5%(Consolidated)
7.8%(Core)
1%
$13.1B
66.7(FY’16)
11
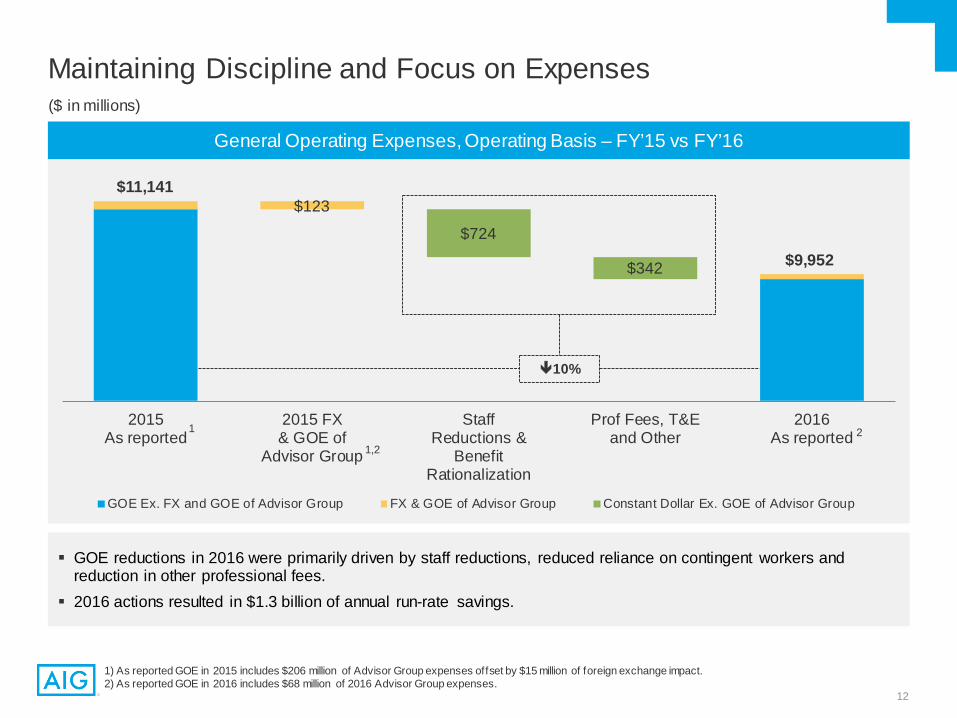
Maintaining Discipline and Focus on Expenses
General Operating Expenses, Operating Basis – FY’15 vs FY’16
($ in millions)
$123
$724
$342
2015As reported
2015 FX& GOE of
Advisor Group
StaffReductions &
BenefitRationalization
Prof Fees, T&Eand Other
2016As reported
GOE Ex. FX and GOE of Advisor Group FX & GOE of Advisor Group Constant Dollar Ex. GOE of Advisor Group
$11,141
10%
1
1,2
1) As reported GOE in 2015 includes $206 million of Advisor Group expenses offset by $15 million of foreign exchange impact.2) As reported GOE in 2016 includes $68 million of 2016 Advisor Group expenses.
$9,952
2
GOE reductions in 2016 were primarily driven by staff reductions, reduced reliance on contingent workers and reduction in other professional fees.
2016 actions resulted in $1.3 billion of annual run-rate savings.
12
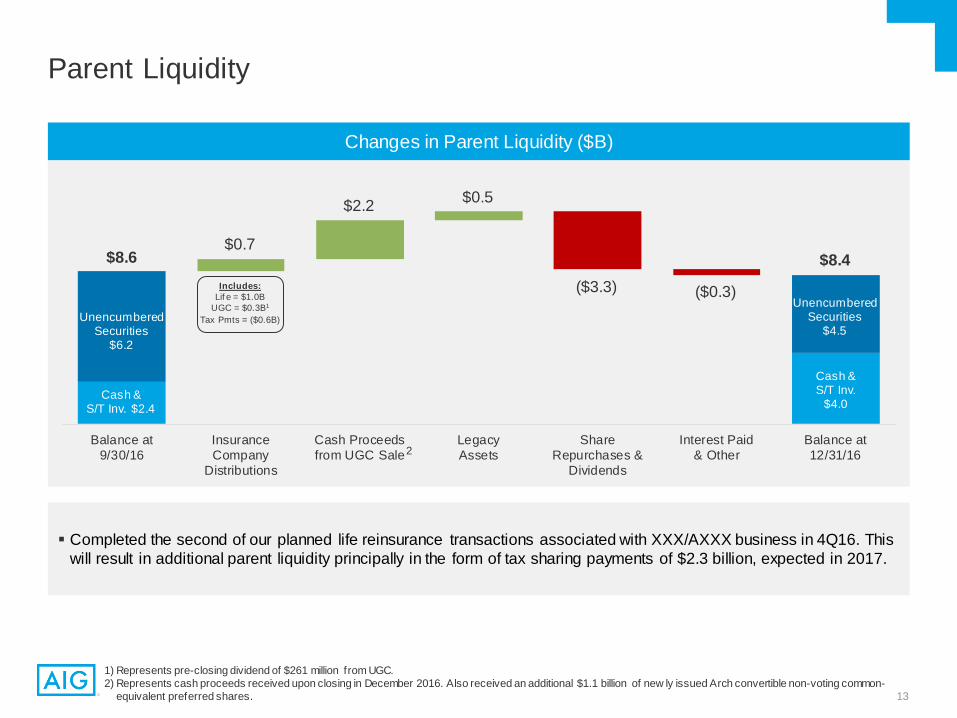
Parent Liquidity
1) Represents pre-closing dividend of $261 million from UGC.2) Represents cash proceeds received upon closing in December 2016. Also received an additional $1.1 billion of new ly issued Arch convertible non-voting common-
equivalent preferred shares.
Changes in Parent Liquidity ($B)
Balance at9/30/16
InsuranceCompany
Distributions
Cash Proceedsfrom UGC Sale
LegacyAssets
ShareRepurchases &
Dividends
Interest Paid& Other
Balance at12/31/16
$8.6
Cash & S/T Inv. $2.4
UnencumberedSecurities
$6.2
$8.4
Cash & S/T Inv.
$4.0
UnencumberedSecurities
$4.5
$0.7
$2.2 $0.5
($3.3) ($0.3)Includes:Lif e = $1.0B
UGC = $0.3B1
Tax Pmts = ($0.6B)
2
Completed the second of our planned life reinsurance transactions associated with XXX/AXXX business in 4Q16. This will result in additional parent liquidity principally in the form of tax sharing payments of $2.3 billion, expected in 2017.
13

Legacy($ in billions)
2015 2016
$7.3 $6.9
2015 2016
$37.9 $38.4
2015 2016
Attributed Equity Legacy Investments1 Legacy P&CRun-off Reserves
Legacy Life InsuranceRun-off Reserves
Legacy is managed in three sub-segments: Legacy Investments, Legacy Life Insurance Run-off Lines, and Legacy Property and Casualty Run-off Lines.
Legacy Investments decreased as a result of significant dispositions in 2016, including PICC, Korea real estate, and approximately 30% of the face value of the life settlement portfolio.
Legacy Property and Casualty reserves reflect continued run off, partially offset by PYD.
Legacy Life Insurance reserves increased, primarily due to the 3Q loss recognition charge on structured settlements.
$2.1B
$3.9B
$1.1B
$1.9B Remaining
$0 $1 $2 $3 $4 $5 $6 $7 $8 $9
Progress to Date
FY'16Legacy Run-OffInsurance Books
FY'16Legacy
Investments
YE'15
Legacy Monetization – Progress to date
$7.1B Achieved through 12/31/2016
(As of December 31)
$10.2
$6.7
4Q15 4Q16
$16.9(24%)2
$10.7(18%)2
1) Excludes assets backing run-off insurance reserves.2) Legacy Attributed equity as a percentage of AIG adjusted shareholders’ equity.
1
14

Deferred Tax Assets
As of 12/31/15 As of 12/31/16
($ in billions) Type GrossAttributes
DeferredTax Asset
GrossAttributes
DeferredTax Asset Utilization/Expiration
Net Operating LossCarryforwards Non-Life $32.6 $11.4 $31.8 $11.1
Utilize against Non-Life Companies and up to 35% of Life Insurance Companies income
2028 – 2031 expiration
Foreign Tax Credits General 5.3 3.7 Utilize against tax liability on remaining Life
Insurance Companies income 2019–2023 expiration
Subtotal –U.S. Tax Attributes 16.7 14.8
Other Deferred Tax Assets/(Liabilities)1 3.3 5.9
Net Deferred Tax Assets $20.0 $20.7
Diversified operating platform allows for utilization of valuable tax attributes
1) General Business Credits of $326 million and $27 million for 2015 and 2016, respectively, and Alternative Minimum Tax Credits of $69 million for 2016 are included in Other Deferred Tax Assets (Liabilities).
15

Book Value Per Share Growth
$44.83 $47.87
$14.11 $10.70
$14.03 $14.84
$2.12 $3.25 $0.32 $1.22 $75.41 $77.88
12/31/2015 12/31/2016
Adjusted BVPS - Core BVPS (ex AOCI) - Legacy DTA AOCI Dividend Growth
3%
7%
16

Revised Core Normalized ROE Target
Core:
Liability and Financial Lines 8.8%
Property and Special Risks (0.2)%
Total Commercial 6.0%
Individual Retirement 11.6%
Group Retirement 11.6%
Life Insurance 1.7%
Personal Insurance 10.2%
Total Consumer 10.3%
Other Operations NM
Total Core 7.8%
Legacy 6.3%
Consolidated 7.5%
FY’17 Targeted Core Normalized Return On Equity
10.0%
0.9%
9.5%
FY'17Prior Target
Impact ofReserve
Strengthening
Increase inLoss Picks
ADCImpact
FY'17Revised Target
(0.9%)
(0.5%)
FY’16 Normalized ROE
1) 2017 impact due to low er NII due to low er invested assets as a result of ADC. Assuming no additional redeployment of excess capital in 2017 as a result of the ADC.
1
17

Commercial InsuranceRobert S. Schimek Executive Vice President & Chief Executive Officer of Commercial
©

Commercial Insurance made transformational changes during 2016.Commercial Insurance – 2016 Highlights
Strategic Use of Reinsurance
UnderwritingConviction
Strengthened Reserves
U.S. Casualty Swiss Re Quota Share Berkshire Adverse Development Cover (ADC) AIG Property CAT Attachment Point Reduced from $3.0B to $1.5B Property XOL Enhanced to Further Reduce Volatility from Severe Losses
Accelerated reduction in U.S. Casualty Premiums Rigorous Underwriting Tools / Enhanced Operating Model Increased Use of Data and Analytics Granular Account Quality Index
Reserve Strengthening for AY15 and prior– Together with the ADC, fundamentally reduced reserve risk going
forward Materially Increased Current AY16 Loss Pick
19

78.0%
72.2%
69.7%
71.2%70.8%
66.7%
~62%
77.1%
70.1%
67.3% 67.0%
64.7%
~61%~59%
55%
65%
75%
2011 2012 2013 2014 2015 2016 Q4'17 ExitRun Rate
AY LR adjusted as of 4Q'16AY LR adjusted as of 4Q'15
1) Amounts presented reflect the impact of 2016 prior year development in each accident year.2) The change from the prior reported Adjusted Accident Year Loss Ratio of 66.2% to 64.7% is due to businesses exited in 2016 and transferred to Legacy (~1%),
the benefit from the UGC Quota Share agreement (0.4%). 3) The change from the prior reported Adjusted Accident Year Loss Ratio targets of 62.2% and ~60% reflect the benefit of the UGC Quota Share agreement (~1%).
Commercial Insurance AYLR, As Adjusted, Trend
Accident Year Loss Ratio, As Adjusted
2
3
3
1
20

Commercial Insurance – Portfolio Optimization Strategy
1) 2015 NPW is based on numbers reported in YE2015 f inancials, excluding UGC Quota Share and including 2016 Product/Client Exits.2) 2016 NPW excludes UGC Q/S and includes a pro-rata adjustment for Ascot. 3) Including the impact of 2016 reserve strengthening4) Nominal reserves and excluding Legacy ($370MM). 5) Major Accounts are accounts with revenues of $500 million or more. 2016 full year GPW associated w ith accounts that w ere in force as of November 1, 2016. Excludes Fronted business
Product Density: Commercial GPW for Global Major Accounts5
$7.5BN
FY15 Set FY15 NPW1
$
NPW Change from FY15 to FY162
AY Loss Ratio, as adjusted
Prior YearDevelopment
4Q’164
$$ % FY20153 FY2016
1 Grow 3.1 (0.1) -4.7% 41% 51% 0.0
2a Maintain 7.3 (0.2) -3.3% 61% 62% 0.3
2b Improve 7.3 (2.2) -28.8% 83% 74% 2.5
3 Remediate 2.7 (1.3) -46.9% 104% 96% 2.4
Total 20.4 (3.8) -18.4% 72% 68% 5.2
($B)
Total34% Decline
0%
20%
40%
60%
80%
100%
1 Product 2 Products 3-4 Products 5 or more
% o
f Gro
ss P
rem
ium
s W
ritte
n
Property & Special Risks
Financial Lines
Casualty
90% of Major Account client GPW is attributable to
clients purchasing 3 or more products.
These clients have an average tenure with AIG of
18 years.
27% International Casualty
73% US Casualty
93% ofTotal
CommercialPYD
21

$21.3 $19.5
FY'15 FY'16Liability and Financial Lines Property and Special Risks
$28.3
$2.1$1.7
$0.2
FY'15 FY'16Liability and Financial Lines Property and Special Risks
70.8%1 66.7%
30.0% 29.1%
100.8% 95.8%
FY'15 FY'16
6.1% 3.9%
8%
6%
~9%
FY'15 FY'16 FY'17 Target
Commercial Insurance – Select MetricsNormalized ROE Accident Year Combined Ratio, As Adjusted
Normalized ATOI ($B) Attributed Equity ($B)
$29.5
Impact of 2016 Reserve Strengthening
$2.3
$1.7$8.2
$8.8
Accident YearLoss Ratio
ExpenseRatio
1) Accident year loss ratio, as adjusted, after adjusting for the impact of 2016 reserve strengthening
($0.02)
22

Commercial Insurance – Liability and Financial Lines
Net Premiums Written ($B) Accident Year Combined Ratio, As Adjusted
4Q and Full Year Drivers:
Lower Normalized ROE driven by increase in current accident year loss picks for U.S. Casualty.
NPW decline driven by Swiss Re Quota Share Treaty, portfolio optimization and use of pricing tools, partially offset by growth in targeted lines of business such as Financial Lines Cyber and M&A.
Underwriting loss reflects reserve strengthening charge.
Expense ratio decline primarily driven by ceding commission income related to the reinsurance arrangements and lower employee related costs.
($ in millions) 4Q15 4Q16 FY’15 FY’16Net premiums written $2,808 $2,160 $12,570 $9,379
Net premiums earned 2,980 2,400 11,866 10,570
Underwriting loss (3,072) (5,733) (3,479) (5,349)
Net investment income 593 752 2,818 2,700
Pre-tax operating loss ($2,479) ($4,981) ($661) ($2,649)
PYD, net of R/I and premium adjustments $3,095 $5,299 $3,627 $5,385
Normalized After-tax operating income (loss) $478 ($82) $2,140 $1,712
Avg. attributed equity $20,685 $18,805 $21,281 $19,504 Normalized ROE 9.2% (1.7%) 10.1% 8.8%
70.6 91.4
70.2 73.3
15.6
12.7
15.0 13.3 12.9
14.0
13.7 13.1
99.1
118.1
98.9 99.7
4Q15 4Q16 FY15 FY16
AY Loss Ratio Acquisition Ratio GOE Ratio
45%37%
18%
17%
37%
46%
FY'15 FY'16
48%36%
12%
14%
40%
50%
4Q15 4Q16
U.S. Casualty Int'l Casualty Financial Lines
$2.8
$2.2
$12.6
$9.4
23

Commercial Insurance – Property and Special Risks
Net Premiums Written ($B) Accident Year Combined Ratio, As Adjusted
4Q and Full Year Drivers:
Decrease in Normalized ROE mainly driven by higher attritional losses in Property and poorer performance in Programs than expected.
NPW decrease driven by portfolio optimization and continued challenging market conditions.
Loss ratio increase driven by higher CATs, partially offset by lower severe losses.
Expense ratio increase mainly driven by business mix shift and the timing of premium reduction, which more than offsets expense reduction.
($ in millions) 4Q15 4Q16 FY’15 FY’16Net premiums written $1,831 $1,542 $8,046 $7,549
Net premiums earned 1,951 1,792 7,849 7,530 Underwriting income (loss) (50) (208) 623 (654)Net investment income 103 166 603 568 Pre-tax operating income (loss) $53 ($42) $1,226 ($86)
Catastrophe losses $210 $338 $573 $1,161 AAL1 $314 $317 $1,256 $1,270Normalized After-tax operating income (loss) ($4) ($73) $158 ($20)
Avg. attributed equity $8,473 $8,494 $8,226 $8,758
Normalized ROE (0.2%) (3.4%) 1.9% (0.2%)
58.1 60.5
56.4 57.4
19.0 19.0 18.5 19.2
13.7 15.713.5 13.9
90.8 95.2 88.4 90.5
4Q15 4Q16 FY15 FY16
AY Loss Ratio Acquisition Ratio GOE Ratio
8.8 4.0
Severe Loss Ratio
8.9 5.4
1) Average annual loss expectation.
54% 57%
46% 43%
FY'15 FY'16
53% 52%
47%48%
4Q15 4Q16
Property Special Risks
$1.8
$1.5
$8.0$7.5
24

Consumer InsuranceKevin HoganExecutive Vice President &Chief Executive Officer of Consumer
©
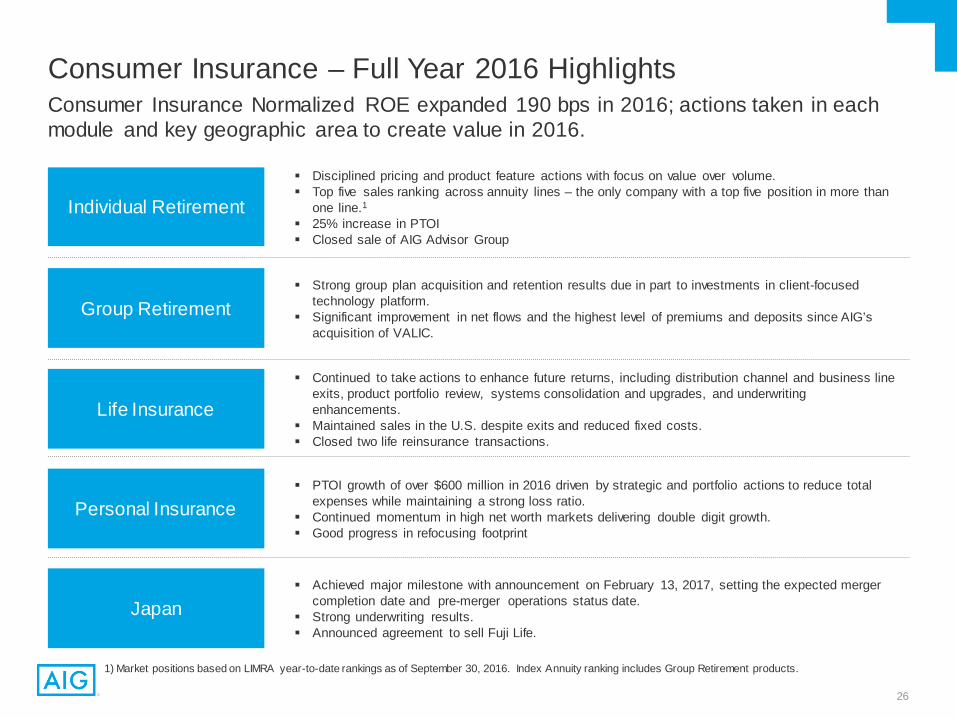
Consumer Insurance Normalized ROE expanded 190 bps in 2016; actions taken in each module and key geographic area to create value in 2016.
Individual Retirement
Consumer Insurance – Full Year 2016 Highlights
Life Insurance
Personal Insurance
Japan
Continued to take actions to enhance future returns, including distribution channel and business line exits, product portfolio review, systems consolidation and upgrades, and underwriting enhancements.
Maintained sales in the U.S. despite exits and reduced fixed costs. Closed two life reinsurance transactions.
Disciplined pricing and product feature actions with focus on value over volume. Top five sales ranking across annuity lines – the only company with a top five position in more than
one line.1 25% increase in PTOI Closed sale of AIG Advisor Group
PTOI growth of over $600 million in 2016 driven by strategic and portfolio actions to reduce total expenses while maintaining a strong loss ratio.
Continued momentum in high net worth markets delivering double digit growth. Good progress in refocusing footprint
Achieved major milestone with announcement on February 13, 2017, setting the expected merger completion date and pre-merger operations status date.
Strong underwriting results. Announced agreement to sell Fuji Life.
Group Retirement Strong group plan acquisition and retention results due in part to investments in client-focused
technology platform. Significant improvement in net flows and the highest level of premiums and deposits since AIG’s
acquisition of VALIC.
1) Market positions based on LIMRA year-to-date rankings as of September 30, 2016. Index Annuity ranking includes Group Retirement products.
26

$1.2 $0.5
$1.8
$0.9
$0.9
$0.6
$1.2
$1.1
4Q15 4Q16
Consumer Insurance – Individual Retirement($ in millions) 4Q15 4Q16 FY’15 FY’16
Premiums and deposits $5,109 $3,078 $18,376 $16,062 Premiums 34 34 137 163 Policy fees 172 181 670 709 Net investment income 904 1,010 3,805 3,878 Advisory fee and other income 460 151 1,838 1,008 Total operating revenues 1,570 1,376 6,450 5,758 Benefits and expenses 1,173 834 4,638 3,489 Pre-tax operating income $397 $542 $1,812 $2,269 Normalized after-tax operating income $325 $345 $1,211 $1,305
Avg. attributed equity $11,521 $11,059 $11,464 $11,287 Normalized ROE 11.3% 12.5% 10.6% 11.6%
3.23% 3.23% 3.10% 3.17%
2.15% 2.17% 2.20% 2.19%
4Q15 4Q16 FY'15 FY'16Variable and Index Annuities Fixed Annuities
Net Flows ($B) Base Net Investment Spread
Premiums, deposits and net flows – DOL Fiduciary Rule-related uncertainty adversely impacted industry Variable Annuity sales. Fixed Annuity sales were lower due to the sustained low interest rate environment.
Base net investment spread rates were maintained through disciplined rate setting, and included higher mortgage prepayments and accretion income.
Pre-tax operating income increased YOY, driven by:– FY reflects more favorable adjustments from assumption updates,
primarily lower surrender assumptions in Fixed Annuities;– Net investment income from alternative investments was higher in the
quarter vs. 4Q15, although lower for the full year; – Higher investment spread income driven by asset growth, mortgage
loan prepayments and unexpected accretion income, partially offset by lower reinvestment rates; and
– Higher policy fee income from growth in separate account assets.
Assets Under Administration
58%31%
11%
General accountsSeparate accountsRetail Mutual Funds
As of Dec. 31, 2016 = $140.3B
$3.8 $4.0
$8.0 $4.5
$2.8
$2.7
$3.8
$4.9
FY'15 FY'16
Premiums and Deposits ($B)
$5.1
$3.1
Fixed Annuities Variable Annuities Index Annuities Retail Mutual Funds
$18.4$16.1
$(0.2)$(0.9)
$0.9
$(0.1)
$0.8
$0.5
$0.3
$0.2
4Q15 4Q16
$(2.4) $(2.2)
$4.3
$0.9
$2.7
$2.4
$1.0
$1.9
FY'15 FY'16
$1.8
($0.3)
$5.6
$3.0
27

Consumer Insurance – Group Retirement
1.98%1.75%
2.01%1.87%
4Q15 4Q16 FY'15 FY'16
Base Net Investment Spread
For the year, investments to upgrade group plan administration record-keeping capabilities and digital functionality contributed to significantly improved group plan acquisitions, retention and net flows.
Base net investment spreads declined primarily due to low reinvestment rates, partially offset by disciplined rate management.
Pre-tax operating income for 4Q increased but FY declined, driven by:– Net investment income from alternative investments, which was
higher in the quarter vs. 4Q15, although lower for the full year;– Lower base spread income; and – Higher DAC and deferred sales inducement amortization driven by
assumption updates, lower market returns, and higher surrenders.
Assets Under Administration
49%
34%
17%
General accountsSeparate accountsGroup Retirement mutual funds
As of Dec. 31, 2016 = $95.2B
Net Flows ($B)
4Q15 4Q16
Premiums and Deposits ($B)
$1.9 $2.1
($ in millions) 4Q15 4Q16 FY’15 FY’16
Premiums and deposits $1,944 $2,056 $6,920 $7,570 Premiums 6 6 22 27 Policy fees 98 98 401 383 Net investment income 520 558 2,192 2,146 Advisory fee and other income 55 54 219 213 Total operating revenues 679 716 2,834 2,769 Benefits and expenses 451 455 1,734 1,838 Pre-tax operating income $228 $261 $1,100 $931 Normalized after-tax operating income $188 $174 $746 $717
Avg. attributed equity $6,486 $6,064 $6,577 $6,166 Normalized ROE 11.6% 11.5% 11.3% 11.6%
FY'15 FY'16
$7.6$6.9
4Q15 4Q16 FY'15 FY'16
($0.5)($0.4)
($0.6)
($2.1)
28

Consumer Insurance – Life Insurance
Premium and deposit growth from international activities.
Reserve increases for 4Q16 related mainly to administrative system conversions; in addition, FY’16 includes increases related to assumption updates.
Improved mortality experience for FY’16 in individual life.
Lower domestic general operating expenses and non-deferrable commissions from strategic actions, partially offset by growth in international.
New Business Sales
1) Other income primarily related to commission and profit sharing revenues received by Laya Healthcare from the distribution of insurance products.
55% 55% 54% 60%
33% 37% 35% 29%
12% 8% 11% 11%
4Q15 4Q16 FY'15 FY'16
By Product
Term Universal Life Health
$90 $86
82% 85% 81% 82%
18% 15% 19% 18%
4Q15 4Q16 FY'15 FY'16
By Geography
U.S. U.K.
$90 $86
($ in millions)
($ in millions) 4Q15 4Q16 FY’15 FY’16
Premiums and deposits $879 $911 $3,370 $3,519 Premiums 315 339 1,311 1,407 Policy fees 343 340 1,379 1,319 Net investment income 248 263 1,034 1,035 Advisory fee and other income1 17 14 47 57 Total operating revenues 923 956 3,771 3,818 Benefits and expenses 899 966 3,822 3,855 Pre-tax operating income (loss) $24 ($10) ($51) ($37)
Normalized after-tax operating income (loss) $21 ($16) $137 $45
Avg. attributed equity $2,820 $2,570 $2,876 $2,654 Normalized ROE 3.0% (2.5%) 4.8% 1.7%
$310 $321 $310 $321
29

Consumer Insurance – Personal Insurance
Net Premiums Written ($B) Combined Ratios
Significant performance improvement reflects:
Effective execution of strategic and portfolio actions to reduce total expenses, including refocusing direct marketing activities.
Continued underwriting actions and maintaining pricing discipline drive stable accident year loss ratio, as adjusted, while maintaining net premiums written.
Favorable prior year loss reserve development partially offset by higher catastrophe losses.
55.4 52.7 53.6 51.7
55.2 54.3
54.0 54.1
29.4 27.3 29.4 27.3 28.4 26.3 28.4 26.3
18.3 16.9 18.3 16.9 18.7 15.8 18.7 15.8
4Q15 4Q16 4Q15 4Q16 FY'15 FY'16 FY'15 FY'16Loss Ratio Acquisition Ratio GOE Ratio
103.1 96.9 101.3 95.9
($ in millions) 4Q15 4Q16 FY’15 FY’16
Net premiums written $2,729 $2,810 $11,583 $11,465
Net premiums earned 2,745 2,882 11,150 11,418
Underwriting income (88) 89 (257) 400
Net investment income 61 87 325 286
Pre-tax operating income (loss) ($27) $176 $68 $686
Normalized After-tax operating loss ($24) $85 ($98) $287
Avg. attributed equity $2,904 $2,739 $2,927 $2,821
Normalized ROE (3.3%) 12.4% (3.3%) 10.2%
Calendar Year
Accident Year, As Adjusted
60% 58% 57% 57%
40% 42% 43% 43%
4Q15 4Q16 FY'15 FY'16
$2.7
Personal Lines Accident and Health PYD Loss RatioCAT Loss Ratio
$2.8
0.31.5
1.6(0.6)
Calendar Year
Accident Year, As Adjusted
102.3 96.4 101.1 96.2
1.3(0.1)
1.4(1.2)
$11.6 $11.5
30

Q&A and Closing Remarks
©

Appendix
©

1) Primarily driven by reduced GOE, operating basis.
Core Normalized ROE Expansion
Core Normalized Return On Attributed Equity
1.0%
1.2%
FY'15 Capital OperatingImprovement
AlternativeAsset
Returns
Increase inCommercial
2016 loss picks
Other FY'16
7.2%7.8%
1
(0.4%)(0.8%)
(0.4%)
33
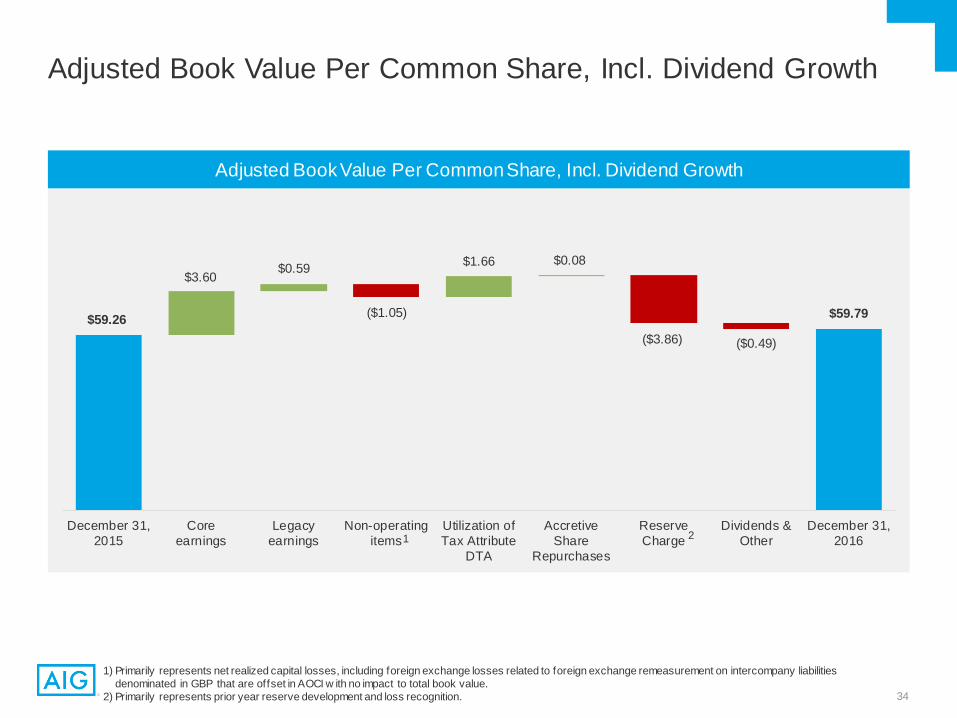
1) Primarily represents net realized capital losses, including foreign exchange losses related to foreign exchange remeasurement on intercompany liabilities denominated in GBP that are offset in AOCI w ith no impact to total book value.
2) Primarily represents prior year reserve development and loss recognition.
Adjusted Book Value Per Common Share, Incl. Dividend Growth
Adjusted Book Value Per Common Share, Incl. Dividend Growth
December 31,2015
Coreearnings
Legacyearnings
Non-operatingitems
Utilization ofTax Attribute
DTA
AccretiveShare
Repurchases
ReserveCharge
Dividends &Other
December 31,2016
$59.26 $59.79
1
$3.60
($1.05)
($3.86) ($0.49)
$1.66 $0.08
2
$0.59
34

Glossary of Non-GAAP Financial Measures and Non-GAAP Reconciliations
©
Glossary of Non-GAAP Financial MeasuresWe use certain of our operating performance measures, as discussed beginning in the next paragraph below, to define our forward-looking financial targets. Our f inancial targets are provided based on management’s estimates. The most directly comparable GAAP financial targets w ould be heavily dependent upon results that are beyond management’s controls and the outcome of these items could be signif icantly different than management’s estimates. Therefore, w e do not provide quantitative reconciliations for these f inancial targets as w e cannot predict w ith accuracy future actual events (e.g., catastrophe losses) and impacts from changes in macro economic market conditions, including the interest rate environment (e.g. estimate for DIB & GCM returns, fair value changes on PICC Investments, net reserve discount change and returns on alternative investments).
Book Value per Common Share Excluding Accumulated Other Comprehensive Income (AOCI) and Book Value per Common Share Excluding AOCI and Deferred Tax Assets (DTA) (Adjusted Book Value per Common Share) and Adjusted Book Value per Common Share Including Dividend Growthare used to show the amount of our net w orth on a per-share basis. We believe these measures are useful to investors because they eliminate items that can f luctuate signif icantly from period to period, including changes in fair value of our available for sale securities portfolio, foreign currency translation adjustments and U.S. tax attribute deferred tax assets. These measures also eliminate the asymmetrical impact resulting from changes in fair value of our available for sale securities portfolio w herein there is largely no offsetting impact for certain related insurance liabilities. We exclude deferred tax assets representing U.S. tax attributes related to net operating loss carryforwards and foreign tax credits as they have not yet been utilized. Amounts for interim periods are estimates based on projections of full-year attribute utilization. As net operating loss carryforwards and foreign tax credits are utilized, the portion of the DTA utilized is included in these book value per common share metrics. Book value per common share excluding AOCI, is derived by dividing Total AIG Shareholders’ equity, excluding AOCI, by total common shares outstanding. Adjusted Book Value per Common Share is derived by dividing Total AIG shareholders’ equity, excluding AOCI and DTA (Adjusted Shareholders’ Equity), by total common shares outstanding. Adjusted Book Value per Common Share including dividend grow th is derived by dividing Adjusted Shareholders’ Equity including grow th in quarterly dividends above $0.125 per share to shareholders, by total common shares outstanding. AIG Return on Equity – After-tax Operating Income Excluding AOCI and DTA (Adjusted Return on Equity) is used to show the rate of return on shareholders’ equity. We
believe this measure is useful to investors because it eliminates items that can f luctuate signif icantly from period to period, including changes in fair value of our available for sale securities portfolio, foreign currency translation adjustments and U.S. tax attribute deferred tax assets. This measure also eliminates the asymmetrical impact resulting from changes in fair value of our available for sale securities portfolio w herein there is largely no offsetting impact for certain related insurance liabilities. We exclude deferred tax assets representing U.S. tax attributes related to net operating loss carryforwards and foreign tax credits as they have not yet been utilized. Amounts for interim periods are estimates based on projections of full-year attribute utilization. As net operating loss carryforwards and foreign tax credits are utilized, the portion of the DTA utilized is included in Adjusted Return on Equity. Adjusted Return on Equity is derived by dividing actual or annualized after-tax operating income attributable to AIG by average Adjusted Shareholders’ Equity. AIG Normalized Return on Equity further adjusts Adjusted Return on Equity for the effects of certain volatile or market related items. We believe this measure is useful to
investors because it presents the trends in our consolidated return on equity w ithout the impact of certain items that can experience volatility in our short-term results. Normalized Return on Equity is derived by excluding the follow ing tax adjusted effects from Adjusted Return on Equity: the difference between actual and expected (i) catastrophe losses, (ii) alternative investment returns, and (iii) Direct Investment book (DIB) and Global Capital Markets (GCM) returns; fair value changes on PICC investments; update of actuarial assumptions; Life insurance incurred but not reported (IBNR) death claim charge; and prior year loss reserve development.
Core and Legacy Portfolio Attributed Equity – is an attribution of total AIG Adjusted Shareholders’ Equity to each of our modules w ithin Core and Legacy Portfolio based on our internal capital model, w hich incorporates the respective risk profiles. Attributed equity represents our best estimates based on current facts and circumstances and will change over time. Core and Legacy Portfolio Return on Equity – After-tax Operating Income (Adjusted Return on Attributed Equity) is used to show the rate of return on attributed equity.
Return on Attributed Equity is derived by dividing actual or annualized After-tax Operating Income by Average Attributed Equity.
Core and Legacy Portfolio Normalized Return on Attributed Equity (Normalized Return on Attributed Equity) further adjusts Adjusted Return on Attributed Equity for the effects of certain volatile or market-related items. We believe this measure is useful to investors because it presents the trends in our Return on Attributed Equity w ithout the impact of certain items that can experience volatility in our short-term results. Normalized Return on Attributed Equity is derived by excluding the follow ing tax adjusted effects from Return on Attributed Equity: the difference between actual and expected (i) catastrophe losses, (ii) alternative investment returns, and (iii) DIB and GCM returns; fair value changes on PICC investments; update of actuarial assumptions; Life insurance IBNR death claim charge; and prior year loss reserve development.
Glossary of Non-GAAP
36

Glossary of Non-GAAP Financial Measures After-tax Operating Income Attributable to Core and Legacy Portfolio is derived by subtracting attributed interest expense and income tax expense from pre-tax operating
income. Attributed debt and the related interest expense is calculated based on our internal capital model. Tax expense or benefit is calculated based on an internal attribution methodology that considers among other things the taxing jurisdiction in w hich the operating segments and geographies conduct business, as w ell as the deductibility of expenses in those jurisdictions.
Normalized After-tax Operating Income Attributable to Core and Legacy Portfolio further adjusts After-tax Operating Income attributable to Core and Legacy Portfolio for the effects of certain volatile or market related items. We believe this measure is useful to investors because it presents the trends in after tax operating income w ithout the impact of certain items that can experience volatility in our short-term results. Normalized After-tax Operating Income attributable to Core and Legacy Portfolio is derived by excluding the follow ing tax adjusted effects from After-tax Operating Income: the difference between actual and expected (i) catastrophe losses, (ii) alternative investment returns, and (iii) DIB and GCM returns; fair value changes on PICC investments; update of actuarial assumptions; Life insurance IBNR death claim charge; and prior year loss reserve development.
Operating Revenues exclude Net realized capital gains (losses), income from non-operating litigation settlements (included in Other income for GAAP purposes) and changes in fair value of securities used to hedge guaranteed living benefits (included in Net investment income for GAAP purposes). Operating revenues are a GAAP measure for our operating segments.
General Operating Expenses, Operating Basis (Operating GOE), is derived by making the follow ing adjustments to general operating and other expenses: include (i) certain loss adjustment expenses, reported as policyholder benefits and losses incurred and (ii) certain investment and other expenses reported as net investment income, and exclude (i) advisory fee expenses, (ii) non-deferrable insurance commissions, (iii) direct marketing and acquisition expenses, net of deferrals, (iv) non-operating litigation reserves and (v) other expense related to an asbestos retroactive reinsurance agreement. We use general operating expenses, operating basis, because w e believe it provides a more meaningful indication of our ordinary course of business operating costs, regardless of within w hich f inancial statement line item these expenses are reported externally w ithin our segment results. The majority of these expenses are employee-related costs. For example, other acquisition and loss adjustment expenses primarily represent employee-related costs in the underw riting and claims functions, respectively. Excluded from this measure are non-operating expenses (such as restructuring costs and litigation reserves), direct marketing expenses, insurance company assessments and non-deferrable commissions. We also exclude the impact of foreign exchange and the expenses of AIG Advisor Group, w hich has been divested, w hen measuring period-over-period f luctuations in General operating expenses, Operating basis.
We use the follow ing operating performance measures because we believe they enhance the understanding of the underlying profitability of continuing operations and trends of our business segments. We believe they also allow for more meaningful comparisons w ith our insurance competitors. When w e use these measures, reconciliations to the most comparable GAAP measure are provided on a consolidated basis.
Pre-tax Operating Income (PTOI) is derived by excluding the follow ing items from income from continuing operations before income tax. This definition is consistent across our modules (including geography). These items generally fall into one or more of the follow ing broad categories: legacy matters having no relevance to our current businesses or operating performance; adjustments to enhance transparency to the underlying economics of transactions; and measures that w e believe to be common to the industry. PTOI is a GAAP measure for our operating segments.
Glossary of Non-GAAP
• changes in fair value of securities used to hedge guaranteed living benefits;• changes in benefit reserves and deferred policy acquisition costs (DAC), value of
business acquired (VOBA), and sales inducement assets (SIA) related to net realized capital gains and losses;
• other income and expense — net, related to Legacy Portfolio run-off insurance lines;• loss (gain) on extinguishment of debt;• net realized capital gains and losses;• non-qualifying derivative hedging activities, excluding net realized capital gains and
losses;
• income or loss from discontinued operations;• net loss reserve discount benefit (charge);• pension expenses related to a one-time lump sum payment to former employees;• income and loss from divested businesses;• non-operating litigation reserves and settlements;• reserve development related to non-operating run-off insurance business; and• restructuring and other costs related to initiatives designed to reduce operating
expenses, improve eff iciency and simplify our organization.
37

Glossary of Non-GAAP Financial Measures After-tax Operating Income Attributable to AIG (ATOI) is derived by excluding the tax effected PTOI adjustments described above and the follow ing tax items from net income
attributable to AIG:
– deferred income tax valuation allow ance releases and charges;
– uncertain tax positions and other tax items related to legacy matters having no relevance to our current businesses or operating performance.
Ratios:We, along w ith most property and casualty insurance companies, use the loss ratio, the expense ratio and the combined ratio as measures of underw riting performance. These ratios are relative measurements that describe, for every $100 of net premiums earned, the amount of losses and loss adjustment expenses (which for CommercialInsurance excludes net loss reserve discount), and the amount of other underw riting expenses that w ould be incurred. A combined ratio of less than 100 indicates underw riting income and a combined ratio of over 100 indicates an underw riting loss. Our ratios are calculated using the relevant segment information calculated under GAAP, and thus may not be comparable to similar ratios calculated for regulatory reporting purposes. The underw riting environment varies across countries and products, as does the degree of litigation activity, all of w hich affect such ratios. In addition, investment returns, local taxes, cost of capital, regulation, product type and competition can have an effect on pricing and consequently on profitability as reflected in underw riting income and associated ratios.
Accident year loss and combined ratios, as adjusted: both the accident year loss and combined ratios, as adjusted, exclude catastrophe losses and related reinstatement premiums, prior year development, net of premium adjustments, and the impact of reserve discounting. Natural catastrophe losses are generally w eather or seismic events having a net impact in excess of $10 million each. Catastrophes also include certain man-made events, such as terrorism and civil disorders that meet the $10 million threshold. We believe the as adjusted ratios are meaningful measures of our underw riting results on an on-going basis as they exclude catastrophes and the impact of reserve discounting w hich are outside of management’s control. We also exclude prior year development to provide transparency related to current accident year results.
Accident year loss ratio, as adjusted (Adjusted for Prior Year Development) further adjusts the Accident Year Loss Ratio, as adjusted to include the impact of the prior year reserve development into each respective accident year.
Underw riting ratios are computed as follow s:
a) Loss ratio = Loss and loss adjustment expenses incurred ÷ Net premiums earned (NPE)
b) Acquisition ratio = Total acquisition expenses ÷ NPE
c) General operating expense ratio = General operating expenses ÷ NPE
d) Expense ratio = Acquisition ratio + General operating expense ratio
e) Combined ratio = Loss ratio + Expense ratio
f) Accident year loss ratio, as adjusted (AYLR) = [Loss and loss adjustment expenses incurred – CATs – PYD] ÷ [NPE +/(-) Reinstatement premiums (RIPs) related to catastrophes +/(-) RIPs related to prior year catastrophes + (Additional) returned premium related to PYD]
g) Accident year combined ratio = AYLR + Expense ratio
h) Catastrophe losses (CATs) and reinstatement premiums = [Loss and loss adjustment expenses incurred – (CATs)] ÷ [NPE +/(-) RIPs related to catastrophes] – Loss ratio
i) Prior year development net of premium adjustments = [Loss and loss adjustment expenses incurred – Prior year loss reserve development unfavorable (favorable) (PYD), net of reinsurance] ÷ [NPE +/(-) RIPs related to prior year catastrophes + (Additional) returned premium related to prior year development] – Loss ratio
Premiums and deposits: includes direct and assumed amounts received and earned on traditional life insurance policies, group benefit policies and life-contingent payout annuities, as w ell as deposits received on universal life, investment-type annuity contracts and mutual funds.
Results from discontinued operations are excluded from all of these measures.
Glossary of Non-GAAP
38

Non-GAAP Reconciliations Book Value Per Share and Return on Equity
(in millions, except per share data)
Book Value Per Share 4Q 16 4Q 15 2016 2015Total AIG shareholders' equity (a) $ 76,300 $ 89,658 $ 76,300 $ 89,658 Less: Accumulated other comprehensive income (AOCI) 3,230 2,537 3,230 2,537 Total AIG shareholders' equity, excluding AOCI (b) 73,070 87,121 73,070 87,121 Less: Deferred tax assets (DTA) 14,770 16,751 14,770 16,751 Total adjusted shareholders' equity (c) 58,300 70,370 58,300 70,370 Add: Cumulative quarterly common stock dividends above $0.125 per share 1,216 378 1,216 378 Total adjusted shareholders' equity, including dividend growth (d) $ 59,516 $ 70,748 $ 59,516 $ 70,748 Total common shares outstanding (e) 995.3 1,193.9 995.3 1,193.9 Book value per common share (a÷e) $ 76.66 $ 75.10 $ 76.66 $ 75.10 Book value per common share, excluding AOCI (b÷e) 73.41 72.97 73.41 72.97 Adjusted book value per common share (c÷e) 58.57 58.94 58.57 58.94 Adjusted book value per common share, including dividend growth (d÷e) 59.79 59.26 59.79 59.26 (in millions, except per share data)
Return O n Equity (RO E) Computations 2016 2015 2016 2015Actual or Annualized net income (loss) attributable to AIG (a) $ (12,164) $ (7,364) $ (849) $ 2,196 Actual or Annualized after-tax operating income (loss) attributable to AIG (b) $ (11,148) $ (5,272) $ 406 $ 2,872 Average AIG Shareholders' equity (c) $ 82,482 $ 94,329 $ 86,617 $ 101,558 Less: Average AOCI 6,144 4,547 5,722 7,598Less: Average DTA 15,169 16,002 15,905 15,803 Average adjusted shareholders' equity (d) 61,169 73,780 64,990 78,157 ROE (a÷c) (14.7%) (7.8%) (1.0%) 2.2%After-tax operating income (loss) as reported (e) $ (2,787) $ (1,318) $ 406 $ 2,872 Adjustments to arrive at Normalized after-tax operating income (loss):
Catastrophe losses above (below) expectations (1) (103) (143) (520) (Better) worse than expected alternative returns (1) (67) 344 356 434 (Better) worse than expected DIB & GCM returns (49) (3) 112 (80) Fair value changes on PICC investments 7 (12) 98 (26) Update of actuarial assumptions - (7) 250 4 Life Insurance - IBNR death claims - (13) (16) (13) Unfavorable (favorable) prior year loss reserve development 3,632 2,329 3,782 2,690
Normalized after-tax operating income (loss) (f) $ 735 $ 1,217 $ 4,845 $ 5,361
Adjusted return on equity (e÷d) -18.2% -7.1% 0.6% 3.7%Normalized return on equity (f÷d) 4.8% 6.6% 7.5% 6.9%
Twelve Months EndedQ uarterly December 31,
(1) The expected rate of return on alternative investments used was 8% and 9% for all periods presented in 2016 and 2015, respectively.
Twelve Months EndedQ uarterly December 31,
39

Non-GAAP ReconciliationsPre-tax and After-tax Operating Income - Consolidated
4Q 16 4Q 15 2016 2015$ (3,455) $ (2,932) $ (74) $ 3,281
150 4 (120) 43
(286) (69) (195) 15 (2) - 74 756
1,115 349 1,944 (776) (194) 1 (545) 59
2 4 (41) (82) (27) 233 (42) 233
- - - 30 (750) 86 (427) (71) 147 - 147 - 206 222 694 496
$ (3,094) $ (2,102) $ 1,415 $ 3,984
$ (3,041) $ (1,841) $ (849) $ 2,196
(247) (30) (63) 112 87 49 83 110 97 3 (78) 28
(186) (45) (127) 10 (2) - 48 491
750 215 1,322 (476) 36 - 90 - (8) 2 (236) 16 1 3 (27) (53)
(17) 151 (27) 151 - - - 20
(487) 30 (277) (55) 96 - 96 -
134 145 451 322 $ (2,787) $ (1,318) $ 406 $ 2,872
Twelve Months Ended(in millions) Q uarterly December 31,
Pre-tax income (loss) from continuing operationsAdjustments to arrive at Pre-tax operating income (loss)
Changes in fair value of securities used to hedge guaranteed living benefitsChanges in benefit reserves and DAC, VOBA and SIA related to net realized capital gains (losses)Loss (gain) on extinguishment of debtNet realized capital (gains) losses(Income) loss from divested businessesNon-operating lit igation reserves and settlementsOther (income) expense - netReserve development related to non-operating run-off insurance businessNet loss reserve discount benefit (charge)Pension expense related to a one-time lump sum payment to former employeesRestructuring and other costsPre-tax operating income (loss)
Net income (loss) attributable to AIGAdjustments to arrive at After-tax operating income (loss) (amounts net of tax, at a rate of 35%, except where noted):
Uncertain tax positions and other tax adjustments(a)Deferred income tax valuation allowance (releases) charges(a)Changes in fair value of securities used to hedge guaranteed living benefitsChanges in benefit reserves and DAC, VOBA and SIA related to net realized capital gains (losses)Loss (gain) on extinguishment of debtNet realized capital (gains) losses (b)(Income) loss from discontinued operations(a)(Income) loss from divested businesses (c)Non-operating lit igation reserves and settlementsOther (income) expense - netReserve development related to non-operating run-off insurance business
(a) Includes impact of tax only adjustments(b) The tax effect includes the impact of non-U.S. tax rates lower than 35% applied to foreign exchange (gains) or losses attributable to those jurisdictions where foreign earnings are considered to be indefinitely reinvested.(c) The tax effect included the impact of non-U.S. tax rates lower than 35% applied to (income) or losses on dispositions by foreign affiliates whose tax bases in divested subsidiaries differed from U.S. GAAP carrying values.
Net loss reserve discount benefit (charge)Pension expense related to a one-time lump sum payment to former employeesRestructuring and other costs
After-tax operating income (loss)
40

Non-GAAP ReconciliationsGeneral Operating and Other Expenses
(in millions)
4Q 16 4Q 15 2016 2015General operating and other expenses, GAAP basis $ 2,864 $ 3,472 $ 10,989 $ 12,686
Restructuring and other costs (206) (222) (694) (496) Other expense related to retroactive reinsurance agreement 10 (233) 18 (233) Pension expense related to a one-time lump sum payment to former employees (147) - (147) - Non-operating lit igation reserves (2) (7) (3) (12) Total general operating and other expenses included in pre-tax
operating income 2,519 3,010 10,163 11,945
Loss adjustment expenses, reported as policyholder benefits and losses incurred 314 392 1,345 1,632 Advisory fee expenses (79) (337) (645) (1,349) Non-deferrable insurance commissions (117) (127) (467) (504) Direct marketing and acquisition expenses, net of deferrals (172) (218) (501) (659) Investment expenses reported as net investment income and other 12 20 57 76
Total general operating expenses, operating basis 2,477 2,740 9,952 11,141 Less: FX Impact - (15) Less: GOE of Advisor Group 68 206
Total general operating expenses, operating basis, Ex. FX & GO E of AIG Advisor Group 9,884 10,950 Less: GOE of UGC 223 238
$ 9,661 $ 10,712 Total general operating expenses, operating basis, Ex. FX & GO E of AIG Advisor Group and UGC
Twelve Months EndedQ uarterly December 31,
41
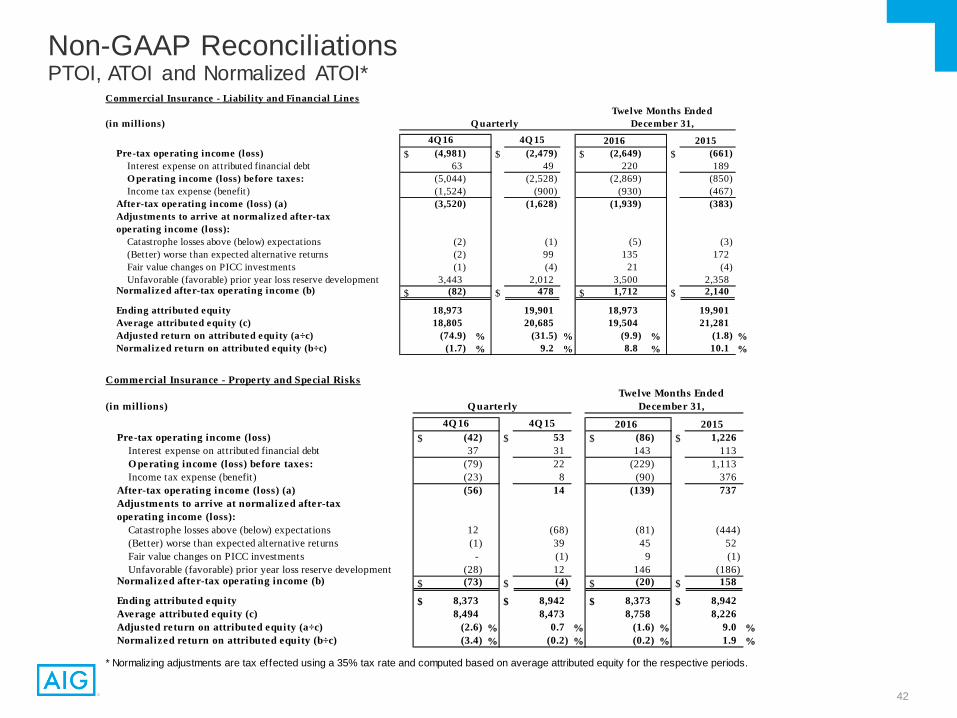
Non-GAAP ReconciliationsPTOI, ATOI and Normalized ATOI*
4Q 16 4Q 15 2016 2015$ (4,981) $ (2,479) $ (2,649) $ (661)
63 49 220 189 (5,044) (2,528) (2,869) (850) (1,524) (900) (930) (467) (3,520) (1,628) (1,939) (383)
(2) (1) (5) (3) (2) 99 135 172 (1) (4) 21 (4)
3,443 2,012 3,500 2,358 $ (82) $ 478 $ 1,712 $ 2,140
18,973 19,901 18,973 19,901 18,805 20,685 19,504 21,281
(74.9) % (31.5) % (9.9) % (1.8) %(1.7) % 9.2 % 8.8 % 10.1 %
Adjusted return on attributed equity (a÷c)Normalized return on attributed equity (b÷c)
Fair value changes on PICC investmentsUnfavorable (favorable) prior year loss reserve development
Normalized after-tax operating income (b)
Ending attributed equityAverage attributed equity (c)
After-tax operating income (loss) (a)Adjustments to arrive at normalized after-taxoperating income (loss):
Catastrophe losses above (below) expectations(Better) worse than expected alternative returns
Pre-tax operating income (loss)Interest expense on attributed financial debtO perating income (loss) before taxes:Income tax expense (benefit)
Commercial Insurance - Liability and Financial LinesTwelve Months Ended
(in millions) Q uarterly December 31,
4Q 16 4Q 15 2016 2015$ (42) $ 53 $ (86) $ 1,226
37 31 143 113 (79) 22 (229) 1,113 (23) 8 (90) 376 (56) 14 (139) 737
12 (68) (81) (444) (1) 39 45 52
- (1) 9 (1) (28) 12 146 (186)
$ (73) $ (4) $ (20) $ 158
$ 8,373 $ 8,942 $ 8,373 $ 8,942 8,494 8,473 8,758 8,226
(2.6) % 0.7 % (1.6) % 9.0 %(3.4) % (0.2) % (0.2) % 1.9 %
* Normalizing adjustments are tax effected using a 35% tax rate and computed based on average attributed equity for the respective periods.
Commercial Insurance - Property and Special RisksTwelve Months Ended
(in millions) Q uarterly December 31,
Pre-tax operating income (loss)Interest expense on attributed financial debtO perating income (loss) before taxes:Income tax expense (benefit)
After-tax operating income (loss) (a)Adjustments to arrive at normalized after-taxoperating income (loss):
Catastrophe losses above (below) expectations(Better) worse than expected alternative returns
Average attributed equity (c) Adjusted return on attributed equity (a÷c)Normalized return on attributed equity (b÷c)
Fair value changes on PICC investmentsUnfavorable (favorable) prior year loss reserve development
Normalized after-tax operating income (b)
Ending attributed equity
42

Non-GAAP ReconciliationsPTOI, ATOI, Normalized ATOI*
4Q 16 4Q 15 2016 2015$ (5,023) $ (2,426) $ (2,735) $ 565
100 80 363 302 (5,123) (2,506) (3,098) 263 (1,547) (892) (1,020) (91)
$ (3,576) $ (1,614) $ (2,078) $ 354
10 (69) (86) (447) (3) 138 180 224 (1) (5) 30 (5)
3,415 2,024 3,646 2,172 $ (155) $ 474 $ 1,692 $ 2,298
27,346 28,843 27,346 28,843 27,299 29,158 28,262 29,507
(52.4) % (22.1) % (7.4) % 1.2 %(2.3) % 6.5 % 6.0 % 7.8 %
* Normalizing adjustments are tax effected using a 35% tax rate and computed based on average attributed equity for the respective periods.
Total Commercial InsuranceTwelve Months Ended
(in millions) Q uarterly December 31,
Pre-tax operating income (loss)Interest expense on attributed financial debt
O perating income (loss) before taxes:Income tax expense (benefit)
After-tax operating income (loss) (a)Adjustments to arrive at normalized after-taxoperating income (loss):
Catastrophe losses above (below) expectations(Better) worse than expected alternative returns
Adjusted return on attributed equity (a÷c)Normalized return on attributed equity (b÷c)
Fair value changes on PICC investmentsUnfavorable (favorable) prior year loss reserve development
Normalized after-tax operating income (b)
Ending attributed equityAverage attributed equity (c)
43

Non-GAAP ReconciliationsPTOI, ATOI and Normalized ATOI*
4Q 16 4Q 15 2016 2015$ 261 $ 228 $ 931 $ 1,100
- 8 20 35 261 220 911 1,065
78 64 250 334 183 156 661 731
(9) 32 26 46 - - 30 (31)
$ 174 $ 188 $ 717 $ 746
5,984 6,280 5,984 6,280 6,064 6,486 6,166 6,577
12.1 % 9.6 % 10.7 % 11.1 %11.5 % 11.6 % 11.6 % 11.3 %
* Normalizing adjustments are tax effected using a 35% tax rate and computed based on average attributed equity for the respective periods.
Normalized after-tax operating income (b)
Ending attributed equityAverage attributed equity (c) Adjusted return on attributed equity (a÷c)Normalized return on attributed equity (b÷c)
After-tax operating income (a)Adjustments to arrive at normalized after-taxoperating income (loss):
(Better) worse than expected alternative returnsUpdate of actuarial assumptions
Pre-tax operating income (loss)
Interest expense on attributed financial debtO perating income (loss) before taxes:Income tax expense (benefit)
Consumer Insurance - Group RetirementTwelve Months Ended
(in millions) Q uarterly December 31,
4Q 16 4Q 15 2016 2015$ 542 $ 397 $ 2,269 $ 1,812
- 15 37 61 542 382 2,232 1,751 179 125 743 575 363 257 1,489 1,176
(18) 68 56 95 - - (240) (60)
$ 345 $ 325 $ 1,305 $ 1,211
$ 10,913 $ 11,525 $ 10,913 $ 11,525 11,059 11,521 11,287 11,464
13.1 % 8.9 % 13.2 % 10.3 %12.5 % 11.3 % 11.6 % 10.6 %
Ending attributed equityAverage attributed equity (c) Adjusted return on attributed equity (a÷c)Normalized return on attributed equity (b÷c)
Adjustments to arrive at normalized after-taxoperating income (loss):
(Better) worse than expected alternative returnsUpdate of actuarial assumptions
Normalized after-tax operating income (b)
Pre-tax operating incomeInterest expense on attributed financial debtO perating income (loss) before taxes:Income tax expense (benefit)
After-tax operating income (a)
Consumer Insurance - Individual RetirementTwelve Months Ended
(in millions) Q uarterly December 31,
44

Non-GAAP ReconciliationsPTOI, ATOI and Normalized ATOI*
4Q 16 4Q 15 2016 2015$ 176 $ (27) $ 686 $ 68
24 25 94 109 152 (52) 592 (41)
50 (17) 207 2 $ 102 $ (35) $ 385 $ (43)
(8) (33) (50) (65) 2 17 38 21 - - 2 -
(11) 27 (88) (11) $ 85 $ (24) $ 287 $ (98)
2,742 2,847 2,742 2,847 2,739 2,904 2,821 2,927
14.9 % (4.8) % 13.6 % (1.5) %12.4 % (3.3) % 10.2 % (3.3) %
Consumer Insurance - Personal InsuranceTwelve Months Ended
(in millions) Q uarterly December 31,
Pre-tax operating income (loss)Interest expense on attributed financial debtO perating income (loss) before taxes:Income tax expense (benefit)
After-tax operating income (loss) (a) Adjustments to arrive at normalized after-taxoperating income (loss):
Catastrophe losses above (below) expectations(Better) worse than expected alternative returns
Adjusted return on attributed equity (a÷c)Normalized return on attributed equity (b÷c)
* Normalizing adjustments are tax effected using a 35% tax rate and computed based on average attributed equity for the respective periods.
Fair value changes on PICC investmentsUnfavorable (favorable) prior year loss reserve development
Normalized after-tax operating income (b)
Ending attributed equityAverage attributed equity (c)
4Q 16 4Q 15 2016 2015(10) 24 (37) (51)
6 8 31 31 (16) 16 (68) (82)
(3) 11 (40) (121) $ (13) $ 5 $ (28) $ 39
(3) 16 13 22 - - 60 76
$ (16) $ 21 $ 45 $ 137
2,529 2,667 2,529 2,667 2,570 2,820 2,654 2,876
(2.0) % 0.7 % (1.1) % 1.4 %(2.5) % 3.0 % 1.7 % 4.8 %
Consumer Insurance - Life InsuranceTwelve Months Ended
(in millions) Q uarterly December 31,
Pre-tax operating income (loss)Interest expense on attributed financial debtO perating income (loss) before taxes:Income tax expense (benefit)
After-tax operating income (loss) (a)Adjustments to arrive at normalized after-taxoperating income (loss):
(Better) worse than expected alternative returnsUpdate of actuarial assumptions
Normalized after-tax operating income (b)
Ending attributed equityAverage Attributed equity (c) Adjusted return on attributed equity (a÷c)Normalized return on attributed equity (b÷c)
45

Non-GAAP ReconciliationsPTOI, ATOI and Normalized ATOI*
4Q 16 4Q 15 2016 2015$ (141) $ (123) $ (706) $ (643)
(175) (175) (667) (752) 34 52 (39) 109
(22) (54) (20) 101 56 106 (19) 8
(6) 12 19 16 2 (1) 6 (5) 9 - (3) 1
- - 1 - (14) (23) (38) (45)
$ 47 $ 94 $ (34) $ (25)
O ther O perations (including consolidations and eliminations)Twelve Months Ended
(in millions) Q uarterly December 31,
Pre-tax operating income (loss)Interest expense (benefit) on attributed financial debtO perating income (loss) before taxes:Income tax expense (benefit)
After-tax operating income (loss)
Adjustments to arrive at normalized after-taxoperating income (loss):
(Better) worse than expected alternative returns(Better) worse than expected DIB & GCM returnsFair value changes on PICC investmentsUpdate of actuarial assumptionsUnfavorable (favorable) prior year loss reserve development
Normalized after-tax operating income (loss)
* Normalizing adjustments are tax effected using a 35% tax rate and computed based on average attributed equity for the respective periods.
4Q 16 4Q 15 2016 2015
$ 969 $ 622 $ 3,849 $ 2,929 30 56 182 236
939 566 3,667 2,693 304 183 1,160 790 635 383 2,507 1,903
(28) 133 133 184 - - (150) (15)
(8) (33) (50) (65) - - 2 -
(11) 27 (88) (11) $ 588 $ 510 $ 2,354 $ 1,996
$ 22,168 $ 23,319 $ 22,168 $ 23,319 22,432 23,731 22,928 23,844
11.3 % 6.5 % 10.9 % 8.0 %10.5 % 8.6 % 10.3 % 8.4 %
Adjusted return on attributed equity (a÷c)Normalized return on attributed equity (b÷c)
Fair value changes on PICC investmentsUnfavorable (favorable) prior year loss reserve development
Normalized after-tax operating income (b)
Ending attributed equityAverage attributed equity (c)
Adjustments to arrive at normalized after-taxoperating income (loss):
(Better) worse than expected alternative returnsUpdate of actuarial assumptionsCatastrophe losses above (below) expectations
Pre-tax operating income (loss)Interest expense on attributed financial debtO perating income (loss) before taxes:Income tax expense (benefit)
After-tax operating income (loss) (a)
Total Consumer InsuranceTwelve Months Ended
(in millions) Q uarterly December 31,
46
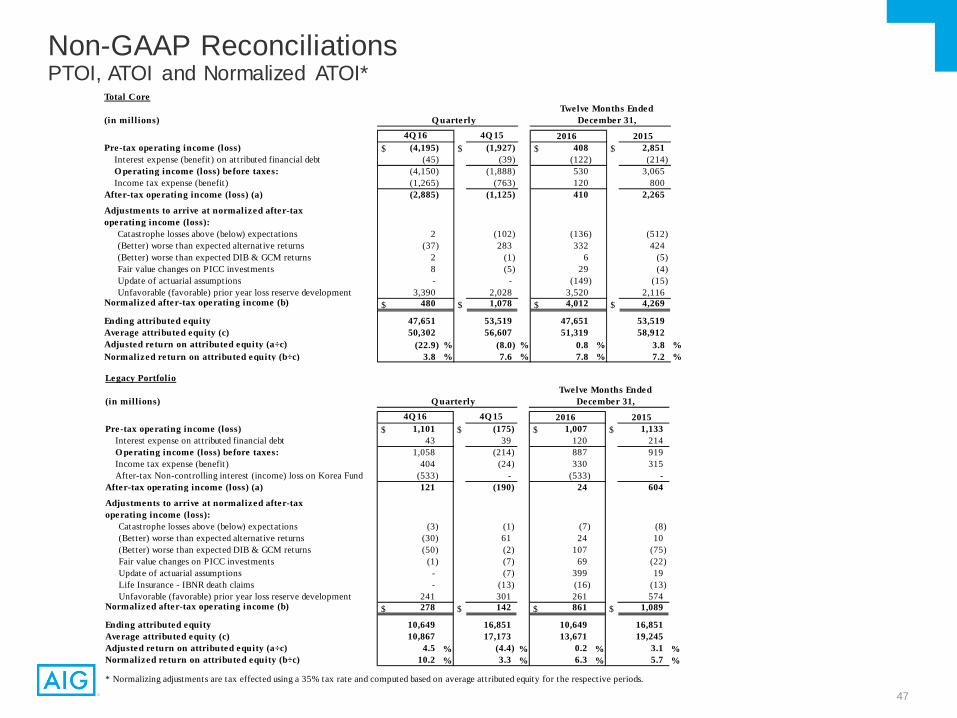
Non-GAAP ReconciliationsPTOI, ATOI and Normalized ATOI*
4Q 16 4Q 15 2016 2015$ (4,195) $ (1,927) $ 408 $ 2,851
(45) (39) (122) (214) (4,150) (1,888) 530 3,065 (1,265) (763) 120 800 (2,885) (1,125) 410 2,265
2 (102) (136) (512) (37) 283 332 424
2 (1) 6 (5) 8 (5) 29 (4) - - (149) (15)
3,390 2,028 3,520 2,116 $ 480 $ 1,078 $ 4,012 $ 4,269
47,651 53,519 47,651 53,519 50,302 56,607 51,319 58,912
(22.9) % (8.0) % 0.8 % 3.8 %3.8 % 7.6 % 7.8 % 7.2 %
Ending attributed equityAverage attributed equity (c) Adjusted return on attributed equity (a÷c)Normalized return on attributed equity (b÷c)
(Better) worse than expected DIB & GCM returnsFair value changes on PICC investmentsUpdate of actuarial assumptionsUnfavorable (favorable) prior year loss reserve development
Normalized after-tax operating income (b)
After-tax operating income (loss) (a)
Adjustments to arrive at normalized after-taxoperating income (loss):
Catastrophe losses above (below) expectations(Better) worse than expected alternative returns
Pre-tax operating income (loss)Interest expense (benefit) on attributed financial debtO perating income (loss) before taxes:Income tax expense (benefit)
Total CoreTwelve Months Ended
(in millions) Q uarterly December 31,
4Q 16 4Q 15 2016 2015$ 1,101 $ (175) $ 1,007 $ 1,133
43 39 120 214 1,058 (214) 887 919
404 (24) 330 315 (533) - (533) - 121 (190) 24 604
(3) (1) (7) (8) (30) 61 24 10 (50) (2) 107 (75)
(1) (7) 69 (22) - (7) 399 19 - (13) (16) (13)
241 301 261 574 $ 278 $ 142 $ 861 $ 1,089
10,649 16,851 10,649 16,851 10,867 17,173 13,671 19,245
4.5 % (4.4) % 0.2 % 3.1 %10.2 % 3.3 % 6.3 % 5.7 %Normalized return on attributed equity (b÷c)
* Normalizing adjustments are tax effected using a 35% tax rate and computed based on average attributed equity for the respective periods.
Unfavorable (favorable) prior year loss reserve developmentNormalized after-tax operating income (b)
Ending attributed equityAverage attributed equity (c) Adjusted return on attributed equity (a÷c)
(Better) worse than expected alternative returns(Better) worse than expected DIB & GCM returnsFair value changes on PICC investmentsUpdate of actuarial assumptionsLife Insurance - IBNR death claims
After-tax Non-controlling interest (income) loss on Korea FundAfter-tax operating income (loss) (a)
Adjustments to arrive at normalized after-taxoperating income (loss):
Catastrophe losses above (below) expectations
Pre-tax operating income (loss)Interest expense on attributed financial debtO perating income (loss) before taxes:Income tax expense (benefit)
Legacy PortfolioTwelve Months Ended
(in millions) Q uarterly December 31,
47

Non-GAAP ReconciliationsAccident Year Loss Ratio, as adjusted, and Accident Year Combined Ratio, as adjusted
4Q 16 4Q 15 2016 2015312.0 174.6 124.2 100.7
- (0.1) - (0.1) (220.6) (103.9) (50.9) (30.4)
91.4 70.6 73.3 70.2
338.7 203.1 150.6 129.4 - (0.1) - (0.1)
(220.6) (103.9) (50.9) (30.4) 118.1 99.1 99.7 98.9 Accident year combined ratio, as adjusted
Accident year loss ratio, as adjusted
Combined ratioCatastrophe losses and reinstatement premiumsPrior year development net of premium adjustments
Loss ratioCatastrophe losses and reinstatement premiumsPrior year development net of premium adjustments
Commercial Insurance - Liability and Financial LinesTwelve Months Ended
Q uarterly December 31,
4Q 16 4Q 15 2016 201577.0 69.8 75.6 60.1
(18.9) (10.8) (15.4) (7.3) 2.4 (0.9) (2.8) 3.6
60.5 58.1 57.4 56.4
111.7 102.5 108.7 92.1 (18.9) (10.8) (15.4) (7.3)
2.4 (0.9) (2.8) 3.6 95.2 90.8 90.5 88.4
Combined ratioCatastrophe losses and reinstatement premiumsPrior year development net of premium adjustments
Accident year combined ratio, as adjusted
Loss ratioCatastrophe losses and reinstatement premiumsPrior year development net of premium adjustments
Accident year loss ratio, as adjusted
Commercial Insurance - Property and Special RisksTwelve Months Ended
Q uarterly December 31,
4Q 16 4Q 15 2016 2015211.5 133.1 104.0 84.5
(8.1) (4.3) (6.5) (3.0) (125.2) (63.2) (30.8) (16.8)
78.2 65.6 66.7 64.7
241.6 163.3 133.1 114.5 (8.1) (4.3) (6.5) (3.0)
(125.2) (63.2) (30.8) (16.8) 108.3 95.8 95.8 94.7
Total Commercial InsuranceTwelve Months Ended
Q uarterly December 31,
Loss ratioCatastrophe losses and reinstatement premiumsPrior year development net of premium adjustments
Accident year combined ratio, as adjusted
Accident year loss ratio, as adjusted
Combined ratioCatastrophe losses and reinstatement premiumsPrior year development net of premium adjustments
48

Non-GAAP ReconciliationsAccident Year Loss Ratio, as adjusted, and Accident Year Combined Ratio, as adjusted
4Q 16 4Q 15 2016 201552.7 55.4 54.3 55.2 (1.6) (0.3) (1.4) (1.3) 0.6 (1.5) 1.2 0.1
51.7 53.6 54.1 54.0
96.9 103.1 96.4 102.3 (1.6) (0.3) (1.4) (1.3) 0.6 (1.5) 1.2 0.1
95.9 101.3 96.2 101.1
Combined ratioCatastrophe losses and reinstatement premiumsPrior year development net of premium adjustments
Accident year combined ratio, as adjusted
Loss ratioCatastrophe losses and reinstatement premiumsPrior year development net of premium adjustments
Accident year loss ratio, as adjusted
Consumer Personal Insurance Twelve Months Ended
Q uarterly December 31,
49

Non-GAAP ReconciliationsAccident Year Combined Ratio, as adjusted
2011 2012 2013 2014 2015 2016Loss ratio 84.3 81.0 70.3 69.7 84.5 104.0 Catastrophe losses and reinstatement premiums (11.9) (10.9) (3.4) (3.0) (3.0) (6.5) Prior year development net of premium adjustments 1.9 (1.2) (1.5) (2.1) (16.8) (30.8)
Accident year loss ratio, as adjusted 74.3 68.9 65.4 64.6 64.7 66.7
2015 2016Combined ratio 114.5 133.1 Catastrophe losses and reinstatement premiums (3.0) (6.5) Prior year development net of premium adjustments (16.8) (30.8)
Accident year combined ratio, as adjusted 94.7 95.8
Commercial Insurance Accident Year Loss Ratio, as Adjusted (incl. PYD) 2011 2012 2013 2014 2015 2016Accident year loss ratio, as adjusted 74.3 68.9 65.4 64.6 64.7 66.7 Effect of 2015 Prior Year Development on 2011 - 2015 2.8 1.2 1.9 2.4 Accident year loss ratio, as adjusted (incl. 2015 PYD) 77.1 70.1 67.3 67.0 64.7 66.7 Effect of 2016 Prior Year Development on 2011 - 2015 0.9 2.1 2.4 4.2 6.1
Accident year loss ratio, as adjusted (incl. PYD) 78.0 72.2 69.7 71.2 70.8 66.7
Commercial Insurance Accident Year Combined Ratio, as Adjusted (incl. PYD) 2015 2016Accident year combined ratio, as adjusted 94.7 95.8 Effect of 2016 Prior Year Development on 2011 - 2015 6.1
Accident year combined ratio, as adjusted (incl. PYD) 100.8 95.8
Total Commercial Insurance
Impact of UGC reinsurance treaty in Commercial 4Q16 4Q15 2016 2015 Accident year loss ratio, as adjusted - before UGC reinsurance treaty 79.3% 66.2% 67.5% 65.1%
Impact of UGC reinsurance treaty -1.1% -0.5% -0.8% -0.4% Accident year loss ratio, as adjusted - as reported - Commercial 78.2% 65.7% 66.7% 64.7% Pre-tax operating income (loss) - before UGC reinsurance treaty $ (5,063) $ (2,453) $ (2,881) $ 479 Impact of UGC reinsurance treaty* 40 27 146 86 Pre-tax operating income (loss) - as reported - Commercial $ (5,023) $ (2,426) $ (2,735) $ 565
Impact of UGC reinsurance treaty in PSR Accident year loss ratio, as adjusted - before UGC reinsurance treaty 62.5% 59.3% 59.0% 57.3%
Impact of UGC reinsurance treaty -2.0% -1.2% -1.6% -0.9% Accident year loss ratio, as adjusted - as reported - PSR 60.5% 58.1% 57.4% 56.4%
Pre-tax operating income (loss) - before UGC reinsurance treaty $ (82) $ 26 $ (232) $ 1,140 Impact of UGC reinsurance treaty* 40 27 146 86 Pre-tax operating income (loss) - as reported -PSR $ (42) $ 53 $ (86) $ 1,226
Year EndedDecember 31,
* PSR and United Guaranty each use models that are consistent with their core underlying business to defer and amortize ceding commissions related to the intercompany reinsurance agreement.
Quarterly
50
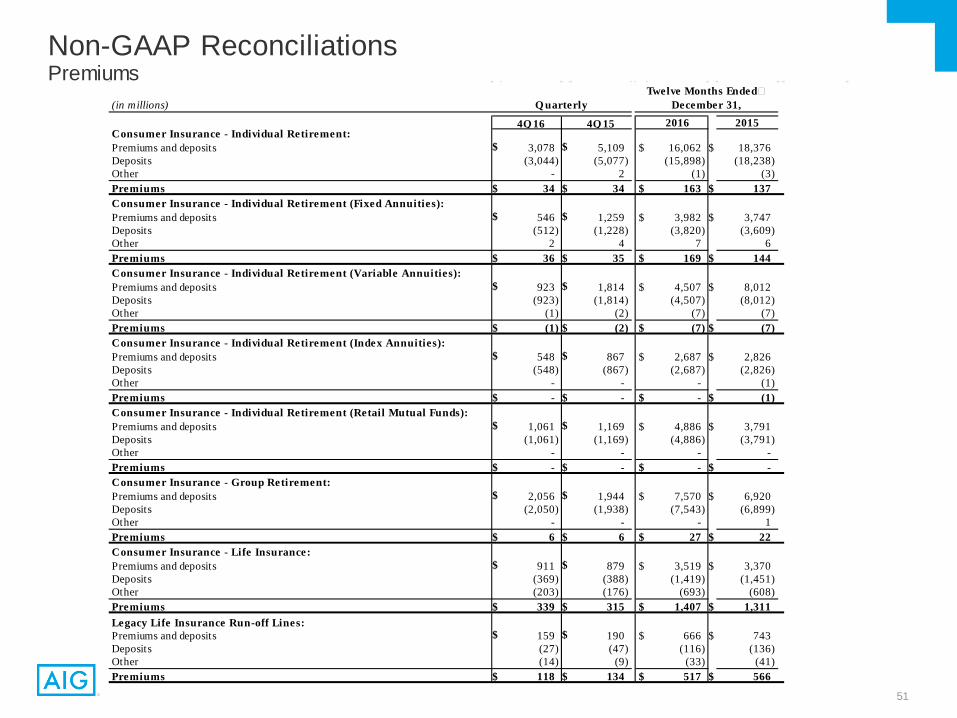
Non-GAAP ReconciliationsPremiums
(in millions)
4Q 16 4Q 15 2016 2015Consumer Insurance - Individual Retirement:Premiums and deposits $ 3,078 $ 5,109 $ 16,062 $ 18,376 Deposits (3,044) (5,077) (15,898) (18,238) Other - 2 (1) (3) Premiums $ 34 $ 34 $ 163 $ 137 Consumer Insurance - Individual Retirement (Fixed Annuities):Premiums and deposits $ 546 $ 1,259 $ 3,982 $ 3,747 Deposits (512) (1,228) (3,820) (3,609) Other 2 4 7 6 Premiums $ 36 $ 35 $ 169 $ 144 Consumer Insurance - Individual Retirement (Variable Annuities):Premiums and deposits $ 923 $ 1,814 $ 4,507 $ 8,012 Deposits (923) (1,814) (4,507) (8,012) Other (1) (2) (7) (7) Premiums $ (1) $ (2) $ (7) $ (7) Consumer Insurance - Individual Retirement (Index Annuities):Premiums and deposits $ 548 $ 867 $ 2,687 $ 2,826 Deposits (548) (867) (2,687) (2,826) Other - - - (1) Premiums $ - $ - $ - $ (1) Consumer Insurance - Individual Retirement (Retail Mutual Funds):Premiums and deposits $ 1,061 $ 1,169 $ 4,886 $ 3,791 Deposits (1,061) (1,169) (4,886) (3,791) Other - - - - Premiums $ - $ - $ - $ - Consumer Insurance - Group Retirement:Premiums and deposits $ 2,056 $ 1,944 $ 7,570 $ 6,920 Deposits (2,050) (1,938) (7,543) (6,899) Other - - - 1 Premiums $ 6 $ 6 $ 27 $ 22 Consumer Insurance - Life Insurance:Premiums and deposits $ 911 $ 879 $ 3,519 $ 3,370 Deposits (369) (388) (1,419) (1,451) Other (203) (176) (693) (608) Premiums $ 339 $ 315 $ 1,407 $ 1,311 Legacy Life Insurance Run-off Lines:Premiums and deposits $ 159 $ 190 $ 666 $ 743 Deposits (27) (47) (116) (136) Other (14) (9) (33) (41) Premiums $ 118 $ 134 $ 517 $ 566
Q uarterlyTwelve Months Ended
December 31,
51