conference call on cez group financial results in q1 2013€¦ · conference call on cez group...
TRANSCRIPT

CONFERENCE CALL ON CEZ GROUP FINANCIAL RESULTS
IN Q1 2013
NON-AUDITED CONSOLIDATED RESULTS PREPARED IN ACCORDANCE WITH THE INTERNATIONAL FINANCIAL REPORTING STANDARDS (IFRS)
(Quarterly report pursuant to Section 119a(4) of the Capital Markets Act)
Prague, May 7, 2013

AGENDA
Financial highlights and key events in CEZ Group in Q1 2013Martin Novák, Chief Financial Officer
Financial resultsMartin Novák, Chief Financial Officer
Trading position of CEZ GroupMichal Skalka, Head of Trading
1

FINANCIAL HIGHLIGHTS OF Q1 2013
earnings before interest, taxes, depreciation and amortization (EBITDA) CZK 28.3 bn
earnings before interest and taxes (EBIT) CZK 21.3 bn
net income CZK 17.9 bn
2
Comparison of Q1 2013 vs. Q1 2012 results
CZK 28.3 bnCZK 26.2 bn
CZK 21.3 bnCZK 19.8 bn
CZK 17.9 bnCZK 14.4 bn
+8.0%
+7.6%
+23.9%
5
EBITDA
EBIT
NETINCOME
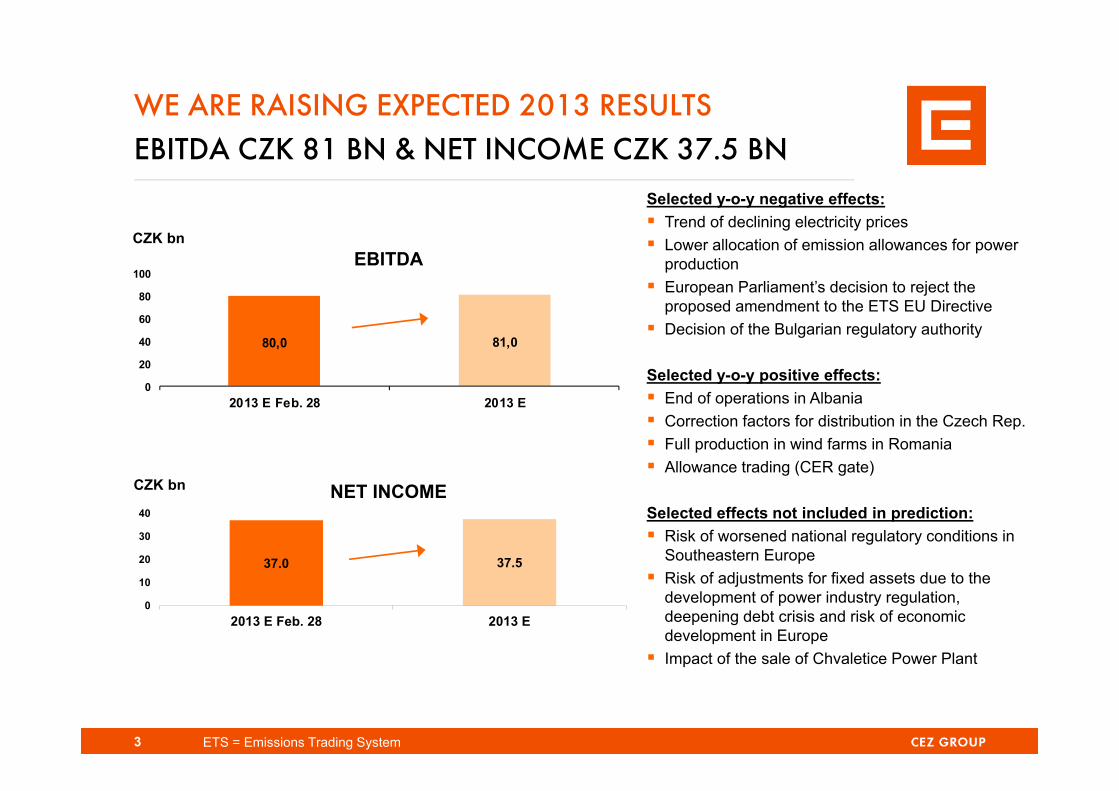
WE ARE RAISING EXPECTED 2013 RESULTSEBITDA CZK 81 BN & NET INCOME CZK 37.5 BN
80,0 81,0
0
20
40
60
80
100
2013 E Feb. 28 2013 E
37.0 37.5
0
10
20
30
40
2013 E Feb. 28 2013 E
EBITDA
NET INCOME
CZK bn
Selected y-o-y negative effects: Trend of declining electricity prices Lower allocation of emission allowances for power
production European Parliament’s decision to reject the
proposed amendment to the ETS EU Directive Decision of the Bulgarian regulatory authority
Selected y-o-y positive effects: End of operations in Albania Correction factors for distribution in the Czech Rep. Full production in wind farms in Romania Allowance trading (CER gate)
Selected effects not included in prediction: Risk of worsened national regulatory conditions in
Southeastern Europe Risk of adjustments for fixed assets due to the
development of power industry regulation, deepening debt crisis and risk of economic development in Europe
Impact of the sale of Chvaletice Power Plant
3
CZK bn
ETS = Emissions Trading System

WE SIGNED TWO STRATEGIC CONTRACTS THAT WILL
GREATLY CONTRIBUTE TO THE FUTURE STABILITY OF CEZ
AND STABILITY OF THE COAL & ELECTRICITY MARKET IN CZ
Long-term contract on coal deliveries to Počerady Power Plant Contract with Vršanská uhelná, a.s. (Czech Coal group) signed on March 19
Delivery of 5 million tons per year until the Vršany mine is decoaled (around 2062)
Initial price of CZK 38.8/GJ will gradually get to the level of 65% of hard coal price (ARA)
Contract includes CEZ’s option to sell the Počerady Power Plant in 2016 and 2024 at predefined price
A dispute resolution agreement was also signed
Sale of Chvaletice Power Plant Contract with Litvínovská uhelná, a.s. was signed on March 19
Sales price is CZK 4.12 bn plus 90% of the market price of emission allowances assigned to the Chvaletice Power Plant every year during the NAP III period (5.3 million tons of EUAs in total)
Actual deal settlement date depends on the opinion of the Czech Rep. antimonopoly body (OPC)
4

WE ARE THUS SUCCESSFULLY PURSUING OUR STRATEGY
FOR COAL PLANTS IN THE CZECH REPUBLIC
5
TušimiceLedvicePrunéřovPočerady
Modernization and
Operation until coal reserves
depletion
• Coal from our own sources or long-term coal contracts
• High efficiency• Low emissions
Strategic coal-fired plants: modern coalfield power plants with secured fuel
MělníkHodonínTisováPoříčíVítkoviceDětmaroviceChvaletice
• Market-purchased coal• Lower efficiency• Investment needed to
meet future emission limits or
Other coal-fired plants:
Optimization for heating, change of fuel
Operation until existingenvironmental limits
Sale
or

CZECH REPUBLICOTHER SELECTED EVENTS IN THE PAST QUARTER
Selection of contractor for Temelín Nuclear Power Plant units 3 & 4 March 25, notification of assessment and preliminary evaluation of bids sent to bidders: consortium of Westinghouse Electric Company, LLC and WESTINGHOUSE ELECTRIC ČR Czech-Russian consortium of ŠKODA JS, Atomstroyexport and Gidropress April 3 – 4, individual negotiations with both bidders concerning the preliminary evaluation of their bids April 15 - 18 & May 2- 3, further individual negotiations with both bidders
Record-breaking and reliable production in Q1 Thanks to highly reliable operation, nuclear power plants broke
a record in electricity generation (8.2 TWh/quarter) The margin achieved in Q1 was aided by reliable operation of coal-fired plants and higher production in hydro
plants
We increase the efficiency of hydro power plants Overhaul of Lipno Power Plant with a total investment of CZK 200 million is on schedule In December 2013, approx. 3% increase in efficiency will be achieved and production will increase by 4 million
kWh/year
6

BULGARIACEZ GROUP HAS DULY FULFILLED ITS OBLIGATIONS AS AN ENERGY LICENCE HOLDER SINCE THE BEGINNING OF ITS OPERATIONS Feb. 19, Bulgarian regulatory authority (DKEVR) announced the start of licence revocation proceedings without
giving any reason
March 5, Household electricity prices in the distribution area of CEZ Razpredelenie reduced by 7.17%; this tariff decision of the Bulgarian regulatory authority is valid until June 30, 2013
March 28, Bulgarian antimonopoly body started investigation of CEZ, Energo-Pro and the Austrian company EVN on suspicion of their cooperation on joint steps to make changing the electricity supplier more difficult for consumers; on the same day, the antimonopoly body raided the CEZ headquarters in Sofia
March 29, CEZ sent a complaint to the European Commission concerning the methods of licence granting and revocation in the energy industry as well as some other official procedures that violate Bulgarian and EU law and the Treaty on the Functioning of the EU (in the area of freedom of establishment and free movement of capital)
April 3, Bulgarian High Public Prosecutor’s Office finished the first part of investigation of electricity distributors, the Bulgarian regulatory authority (DKEVR) and the state-owned energy company (NEK EAD); on its basis, it announced its intent to commence several criminal proceedings – against these entities and the state’s representatives in the supervisory bodies of distribution companies (as for CEZ companies, this only concerns awarding public contracts that are not directly related to their licensed activities)
April 16, Public hearing of CEZ representatives with DKEVR where CEZ explained that identified irregularities (stated by DKEVR) are not of a nature allowing licence revocation. The discussion was fair and, according to the latest information, DKEVR’s decision on licence revocation will be hold up by 2 months, i.e. probably after the date of the parliamentary election
7

ABROADOTHER SELECTED EVENTS IN THE PAST QUARTER
Albania Jan. 21, The Albanian regulator decided to revoke the licences of CEZ Shpërndarje (CEZ SH) and appoint an
“administrator”, thereby assigning to him the management of CEZ SH, including the decision-making authority, responsibilities and rights of CEZ SH statutory bodies and thus the shareholder’s rights of ČEZ, a. s.
Due to the loss of CEZ’s control over it, CEZ Shpërndarje was removed from the consolidated CEZ Group, which had a one-off positive impact of CZK +1.8 bn on financial results (net income) in Q1 2013
Feb. 7, CEZ Group officially informed the Albanian government of its intention to conduct international arbitration on the grounds of a failure to protect the investment of ČEZ, a. s., in the distribution company CEZ Shpërndarje
Preparations for the initiation of the announced arbitration are underway
Romania March 29, The energy regulator published its regular annual report, containing a proposal to reduce future support
for renewables
April 2, The Ministry of Economy published draft amendment to Act 220/2008 on renewable sources, incl. a vague proposal to postpone the assignment of a portion of green certificates (GCs)
Uncertainty concerns especially the scheme of assignment of deferred GCs, GC price guarantee, approval process for the newly proposed procedure (incl. possible role and notification of the European Commission)
Poland Preliminarily negotiated coal delivery contract, incl. price reduction, for Skawina power plant for 2013 and 2014
Completed construction of Borek Szlachecki small hydro power plant with an installed capacity of 885 kW
Continued wind farm development and preparations for the commencement of construction of the first three projects from the Ecowind portfolio
8

ČEZ, A. S., 2012 DIVIDEND IS PROPOSED TO BE CZK 40, WHICH IS APPROX. 7% OF SHARE MARKET PRICE
Source: ČEZ
The proposed 2012 dividend of CZK 40 per share (gross) is in line with the dividend policy that anticipates a pay-out ratio of 50-60% of the consolidated net income of CEZ Group.
The proposed effectivedate for 2012 dividend is June 25, 2013.
Annual general meeting that will decide on the above proposals will be held on June 19, 2013.
9
2.0 2.5 4.5 8.0 9.015.0
20.0
40.050.0 53.0 50.0
45.040.0
16% 16%
32%
49%
40% 41% 43%
50%
56% 55%57%
59%
54%
0%
10%
20%
30%
40%
50%
60%
2000 2001 2002 2003 2004 2005 2006 2007 2008 2009 2010 2011 2012
Dividend per share (CZK) Payout ratio
Payout ratio (%)

Financial highlights and key events in CEZ Group in Q1 2013Martin Novák, Chief Financial Officer
Financial resultsMartin Novák, Chief Financial Officer
Trading position of CEZ GroupMichal Skalka, Head of Trading
AGENDA
10

CEZ GROUP FINANCIAL RESULTS
11 *) on the last date of the period
Financial values for 2012 throughout this presentation reflect a change in the method of reporting Sales and adjustments for fixed assets, goodwill and Financial and other expenses and revenues.
Q1 2012 Q1 2013 Change % Installed capacity *) GW 15.2 15.8 +0.6 +4%Generation of electricity TWh 19.3 18.5 -0.8 -4%Electricity distribution to end customers TWh 14.9 13.5 -1.4 -10%Electricity sales to end customers TWh 11.9 10.4 -1.5 -13%Sales of natural gas to end customers TWh 2.1 2.5 +0.4 +18%Sales of heat 000´TJ 6.8 11.0 +4.2 +62%Number of employees *) 000´s 31.3 27.1 -4.2 -14%
(CZK bn) Q1 2012 Q1 2013 Change % Revenues 60.8 60.0 -0.8 -1%EBITDA 26.2 28.3 +2.1 +8%Net income 14.4 17.9 +3.5 +24%Operating CF 16.2 16.5 +0.3 +2%CAPEX 9.4 8.8 -0.6 -7%Net debt *) 142.0 152.9 10.9 +8%

DRIVERS OF Y-O-Y CHANGE IN NET INCOME
12
14.4
17.9
2.1
0.6
2.1
0.1
11
12
13
14
15
16
17
18
19
20
Net incomeQ1 2012
EBITDA Depreciation,amortization and
impairments
Financial and otherincome (expenses)
Income taxes Net incomeQ1 2013
CZK bn
+3.5 CZK bn+24%

KEY DRIVERS OF Y-O-Y CHANGE IN EBITDA
13 ČEZ* = ČEZ, a. s., including spun-off coal-fired power plants in Počerady, Chvaletice and Dětmarovice
ČEZ* (CZK -0.6 bn) Negative impact of a drop in electricity prices significantly
compensated by revenue from trading in emission allowances, failure-free operation of nuclear plants and higher production of hydro power plants
Energotrans (CZK +0.7 bn) Effect of integration into CEZ Group (June 28, 2012)
Distribution Czech Rep. (CZK -0.3 bn) Mostly effect of seasonality of expenses on purchases
from RESs and CHP and takeover of RES & CHP purchases administration by the state-owned company OTE since Jan 1, 2013 (following a change in legislation)
Romania (CZK +0.4 bn) Production (CZK +0.6 bn) thanks to completion of Cogealac
wind park (higher volume of production +0.1 TWh and award of a second green certificate)
Distribution and sale (CZK -0.2 bn) due to an extraordinary payment of debts by Romanian state railways in 2012
Albania (CZK +1.9 bn) Eliminating of CEZ Shpërndarje’s financial results from
consolidated group due to loss of control by ČEZ, a. s., in January 2013 (zero impact on CEZ Group’s EBITDA in 2013)
26.225.6 25.6
26.0 26.0
26.4
28.3
0.6
0.7
0.3
0.4
1.9
24
25
26
27
28
29
EBITDAQ1 2012
ČEZ* Energotrans DistributionCzech Republic
Romania Albania EBITDAQ1 2013
CZK bn
+2.1 CZK bn +8%
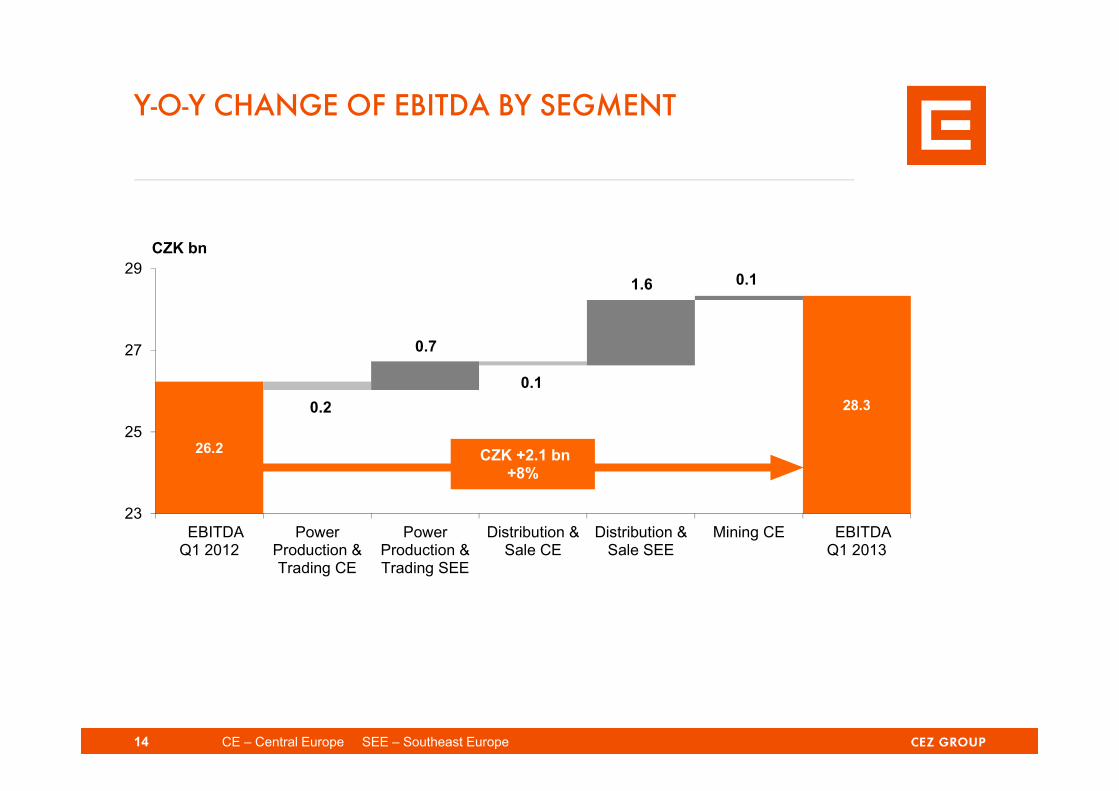
Y-O-Y CHANGE OF EBITDA BY SEGMENT
14 CE – Central Europe SEE – Southeast Europe
26.2 26.0 26.0
26.6 26.6
28.2 28.30.2
0.7
0.1
1.6 0.1
23
25
27
29
EBITDAQ1 2012
PowerProduction &Trading CE
PowerProduction &Trading SEE
Distribution &Sale CE
Distribution &Sale SEE
Mining CE EBITDAQ1 2013
CZK +2.1 bn +8%
CZK bn

ČEZ* = ČEZ, a. s., including spun-off coal-fired power plants in Počerady, Chvaletice and Dětmarovice
EBITDA BY SEGMENT: POWER PRODUCTION AND TRADING CENTRAL EUROPE
15
Czech Republic (CZK +0.1 bn) Y-o-y drop in realization prices of electricity and lower electricity generation in ČEZ* coal-fired power plants (CZK -1.4 bn)
Positive effect of trading in emission allowances (incl. utilization of a part of CER gate) and other ČEZ* effects (CZK +0.8 bn)
Effect of Energotrans integration into CEZ Group on June 28, 2012 (CZK +0.7 bn)
Poland (CZK -0.3 bn) Lower revenues due to a drop in the price of assigned colour certificates (CZK -0.2 bn)
Expenses on emission allowance purchases within NAP III, assigned for free (NAP II) in 2012 (CZK -0.1 bn)
CZK bn Q1 2012 Q1 2013 Change %Czech Republic 17.1 17.2 0.1 +0%Poland 0.6 0.3 -0.3 -44%Total EBITDA 17.7 17.5 -0.2 -1%

EBITDA BY SEGMENT:POWER PRODUCTION AND TRADING SOUTHEAST EUROPE
16
Bulgaria (CZK +0.1 bn) Higher revenues from availability due to y-o-y lower activation of cold reserve
Slight increase in regulated sales prices from July 1, 2012
Romania (CZK +0.6 bn) Higher power production in Fântânele and Cogealac wind parks +0.1 TWh
Higher revenue due to the start of assignment of a second green certificate for Cogealac production in Q4 2012
CZK bn Q1 2012 Q1 2013 Change %Bulgaria 0.0 0.1 +0.1 -Romania 0.8 1.4 +0.6 +60%Total EBITDA 0.8 1.5 +0.7 +71%

EBITDA BY SEGMENT:DISTRIBUTION AND SALE CENTRAL EUROPE
17
Distribution (CZK -0.3 bn) Effect of seasonality of expenses on purchases from RESs and CHP and takeover of RES & CHP
purchases administration by the state-owned company OTE (following a change in legislation) on Jan. 1, 2013 (CZK -0.4 bn)
Operational cost savings (CZK +0.1 bn)
Sale (CZK +0.2 bn) Higher margin on natural gas sales in the Czech Rep., especially due to continued growth in the number of
customers and below-average temperatures in Q1 2013 (CZK +0.1 bn)
Higher margin on electricity sales in the Czech Rep. (CZK +0.1 bn)
CZK bn Q1 2012 Q1 2013 Change %Distribution 4.5 4.2 -0.3 -7%Sale 1.1 1.3 +0.2 +23%Total EBITDA 5.6 5.5 -0.1 -1%
RESs – renewable resources CHP – combined heat and power production

Romania (CZK -0.2 bn) Extraordinary earnings in Q1 2012 associated with payment of debts by Romanian state railways (CZK -0.4 bn) Higher revenues on electricity sales (CZK +0.2 bn)
Bulgaria (CZK -0.1 bn) Additions to adjustments for receivables due to worsened payment behaviour in connection with massive political
protests against the Bulgarian government and high electricity bills at the beginning of the year
Albania (CZK +1.9 bn) Eliminating of CEZ Shpërndarje’s financial results from consolidated group due to loss of control by ČEZ, a. s. in
January 2013 In 2013, CEZ Shpërndarje operations has had zero impact on CEZ Group’s consolidated EBITDA
EBITDA BY SEGMENT: DISTRIBUTION AND SALE SOUTHEAST EUROPE
18
CZK bn Q1 2012 Q1 2013 Change %Romania 0.6 0.4 -0.2 -35%Bulgaria 0.4 0.3 -0.1 -19%Albania -1.9 0.0 +1.9 -Total EBITDA -0.9 0.7 +1.6 -

EBITDA (CZK bn) Q1 2012 Q1 2013 Change %Mining CE 1.4 1.5 +0.1 +3%Other CE 1.5 1.5 0.0 -0%Other SEE 0.1 0.1 0.0 +5%
EBITDA BY SEGMENT: MINING CENTRAL EUROPE,OTHER CENTRAL AND SOUTHEAST EUROPE
19 CE – Central Europe SEE – Southeast Europe
Mining Central Europe (CZK +0.1 bn) Reduction in coal and industrial mixture deliveries for ČEZ, a. s., was compensated by increased sales of
sized coal and higher delivery of more calorific coal for Energotrans

OTHER INCOME (EXPENSES)
20
Depreciation, amortization and impairments (CZK -0.6 bn) Mainly growth in depreciation and amortization as a result of acquisitions and investments in fixed assets, especially in
the Czech Rep.
Interest income (expenses) (CZK -0.3 bn) Growth in interest expense due to a higher volume of issued bonds, effect of weakening of CZK/EUR exchange rate
Income (expenses) from investments (CZK +1.8 bn) Extraordinary one-off impact of exclusion of CEZ Shpërndarje from the consolidated results of CEZ Group (CZK +1.8 bn)
Other income (expenses) (CZK +0.5 bn) Y-o-y difference in revaluation of MOL option in Q1 (CZK -1.6 bn) Other financial derivatives and exchange rate gains/losses (CZK +1.7 bn) Effect of gift tax on emission allowances and other effects (CZK +0.4 bn)
(CZK bn) Q1 2012 Q1 2013 Change %EBITDA 26.2 28.3 +2.1 +8%Depreciation, amortization and impairments -6.4 -7.0 -0.6 -9%Financial and other income (expenses) -1.8 0.3 +2.1 - Interest income (expenses) -0.5 -0.8 -0.3 -47% Interest on nuclear nad other provisions -0.5 -0.4 +0.1 +12% Income (expenses) from investments 0.3 2.1 +1.8 >200% Other income (expenses) -1.1 -0.6 +0.5 +41%Income taxes -3.6 -3.7 -0.1 -3%Net income 14.4 17.9 +3.5 +24%

CASH FLOW
21
Cash flows from operating activities (CZK +16.5 bn) Income after adjustments (CZK +23.0 bn): income before tax (CZK +21.6 bn), income tax paid (CZK -2.9 bn), depreciation and amortization of
nuclear fuel (CZK +7.8 bn), exclusion of CEZ Shpёrndarje from the consolidated group (CZK -1.8 bn), other (CZK -1.7 bn) Changes in working capital (CZK -6.5 bn): growth in balance of payables and receivables incl. advances and accruals of unbilled electricity
(CZK -5.8 bn), growth of liquid securities (CZK -3.1 bn), reduction in inventories of fossil fuels and materials (CZK +2.0 bn), other (CZK +0.4 bn)
Cash flows from investing activities (CZK -10.3 bn) Investments in property, plant and equipment – CAPEX (CZK -8.8 bn) – see details in Annex Other (CZK -1.5 bn) – especially payables from acquisition of fixed assets (CZK -1.0 bn) and increases of long-term finacial assets (CZK -0.4 bn)
Cash flows from financing activities, incl. exchange rate differences (CZK +1.1 bn) Growth in other long-term liabilities (CZK +1.3 bn) – guarantee for coal delivery received from Vršanská uhelná; balance of loans and repayments
(CZK -0.2 bn)
*) investments in fixed assets = CAPEX **) including the balance of loans granted, divestments and change of restricted funds ***) in particular effect of exchange rate differences
18.0 18.0
34.4
25.7
24.2 24.0 23.9
25.2
23.0
6.5
8.8 1.5 0.2
1.3
0
10
20
30
40
Cash and cashequivalents
as of 12/31/2012
Income afteradjustments, income
taxes included
Changes in workingcapital
Investments inproperty, plant and
equipment*)
Financial investmentsand other investingcash flow items **)
Loans andrepayments
Other ***) Cash and cashequivalents
as of 3/31/2013
operating investing financingCZK bn
CZK +7.258 bn+40.4%

0
5
10
15
20
25
2013
2014
2015
2016
2019
2020
2021
2022
2023
2025
2030
2032
2038
2039
2042
2047
EURCZK JPY USD
mld. Kč
Bond maturity profile (as of 3/31/2013)
New NSV issue
CEZ GROUP MAINTAINS A STRONG LIQUIDITY POSITION
22
Utilization of short-term lines (as of 3/31/2013)
Available credit facilities
CZK 27.5 bn
CZK 2.6 bnCZK 1.5 bn
CEZ Group has access to CZK 29 bn in committed credit facilities, using just CZK 1.5 bn as of 3/31/2013
Non-committed credit facilities are used primarily
Committed facilities are kept as a reserve for covering unexpected needs
The first subscription commitment signed in February 2013 under a CZK bond programme worth EUR 50 mil
25-year NSV issue of registered bonds with a volume of EUR 30 mil issued in March 2013
Committed, not drawn
Committed, drawn
Uncommitted, drawn
CZK bn

Financial highlights and key events in CEZ Group in Q1 2013Martin Novák, Chief Financial Officer
Financial resultsMartin Novák, Chief Financial Officer
Trading position of CEZ GroupMichal Skalka, Head of Trading
AGENDA
23

Consumption in the Czech Rep.
TWh
‐10%
‐5%
0%
5%
10%
ELECTRICITY CONSUMPTION DROPS Y-O-Y IN THE CZECH REPUBLIC
24
Consumption in the Czech Rep. (temperature adjusted)* TWh
Source: ERO * Converted to a normal temperature according to ČEZ model
16.41 16.0916.51 16.36
-2.0 %
Monthly y-o-y absolute consumption indices for the Czech Republic (temperature and calendar adjusted)
Q1 2013
-0.9 %
Q1 2012 Q1 2013Q1 2012
Consumption development by segment:
-2.9% wholesale customers -2.7% households +8.1% small businesses
2010 2011 2012 2013

CZECH REPUBLIC - RELIABLE OPERATION OF NUCLEAR PLANTS PARTIALLY COMPENSATES LOWER PRODUCTION IN COAL-FIRED PLANTS
25
Nuclear power plants (+4%)+ Reliable operation of Temelín Nuclear Power Plant+ Increase in installed capacity of Dukovany Nuclear Power Plant
Coal-fired power plants (-8%)− Start of comprehensive refurbishment of three units at Prunéřov II Power Plant since Sept. 1, 2012− Reduced fuel deliveries
Nuclear power plants (+2%) + Increase in installed capacity of Temelín Nuclear Power Plant+ Shorter outages of Dukovany Nuclear Power Plant
Coal-fired power plants (-6%)− Lower fuel deliveries and source deployment− Year-round comprehensive refurbishment of three units of
Prunéřov II Power Plant
31.129.1
0.7 0.7
30.331.0
1.9 2.0
1.0
0
20
40
60
2012 2013 E
64.0 63.80%
+7%
+2%
-8%
-6%
TWh
8.98.1
0.2 0.2
7.9 8.2
0.6 0.8
0.00.0
0
2
4
6
8
10
12
14
16
18
20
Q1 2012 Q1 2013
Natural gas
Renewables
Nuclear
Hydro-pumpstorage
Coal
-8%
17.6 17.3-2%
+4%
+2%
+22%
TWh

ABROAD – DESPITE A DECREASE IN Q1, WE EXPECT A SLIGHT INCREASE IN PRODUCTION
26
Romania renewables (+41%)+ Production at all 240 wind turbines in Fântânele & Cogealac
Poland – coal-fired ELCHO & Skawina plants (-1%)- Lower production in ELCHO power plant due to a breakdown in March 2013
Bulgaria – coal-fired Varna plant (-82%)− Decrease in power production caused by lower demand for deliveries to
regulated market, especially lower activation of cold reserve as well as lower quota production
Romania renewables (+40%)+ Production at all 240 wind turbines in Fântânele & Cogealac
Poland – coal-fired ELCHO & Skawina plants (+13%)+ production in ELCHO power plant affected by planned boiler repairs in 2012+ Increase in production in Skawina thanks to favourable coal contract in 2013+ Planned commissioning of Borek small hydro power plant
Bulgaria – coal-fired Varna plant (-35%)- Lower production for regulated market
2.3 2.5
1.01.4
1.51.0
0
1
2
3
4
5
6
2012 2013 E
4.8 4.9+3%
+40%
+13%
-35%
TWh
0.7 0.7
0.3 0.4
0.7
0.1
0
0.4
0.8
1.2
1.6
Q1 2012 Q1 2013
Bulgaria (Varna coalpower plant)
Romania (Renewablesources)
Poland (ELCHO andSkawina coal powerplants)
1.7
1.2
-27%
+41%
-1%
-82%
TWh

2013 E Feb. 28 = expected 2013 mining as at Feb. 28, 2013 ČEZ* = ČEZ, a. s., including spun-off coal-fired power plants in Počerady and Chvaletice
4.5 4.1
1.92.1
0
2
4
6
8
10
HAVING SECURED DELIVERIES FROM CZECH COAL, WE PARTIALLY DECREASE MINING EXPECTATION FOR 2013
Q1 2012
Lower demand for power coal by ČEZ* partially compensated by sales to other customers
2013 E Feb. 28
2012Q1 2013
Coal mining (m tons)
6.4 6.2
22.825.8
-4%
+9%
-10%
+13%
+14%
+13%
Still higher expectations y-o-y due to expected high demand by ČEZ* and other customers in next quarters
27
ČEZ*Other customers
27.0
2013 E
comparison vs. 2012
15.920.2
18.0
6.9
6.87.8
0
5
10
15
20
25
30

0%
25%
50%
75%
100%
2014 2015 2016 2017 2018 2019 2020
ČEZ CONTINUES HEDGING ITS REVENUES FROM SALES OF ELECTRICITY IN THE MEDIUM TERM IN LINE WITH STANDARD POLICYShare of hedged production from ČEZ* power plants
(as of 4/15/2013, 100% corresponds to 50-55 TWh)
Hedged volume as of Feb. 15, 2013Hedged volume from Feb. 15, 2013 to April 15, 2013
Transaction currency hedging
Natural currency hedging – debts in EUR, investment and other expenses and costs in EUR
Total hedged(from
production)63 % 39 % 15 % ~ 6 % ~ 6 % ~ 6 % ~ 6 %
~5%~31%
~54%
~9%
~8%
~10% ~5%~1%
~5%~1%
~5%~1%
~5%~1%
Source: ČEZ ČEZ* = ČEZ, a. s., including spun-off coal-fired power plants in Počerady and Dětmarovice28

29,523
49,647
56,861
166,852
271,938
0 100,000 200,000 300,000
412,021
379,466
234,738
60,099
0 200,000 400,000
3/2013
2012
2011
2010
ČEZ PRODEJ STRENGTHENS ITS LEADERSHIP AMONG ALTERNATIVE GAS SUPPLIERS
29
Numbers of contracts received by ČEZ Prodej(cumulative)
Alternative gas suppliers by numberof connection points (at the end of March 2013)*
**
***
* Source: OTE ** Including COMFORT ENERGY company *** Including České Energetické Centrum Jih

LIGHTING UP RISKY PEDESTRIAN CROSSINGSYOUR CHOICE 2013
35 newly built and lighted pedestrian crossings: 10 risky pedestrian crossings identified in 7 regions
Experts’ and authorities’ participation in regional committees, involvement of the general public
Crossing lighting supervision compliant with standards
Cooperation in education and prevention
Media campaign: TV spots, advertisements, billboards, social networks
Campaign runs from April 10 to May 24, 2013
www.cezregiony.cz Website with a poll, interim results on-line, final results to be announced by May 31, 2013
Allocation of construction grants by CEZ Foundation
Actual construction in summer and autumn 2013
30

ANNEXES
31
Market developments
Investments in fixed assets
Balance sheet overview
Other
Balance of electricity

MARKET DEVELOPMENTS
32
60%
80%
100%
120%
Development of ČEZ share price compared to PX index and Bloomberg European Utilities, %
PX Bloomberg European Utilities Index ČEZ
0
5
10
15EUR / t CO2 allowances / emission rights
forward 2013 forward 2014
38
43
48
53
58EUR / MWh Electricity
forward 2014 forward 2015
15
35
55
75
60
85
110
135EUR/MWhUSD / t Coal and gas
coal front month coal forward 2014 gas front month gas forward 2014

INVESTMENTS IN FIXED ASSETS (CAPEX)
33
Investments in fixed assets in Q1 2013:Conventional power plants
Nuclear power plants
Electricity distribution
Mining
Others CZK 0.3 bn
CZK 8.8 bnCZK 4.7 bnPočerady CCGT plant: performed first ignition of both gas turbines, work needed for first steam in turbine underwayLedvice new plant: construction and assembly work on boiler house, turbine building and control inspection system is underway, FGD assembly finished, functional testing underwayPrunéřov II comprehensive refurbishment: disassembly and demolition are being finished, steam generator installation started, absorbers are constructed, turbine generator stand foundations are under construction
CZK 1.4 bnTemelín NPP: preparations were made for Unit 2 shutdown planned for 4 May – 20 June 2013 for fuel replacement and planned investment and maintenanceDukovany NPP: Unit 3 shut down for fuel replacement for 42 days, control inspection system renovated during the shutdown Temelín new nuclear power plant: Czech Ministry of the Environment issued a favourable opinion within the environmental impact assessment (EIA) procedure; notification of preliminary evaluation of bids sent to both bidders in March 2013, negotiation with the bidders is underway to improve the bids in every part; preparation for the authorization and licensing process and preparation of projects for related and induced investmentsDukovany new nuclear power plant: updates to the schedule of investment and zoning documentation preparation, land parcels are being purchased, data collection for a Jihlava river basin quality model finished, negotiations with water authorities are underwayCZK 2.1 bnCzech Republic: CZK 1.3 bnRomania: CZK 0.6 bnBulgaria: CZK 0.2 bnCZK 0.3 bnInvestment in equipment and buildings on overburden cuts 1 and 2 in the Bílina Mine; reconstruction of large-scale excavators and conveyor belts in Bílina and Nástup Tušimice Mines

BALANCE SHEET OVERVIEW
34
Fixed assets Decrease in tangible fixed assets CZK -3.0 bn: loss of control over CEZ
Shpërndarje and reclassification of assets of Chvaletice Power Plant as assets for sale Increase in other fixed assets CZK +2.3 bn, especially long-term investments
(long-term receivables from derivatives and impacts of exclusion of CEZ Shpërndarje from the consolidated group)
Current assets Increase in receivables from derivatives CZK +8.9 bn (compensated in liabilities) Increase in cash and cash equivalents CZK +7.3 bn and highly liquid securities
CZK +3.1 bn Increase in assets for sale CZK +1.6 bn (Chvaletice Power Plant) Decrease in receivables, net CZK -6.6 bn: especially exclusion of CEZ
Shpёrndarje from consolidated group and lower receivables of ČEZ, a. s.(compensated by a decrease in liabilities) Decrease in inventories of fossil fuels and materials CZK -2.0 bn; other effects
CZK +1.0 bn
Equity and long-term liabilities Increase in equity CZK +18.7 bn: net income CZK +17.9 bn, other CZK +0.8 bn –
especially the effect of exclusion of CEZ Shpërndarje from the consolidated group Increase in long-term liabilities CZK +1.0 bn: CZK +1.3 bn guarantee for coal
received from Vršanská uhelná, CZK -0.4 bn long-term liabilities from derivatives Increase in deferred tax liability CZK +2.3 bn
Current liabilities Decrease in trade payables, incl. received advances CZK -15.2 bn: especially the
impact of exclusion of CEZ Shpёrndarje from consolidated group and lower liabilities of ČEZ, a. s. Decrease in provisions CZK -2.8 bn, especially the effect of exclusion of CEZ
Shpёrndarje from consolidated group and reversals of emission allowance provisions Increase in liabilities from derivatives, incl. options CZK +8.0 bn Increase in current portion of long-term debt, incl. short-term bank loans CZK +1.8
bn Accruals and deferrals and other effects CZK +2.1 bn
419.8 416.8
75.1 77.4
141.2 154.5
0
100
200
300
400
500
600
700
As of 12/31/2012 As of 3/31/2013
Current assets
Other non-currentassets
Fixed tangibleassets, nuclear fueland investments
ASSETS(in CZK bn)
636.1 648.7
254.2 273.0
198.7 199.7
42.4 42.421.8 24.1119.0 109.5
0
100
200
300
400
500
600
700
As of 12/31/2012 As of 3/31/2013
Short-term liabilities
Deferred tax liability
Accumulated provision fornuclear decomissionningand fuel storage
Long term liabilitiesexcluding provisions
Equity
EQUITY AND LIABILITIES(in CZK bn)
636.1 648.7

0%
20%
40%
60%
80%
100%
120%
Enel EnBW RWE E.ON CEZGroup
EDF GDF Suez Fortum
Dividend per share(as % of amount declared for year 2010)
2010 2011 2012 E*
ČEZ DIVIDENDS OVER TIME REFLECT DEVELOPMENT OF INCOME AND OF THE ENERGY SECTOR IN EUROPE
Source: Bloomberg * provided 2012 values correspond to registered or approved proposals
Proposed dividends per share for 2012 decrease (in comparison with value paid for 2010):
in large German energy companies by 27-44%
in CEZ by 20% due to a long-term conservative financial policy and gradual adjustment of expenses and investments to development of the energy market in Europe
35

81.0
85.8
1.3
1.3
1.1
2.2
5.8
2.0
2.7
6.6
70 75 80 85
EBITDA 2013 E
Other
Poland
Romania
Distribution & Sale Czech Rep.
Albania
Other impactsČEZ*
Purchase of CO2 allowances for ČEZ*
Decline in achieved power price of ČEZ*
EBITDA 2012
CZK bn
-4,8 mld. Kč -5,6%
CZK -4.8 bn-5.6%
EXPECTED Y-O-Y DECREASE IN CEZ GROUP’S EBITDA MAIN REASONS
The value of EBITDA for 2012 reflects a change in the method of reporting Sales and adjustments for fixed assets.ČEZ* = ČEZ, a. s., including the spun-off coal-fired power plants in Počerady, Chvaletice and Dětmarovice
Decline of ČEZ* achieved electricity prices:– Decline in electricity prices− Decrease in hedging CZK/EUR exchange rate
Purchase of allowances for ČEZ* production:− Reduction in allowance allocation for production in NAP III
Other impacts on ČEZ*:− Extraordinary profit from trading in 2012− Higher specific cost of production− / + Other effects
Albania: + End of operations and exclusion from consolidation
Distribution & Sale Czech Rep.:+ Positive effect of correction factors− Extra margin on electricity purchases and sales in 2012
Romania:+ Growth in the volume of power production in wind farms− Extraordinary payments of state railways’ debts in 2012
Poland:− Reduction in emission allowance allocation for production in
NAP III− Extraordinary revenue from sale of emission allowances in
2012
36

Q1 SHARE REGULARLY EXCEEDS 30% OF THE FULL YEAR RESULTS; MOREOVER, 2013 IS SPECIFIC
CEZ Group EBITDA (% of the share of Q1 and rest of year)
Selected effects on splitting out the amount of EBITDA throughout 2013 (in comparison with 2012)
CZK 2.7 bn cost of allowances purchased for 2013 production (free derogatory allocation from NAP III in Q1)
Effect of hedging exchange rate in comparison with 2012: positive in Q1 2013 but negative in Q2-Q4 (CZK 2.4 bn)
Specific cost of ČEZ* production higher by CZK 1 bn in Q2-Q4 2013 (higher coal prices and effect of commencement of gas generation)
Extraordinary gain in Q1 2013 from allowance trading, especially utilization of a portion of CER gate (CZK 1.5 bn )
ČEZ* = ČEZ, a. s., including spun-off coal-fired power plants in Počerady, Chvaletice and Dětmarovice37
31%
69%
33%
67%
31%
69%
30%
70%
31%
69%
35%
65%
0%
10%
20%
30%
40%
50%
60%
70%
80%
Q1 Q2-Q4
200820092010201120122013

Electricity balance (GWh)
Q1 2012 Q1 2013Index
2013/2012
Electricity procured 17,425 16,759 -4%Generated in-house (gross) 19,281 18,542 -4%
In-house and other consumption, including pumping in pumped-storage plants -1,856 -1,783 -4%
Sold to end customers -11,936 -10,383 -13%Sold in the wholesale market (net) -2,633 -4,790 +82%
Sold in the wholesale market -56,962 -46,727 -18%Purchased in the wholesale market 54,329 41,937 -23%
Grid losses -2,857 -1,587 -44%
Electricity generation by source (GWh)
Q1 2012 Q1 2013Index
2013/2012
Nuclear 7,868 8,148 +4%Coal and lignite 10,121 8,859 -12%Water 722 903 +25%Biomass 250 176 -30%Photovoltaic 24 16 -33%Wind 286 411 +44%Natural gas 10 28 +180%Bio gas 0 1 -
Total 19,281 18,542 -4%
Sales of electricity to end customers (GWh)
Q1 2012 Q1 2013Index
2013/2012
Households -4,959 -4,237 -15%Commercial (low voltage) -2,344 -1,947 -17%Commercial and industrial (medium and high voltage) -4,633 -4,199 -9%
Sold to end customers -11,936 -10,383 -13%
Distribution of electricity to end customers -14,929 -13,496 -10%

Electricity balance (GWh)
Q1 2013
GWh +/- GWh +/- GWh +/- GWh +/- GWh +/- GWh +/-
Electricity procured 16,237 -2% 0 - 521 -44% 0 - 0 - 16,759 -4%Generated in-house (gross) 18,012 -2% 0 - 530 -46% 0 - 0 - 18,542 -4%In-house and other consumption, including pumping in pumped-storage plants -1,775 -1% 0 - -9 -84% 0 - 0 - -1,783 -4%
Sold to end customers -203 +66% -6,459 -7% 0 - -3,721 -23% 0 - -10,383 -13%Sold in the wholesale market (net) -16,034 -2% 7,162 -7% -522 -44% 4,604 -34% 0 - -4,790 +82%
Sold in the wholesale market -53,795 -15% -611 -68% -522 -44% -412 +84% 8,614 -5% -46,727 -18%Purchased in the wholesale market 37,761 -19% 7,773 -19% 0 - 5,016 -31% -8,614 -5% 41,937 -23%
Grid losses 0 - -703 -1% 0 - -883 -59% 0 - -1,587 -44%
Electricity generation by source (GWh)
Q1 2013
GWh +/- GWh +/- GWh +/- GWh +/- GWh +/- GWh +/-
Nuclear 8,148 +4% 0 - 0 - 0 - 0 - 8,148 +4%Coal and lignite 8,738 -7% 0 - 121 -83% 0 - 0 - 8,859 -12%Water 903 +26% 0 - 0 - 0 - 0 - 903 +25%Biomass 176 -30% 0 - 0 - 0 - 0 - 176 -30%Photovoltaic 15 -38% 0 - 1 - 0 - 0 - 16 -33%Wind 3 -25% 0 - 408 +44% 0 - 0 - 411 +44%Natural gas 28 +180% 0 - 0 - 0 - 0 - 28 +180%Bio gas 1 - 0 - 0 - 0 - 0 - 1 -
Total 18,012 -2% 0 - 530 -46% 0 - 0 - 18,542 -4%
Sales of electricity to end customers (GWh)
Q1 2013
GWh +/- GWh +/- GWh +/- GWh +/- GWh +/- GWh +/-
Households 0 - -2,499 -5% 0 - -1,737 -25% 0 - -4,237 -15%Commercial (low voltage) 0 - -876 -15% 0 - -1,071 -19% 0 - -1,947 -17%Commercial and industrial (medium and high voltage) -203 +66% -3,084 -6% 0 - -912 -25% 0 - -4,199 -9%
Sold to end customers -203 +66% -6,459 -7% 0 - -3,720 -24% 0 - -10,383 -13%
Distribution of electricity to end customers 0 - -9,122 -2% 0 - -4,373 -23% 0 - -13,496 -10%
CEZ GroupEliminationsPower Production
& Trading CEDistribution& Sale CE
Power Production& Trading SEE
Distribution& Sale SEE
CEZ Group
Power Production& Trading CE
Distribution& Sale CE
Power Production& Trading SEE
Distribution& Sale SEE Eliminations CEZ Group
EliminationsPower Production
& Trading CEDistribution& Sale CE
Power Production& Trading SEE
Distribution& Sale SEE

Electricity balance (GWh)
Q1 2013
GWh +/- GWh +/- GWh +/- GWh +/- GWh +/- GWh +/- GWh +/- GWh +/-
Electricity procured 15,634 -2% 604 -1% 0 - 113 -82% 408 +42% 0 - 0 - 16,759 -4%Generated in-house (gross) 17,319 -2% 693 -1% 0 - 122 -82% 408 +41% 0 - 0 - 18,542 -4%In-house and other consumption, including pumping in pumped-storage plants -1,685 -2% -89 +0% 0 - -9 -83% 0 - 0 - 0 - -1,783 -4%
Sold to end customers -5,964 -5% -100 +72% -598 -18% -2,902 -6% -818 -10% 0 - 0 - -10,383 -13%Sold in the wholesale market (net) -8,966 +1% -504 -9% 598 -18% 3,234 +7% 849 -20% 0 - 0 - -4,790 +82%
Sold in the wholesale market -46,758 -16% -620 -3% -37 -97% -180 -75% -753 +72% 0 - 1,621 +3% -46,727 -18%Purchased in the wholesale market 37,792 -19% 116 +33% 635 -66% 3,414 -8% 1,602 +7% 0 - -1,621 +3% 41,937 -23%
Grid losses -703 -1% 0 - 0 - -445 -20% -439 -0% 0 - 0 - -1,587 -44%
Electricity generation by source (GWh)
Q1 2013
GWh +/- GWh +/- GWh +/- GWh +/- GWh +/- GWh +/- GWh +/- GWh +/-
Nuclear 8,148 +4% 0 - 0 - 0 - 0 - 0 - 0 - 8,148 +4%Coal and lignite 8,145 -8% 593 +5% 0 - 121 -83% 0 - 0 - 0 - 8,859 -12%Water 902 +27% 1 +0% 0 - 0 - 0 - 0 - 0 - 903 +25%Biomass 78 -34% 99 -25% 0 - 0 - 0 - 0 - 0 - 176 -30%Photovoltaic 15 -38% 0 - 0 - 1 - 0 - 0 - 0 - 16 -33%Wind 3 -25% 0 - 0 - 0 - 408 +44% 0 - 0 - 411 +44%Natural gas 28 +180% 0 - 0 - 0 - 0 - 0 - 0 - 28 +180%Bio gas 1 - 0 - 0 - 0 - 0 - 0 - 0 - 1 -
Total 17,320 -2% 693 -1% 0 - 122 -82% 408 +41% 0 - 0 - 18,542 -4%
Sales of electricity to end customers (GWh)
Q1 2013
GWh +/- GWh +/- GWh +/- GWh +/- GWh +/- GWh +/- GWh +/- GWh +/-
Households -2,461 -6% 0 - -38 +52% -1,309 -8% -428 -6% 0 - 0 - -4,237 -15%Commercial (low voltage) -858 -16% 0 - -18 >200% -808 -8% -263 -1% 0 - 0 - -1,947 -17%Commercial and industrial (medium and high voltage) -2,645 -0% -100 +72% -542 -23% -785 -2% -127 -31% 0 - 0 - -4,199 -9%
Sold to end customers -5,964 -5% -100 +72% -598 -18% -2,902 -6% -818 -10% 0 - 0 - -10,383 -13%
Distribution of electricity to end customers -9,122 -2% 0 - 0 - -2,674 -7% -1,700 -11% 0 - 0 - -13,496 -10%
Czech Republic Poland Other Central Europe Bulgaria Romania Albania
Czech Republic Poland Other Central Europe Bulgaria Romania Albania
CEZ GroupRomania Albania Eliminations
Eliminations CEZ Group
Eliminations CEZ Group
Czech Republic Poland Other Central Europe Bulgaria