conference call –2q10/1h10 - b3 - ri...
TRANSCRIPT

Conference Call – 2Q10/1H10Conference Call – 2Q10/1H10
August 13, 2010

Net Revenue – R$ million Adjusted Operating Expenses – R$ million
Financial Highlights
127.9
+27.1% +6.9%
+29.6% +12.9%
2
65.251.3 53.4 56.8 62.7
98.7
127.9
2Q09 3Q09 4Q09 1Q10 2Q10 1H09 1H10
21.119.8 19.0 22.3 21.4
37.742.5
2Q09 3Q09 4Q09 1Q10 2Q10 1H09 1H10
+4.0% -1.2%
+29.6% +12.9%
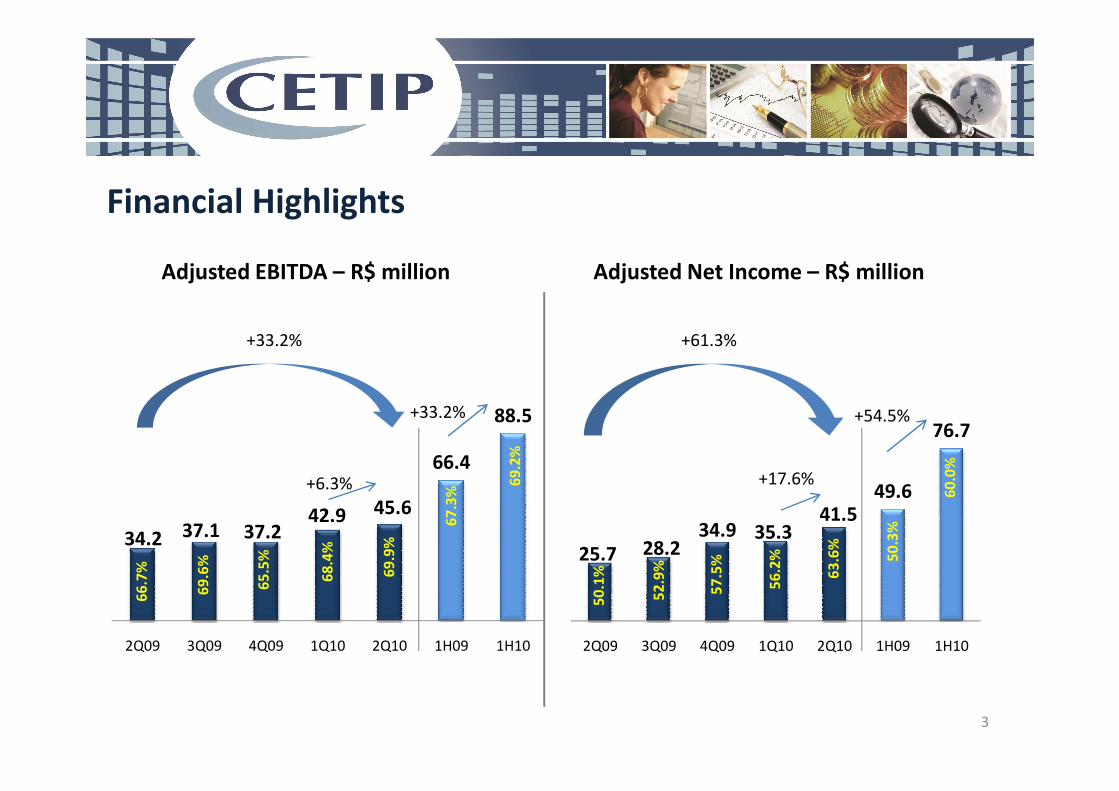
Adjusted EBITDA – R$ million Adjusted Net Income – R$ million
Financial Highlights
+33.2% +61.3%
3
41.5
25.7 28.234.9 35.3
49.6
76.7
2Q09 3Q09 4Q09 1Q10 2Q10 1H09 1H10
45.6
34.2 37.1 37.2 42.9
66.4
88.5
2Q09 3Q09 4Q09 1Q10 2Q10 1H09 1H10
+6.3%
69
.9%
68
.4%
66
.7%
65
.5%
69
.6%
+17.6%
56
.2%
50
.1%
57
.5%
52
.9% 63
.6%
69
.2%
67
.3%
+33.2% +54.5%
50
.3%
60
.0%

Revenue Breakdown by Type (%) – R$ million
+3.6%
+26.6%
+29.6%
4
12% 13% 14% 12% 13% 12% 13%
29% 29% 27% 25% 25% 28% 25%
15% 15% 15%13% 14% 13% 13%
21% 22% 22%22% 22% 20% 22%
23% 21% 22%28% 26% 27% 27%
2Q09 3Q09 4Q09 1Q10 2Q10 1H09 1H10
Other revenues
Monthly Utilization
Transactions
Custody
Registration
75.659.7 61.9 66.1 72.9 114.5 148.5

Registration Revenue – R$ million
Others
+39.1%
39.7+28.5%
Fixed Income
Derivatives
Others
5
9.0 8.8 9.4
15.312.6
21.0
27.94.7 4.2 5.1
4.65.6
9.5
10.2
2Q09 3Q09 4Q09 1Q10 2Q10 1H09 1H10
19.4
13.9 13.3 14.7
20.3
-4.6% 30.9
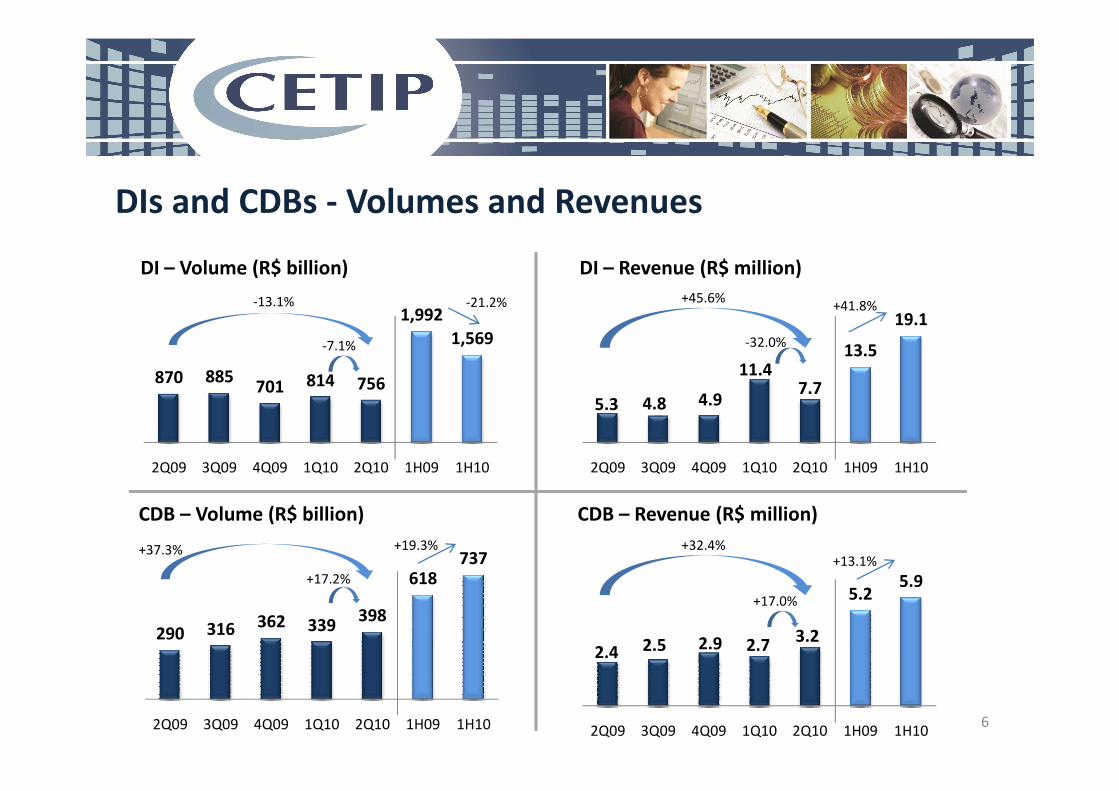
DIs and CDBs - Volumes and Revenues
870 885701 814 756
1,992
1,569
DI – Volume (R$ billion)
7.75.3 4.8 4.9
11.413.5
19.1
DI – Revenue (R$ million)
-13.1%
-32.0%
+45.6%
-7.1%
-21.2% +41.8%
6
290 316 362 339398
618737
2Q09 3Q09 4Q09 1Q10 2Q10 1H09 1H10
701
2Q09 3Q09 4Q09 1Q10 2Q10 1H09 1H10
7.75.3 4.8 4.9
2Q09 3Q09 4Q09 1Q10 2Q10 1H09 1H10
+17.2%
CDB – Volume (R$ billion)
+37.3%
3.22.4 2.5 2.9 2.7
5.25.9
2Q09 3Q09 4Q09 1Q10 2Q10 1H09 1H10
CDB – Revenue (R$ million)
+32.4%
+17.0%
+19.3%+13.1%

Swaps - Volume and Revenue
168
96
-36.6%
SWAPS – Quantity (thousand)
4.2
5.1
7.0
SWAPS – Revenue (R$ million)
+19.7%
+22.2%
+37.4%-42.9%
7
7867 67
47 49
96
2Q09 3Q09 4Q09 1Q10 2Q10 1H09 1H10
+5.8% 3.83.1 2.9
4.2
3.2
2Q09 3Q09 4Q09 1Q10 2Q10 1H09 1H10
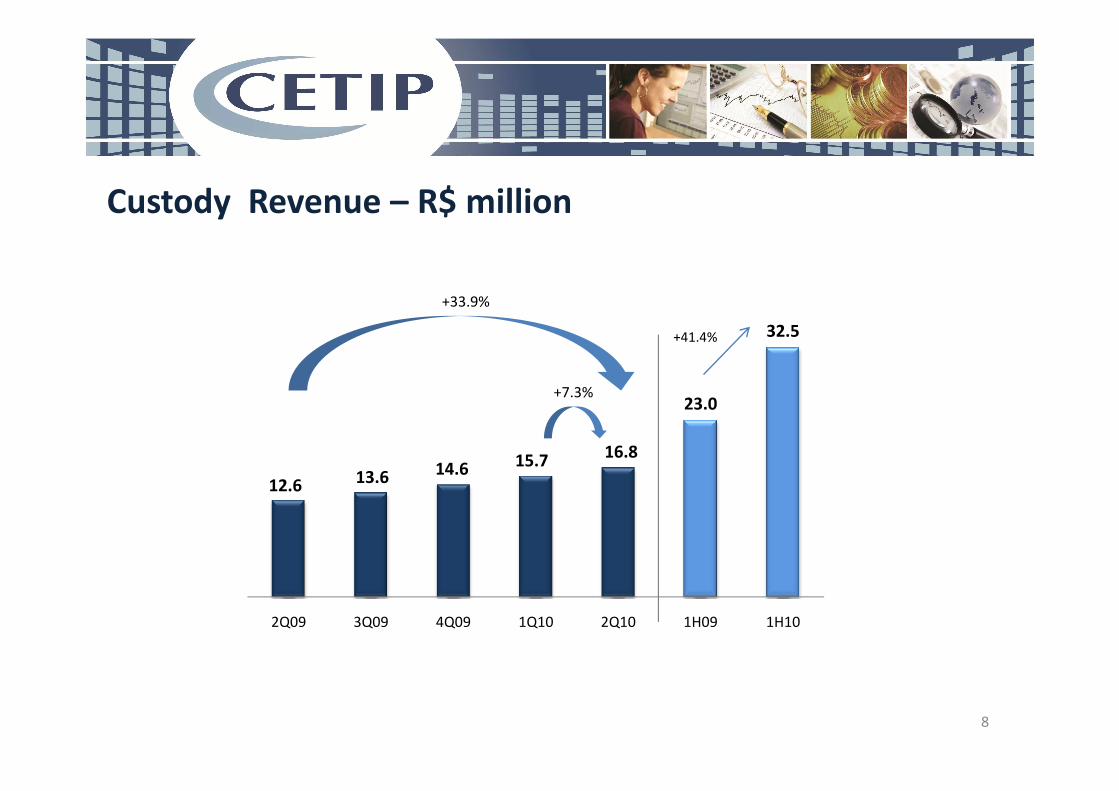
Custody Revenue – R$ million
23.0
32.5
+7.3%
+33.9%
+41.4%
8
16.8
12.6 13.6 14.6 15.7
23.0
2Q09 3Q09 4Q09 1Q10 2Q10 1H09 1H10
+7.3%

Debentures and Fund Quotas - Volumes and Revenues
258266
277288
301
255
296
Debentures – Volume (R$ billion)
+16.7%
+4.5%
8.6 8.8 9.0 9.7 10.4
17.220.1
Debentures – Revenue (R$ million)
+21.0%
+7.2%
+17.3%
+15.8%
9
258 255
2Q09 3Q09 4Q09 1Q10 2Q10 1H09 1H10
8.6 8.8
2Q09 3Q09 4Q09 1Q10 2Q10 1H09 1H10
490 547 600 656 690
485
674
2Q09 3Q09 4Q09 1Q10 2Q10 1H09 1H10
Fund Quotas – Volume (R$ billion)
+40.9%
+5.1%
2.6
1.31.7
2.3 2.5 2.5
5.1
2Q09 3Q09 4Q09 1Q10 2Q10 1H09 1H10
Fund Quotas – Revenue (R$ million)
+101.5%
+7.9%
+100.5%+39.1%

Transactions and Monthly Utilization – Revenues and Volumes
12 13 14 13 14
2328
Transactions – Quantity (million)
+18.2%
+7.9%
8.8 9.4 9.8 9.6 10.414.8
20.0
Transactions – Revenue (R$ million)
+17.9%
+8.4%
+21.3%
+34.5%
10
2Q09 3Q09 4Q09 1Q10 2Q10 1H09 1H10
8.8 9.4 9.8 9.6
2Q09 3Q09 4Q09 1Q10 2Q10 1H09 1H10
9,118
7,9528,306
8,601 8,827
7,873
8,972
2Q09 3Q09 4Q09 1Q10 2Q10 1H09 1H10
Monthly Utilization – Number of Participants
+14.7%
+3.3%
17 18 18 18 19
3238
2Q09 3Q09 4Q09 1Q10 2Q10 1H09 1H10
Monthly Utilization – Revenue (R$ million)
+12.1%
+4.0%+14.0%
+16.9%

CIP – Revenue and Volume
12.0 12.8
CIP – Revenue (R$ million)
-1.7%
Processed EFTs
38.3
323300293268274
+19.8%
+21.5%+7.2%
258 311
Note: Revenue refers only to services of SITRAF – Transfer Funds System.11
6.26.3 6.6 6.6 6.6
12.0 12.8
2Q09 3Q09 4Q09 1Q10 2Q10 1H09 1H10
-6.9%
Processed EFTs
(Quantity – MM)
Processed EFTs/day
(Quantity - thousand)
16.7 17.4 18.4 18.3 20.0
31.538.3
2Q09 3Q09 4Q09 1Q10 2Q10 1H09 1H10
+19.8%+9,5%

Adjusted Operating Expenses Breakdown – % and R$ million
21.119.8 19.0 22.3 21.4
-1.2%
+6.9% • Depreciation and Amortization: -3.4%
• Personnel: -3.0%
37.7 42.5
+12.9%
Personnel
Outsourced services
Depreciation and amortization
General
Equipments and systems rental
Others expenses/revenues & taxes and fees
12
1% 3% 1% 0% 1% 1%5% 4% 1% 1% 1% 5%
1%
9% 11%8% 9% 11%
9%10%
14% 14%12%
7% 7%
14%
7%
14%15%
15%16% 16%
13%
16%
58% 55%62% 66% 65%
58%65%
2Q09 3Q09 4Q09 1Q10 2Q10 1H09 1H10
21.119.8 19.0 22.3 21.4 37.7 42.5
Note: Personnel expenses include board members’ compensation.

Adjusted Cash Flow – R$ million (Quarter)
34.7 46.2Adjusted CF+33.1%
1Q10 2Q10
225.6
13(*) Excluding the change in fair value – financial investments available for sale, valued at R$0.4 million
225.6
42.4
(9.6) (47.3)
210.7*
1Q10 Operating Investment 2Q10
Financing
03/31/10 06/30/10

Adjusted Cash Flow – R$ million
60.0 80.9Adjusted CF+34.8%
1H09 1H10
14(*) Excluding the change in fair value – financial investments available for sale, valued at R$0.7 million
203.7
75.3
(12.8) (56.1)
210.7*
2H09 Operating Investment 1H10
Financing
12/31/09 06/30/10

CAPEX - % of Net Revenue
% NR 3.4% 5.0% 5.2% 5.0% 14.8%
16%
11%5% 15%
6%
3%
26%7% 20%
10%4% 5% 8%
1%
3.4% 10.0%
R$ mm 1.7 2.7 2.9 3.1 9.6 3.3 12.8
15
21%
5%12%
63%
10%17%
23%
30% 59%
61%
22%
59%
26%
50%
34%
17%
16%
4%
42%
6%
2Q09 3Q09 4Q09 1Q10 2Q10 1H09 1H10
Product Development
Technology
Office Settlement
Platform Migration
Others

Other Highlights
0.3421
Adjusted Earnings per Share – R$+59.8%
+53.2%
Shareholder Remuneration
Remuneration Deliberation Amount (R$mm)Gross amount per
Payment
16Note: As provided in the bylaws, dividend and/or ISE payment policy corresponds to at least 25% of adjusted net income in accordance with Brazilian law.
0.1849
0.1157 0.12660.1560 0.1577
0.2233
2Q09 3Q09 4Q09 1Q10 2Q10 1H09 1H10
+17.3%Remuneration Deliberation Amount (R$mm)
Gross amount per
share (R$)Payment
1H09 ISE Board Meeting 08/26/09 6.88 0.030939 09/15/09
2H09 ISE Board Meeting 12/21/09 8.95 0.040025 01/13/10
2009 Dividend Board Meeting 03/10/10 50.78 0.226862 05/17/10
1H10 ISE Board Meeting 06/18/10 9.24 0.041207 07/12/10

Investor Relations
17
Legal Disclaimer
The forward-looking statements contained in this document relating to business prospects, projections of
operating and financial results, and those related to the growth prospects of CETIP are merely estimates and
as such are based exclusively on the Management’s expectations about the future of the business. These
forward-looking statements depend substantially on the approvals and licenses necessary for the projects,
market conditions, and performance of the Brazilian economy, the sector and international markets and
hence are subject to change without prior notice. This performance report includes accounting data and non-
accounting data such as operating, pro forma financial data and projections based on the Management’s
expectations. Non-accounting data has not been reviewed by the Company’s independent auditors.