cone signals and activity in myopia and emmetropia · abstract iii participant group, he testimated...
TRANSCRIPT
Cone signals and activity in myopia and emmetropia
Nanyu Zhou
School of Optometry and Vision Science, Faculty of Health
Vision Improvement Domain
Institute of Health and Biomedical Innovation
Queensland University of Technology
A thesis submitted in fulfilment of the requirements for the
Degree of Master of Applied Science (Research)
2013


Keywords
I
Keywords Colour vision
Cones
Emmetropia
L/M cone ratios Myopia
Multifocal visual evoked potential (mfVEP)
Retina
Visual evoked potential (VEP)

Abstract
II
Abstract Myopia (short-sightedness) is a common ocular disorder of children and young
adults. Studies primarily using animal models have shown that the retina controls eye
growth and the outer retina is likely to have a key role. One theory is that the
proportion of L (long-wavelength-sensitive) and M (medium-wavelength-sensitive)
cones is related to myopia development; with a high L/M cone ratio predisposing
individuals to myopia. However, not all dichromats (persons with red-green colour
vision deficiency) with extreme L/M cone ratios have high refractive errors. We
predict that the L/M cone ratio will vary in individuals with normal trichromatic
colour vision but not show a systematic difference simply due to refractive error. The
aim of this study was to determine if L/M cone ratios in the central 30° are different
between myopic and emmetropic young, colour normal adults.
Information about L/M cone ratios was determined using the multifocal visual
evoked potential (mfVEP). The mfVEP can be used to measure the response of
visual cortex to different visual stimuli. The visual stimuli were generated and
measurements performed using the Visual Evoked Response Imaging System
(VERIS 5.1). The mfVEP was measured when the L and M cone systems were
separately stimulated using the method of silent substitution. The method of silent
substitution alters the output of three primary lights, each with physically different
spectral distributions to control the excitation of one or more photoreceptor classes
without changing the excitation of the unmodulated photoreceptor classes. The
stimulus was a dartboard array subtending 30° horizontally and 30° vertically on a
calibrated LCD screen. The m-sequence of the stimulus was 215-1. The N1-P1
amplitude ratio of the mfVEP was used to estimate the L/M cone ratio.
Data were collected for 30 young adults (22 to 33 years of age), consisting of 10
emmetropes (+0.3±0.4 D) and 20 myopes (–3.4±1.7 D). The stimulus and analysis
techniques were confirmed using responses of two dichromats. For the entire
Abstract
III
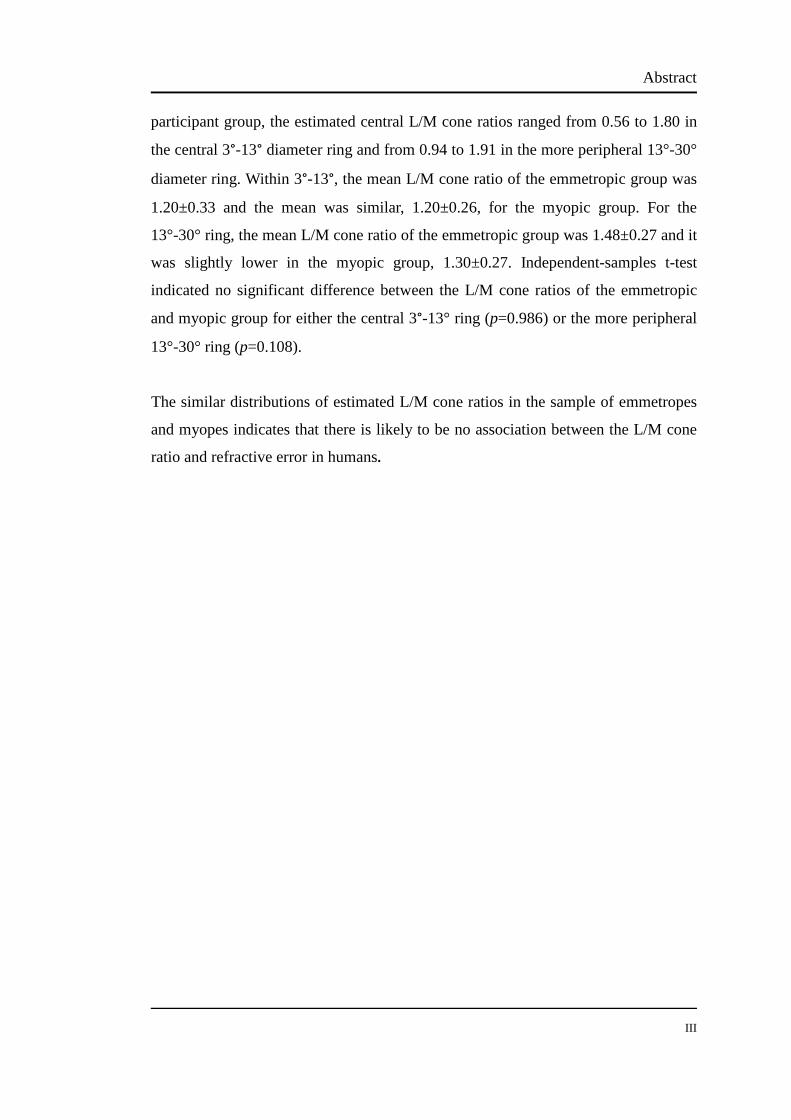
participant group, the estimated central L/M cone ratios ranged from 0.56 to 1.80 in
the central 3°-13° diameter ring and from 0.94 to 1.91 in the more peripheral 13°-30°
diameter ring. Within 3°-13°, the mean L/M cone ratio of the emmetropic group was
1.20±0.33 and the mean was similar, 1.20±0.26, for the myopic group. For the
13°-30° ring, the mean L/M cone ratio of the emmetropic group was 1.48±0.27 and it
was slightly lower in the myopic group, 1.30±0.27. Independent-samples t-test
indicated no significant difference between the L/M cone ratios of the emmetropic
and myopic group for either the central 3°-13° ring (p=0.986) or the more peripheral
13°-30° ring (p=0.108).
The similar distributions of estimated L/M cone ratios in the sample of emmetropes
and myopes indicates that there is likely to be no association between the L/M cone
ratio and refractive error in humans.

Table of Contents
IV
Table of Contents KEYWORDS………………………………………………………………………... I ABSTRACT……………………………………………………………..….….…… II TABLE OF CONTENTS…………………………………………………………. IV LIST OF FIGURES……………………………………………………………….VII LIST OF TABLES…………………………………………………………..……. IX ABBREVIATIONS…………………………………….……………………..……. X DECLARATION………………………………………………………………… XII ACKNOWLEDGEMENTS……………………………………………….…… XIII CHAPTER 1 LITERATURE REVIEW…………………………………………... 1 1.1 INTRODUCTION…………………………………………………………….. 1
1.1.1 Emmetropization………………………………………………….…… 3
1.1.2 Prevalence of myopia………………………………………...….…….. 5
1.2 FACTORS SUGGUSTED TO INFLUENCE EYE GROWTH………………. 6
1.2.1 Hereditary and genetic factors…………………………………...…….. 6
1.2.2 Environmental risk factors for myopia……………………….….…….. 8
1.2.3 Outdoor activity decreases myopia risk……………………….………. 9
1.3 RETINAL CONTROL OF EYE GROWTH………………………………… 11
1.3.1 Role of inner retina……………………………………………..….…. 11
1.3.2 Role of outer retina…………………………………………….…..…. 12
1.3.3 Role of RPE…………………………………………………...……… 13
1.3.4 Role of Choroid………………………………………………………. 13
1.3.5 Neurotransmitters in ocular growth……………………………..……. 14
1.3.6 Role of peripheral retina……………………………………………… 14
1.4 PHOTORECEPTORS AND MYOPIA………………………………...……. 15
1.4.1 Distributions of the Cones and rods………………………..………… 15
1.4.2 Cone disease and refractive error……………………….…………..… 15
1.4.3 Cone involvement in eye growth………………………..…………… 16
1.4.4 Cone ratios in refractive error………………………………………… 17
1.5 METHODS TO ESTIMATE L/M CONE RATIOS…………………....……. 22

Table of Contents
V
1.6 MULTIFOCAL VISUAL EVOKED POTENTIAL…………………………. 23
1.7 COLOUR VISION AND MYOPIA…………………………………………. 24
1.7.1 Colour vision…………………………………………………………. 24
1.7.2 Colour deficiency and myopia………………………………………... 27
1.8 AIMS………………………………………………………………….……... 28
CHAPTER2 EXPERIMENTTAL METHODS…………………………………. 30 2.1 INTRODUCTION…………………………………………………………… 30 2.2 MULTIFOCAL VISUAL EVOKED POTENTIAL FOR L/M CONE RATIO
STUDY……………………………………………………………………… 30
2.3 CALIBRATION……………………………………………………………… 34
2.3.1 Spectral and luminance calibration of CRT and LCD monitor………. 35
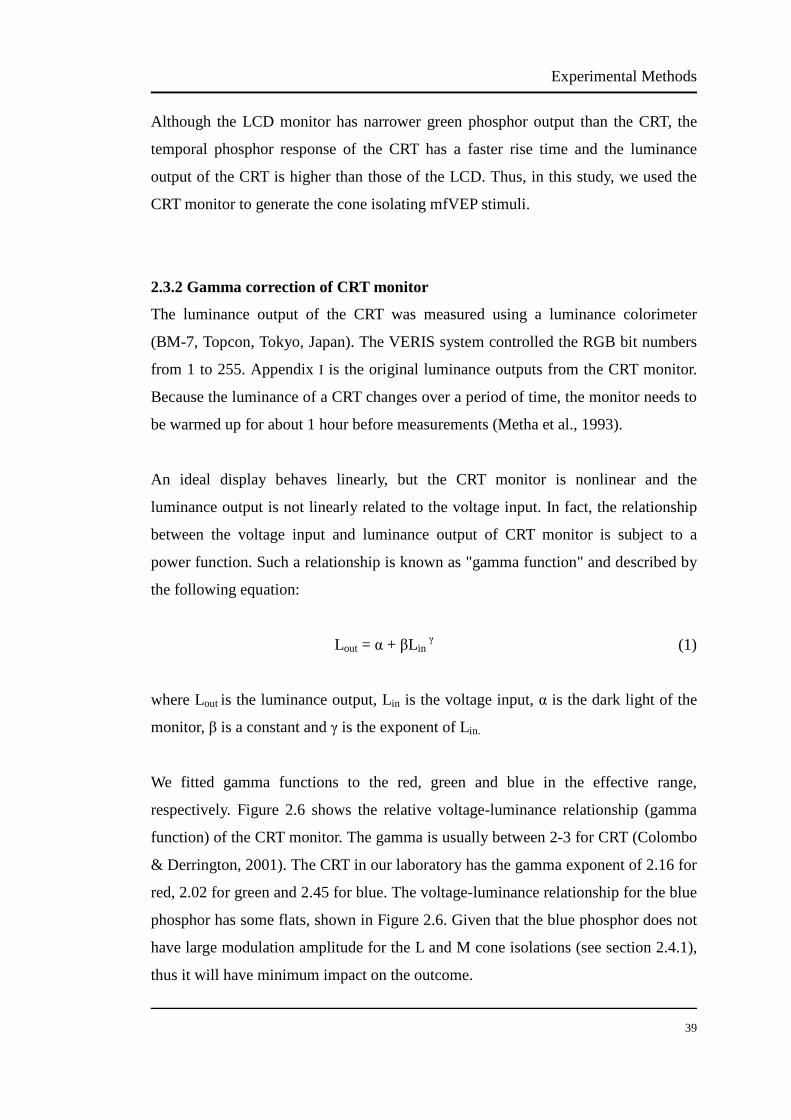
2.3.2 Gamma correction of CRT monitor…………………………………... 39
2.4 CALCULATION OF L AND M CONE ISOLATION………………………. 44
2.4.1 Silent substitution…………………………………………………….. 44
2.4.2 The L cone modulation………………………………………...….….. 48
2.4.3 The M cone modulation………………………………………………. 50
2.5 STATISTICAL ANALYSIS………………………………………………….. 51
2.6 POWER ANANLYSIS………………………………………………………. 51
CHAPTER3 CONE RATIOS IN MYOPIA AND EMMETROPIA………...…. 52 3.1 INTRODUCTION…………………………………………………………… 52
3.2 PARTICIPANTS……………………………………………………………... 54
3.3 PROCEDURE…………………………………………………………..…… 55
3.3.1 The mfVEP visual stimuli…………………………………………….. 55
3.3.2 The mfVEP recording………………………………………………… 58
3.3.3 Dichromat pilot testing……………………………………………….. 60
3.3.4 Trichromat experiments………………………………………………. 62 3.3.5 Exporting mfVEP data………………………………………………... 62
3.4 RESULTS……………………………………………………………………. 64
3.4.1 The mfVEP responses of dichromats…………………………………. 64
3.4.2 The mfVEP responses of all the trichromats…………………………. 71
3.4.3 The L/M cone ratios of trichromats…………………………………... 76
3.4.4 Data analysis between emmtropic, low myopic and high myopic groups………………………………………………………………… 77
3.4.5 Data analysis between emmtropic and myopic groups……….…….… 77
Table of Contents
VI
3.4.6 Data analysis between central and peripheral retina…………..……… 78
3.4.7 Post hoc effect size analysis……………………….…………..……… 78 CHAPTER 4 DISCUSSION……………………………………………………… 79
4.1 CONE RATIOS IN TRICHROMATES……………………………………… 79
4.2 MYOPES VS EMMETROPES……………………………………………… 80
4.3 CENTRAL RETINA VS PERIPHERAL RETINA……………………..…… 82
4.4 VALIDITY OF THE CONE ISOLATING STIMULI……………………….. 82
4.5 LIMITATION OF THE MFVEP STUDY OF L/M CONE RATIOS……..…. 83
4.6 FUTURE DIRECTIONS…………………………………………….………. 85
BIBLIOGRAPHY…………………………………………………….…………… 86 APPENDIX………………………………………………………………………… 96

List of Figures
VII
List of Figures
FIGURE 1.1 The distribution of refractive error in the newborn baby……………. 4
FIGURE 1.2 Red flowers, green leaves and blue sky with and without colour…... 27
FIGURE 2.1 The mfVEP equipment and stimuli used in this study……………… 31
FIGURE 2.2 A single pattern-reversal VEP response………………………..…… 33
FIGURE 2.3 The L/M cone ratios were calculated from the N1-P1 amplitude….. 34
FIGURE 2.4 The spectral distribution of red, green and blue from the CRT and the
LCD monitors…………………………………...………………….. 36
FIGURE 2.5 The luminance output of CRT and LCD monitors driven by the
VERIS system……………………………………………………… 38
FIGURE 2.6 The modelled gamma functions of our CRT monitor………………. 41
FIGURE 2.7 Gamma function and its inverse function for the green gun….……. 42
FIGURE 2.8 Input-output relationship of the red, green and blue guns after the
gamma correction had been finished……………………………….. 44
FIGURE 2.9 An example of the principle of the silent substitution technique…... 45
FIGURE 2.10 The Smith and Pokony 10° fundamentals…………………………... 46
FIGURE 3.1 The standard stimulus of the mfVEP……………………………….. 56
FIGURE 3.2 The stimuli of the L cone modulation………………………………. 57
FIGURE 3.3 The stimuli of the M cone modulation……………………………… 58
FIGURE 3.4 The placement of the electrodes in this study………………………. 59
FIGURE 3.5 The participant sits 37 cm in front of the monitor with natural pupil
and the left eye is occluded……………………………………..….. 60
FIGURE 3.6 The 16 groups exported from mfVEP………………………………. 63
FIGURE 3.7 The summed and averaged mfVEP signals from one protanope…… 64
FIGURE 3.8 The summed and averaged mfVEP signals from one protanope…… 65
FIGURE 3.9 The amplitude of adjusted modulations from on protanope……...… 66
FIGURE 3.10 The summed and averaged mfVEP signals from one deuteranope… .67
FIGURE 3.11 The summed and averaged mfVEP signals from one deuteranope… 68
FIGURE 3.12 The amplitude of adjusted modulations from one deuteranope……. 69

List of Figures
VIII
FIGURE 3.13 The summed and averaged mfVEP signals in the central 3°-13° retina
of all trichromat participants……………………………………….. 73
FIGURE 3.14 The summed and averaged mfVEP signals in the central 13°-30° retina
of all trichromat participants ………….............................................. 75

List of Tables
IX
List of Tables TABLE 1.1 Prevalence of myopia by country……………………………………… 6
TABLE 1.2 The characteristics of some cone diseases………………………......... 16
TABLE 1.3 Cone ratios amongst people with normal colour vision……………… 20
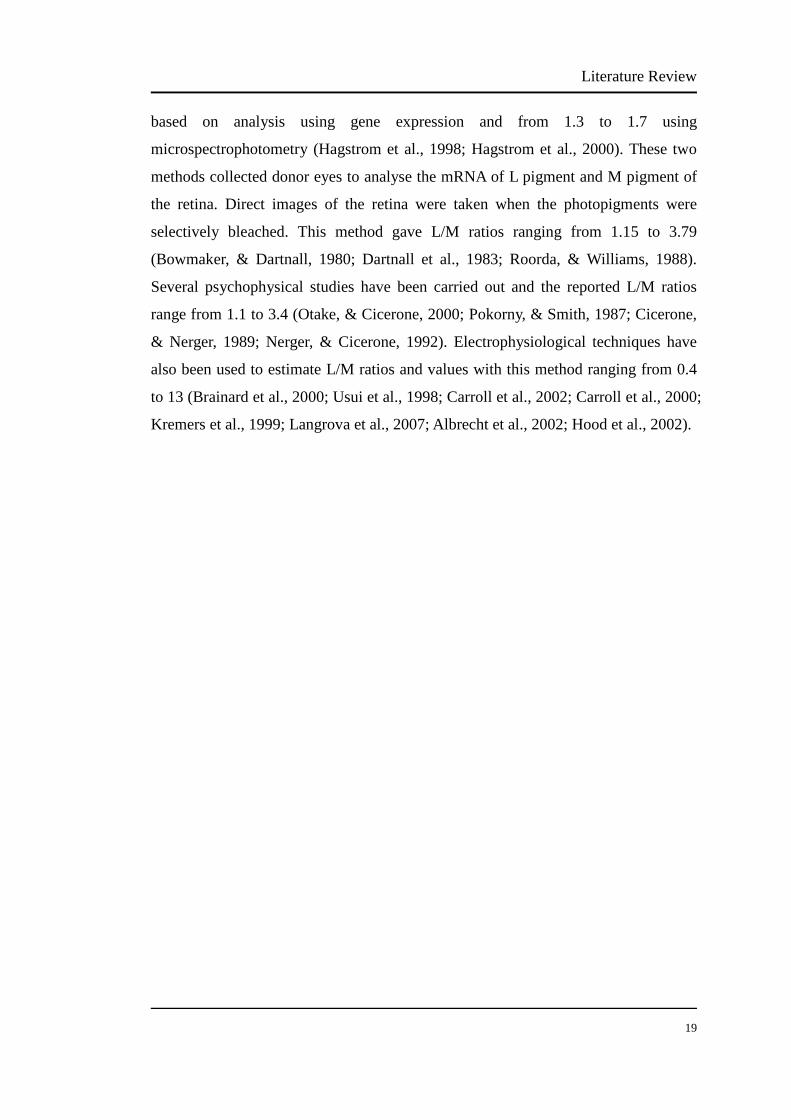
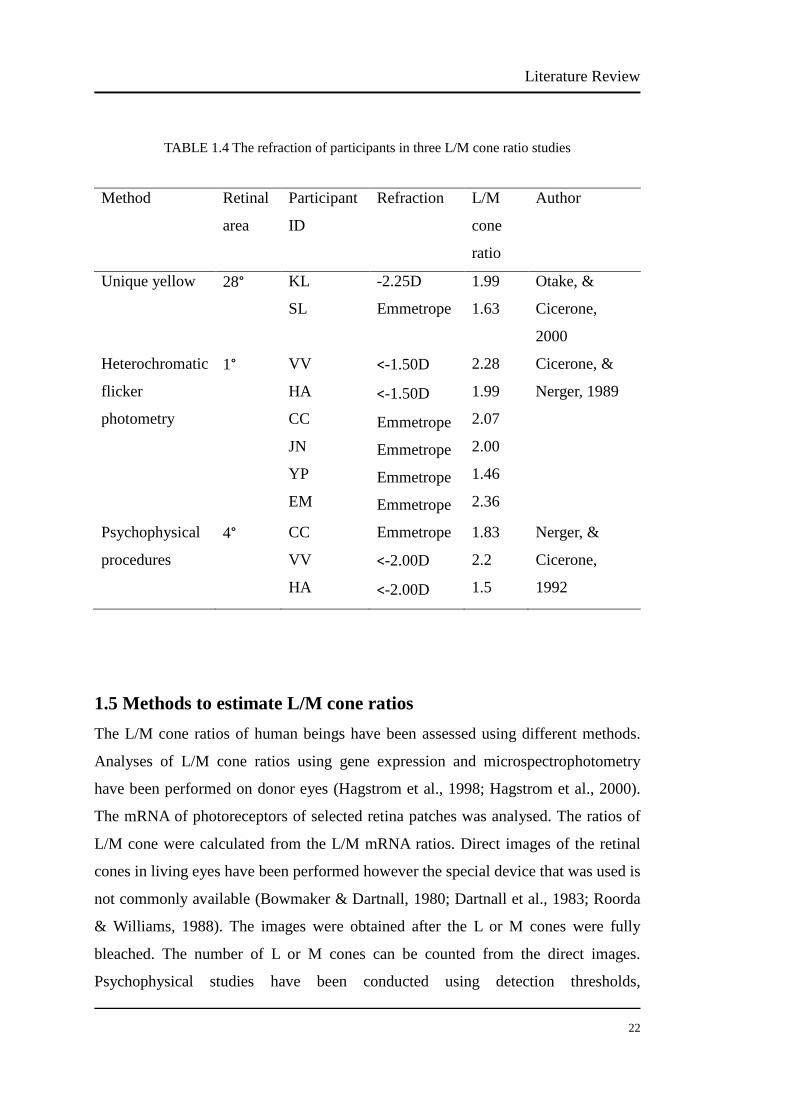
TABLE 1.4 The refraction of participants in three L/M cone ratio studies……….. 22
TABLE 2.1 The specific stimulator parameters of the mfVEP…………………… 32
TABLE 2.2 The RGB values of the L cone modulation…………………………... 49
TABLE 2.3 The RGB values of the M cone modulation………………………….. 50
TABLE 3.1 The colour combinations of dichromat experiments……………......... 61
TABLE 3.2 The corresponding bit number of each modulation………………….. 62
TABLE 3.3 The L/M ratios of all trichromat participants………………………… 76

Abbreviations
X
Abbreviations L Long-wavelength-sensitive
M Middle-wavelength-sensitive
S Short-wavelength-sensitive
R Red G Green
B Blue
D Dioptres ERG Electroretinogram
mfERG Multifocal Electroretinogram
VEP Visual Evoked Potential
mfVEP Multifocal Visual Evoked Potential
OP Oscillatory Potential RPE Retinal Pigment Epithelium
FDM Form Deprivation Myopia LIM Lens-induced Myopia
LIH Lens-induced Hyperopia
UV Ultraviolet
UVA Ultraviolet A
L-NAME NG-nitro-L-arginine Methyl Ester
VIP Vasoactive Intestinal Peptide
ZENK Zif268 Egr-1 NGFI-A Krox-24
mRNA Messenger Ribonucleic Acid
LCA Longitudinal Chromatic Aberration
MC Magnocellular
PC Parvocellular
KC Koniocellular
LGN Laterale Geniculate Nucleus
ISCEV International Society for Clinical Electrophysiology of Vision
LCD Liquid Crystal Display

Abbreviations
XI
CRT Cathode Ray Tube
VERIS Visual Evoked Response Imaging System
ANOVA Analysis of Variance

Declaration
XII
Declaration The work contained in this thesis represents my own work. To the best of my
knowledge and belief, the thesis contains no material previously published or written
by another person except where due reference is made.
Signature: Nanyu Zhou
Date : 2 July 2013

Acknowledgements
XIII
Acknowledgements I would like to thank my supervisors, A/Prof Katrina Schmid, Prof David Atchison,
Dr Andrew J. Zele and Prof Brian Brown. Thank-you for suggesting this interesting
field of study, no matter what troubles I have, research questions or personal
problems, you were always very helpful to me. Thank you for your patience,
kindness and support in my research.
Thank you to A/Prof Peter Hendicott for the scholarship provided to me. This meant
that I could focus all my efforts on my study, with one heart and one mind, without
worry.
To Pavan Kumar and Marwan Suheimat, my lovely colleagues, thank you for being a
participant in my pilot testing so many times. I appreciate all the time you spent
assisting me. You are fantastic persons and I wish you the best for your research. I
would also like to thank all my participants who generously gave their time to be
involved in my experiments.
Last but certainly not least, thank you to my parents. The research journey can be
very frustrating. Every time I wanted to give up, your concern and support
encouraged me to persevere and succeed. Thank you for supporting my studies
overseas both emotionally and financially.


Literature Review
1
Chapter 1
Literature Review
1.1 Introduction Myopia is the most common refractive error in children and young adults (Lam et al.,
2004; Lin et al., 1999; Vitale et al., 2008); it occurs because the axial length of the
eye is too long for its optical power (Tong et al., 2002). Key questions concern why
myopia develops and the functional significance of an elongated eye. Both genetic
and environmental factors are determinants of myopia (Hammond et al., 2004; Rose
et al., 2008; Saw et al., 2002; Stambolian et al., 2004; Ting et al., 2004; Wensor et al.,
1999). Twin studies and studies of parental myopia indicate a genetic influence
(Hammond et al., 2004). Spending less time on nearwork and more time on outdoor
activities reduces the prevalence of myopia amongst children, suggesting a lifestyle
impact (Rose et al., 2008).
How the eye uses visual inputs from the external environment to determine which
way to grow remains unclear, although it is well known that the retina plays a crucial
role in eye growth (Wildsoet & Wallman, 1995). In particular, the signals and activity
of the cones across the retina are speculated to contribute greatly in the development
of myopia (Chen et al., 2006; Kawabata & Adachi-Usami, 1997; Liang et al., 1995;
Rucker & Kruger, 2006).
A claim has been made that eyeglasses designed to equalize the activities of L and M
cones can reduce the myopia progression rate to a tenth of that observed with using
normal eyeglasses (Neitz & Neitz, 2011). This result implies that the L and M cone
activities may be different between myopia and emmetropia. However, not all
Literature Review
2
individuals with red-green colour vision deficiency with extreme L/M cone ratios
have high refractive errors (Qian et al.,2009). The prevalence of myopia was found
to be less in persons with colour vision deficiencies than in colour normal
trichromats (46% versus 66%); how many of the persons with colour vision
deficiency had dichromatic and anomalous trichromatic defect was not determined.
As dichromats are missing either L cones (protanopes) or M cones (deuteronopes), it
would be impossible to use relative signals of the two cone types to guide
emmetropization. However the case is more complicated for anomalous trichromats
for which one receptor has a peak sensitivity intermediate between those of the
normal receptors (DeMarco et al., 1992).
The L/M cone ratios have been estimated using various techniques, with all requiring
assumptions such as choice of cone fundamentals, corrections for pre-receptoral
filtering, and method for determining isoluminant points (Hood et al., 2002). The
L/M cone ratios in individuals with normal colour vision vary considerably, ranging
from 0.4 to 13 (Albrecht et al., 2002; Bowmaker & Dartnall, 1980; Brainard et al.,
2000; Carroll et al., 2000; Carroll et al., 2002; Cicerone & Nerger, 1989; Dartnall et
al., 1983; Hagstrom et al., 1998; Hagstrom et al., 2000; Hood et al., 2002; Kremers et
al., 1999; Langrová et al., 2007; Nerger & Cicerone, 1992; Otake & Cicerone, 2000;
Pokorny & Smith, 1987; Roorda & Williams, 1988; Usui et al., 1998). There is little
knowledge of whether L/M cone ratios vary with refractive error. Only three papers
that report L/M cone ratios mention the refractive status of the participants (Otake &
Cicerone, 2000; Cicerone & Nerger, 1989; Nerger & Cicerone, 1992). These three
studies found similar L/M cone ratios between myopic and emmetropic participants,
but there were few participants (n ≤ 6).
The present study investigated the L/M cone ratios in the central and peripheral
retina of myopic and emmetropic normal trichromats using the multifocal visual
evoked potential (mfVEP). There are two alternate predictions for the outcomes. One
is that the L/M ratio may be a determinant of myopia progression, and that the L/M
ratio will be greater in myopic individuals (Rucker & Kruger, 2006). The second is
that given the large range of cone ratios reported amongst individuals and the fact
Literature Review
3
that individuals with red-green colour vision deficiency, in particular
deuteranomalous defects, are not all myopic (Qian et al., 2009), there will not be an
association between the cone ratio and refraction. The mfVEP has been used
previously as a method to estimate the L/M cone ratio, it is non-invasive and widely
accepted; the impact of refractive error has not been previously investigated (Hood et
al., 2002).
This review will consider the role of the retina in eye growth control and in particular
the input of the retinal cones to the emmetropization process. A theory concerning
the ratio of the L and M cones and relative activity of cone types both centrally and
across the paracentral retina in myopia development will be discussed. In addition,
what is known regarding the impact of an elongated eye on the cones inputs to the
post-receptoral neurons will be described. The mfVEP was used in the described
research and thus a section on the visual evoked potential is also included.
1.1.1 Emmetropization
Infant eyes tend to exhibit large refractive errors that can be either myopic or
hyperopic and these refractive errors reduce after birth via a process called
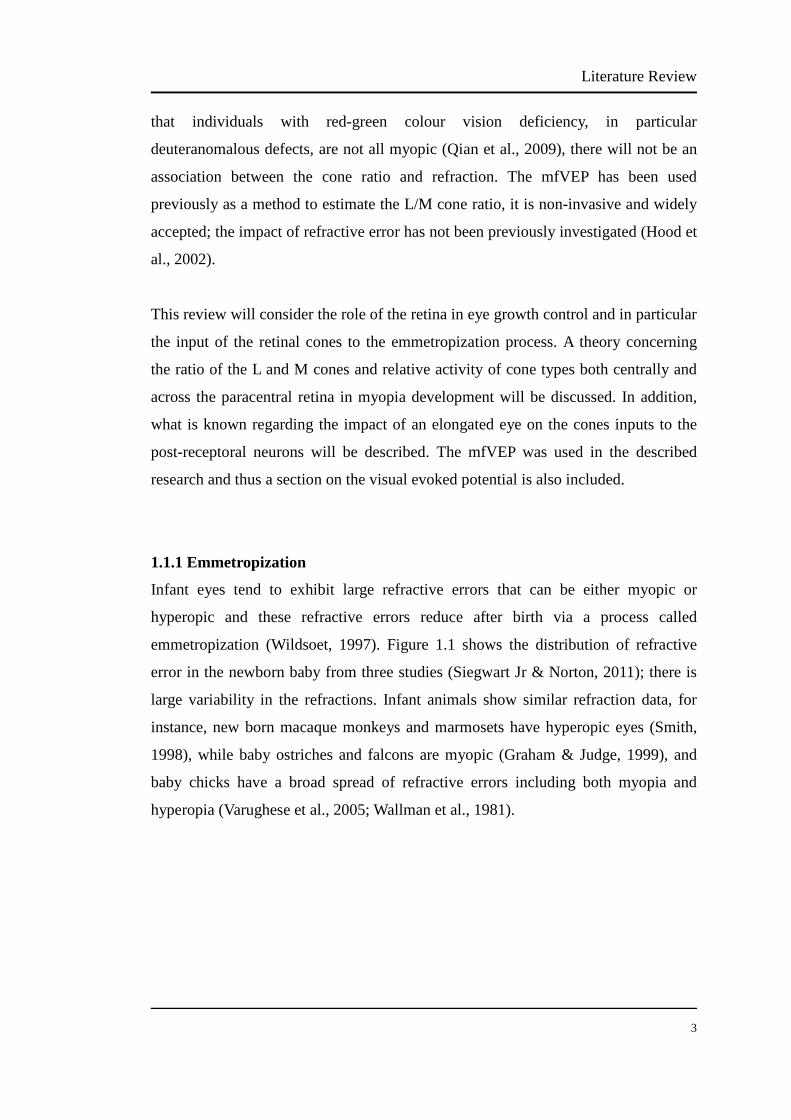
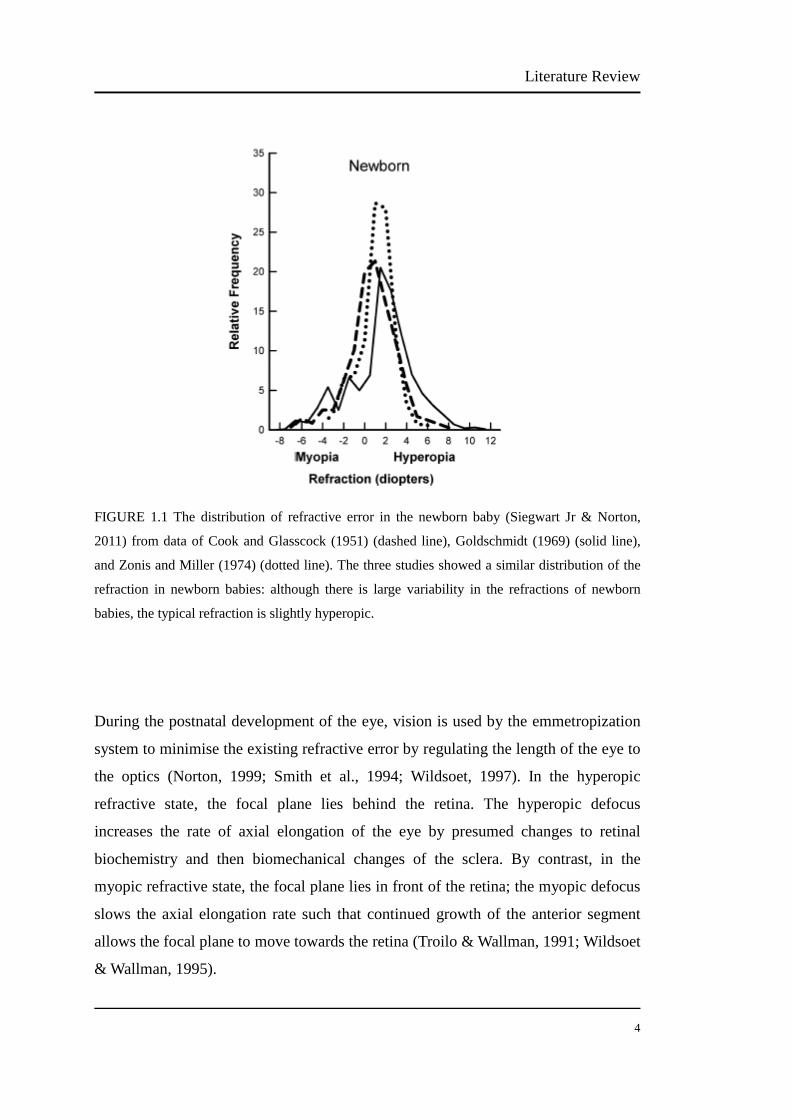
emmetropization (Wildsoet, 1997). Figure 1.1 shows the distribution of refractive
error in the newborn baby from three studies (Siegwart Jr & Norton, 2011); there is
large variability in the refractions. Infant animals show similar refraction data, for
instance, new born macaque monkeys and marmosets have hyperopic eyes (Smith,
1998), while baby ostriches and falcons are myopic (Graham & Judge, 1999), and
baby chicks have a broad spread of refractive errors including both myopia and
hyperopia (Varughese et al., 2005; Wallman et al., 1981).
Literature Review
4
FIGURE 1.1 The distribution of refractive error in the newborn baby (Siegwart Jr & Norton,
2011) from data of Cook and Glasscock (1951) (dashed line), Goldschmidt (1969) (solid line),
and Zonis and Miller (1974) (dotted line). The three studies showed a similar distribution of the
refraction in newborn babies: although there is large variability in the refractions of newborn
babies, the typical refraction is slightly hyperopic.
During the postnatal development of the eye, vision is used by the emmetropization
system to minimise the existing refractive error by regulating the length of the eye to
the optics (Norton, 1999; Smith et al., 1994; Wildsoet, 1997). In the hyperopic
refractive state, the focal plane lies behind the retina. The hyperopic defocus
increases the rate of axial elongation of the eye by presumed changes to retinal
biochemistry and then biomechanical changes of the sclera. By contrast, in the
myopic refractive state, the focal plane lies in front of the retina; the myopic defocus
slows the axial elongation rate such that continued growth of the anterior segment
allows the focal plane to move towards the retina (Troilo & Wallman, 1991; Wildsoet
& Wallman, 1995).
Literature Review
5
The emmetropization process is under retinal control (Norton et al., 1994; Troilo et
al., 1987) and uses visual feedback (Rabin et al., 1981). During the postnatal period,
the eye uses visual signals to elongate rapidly; the axial length of the eye typically
matches the focal plane at about 9 months of age. In cases of visual disturbance, for
example if corneal opacification (Meyer et al., 1999) and/or congenital cataracts
(Rabin et al., 1981) are present, emmetropization is disrupted and the eye grows
more rapidly than normal and a form of deprivation induced myopia develops.
Experimentally induced deprivation myopia has been used in animal studies
(Sherman et al., 1977; Wiesel & Raviola, 1977) to investigate eye growth processes.
These phenomena suggest high quality visual signals are required by the retina for
the determination of the required adjustments to the eye’s rate of growth.
1.1.2 Prevalence of myopia
Many studies seeking to determine the prevalence of myopia have been conducted
over the past century (Wilson & Woo, 1989). Usually East Asian countries have high
myopia prevalence, for example, China (89.5% in school children) (Zhao et al., 2000)
and Singapore (79.3% in young adult males) (Wu et al., 2001). Myopia tends to
occur in childhood (early onset myopia) or teenage years (late onset myopia) and
progresses (Fan et al., 2004; Lin et al., 1999), e.g. worsens, for many years. In regard
to gender, both females and males are susceptible to myopia, but some studies report
higher levels of myopia in females (Vitale et al., 2008; Wong et al., 2000). The
environmental conditions seem to have an impact on myopia, because people who
live in rural areas have a lower chance of being myopic than people who live in cities
(Xu et al., 2005). In addition, workers performing occupations with intensive near
work demands have high myopia risk, including microscopists (Ting et al., 2004) and
textile workers (Simensen & Thorud, 2009). Table 1.1 shows the prevalence of
myopia reported in several studies for comparison purposes.

Literature Review
6
TABLE 1.1 Prevalence of myopia by country in different age groups.
Country Age Myopia Prevalence Citation
China 5-15 years 89.5% Zhao et al., 2000
Hong Kong 13-15 years 85% Lam et al., 2004
Taiwan 16-18 years 84% Lin et al., 1999
Singapore 16-25 years 79.3% Wu et al., 2001
Malaysia 15 years 34% Goh et al., 2005
USA ≥20 years 33.1% Vitale et al., 2008
Greek 15-18 years 36.8% Mavracanas et al., 2001
Norway 20-25 years 35% Midelfart et al., 2002
Northern Ireland 12-13 years 17.7% O’Donoghue et al., 2010
Mexico 12-13 years 44% Villarreal et al., 2003
Australia 11-15 years 11.9% Ip et al., 2007
England 12-13 years 29.4% Logan et al., 2011
Sweden 12-13 years 49.7% Villarreal et al., 2000
Spain 30-35 years 30.1% Montes-Mico et al., 2000
Rural Mongolia 7-17 years 5.8% Morgan et al., 2006
India 5-15 years 7.4% Murthy et al., 2002
South Africa 5-15 years 4% Naidoo et al., 2003
Chile 5-15 years 7.3% Maul et al., 2000
1.2 Factors influencing eye growth
It is known that both hereditary and environmental factors influence refractive
development (Ip et al., 2008; Lam et al., 2008), however, there is still intense dispute
about which of these plays the more critical role. For any given individual these
factors will have varying relative importance.
1.2.1 Hereditary and genetic factors
A higher prevalence of myopia in Asian countries than in Western countries indicates
Literature Review
7
a racial impact on myopia. In Asian countries such as China and Hong Kong myopes
make up more than 80% of the whole population (Lam et al., 2004; Zhao et al.,
2000). In Western countries such as USA and Sweden the prevalence of myopia is
lower (30-50% of the teenager and adult population) (Villarreal et al., 2001; Vitale et
al., 2008). The varying different myopia prevalence in Asian versus Western
countries suggests Asian people may have genetic predisposition to myopia.
However, it is also possible that some of the difference is due to different lifestyles
and diets (Edwards et al., 1996; Rose et al., 2008).
Myopia development risk varies with family history; having two myopic parents
increases the risk of developing myopia compared to having no myopic patents. A
survey of 7560 Chinese school students aged between 5 to 16 years highlights the
influence of myopic parents on the refractive errors of their offspring (Lam et al.,
2008). Children with two myopic parents were on average 0.95 D more myopic and
children with one myopic parent were on average 0.40 D more myopic than children
with no myopic parents. Also, the progression of myopia was fastest in those
children with history of parental myopia; –0.22 D per year if both were myopic vs
–0.07 D per year if one parent was myopic and only –0.02 D per year in those
children with no parental history of myopia.
Strong evidence for the impact of heredity on myopia comes from studies of the
refractive errors of twins. A dizygotic twin study has shown there is significant
linkage to myopia on chromosomes 11p13, 3q26, 8q23 and 4q12 (Hammond et al.,
2004). Furthermore, there is a stronger similarity in the refractive error of
monozygotic than dizygotic twins (Hammond et al., 2001; Lyhne et al., 2001).
The development of sophisticated genetic analysis techniques has established that
there are many genetic loci with linkages to very high forms of myopia, i.e. loci 18q
(Lam et al., 2003; Young et al., 1998), 12q (Young et al., 1998), 4q (Zhang et al.,
2005), 5q (Lam et al., 2008; Ma et al., 2010) and 17q (Paluru et al., 2003). There is
also evidence for a primary genetic basis for moderate forms of myopia: paper
investigating 44 linkage families indicated the locus on 22q12 has an effect on

Literature Review
8
common myopia (Stambolian et al., 2004).
1.2.2 Environmental risk factors for myopia
A number of studies have shown that myopia prevalence is high in groups of people
with high education levels (Wensor et al., 1999; Wu et al., 2001; Xu et al., 2005). For
example, 15,059 Singapore military males aged 16-25 years underwent an
ophthalmic examination and the refraction data were analysed. Within each racial
grouping, the myopia prevalence was positively correlated to education level; 64.1%
with primary school education were myopic compared to 85.0% with a tertiary
education (Wu et al., 2001). Another study randomly selecting subjects from Victoria
in Australia found 12.3% myopic prevalence rate among people who did not
complete secondary education, 20.7% among people with secondary education and
29.5% among people with university education (Wensor et al., 1999).
Similarly, occupations with high nearwork demands also tend to have associated high
myopia prevalence. For example, there are reports of 90% prevalence of myopia
amongst textile workers with a close working distance (~30cm), and few to no
myopes amongst those with sales and production jobs in the same factory (Simensen
& Thorud, 2009). There are reports of 87% of Hong Kong Chinese microscopists
having myopia (Ting et al., 2004), whereas only 23% of Hong Kong fishermen are
myopic (Wong et al., 1993).
Nearwork appears to be a risk factor that is consistently associated with the
development of myopia (Saw et al., 2002; Simensen & Thorud, 2009; Ting et al.,
2004). A study of 1005 school children in Singapore reported that young children
who performed high amounts of reading (e.g. more than two books per week) are
likely to be myopic (Saw et al., 2002). Another study conducted in Xiamen China
suggested that children who spent more hours on nearwork (average 2.2 hours on
reading or writing) in the city have higher myopia prevalence than children who
spent less hours on nearwork in the countryside (Saw et al., 2001).

Literature Review
9
1.2.3 Outdoor activity decreases myopia risk
The myopiagenic effect of nearwork appears to be negated by periods spent outdoors.
A cross-sectional study conducting among 2367 school children in Sydney assessed
the relationship between outdoor activity and myopia. They found children who
performed more outdoor activity tended to have a relatively more hyperopic
refraction (Rose et al., 2008). Outdoor activity (≥2 hours per day) reduces the risk of
myopia even if both parents are myopic (Jones et al., 2007). A number of theories
have been proposed as to why this effect has been observed: i) increased general
activity and exercise while outdoors, ii) low accommodation requirements outdoors,
iii) exposure to a greater range of wavelengths outdoors, iv) the extremely high light
levels outdoors compared with indoors.
i) It may be supposed that physical activity induced biochemical changes within the
body that may influence the growth of the eye. A two year longitudinal study of 156
university students found that the amount of physical exercise performed was
inversely correlated to myopia progression, i.e. exercise was inhibitory (Jacobsen et
al., 2008). However, the authors stated that as the physical activity was primarily
conducted outdoors, e.g. bicycle riding outside, it was also possible that the results
were a simply reflection of the amount of time spent outdoors.
ii) It has been suggested that the long viewing distance while outdoors and thus the
low accommodation demand is the reason for the protective effect of outdoor activity.
Constant and high accommodation has long been thought to play a role in the
development of myopia. One theory is that inaccurate accommodation responses
induce a retinal defocus that can be detected by the retina, and the retina passes
signals to the eye to alter the normal eye growth, thus leading to myopia (Flitcroft,
1998).
iii) It has been supposed that the reason why outdoor activity inhibits the
development of myopia is that natural sun light contains a broader wavelength
spectrum than artificial light. The wavelength of outdoor natural light is different
from that of indoor artificial light. Indoor artificial lighting (either incandescent or
Literature Review
10
fluorescent) does not contain UV (ultraviolet radiation) with a reduced spectrum of
approximately 400-700 nm, while the spectrum of sunlight is 290-830 nm
(Thorington, 1985). The possible role of UV (290-400 nm) light in preventing the
development of myopia requires further investigations.
Whether the presence of UV is required to prevent myopia and how UV could be
used by an eye growth system is yet to be determined. One suggestion is that UV
could strengthen the sclera and thus control the axial growth of the eye. A study
investigated a UVA (Ultraviolet A) (315-400 nm) treatment on rabbit eyes in vivo
and showed that the treated biomechanical stress increased 228% (Wollensak et al.,
2005), which means the UVA treatment induced an improvement of the sclera
mechanical strength.
iv) Recent findings suggest that it is simply exposure to extremely high light levels
that is important; both sunlight and bright indoor light inhibit the myopic eye growth
in animal models (Ashby et al., 2009; Ashby & Schaeffel, 2010). When chicks were
reared under two different illuminance levels of artificial lighting, 15000 lux and 500
lux, less form-deprivation myopia was induced in those chicks reared under the
brighter light (Ashby & Schaeffel, 2010). Similarly, short periods of normal vision
are more effective at retarding myopia development if the light level is high and both
sunlight and intense artificial light retarded deprivation myopia (Ashby et al., 2009).
In further support of this idea, progression rates of myopia are less in summer when
light levels are high than in winter, although the long school holidays are typically in
summer (study of 71 school children across the seasons) (Fulk et al., 2002).
The beneficial effect of outdoor activity is thought to be mediated by the retina with
high light levels increasing the release of dopamine (Brainard & Morgan, 1987;
Godley & Wurtman, 1988). Dopamine release is reduced in deprivation myopia in
chickens (Stone et al., 1989; Weiss & Schaeffel, 1993) and monkeys (Iuvone et al.,
1989). Furthermore, the fact that dopamine agonists inhibit myopia in animal models
reveals a regulating role of dopamine in the myopic growth process (Iuvone et al.,
1991; McCarthy et al., 2007; Schmid & Wildsoet, 2004). Injecting dopamine

Literature Review
11
agonists, i.e. apomorphine (Iuvone et al., 1991; Rohrer et al., 1993; Schmid &
Wildsoet, 2004) and quinpirole (McCarthy et al., 2007), inhibits the development of
experimental myopia in chicks.
1.3 Retinal control of eye growth The retina is the primary controller of eye growth with limited involvement from
higher brain centres (Wildsoet & Wallman, 1995). There are three main points of
evidence for this: i) The use of partial diffusers or negative lenses produces localised
regional myopia. Hemifield-lenses when applied over either chick (Diether &
Schaeffel, 1997) or monkey eyes (Smith et al., 2009) induce elongation only in the
treated hemiretina. ii) FDM (Form Deprivation Myopia) and recovery from myopia
occur after the optic nerve, and thus connection to the brain, has been severed (Troilo
et al., 1987). Adaptation to positive and negative spectacle lenses also occurs
following optic nerve section but the endpoint of the emmetropization systems
appears to undergo a hyperopic shift (Wildsoet, 2003). iii) Toxins that destroy the
ganglion cells and prevent the transmission of signals from the retina do not prevent
emmetropization (McBrien et al., 1995; Norton et al., 1994).
1.3.1 Role of inner retina
The involvement of the inner retina in myopia progression has been indicated by
electrophysiological studies. OPs (Oscillatory potentials) which are thought to arise
from the amacrine cells and probably the bipolar cells in the inner retina
(Wachtmeister, 1998) have been investigated in electrophysiological studies. In
chicken experiments, the amplitudes of OPs decreased in form deprivation myopia
(Fujikado et al., 1996; Fujikado et al., 1997). In a human study, OPs displayed
significantly shorter implicit times of the first-order oscillatory potentials in
progressing myopes than in stable myopes and emmetropes (Chen et al., 2006).
These alterations of OPs suggested that the function of the inner retina is changed in
the development of myopia.
Literature Review
12
Biochemical studies demonstrated that the nuclear protein ZENK (Zif268 Egr-1
NGFI-A Krox-24) (Fischer et al., 1999), Pax-6 (Bhat et al., 2004) and dopamine
(Stone et al., 1989), which are mainly synthesized from the inner retina, have
important roles in regulation of eye growth. ZENK was reduced in both bipolar cells
and amacrine cells in FDM chicks (Fischer et al., 1999). The expression of Pax-6 (a
gene protein) in the retina of FDM chick eyes decreased by day 17 and increased by
day 31 (Bhat et al., 2004). Dopamine release is reduced in the retina of myopic eyes
of FDM chickens (Stone et al., 1989).
1.3.2 Role of outer retina
The outer retina contains the cell bodies of the cones and rods and has a critical role
in ocular growth regulation (Beresford et al., 1998; Liang et al., 1995; Shih et al.,
1993). The cones contain three types of photopigments, with relatively greater
sensitivity to light of long wavelengths, medium wavelengths and short wavelengths.
Therefore the cones are referred to as L cones, M cones and S cones, respectively.
Cones are responsible for colour vision at photopic light levels. The rods contain
only one type of photopigment and are more sensitive than cones. Rods respond to
very low levels of light so that they provide scotopic and mesopic vision (rods and
cones activated) and they have little contribution to colour vision (Cao et al., 2008;
Pokorny et al., 2006). As visual signals arise from photoreceptors and visual
experience is involved in the eye growth (Rabin et al., 1981), investigations of
photoreceptors are necessary for understanding the development of refractive error.
Abnormal structures of photoreceptors in chicks with FDM have been observed with
electron microscopy. In cones, the outer segments are damaged and the inner
segments are thickened. In rods, the outer segments become extremely extended and
thicker (Liang et al., 1995). Another study of myopia in the chick found that both
form deprivation myopia and LIM (Lens-induced Myopia) caused enlargement of
photoreceptor inner segments (Beresford et al., 1998). The significant structural
changes of the outer retina might provide an explanation of the mechanism of FDM.
It has been suggested that the elongation of the photoreceptor outer segments of

Literature Review
13
FDM chick eyes place pressure on the basal lamina of the RPE (Retinal Pigment
Epithelium), thinning the choroid and collapsing the choroidal vessels, thus choroidal
blood flow is reduced, and the reduction of blood flow could result in myopia
progression (Shih et al., 1993).
1.3.3 Role of RPE
The retinal pigment epithelium lies between the neural retina and the choroid. Visual
signals are detected by photoreceptors, then the eye generates chemical signals which
must go through the RPE layer and then act on the targets-choroid and sclera, thus
the RPE must play an important role in relaying retinal growth signals. Anatomical
studies have found expansion of RPE in FDM chicks (Lin et al., 1993) and
significant topographical changes of RPE in FDM quokka (Fleming et al., 1997;
Harman et al., 1999). The changes to the RPE observed in FDM chickens were
reversible if eyes were allowed to recover from FDM and this recovery happened
first in the retina, and then the RPE and choroid, suggesting that the physiological
functions of FDM were re-established and that molecular signals across the RPE
were used for eye growth regulation (Liang et al., 2004).
1.3.4 Role of choroid
The choroid is the vascular layer between the retina RPE and the sclera and changes
to the choroid have been found during LIM, LIH (Lens-induced Hyperopia) and
FDM and its recovery. If chicks wear positive or negative lenses to impose myopic
or hyperopic eye growth signals, the choroid expands or thins, respectively, to move
the retina forward or backward in order to make the new optical focus fall on the
retina (Wallman et al., 1995). In an FDM study, the eyeball of chicks rapidly
elongated and the choroid thinned following a period of form deprivation; conversely,
during recovery from FDM, the choroid thickened, moving the retina towards the
new plane of optical focus (Fitzgerald et al., 2002).
How the thickness changes of the choroid are mediated is not known. One hypothesis
Literature Review
14
is that nitric oxide plays a role because intravitreal injection of the nitric oxide
inhibitor L-NAME (NG-nitro-L-arginine Methyl Ester) inhibited choroidal
thickening in both FDM and LIM in chicks (Nickla & Wildsoet, 2004). Another
hypothesis is that choroidal blood flow regulates the thickness of the choroid by
transporting fluid into and out of the choroid (Fitzgerald et al., 2002).
1.3.5 Neurotransmitters in ocular growth
The molecular signals including dopamine, acetylcholine and VIP (Vasoactive
Intestinal Peptide) have been investigated in ocular growth regulation by many
studies. It has been shown that dopamine agonists inhibit myopia in animal models
(Iuvone et al., 1991; McCarthy et al., 2007; Schmid & Wildsoet, 2004), and
dopamine release is reduced in deprivation myopia in chickens (Stone et al., 1989;
Weiss & Schaeffel, 1993) and monkeys (Iuvone et al., 1989). An acetylcholine
antagonist, atropine, inhibited the development of experimental myopia in chicks
when injected intravitreally or subconjunctivally (McBrien et al., 1993; Stone et al.,
1991). VIP antagonists also have inhibit the myopia produced by deprivation (Pickett
Seltner & Stell, 1995).
1.3.6 Role of peripheral retina
Studies of the peripheral retina have documented a link between the pattern of
peripheral refractive errors and degree of myopia. The refractive status of the
peripheral retina relative to the fovea is more hyperopic in myopes and more myopic
in hyperopes than in emmetropes (Charman, 2005; Mutti et al., 2007; Seidemann et
al., 2002; Stone & Flitcroft, 2004). An explanation proposed to account for these
findings is that the on axis myopia is the result of the compensation for the hyperopic
peripheral refractive error, i.e. the peripheral retina elongates and the central retina
follows, thus the off-axis errors induced a change in eye growth that eventually
resulted in the on-axis error.
However it is difficult to say if the central retina or the peripheral retina dominates

Literature Review
15
the overall axial growth signal. Infant monkeys wearing diffusers with central holes
developed axial elongations (Smith et al., 2005), but chickens wearing lenses with
central holes retain emmetropic axial refraction (Schippert & Schaeffel, 2006). The
former study suggested that visual signals from larger peripheral retina areas could
overshadow the signals from the smaller fovea area, but the latter study suggested
that the foveal retina which has a far greater number of cones than the peripheral
retina plays a critical role in eye growth.
1.4 Photoreceptors and Myopia Visual experience can regulate eye growth (Lauber & Kinnear, 1979). Therefore the
photoreceptors which convert the light signal into a neural signal are likely to be
involved in some way in generating the signals required for eye growth processes.
Evidence for this includes that cone disease usually accompanies refractive error and
the anatomical changes of photoreceptors in experimental myopia in animal models
(Beresford et al., 1998; Michaelides et al., 2005).
1.4.1 Distributions of the Cones and rods
The distributions of the cones and the rods in the retina are different. There are the
highest density of cones in the fovea area, and the density of the cones decreases
sharply when moving away from the fovea. The density of the rods rises from the
fovea to a high value along an elliptical ring at approximately the eccentricity as the
centre of the optic disk and then decreases steadily across the peripheral retina
(Curcio et al., 2004).
1.4.2 Cone disease and refractive error
Cone disease is usually associated with refractive error (Michaelides et al., 2005;
Schwartz et al., 1990). The most important function of cones is to capture photons
and then generate visual signals through a process called phototransduction. If this
function is abnormal or absent, e.g. due to cone disease, the retina without visual
Literature Review
16
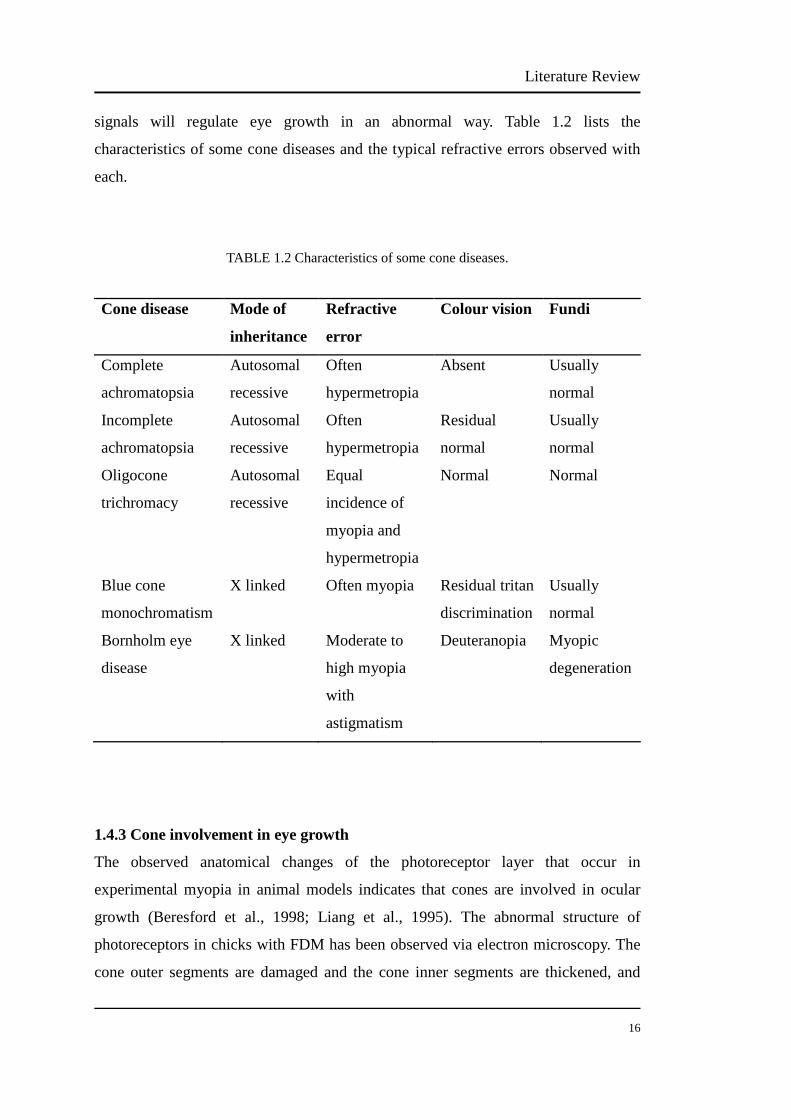
signals will regulate eye growth in an abnormal way. Table 1.2 lists the
characteristics of some cone diseases and the typical refractive errors observed with
each.
TABLE 1.2 Characteristics of some cone diseases.
Cone disease Mode of
inheritance
Refractive
error
Colour vision Fundi
Complete
achromatopsia
Autosomal
recessive
Often
hypermetropia
Absent Usually
normal
Incomplete
achromatopsia
Autosomal
recessive
Often
hypermetropia
Residual
normal
Usually
normal
Oligocone
trichromacy
Autosomal
recessive
Equal
incidence of
myopia and
hypermetropia
Normal Normal
Blue cone
monochromatism
X linked Often myopia Residual tritan
discrimination
Usually
normal
Bornholm eye
disease
X linked Moderate to
high myopia
with
astigmatism
Deuteranopia Myopic
degeneration
1.4.3 Cone involvement in eye growth
The observed anatomical changes of the photoreceptor layer that occur in
experimental myopia in animal models indicates that cones are involved in ocular
growth (Beresford et al., 1998; Liang et al., 1995). The abnormal structure of
photoreceptors in chicks with FDM has been observed via electron microscopy. The
cone outer segments are damaged and the cone inner segments are thickened, and

Literature Review
17
similarly the rod outer segments become extremely extended and thicker (Liang et al.,
1995). Another study in chickens found that both FDM and LIM caused enlargement
of the photoreceptor inner segments (Beresford et al., 1998).
The involvement of cones in eye growth processes is also shown in retina function
studies (Chen et al., 2006; Chen et al., 2006; Kawabata & Adachi-Usami, 1997;
Kawabata & Adachi-Usami, 1997). An mfERG (Multifocal Electroretinogram) study
in humans found that amplitudes were reduced and the latencies are delayed in
myopia. The authors concluded that the reduced response sensitivity of mfERG in
myopia results primarily from cone function loss (Kawabata & Adachi-Usami, 1997).
In a human based study, OPs displayed significantly shorter implicit times in
progressing myopes than in stable myopes and emmetropes (Chen et al., 2006).
Another psychophysical study showed reduced visual sensitivity in high myopes
(Jaworski et al., 2006). Sensitivity to white and S cone isolation spots of various size
and contrast were tested in 10 high myopes and 10 control emmetropes. The myopic
group showed a loss of sensitivity at all spot sizes.
In a study utilising the chick eye growth model, chicks were form deprived with
translucent diffusers and exposed to different light conditions. Both sunlight and
intensely bright indoor room light retarded the progression of deprivation myopia
(Ashby et al., 2009). Moreover, it has also been reported that chicks develop myopia
when raised under dim light conditions (Lauber & Kinnear, 1979). In contrast, cats
which are largely nocturnal and have a rod dominated retina do not develop myopia
when wearing contact lenses to induce a predictable degree of myopia or with lid
suture (Nathan et al., 1984).
1.4.4 Cone ratios in refractive error
Considering the important role of light in eye growth and that photopic vision
predominantly depends on cones, the modulation of refractive error could be led by
cone inputs and outputs. It may be speculated that either the function or the
structures of cones varies between myopic and emmetropic eyes. It has been reported

Literature Review
18
that a monochromatic yellow light matched by an emmetrope using red and green
seemed too red to a myopic subject (normal correction and near monochromatic
stimuli during experiment) and too green to a hyperopic subject (Wienke, 1960),
suggesting that myopes have greater sensitivity to red and hyperopes to green. This
finding is consistent with another study finding that myopes have relatively higher
sensitivity to long-wavelength light than emmetropes (Rucker & Kruger, 2006). The
participants viewed stimuli with different cone contrast ratios while their
accommodation was measured continuously. Their results indicated that more
myopic individuals showed a higher level of accommodation gain to relatively more
L cone contrast.
As L cones have their peak sensitivity at long wavelengths (567nm) and M cones
have their peak sensitivity at medium wavelengths (541nm), the relatively higher
sensitivity to red in myopia might be postulated to be due to myopes having higher
L/M cone ratios than emmetropes (Rucker & Kruger, 2006). However,
psychophysical evidence indicates that post-receptoral gain control normalizes any
differences in sensitivity to red and green lights (Raleigh match), hence individual
differences in Raleigh matches are small compared to the population variability in
cone ratios (Pokorny et al., 1991).
Although several studies have recorded the L/M ratio in participants with normal
colour vision, there are limited investigations comparing the L/M ratios in myopia
and emmetropia. The L/M cone ratio has been reported to range from 0.4 to 13
among participants with normal colour vision as assessed by various techniques
(Albrecht et al., 2002; Bowmaker & Dartnall, 1980; Brainard et al., 2000; Carroll et
al., 2000; Carroll et al., 2002; Cicerone & Nerger, 1989; Dartnall et al., 1983;
Hagstrom et al., 1998; Hagstrom et al., 2000; Hood et al., 2002; Kremers et al., 1999;
Langrová et al., 2007; Nerger & Cicerone, 1992; Otake & Cicerone, 2000; Pokorny
& Smith, 1987; Roorda & Williams, 1988; Usui et al., 1998).
The L/M cone ratios amongst human individuals with normal colour vision reported
in different studies are shown in Table 1.3. L/M cone ratios range from 1.5 to 4.9
Literature Review
19
based on analysis using gene expression and from 1.3 to 1.7 using
microspectrophotometry (Hagstrom et al., 1998; Hagstrom et al., 2000). These two
methods collected donor eyes to analyse the mRNA of L pigment and M pigment of
the retina. Direct images of the retina were taken when the photopigments were
selectively bleached. This method gave L/M ratios ranging from 1.15 to 3.79
(Bowmaker, & Dartnall, 1980; Dartnall et al., 1983; Roorda, & Williams, 1988).
Several psychophysical studies have been carried out and the reported L/M ratios
range from 1.1 to 3.4 (Otake, & Cicerone, 2000; Pokorny, & Smith, 1987; Cicerone,
& Nerger, 1989; Nerger, & Cicerone, 1992). Electrophysiological techniques have
also been used to estimate L/M ratios and values with this method ranging from 0.4
to 13 (Brainard et al., 2000; Usui et al., 1998; Carroll et al., 2002; Carroll et al., 2000;
Kremers et al., 1999; Langrova et al., 2007; Albrecht et al., 2002; Hood et al., 2002).

Literature Review
20
TABLE 1.3 Cone ratios amongst people with normal colour vision.
Method Participant
Number
Retinal
area
L/M cone
ratio
Author
mRNA analysis 2 20° and
40°
1.5 (20°)
3.0 (40°)
Hagstrom et
al., 1998
Cone pigment gene
expression
4 20° 3.63 – 4.86 Hagstrom et
al., 2000
Microspectrophotometer 1 Foveal
and
parafov
eal
1.73 Bowmaker,
& Dartnall,
1980
Microspectrophotometer 7 Foveal
and
parafov
eal
1.29 Dartnall et
al., 1983
Combine adaptive optics
and retinal densitometry
2 1° 1.15 - 3.79 Roorda, &
Williams,
1988
Unique yellow 2 28° 1.63 - 1.99 Otake, &
Cicerone,
2000
Heterochromatic flicker
photometry
2 2° 1.1-3.4 Pokorny, &
Smith, 1987
Heterochromatic flicker
photometry
6 1° 1.46 - 2.36 Cicerone, &
Nerger, 1989
Psychophysical
prosedures
3 4° 2.0 Nerger, &
Cicerone,
1992
Flicker 2 1° 1.06 - 3.38 Brainard et

Literature Review
21
electroretinogram al., 2000
Flicker
electroretinogram
5 124*10
8°
3.7 ± 1.0 Usui et al.,
1998
Flicker-photometric
electroretinogram
62 70° 0.4 - 13
Carroll et al.,
2002
Flicker-photometric
electroretinogram
15 70° 0.6 - 12
Carroll et al.,
2000
Electroretinogram 36 124*10
8°
4.24 ± 2.13 Kremers et
al., 1999
The multifocal pattern
electroretinogram
10 8° and
12.8°-2
6°
1.00 - 2.78 (8°)
1.29 - 2.78
(12.8°-26°)
Langrova et
al., 2007
Multifocal
electroretinograms
38 5° and
40°
1.4 (5°)
2.3 (40°)
Albrecht et
al., 2002
Multifocal visual
evoked potentials
6 1° and
5.8°-22.
2°
0.8 - 1.1 (1°)
1.1 - 1.7
(5.8°-22.2°)
Hood et al.,
2002
In these L/M cone ratios studies, only three papers mentioned the refraction of the
participants (Table 1.4). In the study of Otake and Cicerone (2000) for the central 28°
using unique yellow, the L/M ratios of one emmetrope and one myope were 1.63 and
1.99. Using heterochromatic flicker photometry and a 1° field, the L/M ratios of four
emmetropes were 2.07, 2.00, 1.46, 2.36, respectively; the L/M ratios of two mild
myopes were 2.28 and 1.99. Finally, using psychophysical procedures and a 4° field,
the L/M ratio of one emmetrope was 1.83; the L/M ratios of two mild myopes were
2.2 and 1.5. These data suggest great individual variability in the L/M cone ratio in
persons with emmetropia and myopia.
Literature Review
22
TABLE 1.4 The refraction of participants in three L/M cone ratio studies
Method Retinal
area
Participant
ID
Refraction L/M
cone
ratio
Author
Unique yellow 28° KL
SL
-2.25D
Emmetrope
1.99
1.63
Otake, &
Cicerone,
2000
Heterochromatic
flicker
photometry
1° VV
HA
CC
JN
YP
EM
<-1.50D
<-1.50D
Emmetrope
Emmetrope
Emmetrope
Emmetrope
2.28
1.99
2.07
2.00
1.46
2.36
Cicerone, &
Nerger, 1989
Psychophysical
procedures
4° CC
VV
HA
Emmetrope
<-2.00D
<-2.00D
1.83
2.2
1.5
Nerger, &
Cicerone,
1992
1.5 Methods to estimate L/M cone ratios The L/M cone ratios of human beings have been assessed using different methods.
Analyses of L/M cone ratios using gene expression and microspectrophotometry
have been performed on donor eyes (Hagstrom et al., 1998; Hagstrom et al., 2000).
The mRNA of photoreceptors of selected retina patches was analysed. The ratios of
L/M cone were calculated from the L/M mRNA ratios. Direct images of the retinal
cones in living eyes have been performed however the special device that was used is
not commonly available (Bowmaker & Dartnall, 1980; Dartnall et al., 1983; Roorda
& Williams, 1988). The images were obtained after the L or M cones were fully
bleached. The number of L or M cones can be counted from the direct images.
Psychophysical studies have been conducted using detection thresholds,

Literature Review
23
heterochromatic flicker photometry and minimal flicker perception (Kremers et al.,
2000). High temporal frequencies and low temporal frequencies of the
psychophysical tasks were compared and the authors found that there is a gain
adjustment to compensate the differences of L/M cone ratios when using low
temporal frequencies which tap into the red-green chromatic channel.
Psychophysical studies are noninvasive, but usually measure the ratio only on the
foveal retina. Electrophysiology methods such as flicker-photometric
electroretinogram, mfERG and mfVEP also have been used to estimate L/M cone
ratios. These measurements are more reliable because they are objective, but one
study using flicker-photometric electroretinogram suggested that the variation of the
sensitivity of photopigments between individuals provide a major source of error in
estimates of L/M cone ratios, but this error usually within about 2% (Carroll et al.,
2000).
1.6 Multifocal visual evoked potential Every technique of cone isolation study has limitations and advantages and all
require assumptions (for example, choice of cone fundamentals, corrections for
pre-receptoral filtering, method for determining isoluminant points) (Hood et al.,
2002) to derive an estimate of the cone ratio from the data. In this study, mfVEP was
recorded with cone isolation stimuli as mfVEP is a non-invasive and widely accepted
technique.
The visual evoked potential (VEP) is an electrical potential recorded from the
primary visual cortex of a human or other animal following presentation of a light
stimulus (Hood et al., 2003). Electrodes are placed on the scalp to record the VEP
signals. There are two electrodes to record VEP signals: an active electrode and an
inactive electrode. The algebraic difference in potential is determined by VEPs
between these two electrodes. The VEPs are used to examine the responses of the
visual pathway from the retina, the optic nerve, optic radiations and occipital cortex.
The VEP is not a new technique in neuro-ophthalmology field. Optic neuritis
Literature Review
24
sclerosis had been tested using VEP in patients forty years ago and it reported
delayed VEP responses (Halliday et al., 1972). It has been proved that VEP is
sensitive in detecting visual field defects. One patient with a right homonymous
hemianopia with maular sparing was found an absence of unpatterned light VEP
signals when the right visual field was stimulated (Regan & Cartwright, 1970).
The multifocal visual evoked potential is a type of pattern reversal VEP with inputs
from multiple visual areas (Hood et al., 2003). The standard stimuli are a black-white
dartboard array consisting of 60 sectors and each sector is a checkerboard pattern
consisting of 16 checks. The advantage of mfVEP compare to VEP is the size of the
stimuli used. With smaller stimuli, the mfVEP can easily detect local defects. The
mfVEP has been used to rule out non-organic visual loss (Miele et al., 2000);
diagnose optic neuritis (Hood et al., 2000) and to assess the damage of optic nerve in
glaucoma (Hood et al., 2003). Recently the mfVEP has been used to determine L/M
cone ratios (Hood et al., 2002).
1.7 Colour vision and colour vision in myopia A recent study indicated that red-green colour defective individuals are not usually
myopic or emmetropic (Qian et al., 2009); i.e. they suffer a range of refractive errors.
As the cones in the retina are responsible for colour vision in humans, more studies
are required on the role of cones in the progression of myopia.
1.7.1 Colour vision
Visible light is the limited portion of the radiant energy to which the eye responds.
The visible light spectrum is from 400 nm to 700 nm. The processing of visual
signals in humans begins in three types of photoreceptor which absorb photons of
particular wavelengths. The S-cone, M-cone and L-cone sensitive photopigments
have peak sensitivity in the short (445nm), middle (541nm) and long (567nm)
wavelength region of the spectrum, respectively (Smith & Pokorny, 1975).

Literature Review
25
Visual signals are directly transmitted from photoreceptors to the bipolar cells and
ganglion cells. The other visual pathway is from photoreceptors via horizontal cells
and amacrine cells to the bipolar cells and ganglion cells (Lee et al., 2010). Three
major types of ganglion cells are involved in human colour vision: the midget
ganglion cells, the parasol ganglion cells and the small bistratified ganglion cells.
Visual signals are transmitted from the ganglion cells to the visual cortex following
three primary neural pathways. The three neural pathways are named according to
the laminae within the laterale geniculate nucleus (LGN): PC (parvocellular), MC
(magnocellular) and KC (koniocellular) pathways (Dacey, 2000).
The midget ganglion cells target to the parvocellular LGN, while the parasol
ganglion cells project to the magnocellular LGN. The MC pathway is sensitive to
luminance contrast and processes combined signals from L and M cones (Lee et al.,
1988; Perry et al., 1984). The PC pathway is responsible for chromatic detection and
receives opponent signals from L and M cones. The PC pathway is important for the
red-green colour vision (Lee, 1996; Merigan, 1989). The small bistratified ganglion
cells which connected to S cones feed to the KC pathway. The KC pathway belongs
to the short-wavelength system (Dacey, 1993; Dacey, 1996).
Human beings and old world primates are trichromats, but placental mammals are
dichromats (Jacobs, 1993). While primates have an advanced colour vision system,
many vertebrates with four cone pigments developed colour vision better than ours.
In vertebrates, the overlap in sensitivity between adjacent cones was reduced,
therefore the discrimination of colours was increased (Govardovskii & Zueva, 1977;
Loew & Govardovskii, 2001; Palacios et al., 1998). The most sophisticated colour
vision system has at least ten types of photoreceptors founded in mantis shrimps
(Cronin & Marshall, 1989).
The evolution of colour vision in animals probably depends on fruits and flowers. In
late 19th century, the evolution of colour vision was formulated: ‘Insects produce
flowers. Flowers produce the colour-sense in insects. The colour-sense produces a
taste for colour. The taste for colour produces butterflies and brilliant beetles. Birds

Literature Review
26
and mammals produce fruits. Fruits produce a taste for colour in birds and mammals.
The taste for colour produces the external hues of humming-birds, parrots and
monkeys. Man’s frugivorous ancestry produces in him a similar taste and that taste
produces the final result of human chromatic arts.’ (Wallace, 1879).
The benefit of having chromatic vision is to easy detect and distinguish the objects in
the world. As shown in Figure 1.2, with normal colour vision the red flowers are
clear, while without colour perception the red flowers are somewhat vague.
Trichromatic colour vision helps primates to separate green, yellow, orange and red
fruits as fruits are an important diet of primates (Tan & Li, 1999). Also the set of
reddish colour was developed because many primates have red sexual displays
(Dixson, 1999).

Literature Review
27
FIGURE 1.2 Red flowers, green leaves and blue sky with and without colour (This photograph
was taken by Nanyu Zhou). With normal colour vision the red flowers are clear, while without
colour perception the red flowers are somewhat vague.
1.7.2 Colour deficiency and myopia
Recent studies giving insight into colour vision and myopia infer that colour vision
could influence the development of myopia (Kröger & Binder, 2000; Qian et al.,
2009). One study investigated the prevalence of myopia in 309 high school students
with colour vision deficiency, including 142 students with protan and 167 students
with deutan and 927 students with normal colour vision. They concluded that
students with red-green colour vision deficiency have both lower incidence and
lower degrees of myopia than those students with normal colour vision (Qian et al.,

Literature Review
28
2009). Another study investigated the effect of long wavelengths during nearwork.
They used a white paper which was illuminated by a laboratory halogen lamp and
interference filters which selectively absorbed long wavelengths to education
nearwork. The paper significantly reduced accommodation stimulus by about 0.5 D
(Kröger & Binder, 2000). As accommodation is considered as a possible cause of
myopia (Chen et al., 2003), it is reasonable to speculate that the red light absorbing
paper may slow the progression of myopia.
The mechanism of the influence of red and green light in myopia might be mediated
by longitudinal chromatic aberration (LCA) (Qian et al., 2009). White light is a mix
of lights with different wavelengths. Among emmetropes, after white light goes
through the refractive media of the eye, red light is focused behind the retina; yellow
light is focused in the plane of the photoreceptors; green light is focused in front of
the retina. If the retina is more sensitive to red than green light or has higher L cone
sensitivity than M cone sensitivity, the retina could move toward red by elongating
the eyeball or increasing accommodation, resulting in myopia. A recent study has
found that higher myopic individuals have higher mean accommodation levels to
L-cone stimulation. The possible explanation is that myopic individuals have
relatively higher L/M cone ratios or the differences in pigment polymorphism
between myopia and emmetropia (Rucker & Kruger, 2006).
1.8 Aims and hypothesis There has been some investigations of the cone activity in myopia (Kawabata &
Adachi-Usami, 1997) and the cone ratios in the normal colour vision population
(Kremers et al., 2000), but little work comparing the cone ratios between eyes of
myopic and emmetropic individuals with normal colour vision.
Given the fact that dichromats (red-green colour vision deficiency), with extreme
L/M cone ratios, are not all myopic or emmetropic (Qian et al., 2009), we predict
that the L/M cone ratio will vary in individuals but not show a regular difference
simply due to refractive error. On the other hand, Neitz and Neitz (2011) suggested

Literature Review
29
that eyeglasses that equalize the activities of L and M cones can reduced the myopia
progression rate to a tenth of that observed in myopes wearing standard eyeglasses;
this suggests that the L and M cone ratios may be different in myopes and
emmetropes.
The aim of this research was to determine if L/M cone ratios in the central retina are
different between myopic and emmetropic young, colour normal adults. The null
hypothesis was that myopia is not dependent on L/M cone ratio. The alternate
hypothesis was that myopia is caused by a high L/M cone ratio.
Experimental Methods
30
Chapter 2
Experimental Methods
2.1 Introduction This chapter describes the mfVEP technique in detail, the calibration of the monitors
and the calculation of L and M cone isolating stimuli for studying the L/M cone
ratios.
2.2 Multifocal visual evoked potential for L/M cone ratio study Figure 2.1 shows the mfVEP equipment and stimuli used in this study, including a
CRT stimulator, an amplifier and a Apple Mac G5 control computer. With the mfVEP,
multiple responses can be tested from different locations of the retina. Electrodes
were connected to the amplifier and placed on the scalp to detect the electrical
signals generated by the retina and the visual nervous system. VERIS system was
used to generate visual stimuli and collect data. The L/M cone ratio can be calculated
from mfVEP responses (Hood et al., 2002).

Experimental Methods
31
FIGURE 2.1 The mfVEP equipment and stimuli used in this study, including a CRT stimulator,
an amplifier and a mac control computer. During experiments, participants sat in front of the
monitor and looked at the stimuli. Some electrodes which connected to the amplifier were placed
on their scalp to detect the electrical signals generated by the retina and the visual nervous system.
VERIS system was used to generate visual stimuli and collect data.
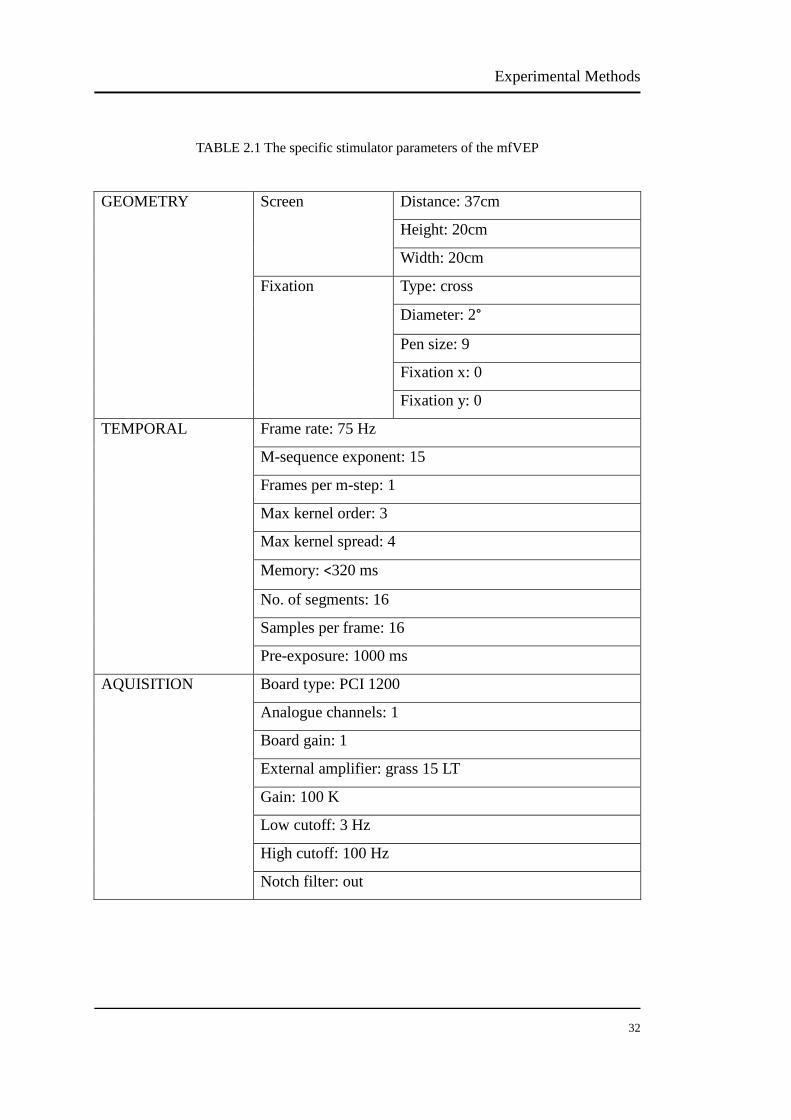
The specific stimulator parameters of the mfVEP are shown in Table 2.1. The target
for participants to fixate is a cross with diameter 2°. The pen size of the fixation
means the thickness of the cross. Kernel slice is the response to a particular stimulus
pattern. In temporal settings, max kernel order is 3 and max kernel spread is 4.
STIMULATOR
MAC CONTRAL COMPUTER
AMPLIFIER
Experimental Methods
32
TABLE 2.1 The specific stimulator parameters of the mfVEP
GEOMETRY Screen Distance: 37cm
Height: 20cm
Width: 20cm
Fixation Type: cross
Diameter: 2°
Pen size: 9
Fixation x: 0
Fixation y: 0
TEMPORAL Frame rate: 75 Hz
M-sequence exponent: 15
Frames per m-step: 1
Max kernel order: 3
Max kernel spread: 4
Memory: <320 ms
No. of segments: 16
Samples per frame: 16
Pre-exposure: 1000 ms
AQUISITION Board type: PCI 1200
Analogue channels: 1
Board gain: 1
External amplifier: grass 15 LT
Gain: 100 K
Low cutoff: 3 Hz
High cutoff: 100 Hz
Notch filter: out

Experimental Methods
33
According to the ISCEV (International Society for Clinical Electrophysiology of
Vision) standard for clinical visual evoked potentials, a single black-white
pattern-reversal VEP response consists of N75, P100 and N135 peaks. The N and P
stand for negative and positive peak and the numbers 75, 100 and 135 represent
recording time (Odom et al., 2010)(see Figure 2.2).
FIGURE 2.2 A single black-white pattern-reversal VEP response. Typically it consists of N75,
P100 and N135 peaks (Odom et al., 2010). The N and P stand for negative and positive peak and
the numbers 75, 100 and 135 represent recording time.
The amplitudes of mfVEPs are highly variable among individuals, but the repeat
reliability of mfVEP responses is good ( the standard deviation of the root mean square
measure amplitude is approximately 1.6dB) for the same subject) (Chen et al., 2003).
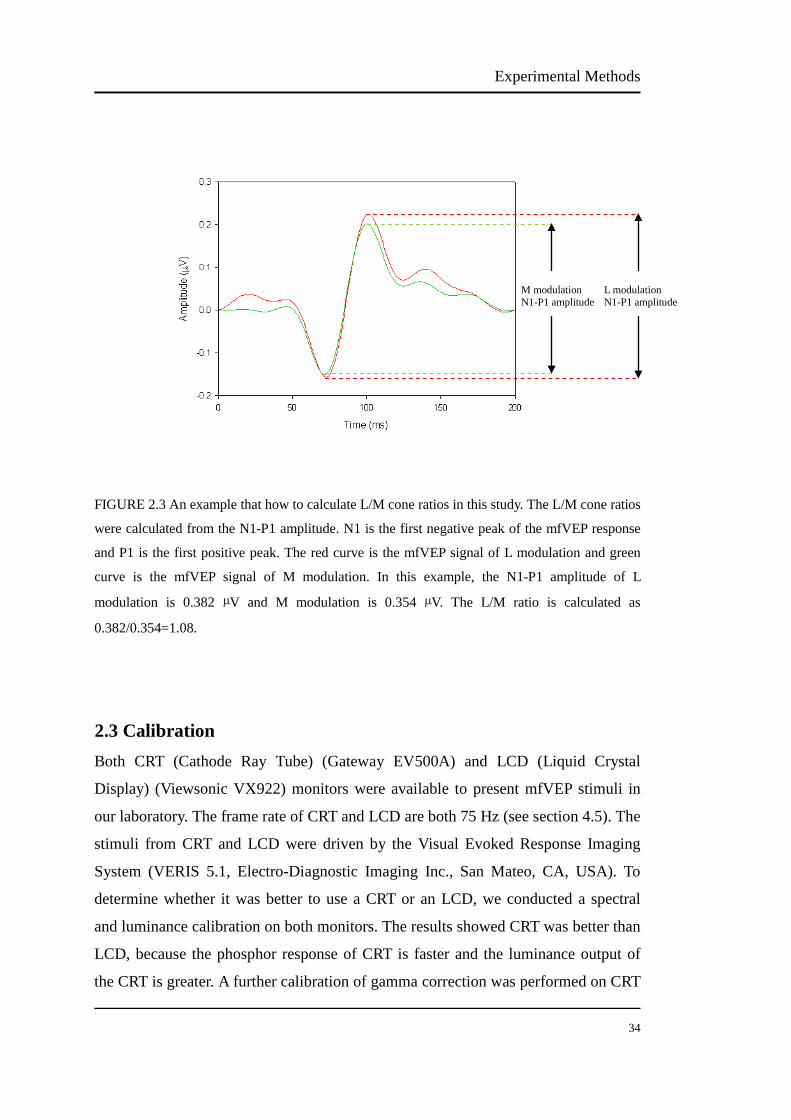
L/M ratios have been studied using mfVEP by Hood et al. (2002). The L/M ratios are
calculated from the N1-P1 amplitudes in our study (Figure 2.3). N1 was the first
negative peak and P1 was the first positive peak. To improve the variation of mfVEP
recordings within individuals, two same mfVEP measurements were averaged.
Time
Amplitude
Experimental Methods
34
FIGURE 2.3 An example that how to calculate L/M cone ratios in this study. The L/M cone ratios
were calculated from the N1-P1 amplitude. N1 is the first negative peak of the mfVEP response
and P1 is the first positive peak. The red curve is the mfVEP signal of L modulation and green
curve is the mfVEP signal of M modulation. In this example, the N1-P1 amplitude of L
modulation is 0.382 µV and M modulation is 0.354 µV. The L/M ratio is calculated as
0.382/0.354=1.08.
2.3 Calibration Both CRT (Cathode Ray Tube) (Gateway EV500A) and LCD (Liquid Crystal
Display) (Viewsonic VX922) monitors were available to present mfVEP stimuli in
our laboratory. The frame rate of CRT and LCD are both 75 Hz (see section 4.5). The
stimuli from CRT and LCD were driven by the Visual Evoked Response Imaging
System (VERIS 5.1, Electro-Diagnostic Imaging Inc., San Mateo, CA, USA). To
determine whether it was better to use a CRT or an LCD, we conducted a spectral
and luminance calibration on both monitors. The results showed CRT was better than
LCD, because the phosphor response of CRT is faster and the luminance output of
the CRT is greater. A further calibration of gamma correction was performed on CRT
L modulation N1-P1 amplitude
M modulation N1-P1 amplitude
Experimental Methods
35
in order to accurately control the outputs of the primary lights.
2.3.1 Spectral and luminance calibration of CRT and LCD monitors
In this study, we used alternating coloured lights to stimulate only one cone type, and
therefore the phosphor response, phosphor output and luminance output of the
monitors used is important. Quick phosphor responses allow colour lights to change
more accurately across short time intervals. A narrow phosphor output can provide a
larger contrast range for isolating the cones. A greater luminance output range as a
function of the output voltage of the video card bit number can give a larger range of
cone excitations and thus are problematic for designing stimuli to isolate different
cone types.
The effects of the CRT and LCD phosphor response on mfERG recording have been
studied by Feigl and Zele (2008). The mfERG recording used the VERIS system
with the CRT and was repeated with the LCD. They showed that when an LCD
monitor was used as a stimulus generator, there was a delay in the peak implicit time
of the mfERG waveforms relative to those when a CRT monitor was used.
The emission spectra of red, green and blue phosphors at maximum output (bit value
at 255) of the CRT and the LCD were measured using a calibrated Spectroradiometer
(Tampa, Florida, USA). Figure 2.4 shows the spectral distribution of the three
phosphors. The CRT and LCD both have a similar wavelength range, but the
emission spectral of the green phosphor of LCD is narrower.

Experimental Methods
36
FIGURE 2.4 The spectral distribution of red, green and blue from the CRT and the LCD
monitors. The CRT and LCD both have a similar wavelength range, but the emission spectral of
the green phosphor of LCD is narrower.

Experimental Methods
37
The luminance outputs of the CRT and the LCD were measured using a luminance
colorimeter (BM-7, Topcon, Tokyo, Japan). Each colour was measured at bit
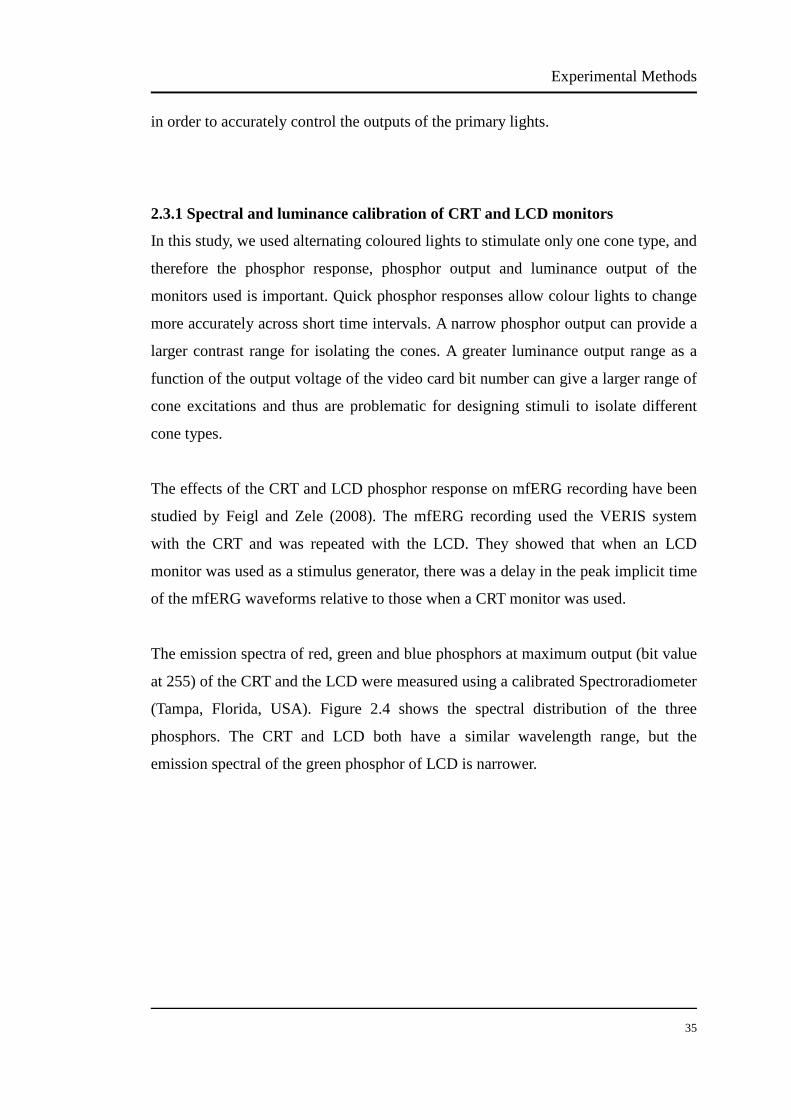
numbers from 1 to 255. Figure 2.5 shows the luminance output of the CRT and the
LCD monitor driven by the VERIS system. The luminance output of the CRT and
LCD becomes flat at low and high bit values. The effective bit number ranges of
CRT are 49-255 for red, 27-255 for green and 99-255 for blue. The bit ranges of
LCD are 59-212 for red, 32-214 for green and 104-218 for blue, but the maximum
luminance output of each phosphor is higher than for the CRT. The reduced bit range
is due to the VERIS system driving the display (the CRT or LCD display). Although
it has an 8 bit video card with a full 255 bit range, the display output clearly has
lower and upper limits that are less than 8 bit at both a high range and a low range.
Experimental Methods
38
FIGURE 2.5 The luminance output of CRT and LCD monitors driven by the VERIS system. The
luminance output of the CRT and LCD becomes flat at low and high bit values. The effective bit
number ranges of CRT are 49-255 for red, 27-255 for green and 99-255 for blue. The bit ranges
of LCD are 59-212 for red, 32-214 for green and 104-218 for blue, but the maximum luminance
output of each phosphor is higher than for the CRT.
Experimental Methods
39
Although the LCD monitor has narrower green phosphor output than the CRT, the
temporal phosphor response of the CRT has a faster rise time and the luminance
output of the CRT is higher than those of the LCD. Thus, in this study, we used the
CRT monitor to generate the cone isolating mfVEP stimuli.
2.3.2 Gamma correction of CRT monitor
The luminance output of the CRT was measured using a luminance colorimeter
(BM-7, Topcon, Tokyo, Japan). The VERIS system controlled the RGB bit numbers
from 1 to 255. Appendix I is the original luminance outputs from the CRT monitor.
Because the luminance of a CRT changes over a period of time, the monitor needs to
be warmed up for about 1 hour before measurements (Metha et al., 1993).
An ideal display behaves linearly, but the CRT monitor is nonlinear and the
luminance output is not linearly related to the voltage input. In fact, the relationship
between the voltage input and luminance output of CRT monitor is subject to a
power function. Such a relationship is known as "gamma function" and described by
the following equation:
Lout = α + βLin γ (1)
where Lout is the luminance output, Lin is the voltage input, α is the dark light of the
monitor, β is a constant and γ is the exponent of Lin.
We fitted gamma functions to the red, green and blue in the effective range,
respectively. Figure 2.6 shows the relative voltage-luminance relationship (gamma
function) of the CRT monitor. The gamma is usually between 2-3 for CRT (Colombo
& Derrington, 2001). The CRT in our laboratory has the gamma exponent of 2.16 for
red, 2.02 for green and 2.45 for blue. The voltage-luminance relationship for the blue
phosphor has some flats, shown in Figure 2.6. Given that the blue phosphor does not
have large modulation amplitude for the L and M cone isolations (see section 2.4.1),
thus it will have minimum impact on the outcome.
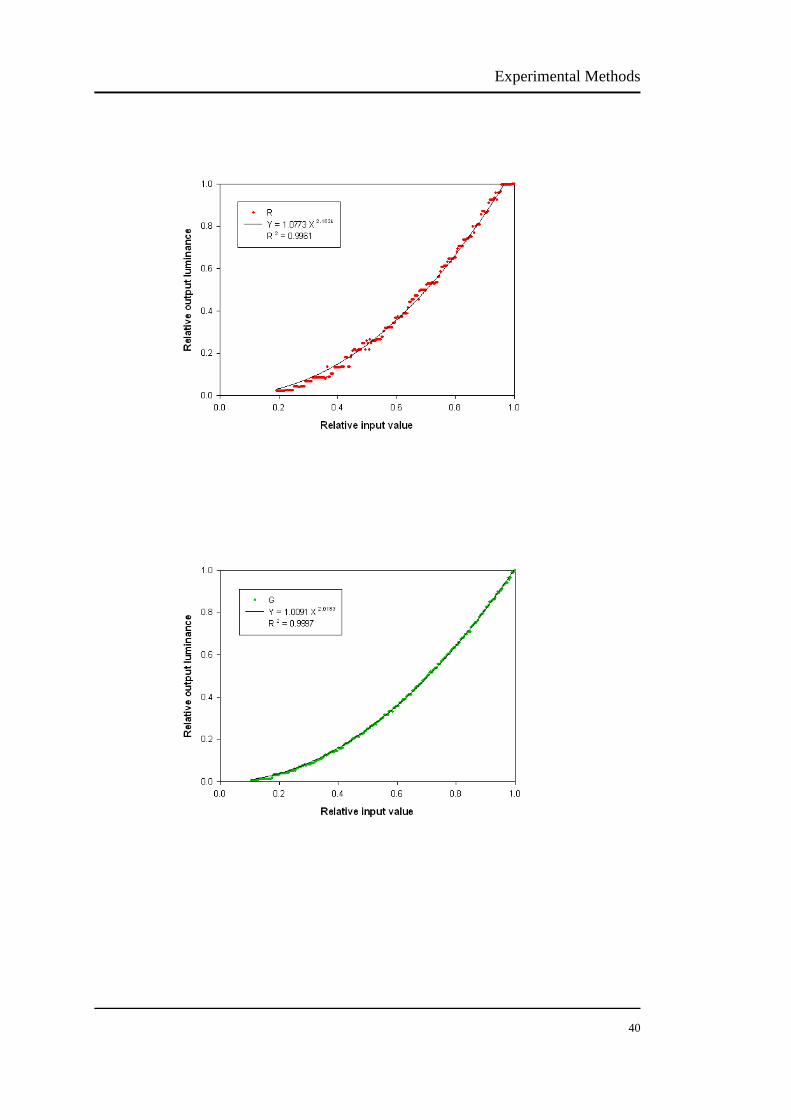
Experimental Methods
40
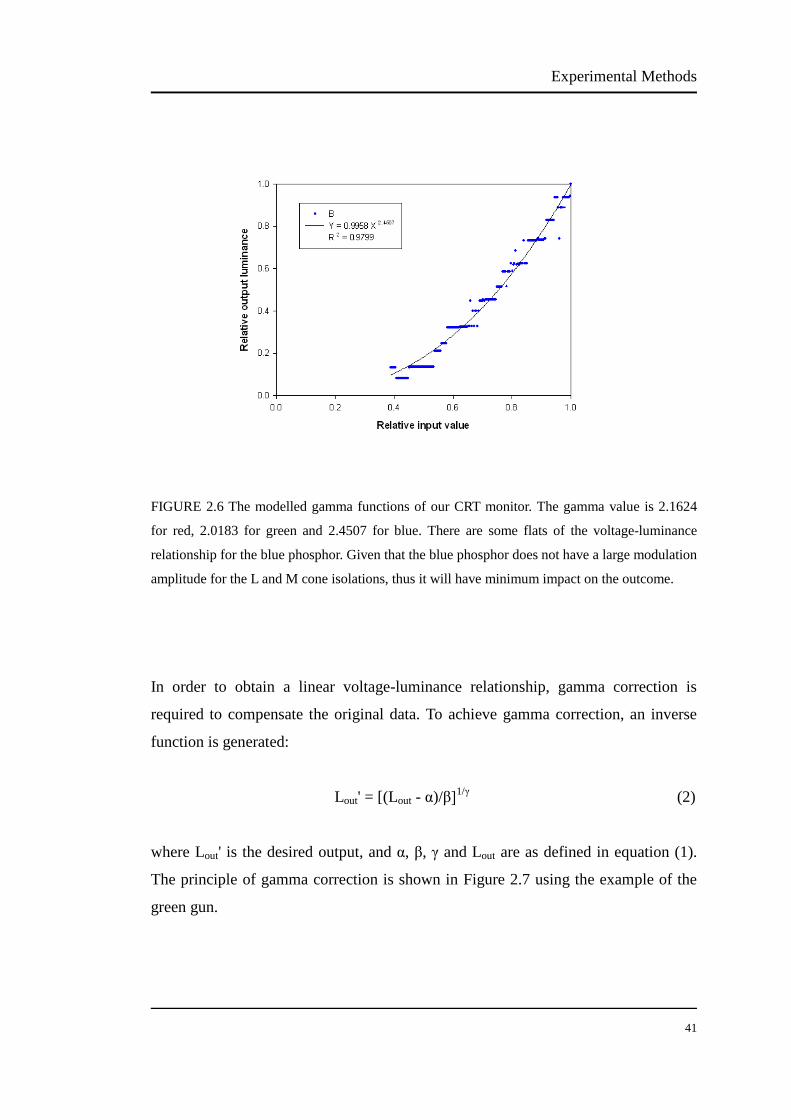
Experimental Methods
41
FIGURE 2.6 The modelled gamma functions of our CRT monitor. The gamma value is 2.1624
for red, 2.0183 for green and 2.4507 for blue. There are some flats of the voltage-luminance
relationship for the blue phosphor. Given that the blue phosphor does not have a large modulation
amplitude for the L and M cone isolations, thus it will have minimum impact on the outcome.
In order to obtain a linear voltage-luminance relationship, gamma correction is
required to compensate the original data. To achieve gamma correction, an inverse
function is generated:
Lout' = [(Lout - α)/β]1/γ (2)
where Lout' is the desired output, and α, β, γ and Lout are as defined in equation (1).
The principle of gamma correction is shown in Figure 2.7 using the example of the
green gun.

Experimental Methods
42
FIGURE 2.7 Gamma function and its inverse function for the green gun. The lower curve is the
modelled gamma function and the top curve is the inverse function of the model. A relative input
voltage of 0.6 (A) in the modelled gamma function results in 0.36 (B). With a linear relationship,
the input 0.6 should result in output 0.6. The nonlinear relationship can be corrected by applying
an inverse function. When the input 0.6 is entered, a value of 0.77 (C) is returned. Appling the
value 0.77 to the relative input voltage would return the required output of 0.6.
With the nonlinear input-output relationship, a relative input voltage of 0.6 (A)
results in 0.36 (B). With a linear relationship, the input 0.6 should result in output 0.6.
The nonlinear relationship can be corrected by applying an inverse function. When
the input 0.6 is entered, a value of 0.77 (C) is returned. Appling the value 0.77 to the
relative input voltage would return the required output of 0.6.
As shown in Figure 2.8, the input-output relationship became linear after the gamma
correction had been made. To evaluate the linear relationship, we computed if the
maximum luminance plus the minimum luminance equals twice the average
luminance. The error of the linearization check is -0.024% for red, -0.017% for green
and -0.007% for blue, which are minor (see Appendix II).
Experimental Methods
43
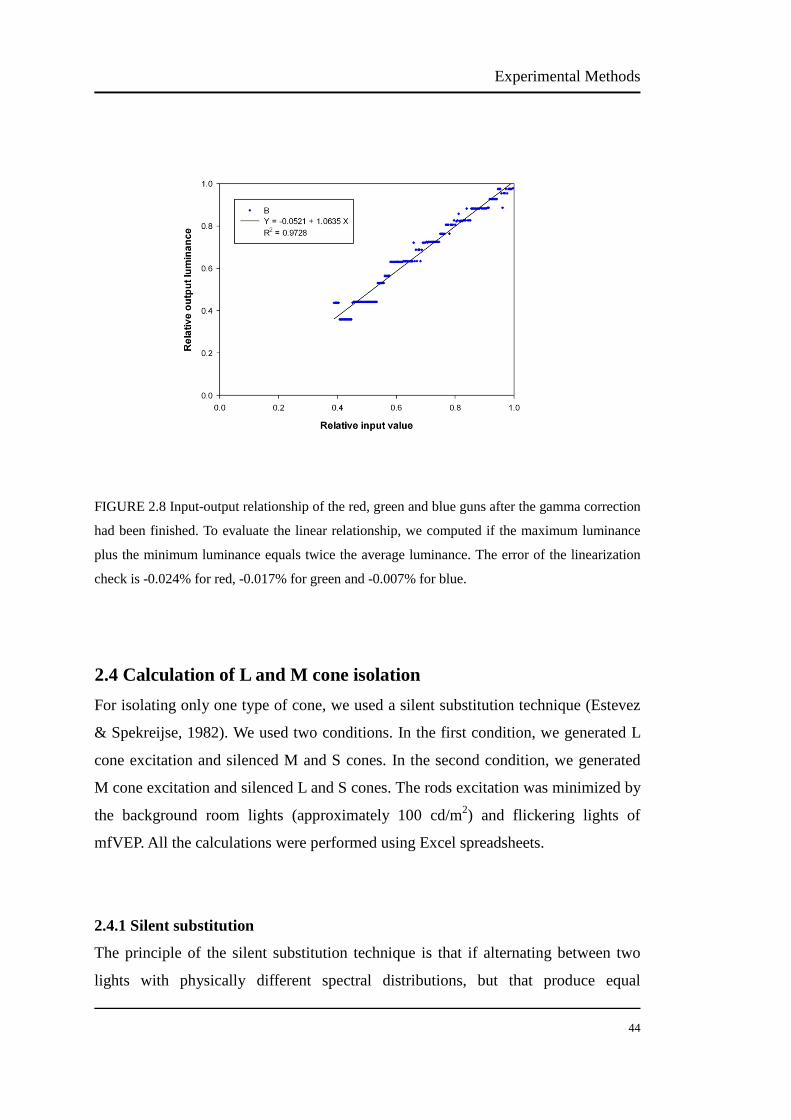
Experimental Methods
44
FIGURE 2.8 Input-output relationship of the red, green and blue guns after the gamma correction
had been finished. To evaluate the linear relationship, we computed if the maximum luminance
plus the minimum luminance equals twice the average luminance. The error of the linearization
check is -0.024% for red, -0.017% for green and -0.007% for blue.
2.4 Calculation of L and M cone isolation For isolating only one type of cone, we used a silent substitution technique (Estevez
& Spekreijse, 1982). We used two conditions. In the first condition, we generated L
cone excitation and silenced M and S cones. In the second condition, we generated
M cone excitation and silenced L and S cones. The rods excitation was minimized by
the background room lights (approximately 100 cd/m2) and flickering lights of
mfVEP. All the calculations were performed using Excel spreadsheets.
2.4.1 Silent substitution
The principle of the silent substitution technique is that if alternating between two
lights with physically different spectral distributions, but that produce equal

Experimental Methods
45
excitation of one type cone, this photoreceptor should not be able to detect the
change in wavelength of the lights. As shown in Figure 2.9, the 543nm and 594 nm
lights give the same excitation to the L cones, but different excitation to the M cones.
When alternating between 543nm and 594 nm, the L cones cannot detect the
difference, so the responses of the M cones are isolated (Foster, 2010).
FIGURE 2.9 An example of the principle of the silent substitution technique. The 543nm and 594
nm lights give the same excitation to the L cones, but different excitation to the M cones. When
alternating between 543nm and 594 nm, the L cones cannot detect the difference, so the
responses of the M cones are isolated.
The excitation of one type of cone can be controlled by modulating the output of
three primary lights such as the RGB phosphors in a CRT by multiplying the
emission spectra of the three phosphors (see Appendix IV) with the cone
fundamentals and integrating the product over wavelength. In this study the Smith
and Pokony 10° cone fundamentals (see Appendix V) was employed. Figure 2.10
shows the sensitivity of each photoreceptor type according to the Smith and Pokony
10° fundamentals (Smith & Pokorny, 1975).

Experimental Methods
46
FIGURE 2.10 The Smith and Pokony 10° fundamentals (Smith & Pokorny, 1975). The red, green
and blue curves are the L cone, M cone and S cone sensitivity over 400-700nm wavelengths,
respectively.
For example, the L cone excitation by a generated red phosphor is:
LR = ∫ ER * FL * d(λ) (3)
where ER is the emission distribution of the red phosphor and FL is the L cone
fundamental. Similarly the L cone excitation by generated green phosphor is:
LG = ∫ EG * FL * d(λ) (4)
the L cone excitation by generated blue phosphor is:
LB= ∫ EB * FL * d(λ) (5)
400
700
700
700
400
400
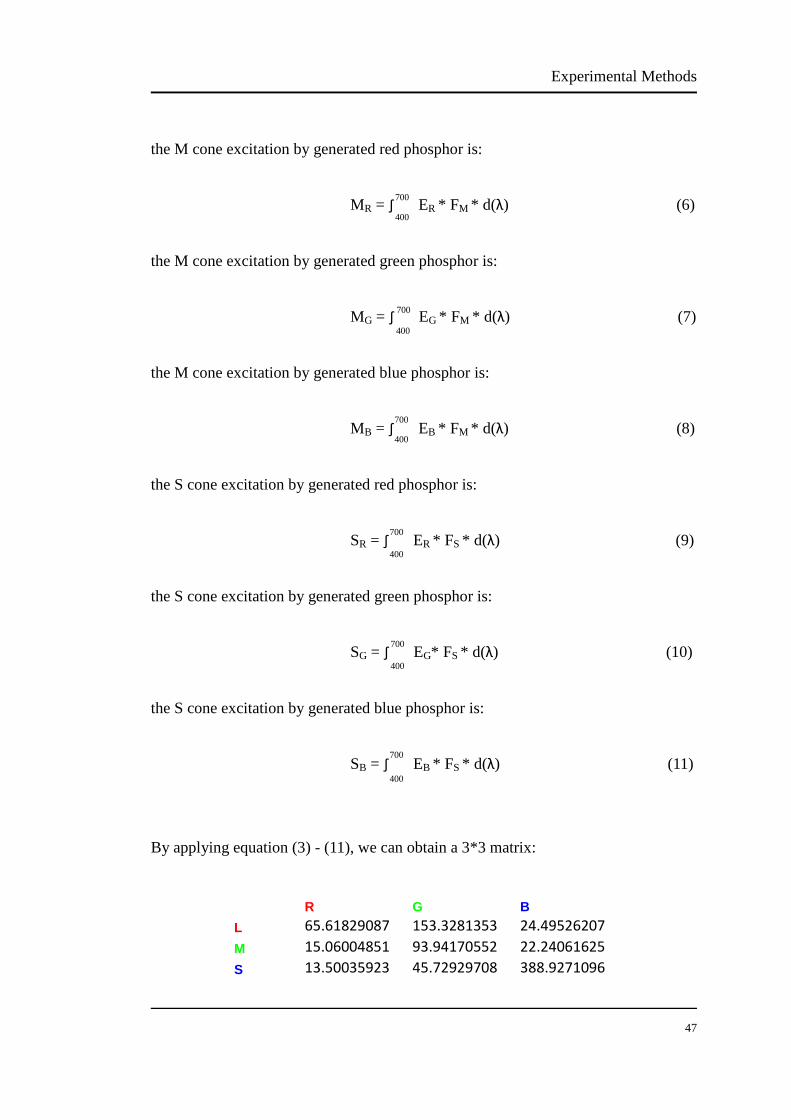
Experimental Methods
47
the M cone excitation by generated red phosphor is:
MR = ∫ ER * FM * d(λ) (6)
the M cone excitation by generated green phosphor is:
MG = ∫ EG * FM * d(λ) (7)
the M cone excitation by generated blue phosphor is:
MB = ∫ EB * FM * d(λ) (8)
the S cone excitation by generated red phosphor is:
SR = ∫ ER * FS * d(λ) (9)
the S cone excitation by generated green phosphor is:
SG = ∫ EG* FS * d(λ) (10)
the S cone excitation by generated blue phosphor is:
SB = ∫ EB * FS * d(λ) (11)
By applying equation (3) - (11), we can obtain a 3*3 matrix:
R G B L 65.61829087 153.3281353 24.49526207 M 15.06004851 93.94170552 22.24061625 S 13.50035923 45.72929708 388.9271096
700
700
700
700
700
700
400
400
400
400
400
400

Experimental Methods
48
Since every light contains three primaries R, G and B with a certain scale, the total
excitation of the L, M and S cones can be calculated:
The R, G and B output value can be calculated using the inverse matrix of the above
3*3 matrix:
The RGB and LMS can be modulated by some value ΔR, ΔG, ΔB, ΔL, ΔM and ΔS:
If we make ΔM = 0 and ΔS = 0, only the L cone is excited. Similarly only the M cone
is excited when ΔL = 0 and ΔS =0 and only the S cone is excited when ΔL = 0 and
ΔM = 0.
2.4.2 The L cone modulation
The L cone modulation was calculated using an Excel spreadsheet. Making ΔL =
ΔLmax, ΔM = 0 and ΔS = 0 resulted in ΔR = 1, ΔG = -0.1565 and ΔB = -0.0163. The
ΔR, ΔG and ΔB correspond to percentages and the “-” means decrease. We
normalized the available ranges of bit numbers in Appendix III, thus the two lights
can be selected from Appendix I, II and III. For example, according to Appendix III,
the bit number for ΔR = 1 are from 0 to 255, then from Appendix II, in a linear
ΔR
ΔG
ΔB
ΔL
ΔM
ΔS
= *
0.024253911 -0.039954945 0.000757254
-0.003794518 0.017200641 -0.000744626
-0.000395745 -0.00063551 0.002632442
65.61829084 153.3281353 24.49526207
15.06004851 93.94170552 22.24061625
13.50035923 45.72929708 388.9271096
R
G
B
L
M
S
= *
0.024253911 -0.039954945 0.000757254
-0.003794518 0.017200641 -0.000744626
-0.000395745 -0.00063551 0.002632442
= *
R
G
B
L
M
S
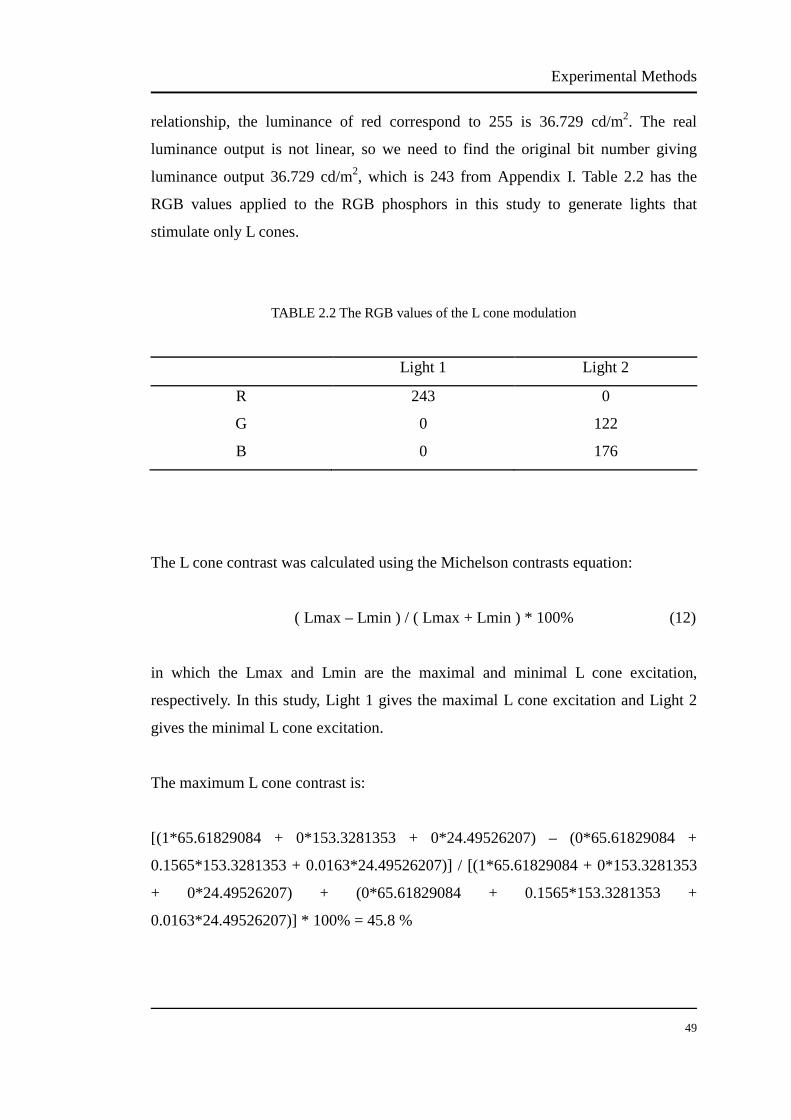
Experimental Methods
49
relationship, the luminance of red correspond to 255 is 36.729 cd/m2. The real
luminance output is not linear, so we need to find the original bit number giving
luminance output 36.729 cd/m2, which is 243 from Appendix I. Table 2.2 has the
RGB values applied to the RGB phosphors in this study to generate lights that
stimulate only L cones.
TABLE 2.2 The RGB values of the L cone modulation
Light 1 Light 2
R 243 0
G 0 122
B 0 176
The L cone contrast was calculated using the Michelson contrasts equation:
( Lmax – Lmin ) / ( Lmax + Lmin ) * 100% (12)
in which the Lmax and Lmin are the maximal and minimal L cone excitation,
respectively. In this study, Light 1 gives the maximal L cone excitation and Light 2
gives the minimal L cone excitation.
The maximum L cone contrast is:
[(1*65.61829084 + 0*153.3281353 + 0*24.49526207) – (0*65.61829084 +
0.1565*153.3281353 + 0.0163*24.49526207)] / [(1*65.61829084 + 0*153.3281353
+ 0*24.49526207) + (0*65.61829084 + 0.1565*153.3281353 +
0.0163*24.49526207)] * 100% = 45.8 %

Experimental Methods
50
2.4.3 The M cone modulation
The M cone modulation was calculated using an Excel spreadsheet. Making ΔL = 0,
ΔM = ΔMmax and ΔS = 0 resulted in ΔR = -1, ΔG = 0.4305 and ΔB = -0.0159. The
ΔR, ΔG and ΔB corresponded to percentage and the “-” means decrease. The two
lights can be selected form Appendix I, II and III. Table 2.3 is the stimulus applied in
this study to stimulate only M cone:
TABLE 2.3 The RGB values of the M cone modulation
Light 1 Light 2
R 0 243
G 177 0
B 0 176
The M cone contrast was calculated using the Michelson contrasts equation:
( Mmax – Mmin ) / ( Mmax + Mmin ) * 100% (13)
in which the Mmax and Mmin are the maximal and minimal M cone excitation,
respectively. In this study, Light 1 gives the maximal M cone excitation and Light 2
gives the minimal M cone excitation.
The maximum M cone contrast is:
[(0*15.06004851 + 0.4305*93.94170552 + 0*22.24061625) - (1*15.06004851 +
0*93.94170552 + 0.0159*22.24061625)] / [(0*15.06004851 + 0.4305*93.94170552
+ 0*22.24061625) + (1*15.06004851 + 0*93.94170552 + 0.0159*22.24061625)] *
100% = 44.8 %
Experimental Methods
51
2.5 Statistical analysis
SPSS (Statistical Package for the Social Sciences, 18.0) was used to conduct the
statistical analysis. One-way ANOVA was performed to determine whether there are
differences in L/M cone ratios between emmetropes, lower myopes and higher
myopes. Independent-samples t-test was performed to determine whether there are
differences in L/M cone ratios between emmetropes and myopes.
2.6 Power analysis
GPower (3.1.5) software was used to conduct the power analysis. Priori power
analysis was performed to estimate sample size. A previous L/M cone ratios study
was used to predict the sample size of this study (Cicerone & Nerger, 1989). The
previous study tested 6 participants: 4 emmetropes and 2 myopes. The mean L/M
cone ratio was 1.97±0.38 of the emmetropes and 2.14±0.21 of the myopes. In our
study, we were planning to recruit three groups: emmetropia, lower myopia and
higher myopia, so there needs to be twice as many myopes as emmetropes.
According to GPower results, to get power value of 0.8, we need 36 emmetropes and
72 myopes. Because of the time limitation of this study and using mfVEP to isolate L
and M cone is a new technique in our laboratory, we recruited 30 participants for this
thesis (10 emmetropes and 20 myopes).
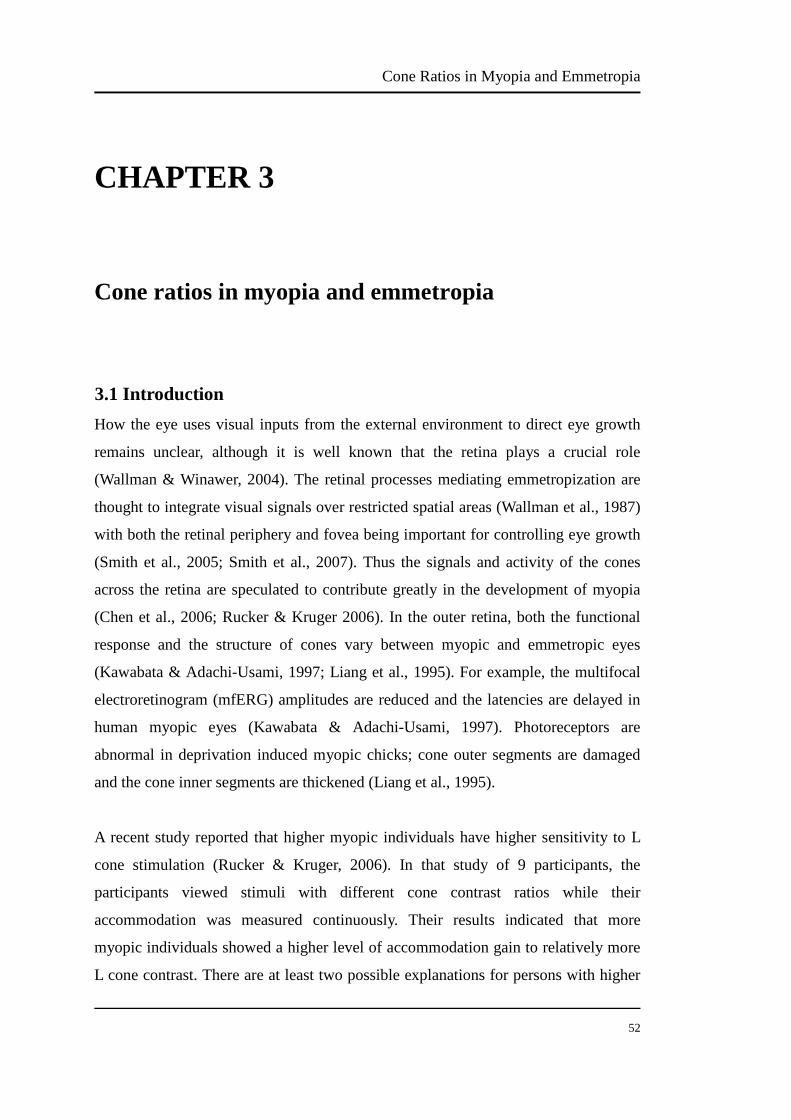
Cone Ratios in Myopia and Emmetropia
52
CHAPTER 3
Cone ratios in myopia and emmetropia
3.1 Introduction How the eye uses visual inputs from the external environment to direct eye growth
remains unclear, although it is well known that the retina plays a crucial role
(Wallman & Winawer, 2004). The retinal processes mediating emmetropization are
thought to integrate visual signals over restricted spatial areas (Wallman et al., 1987)
with both the retinal periphery and fovea being important for controlling eye growth
(Smith et al., 2005; Smith et al., 2007). Thus the signals and activity of the cones
across the retina are speculated to contribute greatly in the development of myopia
(Chen et al., 2006; Rucker & Kruger 2006). In the outer retina, both the functional
response and the structure of cones vary between myopic and emmetropic eyes
(Kawabata & Adachi-Usami, 1997; Liang et al., 1995). For example, the multifocal
electroretinogram (mfERG) amplitudes are reduced and the latencies are delayed in
human myopic eyes (Kawabata & Adachi-Usami, 1997). Photoreceptors are
abnormal in deprivation induced myopic chicks; cone outer segments are damaged
and the cone inner segments are thickened (Liang et al., 1995).
A recent study reported that higher myopic individuals have higher sensitivity to L
cone stimulation (Rucker & Kruger, 2006). In that study of 9 participants, the
participants viewed stimuli with different cone contrast ratios while their
accommodation was measured continuously. Their results indicated that more
myopic individuals showed a higher level of accommodation gain to relatively more
L cone contrast. There are at least two possible explanations for persons with higher
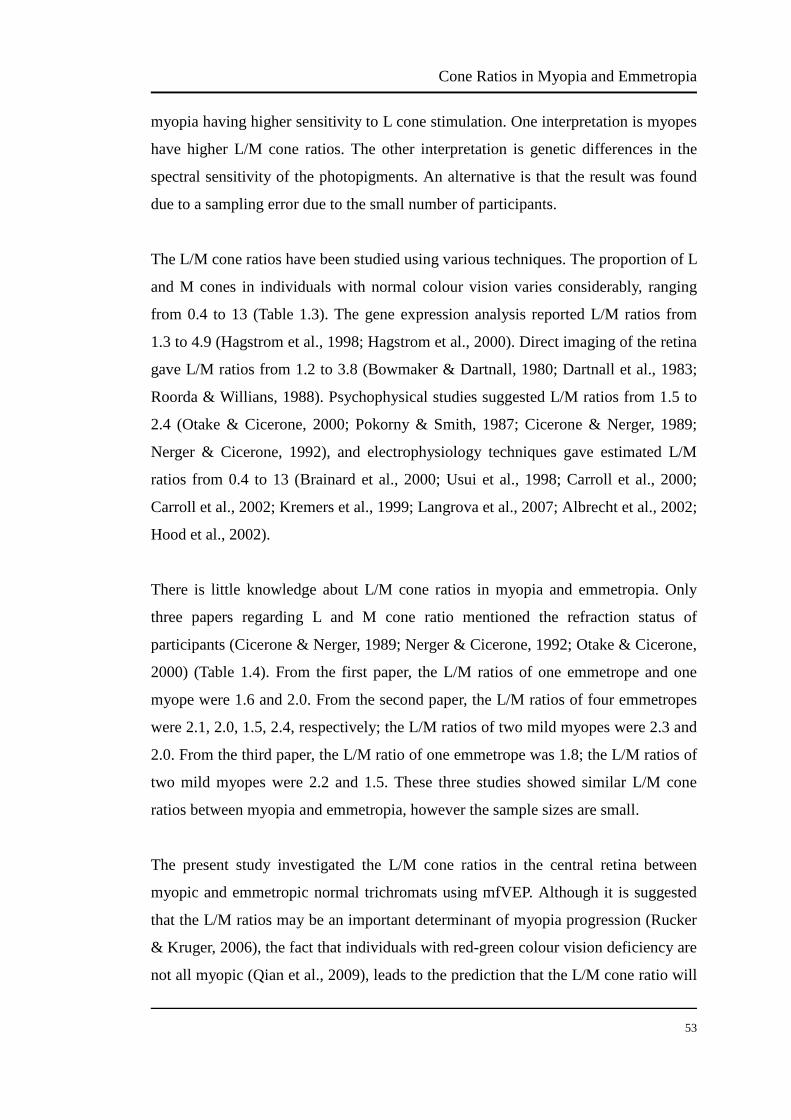
Cone Ratios in Myopia and Emmetropia
53
myopia having higher sensitivity to L cone stimulation. One interpretation is myopes
have higher L/M cone ratios. The other interpretation is genetic differences in the
spectral sensitivity of the photopigments. An alternative is that the result was found
due to a sampling error due to the small number of participants.
The L/M cone ratios have been studied using various techniques. The proportion of L
and M cones in individuals with normal colour vision varies considerably, ranging
from 0.4 to 13 (Table 1.3). The gene expression analysis reported L/M ratios from
1.3 to 4.9 (Hagstrom et al., 1998; Hagstrom et al., 2000). Direct imaging of the retina
gave L/M ratios from 1.2 to 3.8 (Bowmaker & Dartnall, 1980; Dartnall et al., 1983;
Roorda & Willians, 1988). Psychophysical studies suggested L/M ratios from 1.5 to
2.4 (Otake & Cicerone, 2000; Pokorny & Smith, 1987; Cicerone & Nerger, 1989;
Nerger & Cicerone, 1992), and electrophysiology techniques gave estimated L/M
ratios from 0.4 to 13 (Brainard et al., 2000; Usui et al., 1998; Carroll et al., 2000;
Carroll et al., 2002; Kremers et al., 1999; Langrova et al., 2007; Albrecht et al., 2002;
Hood et al., 2002).
There is little knowledge about L/M cone ratios in myopia and emmetropia. Only
three papers regarding L and M cone ratio mentioned the refraction status of
participants (Cicerone & Nerger, 1989; Nerger & Cicerone, 1992; Otake & Cicerone,
2000) (Table 1.4). From the first paper, the L/M ratios of one emmetrope and one
myope were 1.6 and 2.0. From the second paper, the L/M ratios of four emmetropes
were 2.1, 2.0, 1.5, 2.4, respectively; the L/M ratios of two mild myopes were 2.3 and
2.0. From the third paper, the L/M ratio of one emmetrope was 1.8; the L/M ratios of
two mild myopes were 2.2 and 1.5. These three studies showed similar L/M cone
ratios between myopia and emmetropia, however the sample sizes are small.
The present study investigated the L/M cone ratios in the central retina between
myopic and emmetropic normal trichromats using mfVEP. Although it is suggested
that the L/M ratios may be an important determinant of myopia progression (Rucker
& Kruger, 2006), the fact that individuals with red-green colour vision deficiency are
not all myopic (Qian et al., 2009), leads to the prediction that the L/M cone ratio will

Cone Ratios in Myopia and Emmetropia
54
vary in individuals but not show a regular difference simply due to refractive error.
3.2 Participants Data were collected on 30 young, colour normal adults aged 22 to 33 years,
including 10 emmetropic (spherical equivalent +1.00D to -0.25D), 10 lower myopic
(spherical equivalent -1.00D to -3.00D) and 10 higher myopic (spherical equivalent
-3.50D to -7.25D) individuals. To establish the reliability of the two stimulus light
conditions for isolating only one type of cone, two protanopes and one deuteranope
were examined. The protanopes and deuteranope were all emmetropic and aged 24,
30 and 36, respectively. The three dichromatic participants had normal
ophthalmological findings with visual acuities of 6/6. The colour vision defect of
these participants was confirmed using the Nagel Anomaloscope. One protanope
showed unreliable responses for the black-white modulation and thus did not proceed
with the rest of the testing. Email was used for recruiting initial participants and also
a snowballing method was used to recruit later participants within the University
community.
All experiments were conducted with human research ethics approval in accordance
with the National Statement on Ethical Conduct in Human Research published by the
National Health and Medical Research Council of Australia. Informed written
consent was obtained from all participants after the purpose and the procedures of
the study were explained. The QUT human research ethics approval number was
1100001318.
To determine suitability of potential participants, a screening eye examination was
conducted, including refraction (autorefractor), colour vision assessment (Ishihara)
and eye health assessment (slit lamp biomicrosopy and ophthalmoscopy). Corrected
visual acuity of 6/6 and normal trichromatic colour vision were required and were
tested by the researcher. Individuals with retinal pathology, abnormal ocular media,
strabismus, glaucoma and photosensitive epilepsy were not eligible to take part in
this study. Based on these criteria, one screened individual was excluded because of

Cone Ratios in Myopia and Emmetropia
55
amblyopia.
3.3 Procedure
3.3.1 The mfVEP visual stimuli
We used a CRT monitor with resolution of 1152*864 pixels to present the visual
stimuli and used the Visual Evoked Response Imaging System (VERIS 5.1,
Electro-Diagnostic Imaging Inc., San Mateo, CA, USA) to perform mfVEP
stimulation and data collection. Figure 3.1 shows the standard stimulus of the mfVEP.
The stimulus was a dartboard array consisting of 60 sectors and each sector was a
checkerboard pattern consisting of 16 checks. The stimuli were driven at a frame rate
of 75 Hz on the CRT monitor and subtended 30° horizontally and 30° vertically. The
sizes of the elements increased as they extended peripherally in order to give
approximately equal contrast response. Each of the elements was illuminated
following a pseudorandom m-sequence (215-1) to make the mean luminance of the
screen constant over time (Hood et al., 2002). The rod contribution to the mfVEP
was minimised by the bright rapid flicker and keeping the room lights on
(approximately 100 cd/m2).

Cone Ratios in Myopia and Emmetropia
56
FIGURE 3.1 The standard stimulus of the mfVEP in this study. The black and white elements
were alternated following the 215-1 m-sequence to stimulate the eye. This is a photographic
representation of the stimuli.
The method of silent substitution involves changing the output of three primary
lights, with psychically different spectral distributions, to alter the activity of one
cone class without changing the excitation of the unmodulated cone photoreceptor
classes. Each stimulus element was alternated between two lights selected to isolate
activity only in L-cone or only in M-cone. Figure 3.2 and 3.3 show the stimuli for the
L cone modulation and the M cone modulation applied in this study.
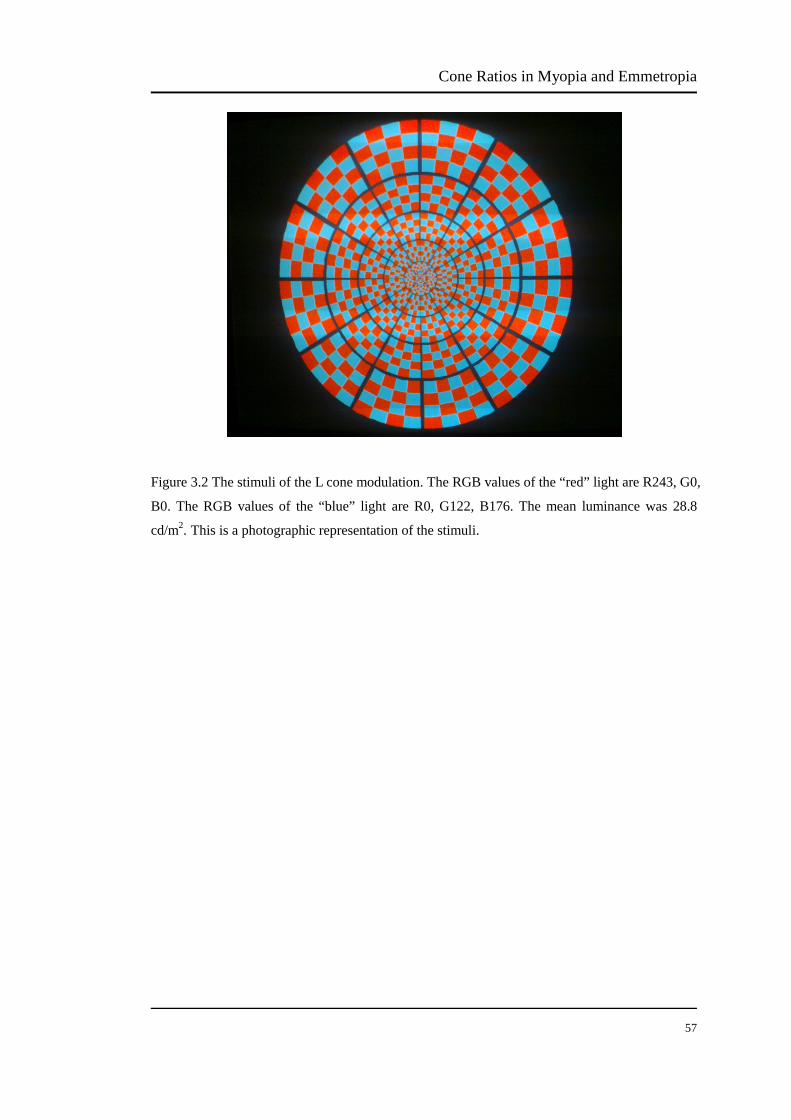
Cone Ratios in Myopia and Emmetropia
57
Figure 3.2 The stimuli of the L cone modulation. The RGB values of the “red” light are R243, G0,
B0. The RGB values of the “blue” light are R0, G122, B176. The mean luminance was 28.8
cd/m2. This is a photographic representation of the stimuli.
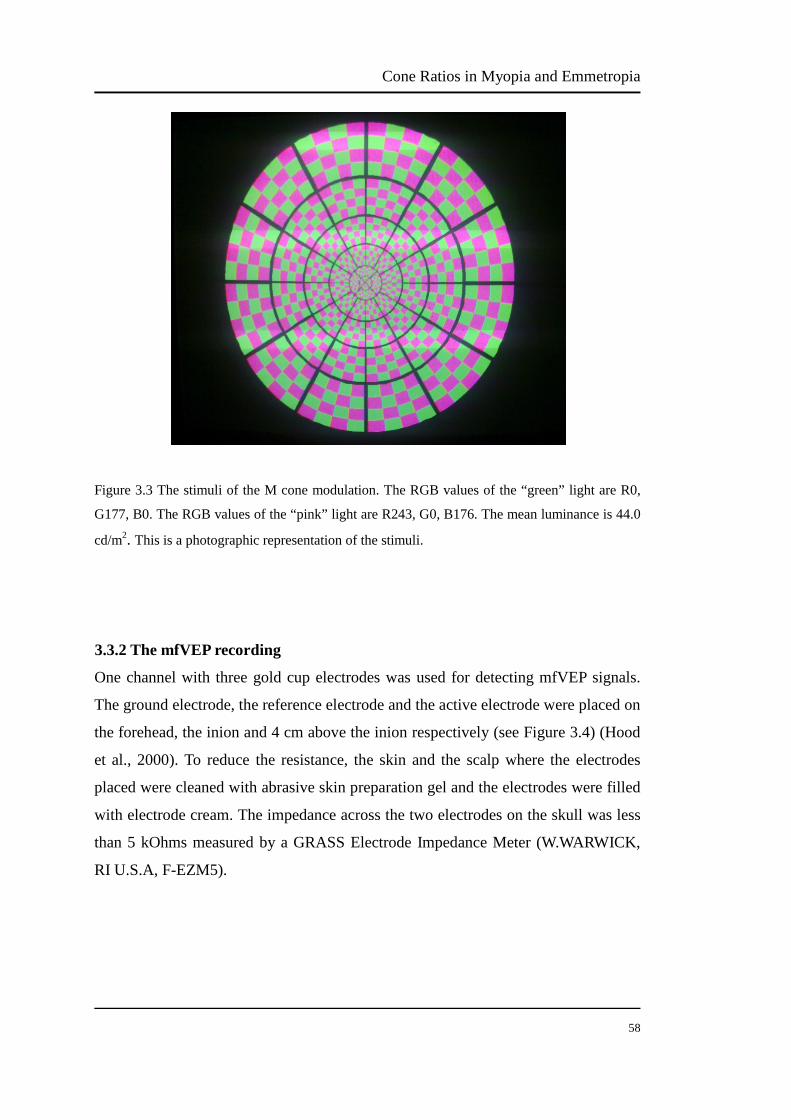
Cone Ratios in Myopia and Emmetropia
58
Figure 3.3 The stimuli of the M cone modulation. The RGB values of the “green” light are R0,
G177, B0. The RGB values of the “pink” light are R243, G0, B176. The mean luminance is 44.0
cd/m2. This is a photographic representation of the stimuli.
3.3.2 The mfVEP recording
One channel with three gold cup electrodes was used for detecting mfVEP signals.
The ground electrode, the reference electrode and the active electrode were placed on
the forehead, the inion and 4 cm above the inion respectively (see Figure 3.4) (Hood
et al., 2000). To reduce the resistance, the skin and the scalp where the electrodes
placed were cleaned with abrasive skin preparation gel and the electrodes were filled
with electrode cream. The impedance across the two electrodes on the skull was less
than 5 kOhms measured by a GRASS Electrode Impedance Meter (W.WARWICK,
RI U.S.A, F-EZM5).

Cone Ratios in Myopia and Emmetropia
59
FIGURE 3.4 The placement of the electrodes in this study. In the left picture, the upper electrode
is active electrode which is placed 4cm above the inion and the lower electrode is reference
electrode which is placed on the inion. In the right picture, the ground electrode is placed on the
forehead.
After 15 minutes adaptation to the room illumination, participants were asked to sit
37 cm in front of the monitor. Fixation of a black cross in the centre of the stimulus
display was used for participants. All the participants had natural undilated pupils
(average diameter 5mm) and their left eyes were occluded (see Figure 3.5). The
participants were provided with spherical as well as cylindrical correction by means
of the patients’ eye glasses. During the experiments, the signal level was checked via
the Apple Mac control computer.
ACTIVE ELECTRODE
REFERENCE ELECTRODE
GROUND ELECTRODE
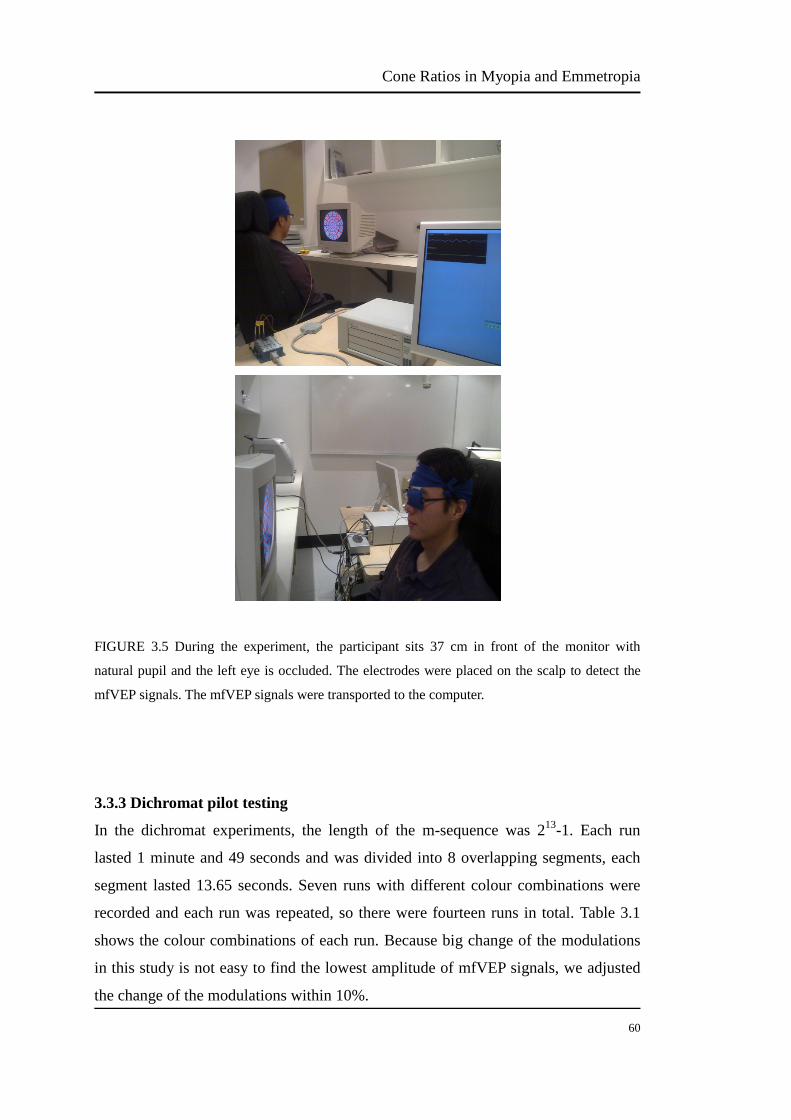
Cone Ratios in Myopia and Emmetropia
60
FIGURE 3.5 During the experiment, the participant sits 37 cm in front of the monitor with
natural pupil and the left eye is occluded. The electrodes were placed on the scalp to detect the
mfVEP signals. The mfVEP signals were transported to the computer.
3.3.3 Dichromat pilot testing
In the dichromat experiments, the length of the m-sequence was 213-1. Each run
lasted 1 minute and 49 seconds and was divided into 8 overlapping segments, each
segment lasted 13.65 seconds. Seven runs with different colour combinations were
recorded and each run was repeated, so there were fourteen runs in total. Table 3.1
shows the colour combinations of each run. Because big change of the modulations
in this study is not easy to find the lowest amplitude of mfVEP signals, we adjusted
the change of the modulations within 10%.
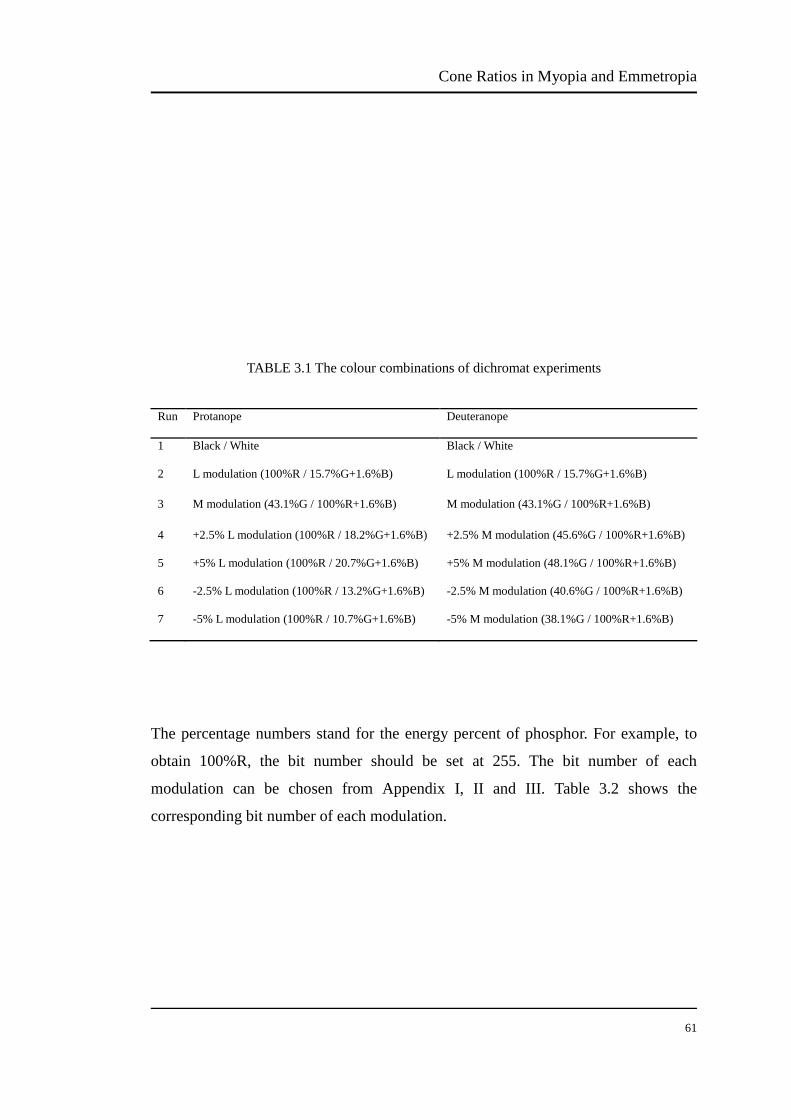
Cone Ratios in Myopia and Emmetropia
61
TABLE 3.1 The colour combinations of dichromat experiments
Run Protanope Deuteranope
1 Black / White Black / White
2 L modulation (100%R / 15.7%G+1.6%B) L modulation (100%R / 15.7%G+1.6%B)
3 M modulation (43.1%G / 100%R+1.6%B) M modulation (43.1%G / 100%R+1.6%B)
4 +2.5% L modulation (100%R / 18.2%G+1.6%B) +2.5% M modulation (45.6%G / 100%R+1.6%B)
5 +5% L modulation (100%R / 20.7%G+1.6%B) +5% M modulation (48.1%G / 100%R+1.6%B)
6 -2.5% L modulation (100%R / 13.2%G+1.6%B) -2.5% M modulation (40.6%G / 100%R+1.6%B)
7 -5% L modulation (100%R / 10.7%G+1.6%B) -5% M modulation (38.1%G / 100%R+1.6%B)
The percentage numbers stand for the energy percent of phosphor. For example, to
obtain 100%R, the bit number should be set at 255. The bit number of each
modulation can be chosen from Appendix I, II and III. Table 3.2 shows the
corresponding bit number of each modulation.
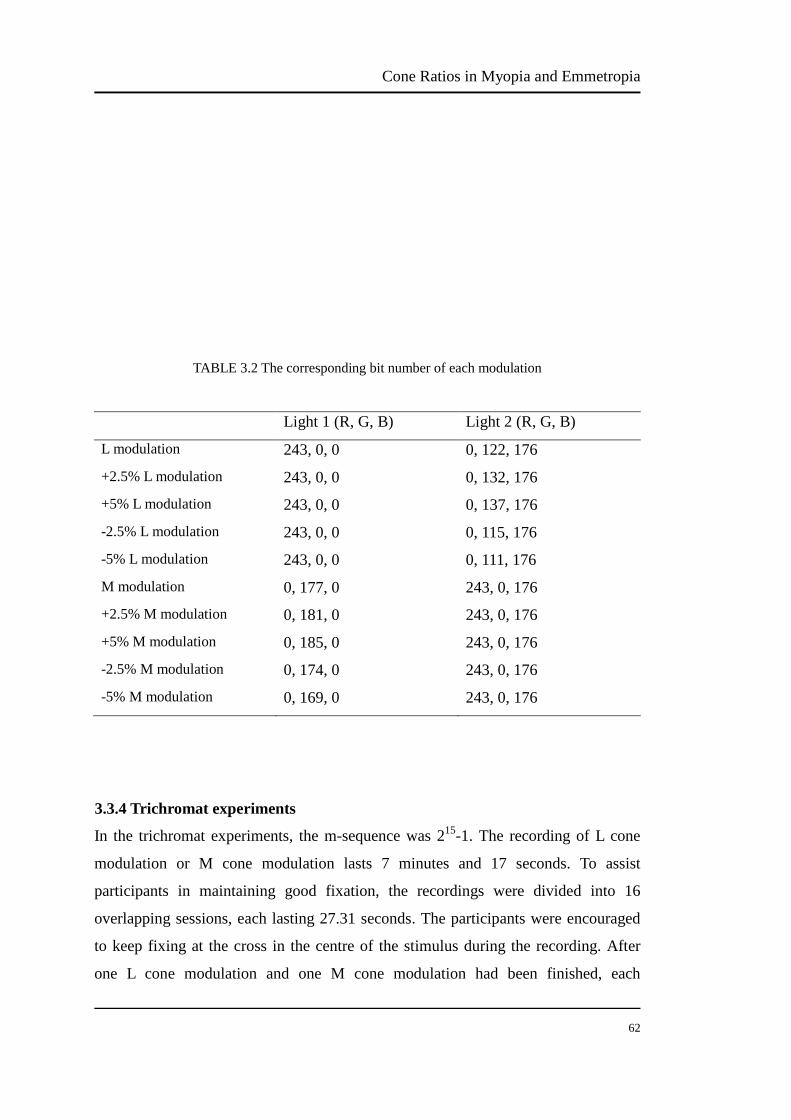
Cone Ratios in Myopia and Emmetropia
62
TABLE 3.2 The corresponding bit number of each modulation
Light 1 (R, G, B) Light 2 (R, G, B)
L modulation 243, 0, 0 0, 122, 176
+2.5% L modulation 243, 0, 0 0, 132, 176 +5% L modulation 243, 0, 0 0, 137, 176
-2.5% L modulation 243, 0, 0 0, 115, 176 -5% L modulation 243, 0, 0 0, 111, 176
M modulation 0, 177, 0 243, 0, 176 +2.5% M modulation 0, 181, 0 243, 0, 176
+5% M modulation 0, 185, 0 243, 0, 176 -2.5% M modulation 0, 174, 0 243, 0, 176
-5% M modulation 0, 169, 0 243, 0, 176
3.3.4 Trichromat experiments
In the trichromat experiments, the m-sequence was 215-1. The recording of L cone
modulation or M cone modulation lasts 7 minutes and 17 seconds. To assist
participants in maintaining good fixation, the recordings were divided into 16
overlapping sessions, each lasting 27.31 seconds. The participants were encouraged
to keep fixing at the cross in the centre of the stimulus during the recording. After
one L cone modulation and one M cone modulation had been finished, each

Cone Ratios in Myopia and Emmetropia
63
modulation was repeated one more time, so there are two runs of the L cone
modulation and two runs of the M cone modulation.
3.3.5 Exporting mfVEP data
To increase the signal to noise ratio, the mfVEP outputs were grouped and averaged
(Hood et al., 2000). The data of mfVEP signals of each participant were exported
into 16 groups via a USB to Excel spreadsheets (Figure 3.6). The first slice of the
second-order kernel was extracted. In an excel spreadsheet, the mfVEP signals were
summed and averaged to one curve for each participant. For example, each
trichromat has four mfVEP recordings: L modulation I, L modulation II, M
modulation I and M modulation II. To get the mfVEP signals within 3°-13° of L
cones, averaged the groups of 3, 4, 5, 11, 12, 13 of L modulation I and L modulation
II, respectively, and then averaged the summed L modulation I and L modulation II
to one plot. Similarly, averaged the groups of 6, 7, 8, 14, 15, 16 to obtain mfVEP
signals within 13°-30° of L cones. A similar process was done for mfVEP signals of
M cones within 3°-13° and 13°-30°.
13°
30°
3°

Cone Ratios in Myopia and Emmetropia
64
FIGURE 3.6 The 16 groups of the mfVEP signals exported from mfVEP. The corresponding 3°
retina includes groups 1, 2, 9 and 10. The corresponding 3°- 13° retina includes groups 3-5 and
11-13. The corresponding 13°- 30° retina includes groups 6-8 and 14-16.
3.4 Results
3.4.1 The mfVEP responses of dichromats
Dichromats have only two types of functional cones. Protanopes have M and S cones
and deuteranopes have L and S cones. The L modulation signal should produce the
lowest amplitude of mfVEP response in the protanopes (Figure 3.7, 3.8 and 3.9),
whereas the M modulation signal should be least for the deuteranopes (Figure 3.10,
3.11 and 3.12).
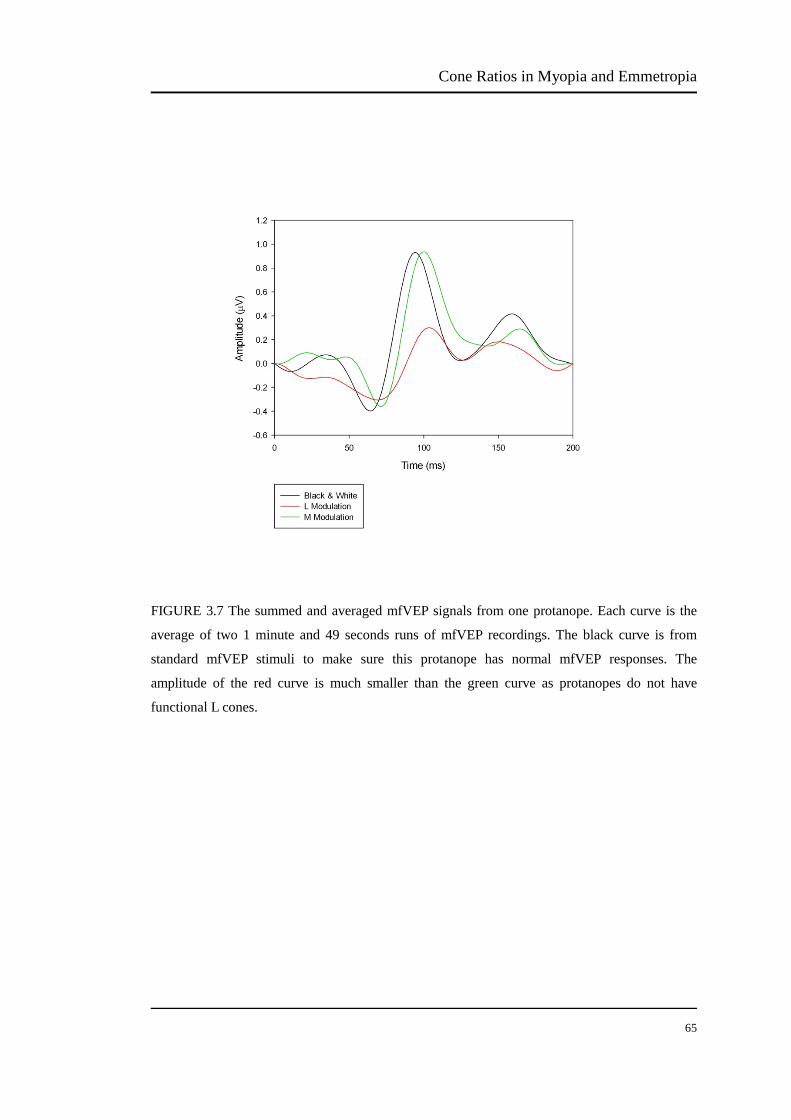
Cone Ratios in Myopia and Emmetropia
65
FIGURE 3.7 The summed and averaged mfVEP signals from one protanope. Each curve is the
average of two 1 minute and 49 seconds runs of mfVEP recordings. The black curve is from
standard mfVEP stimuli to make sure this protanope has normal mfVEP responses. The
amplitude of the red curve is much smaller than the green curve as protanopes do not have
functional L cones.

Cone Ratios in Myopia and Emmetropia
66
FIGURE 3.8 The summed and averaged mfVEP signals from one protanope. Each curve is the
average of two 1 minute and 49 seconds runs of mfVEP recordings. To test if the set of L
modulation gives the minimum mfVEP signal from a protanope, we adjusted the set of L
modulation and compared the amplitude of each set. All the curves are less than the M
modulation in Figure 3.7, because the stimuli used to generate these curves do not fully excite M
cones.

Cone Ratios in Myopia and Emmetropia
67
FIGURE 3.9 The amplitude of adjusted modulations from one protanope. The amplitude of
black/white, M modulation, L modulation, +2.5% L modulation, +5% L modulation, -2.5% L
modulation and -5% L modulation are 1.33E-6 V, 1.30E-6 V, 6.05E-7 V, 9.02E-7 V, 1.03E-6 V,
1.22E-6 V, 8.33E-7 V respectively. The smallest amplitude is the protanope mfVEP signal to the
L modulation.
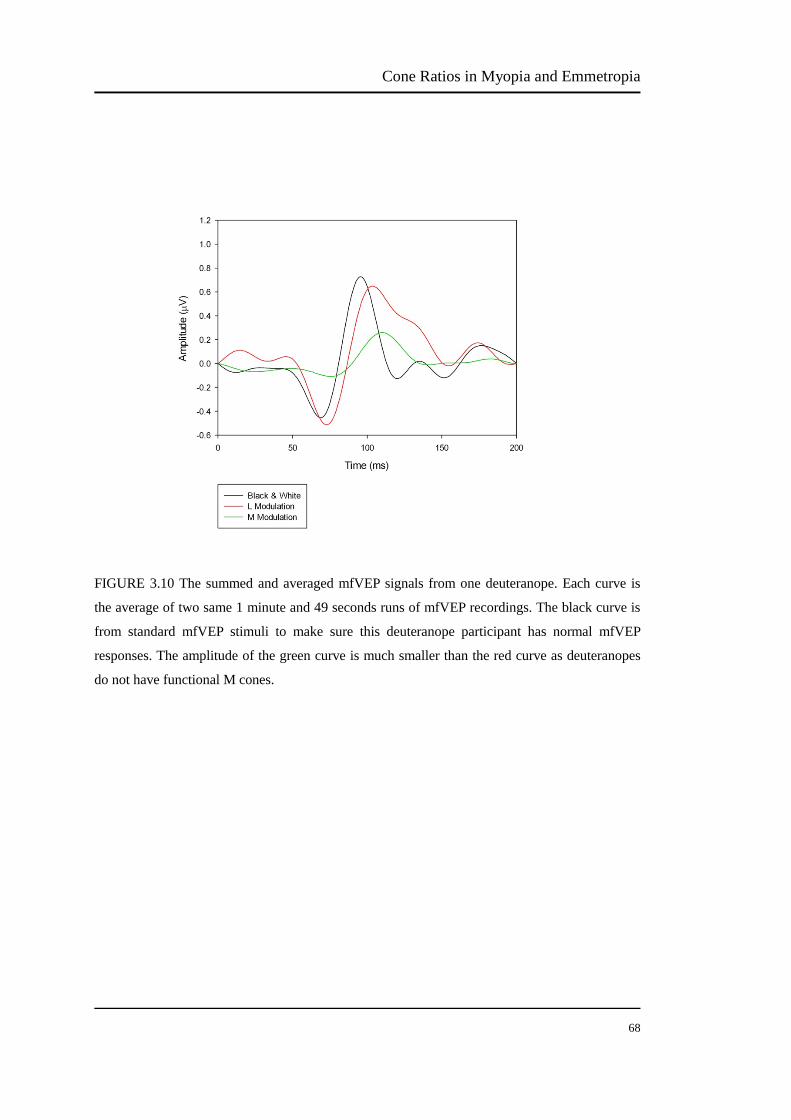
Cone Ratios in Myopia and Emmetropia
68
FIGURE 3.10 The summed and averaged mfVEP signals from one deuteranope. Each curve is
the average of two same 1 minute and 49 seconds runs of mfVEP recordings. The black curve is
from standard mfVEP stimuli to make sure this deuteranope participant has normal mfVEP
responses. The amplitude of the green curve is much smaller than the red curve as deuteranopes
do not have functional M cones.

Cone Ratios in Myopia and Emmetropia
69
FIGURE 3.11 The summed and averaged mfVEP signals from one deuteranope. Each curve is
the average of two 1 minute and 49 seconds runs of mfVEP recordings. To prove the set of M
modulation gives the minimum mfVEP signal from a deuteranope, we adjusted the set of M
modulation and compared the amplitude of each set. All the curves are less than the L modulation
in Figure 3.10, because the stimuli used to generate these curves do not fully excited L cones.

Cone Ratios in Myopia and Emmetropia
70
FIGURE 3.12 The amplitude of adjusted modulations from one deuteranope. The amplitude of
black/white, L modulation, M modulation, +2.5% M modulation, +5% M modulation, -2.5% M
modulation and -5% M modulation are 1.18E-6 V, 1.16E-6 V, 3.68E-7 V, 4.87E-7 V, 5.57E-7 V,
5.47E-7 V, 5.57E-7 V respectively. The smallest amplitude is the deuteranope mfVEP signal to
the M modulation.
Theoretically, as protanopes do not have functional L cones, the mfVEP signal of L
modulation should be zero and as deuteranopes do not have functional M cones, the
mfVEP signal of M modulation should be zero. However, the result of the protanope
shows a small mfVEP signal under L modulation in Figure 3.7 and the result of
deuteranope shows a small mfVEP signal under M modulation in Figure 3.10. The
same cone isolating methodology has been used in both mfERG and mfVEP
experiments (Albrecht et al., 2002; Hood et al., 2002). The mfERG study obtained
zero signals of L cone modulation for protanopes and zero signals of M cone
modulation for deuteranopes, however the mfVEP study did not obtain zero signals
using the same cone isolation stimuli. It is not known why a small rather than zero
signals may have been measured, but it is thought that the dartboard visual stimulus
Cone Ratios in Myopia and Emmetropia
71
of the mfVEP is more complex than the hexagonal visual stimulus array of the
mfERG and the smaller stimulus areas of the dartboard array might introduce some
other signals.
Another possibility is that the post-receptoral pathways exchange information
between each other. The electrical signal travelling through a nerve due to M cone
activation in a protanope, for instance, might induce a signal in a neighbouring
pathway originally associated with L cones. Therefore, detecting the stimulation at
the retinal level will yield a zero signal while detecting the signal at a later stage will
show a weak signal for the L cone, around the same time of the M cone signal, but
with a much lower amplitude. The phenomenon described above is referred to as
“nerve cross talk”, and was reported earlier by Gardner et al (Gardner, 1966). This is
one possible explanation for the non-zero signal detected by the mfVEP without L
cone stimulation. Moreover, there might be small contribution from the S cones and
rods (see section 4.5).
Figure 3.9 and 3.12 compared the amplitudes of adjusted L modulations and M
modulations. In the results of the protanope participant, the black/white stimulus has
the highest amplitude and then the M modulation. The lowest amplitude is the L
modulation, but the other four adjusted L modulations did not give an expected
amplitude order. For example, the amplitudes of -5% L modulation should be higher
than the -2.5% L modulation, however the results are opposite. The results of the
deuteranope participant revealed a similar problem. The unexpected relationship of
the amplitudes between the adjusted modulations might because of “nerve cross talk”.
The visual pathway system is a very complex system. Visual nerves influence
between each other (Gardner, 1966). Another reason could be that the participants
fixated to the stimuli differently. The mfVEP responses are sensitive to the change of
gaze position of the participants (Menz & Sutter, 2004).
Cone Ratios in Myopia and Emmetropia
72
3.4.2 The mfVEP responses of all the trichromats
The mfVEP responses of the central 3°-13° retina (Figure 3.13) and peripheral 13°-30°
retinal ring (Figure 3.14) of all trichromat participants were summed and averaged.
The data of foveal 3° retina were excluded because there is a gain adjustment in the
neural pathway in the foveal retina, resulting the L/M cone ratio to 1 (Hood et al.,
2002). Because of poor mfVEP signals (no typical N1-P1 amplitudes), the 3°-13°
data of participants SS, SV, NC and RJY and the 13°-30° data of participants SS, MC,
NC and IF were excluded (indicated by circles around the mfVEP data shown in
Figure 3.13 and 3.14).
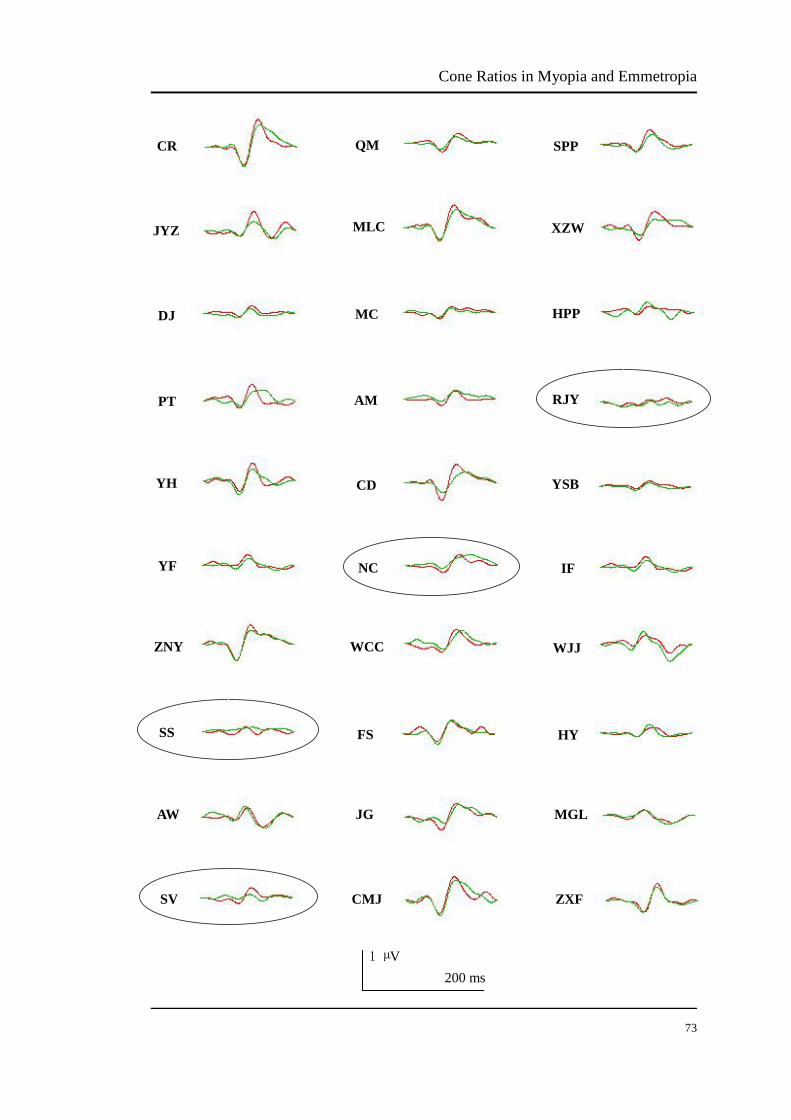
Cone Ratios in Myopia and Emmetropia
73
CR
JYZ
DJ
PT
YH
YF
ZNY
SS
AW
SV
QM
MLC
MC
AM
CD
NC
WCC
FS
JG
CMJ
SPP
XZW
HPP
RJY
YSB
IF
WJJ
HY
MGL
ZXF
200 ms 1 µV

Cone Ratios in Myopia and Emmetropia
74
FIGURE 3.13 The summed and averaged mfVEP signals in the central 3°-13° retina of all
trichromat participants. The red curve is the average of two same L modulations and the green
curve is the average of two same M modulations. The ellipses represent poor mfVEP responses
that were deleted. Data of participants SS, SV, NC and RJY were excluded.

Cone Ratios in Myopia and Emmetropia
75
CR
JYZ
DJ
PT
YH
YF
ZNY
SS
AW
SV
QM
MLC
MC
AM
CD
NC
WCC
FS
JG
CMJ
SPP
XZW
HPP
RJY
YSB
IF
WJJ
HY
MGL
ZXF
200 ms 1 µV

Cone Ratios in Myopia and Emmetropia
76
FIGURE 3.14 The summed and averaged mfVEP signals in the 13°-30° retina of all trichromat
participants. The red curve is the average of two same L modulations and the green curve is the
average of two same M modulations. The ellipses represent poor mfVEP responses that were
deleted. Data of participants SS, MC, NC and IF were excluded.
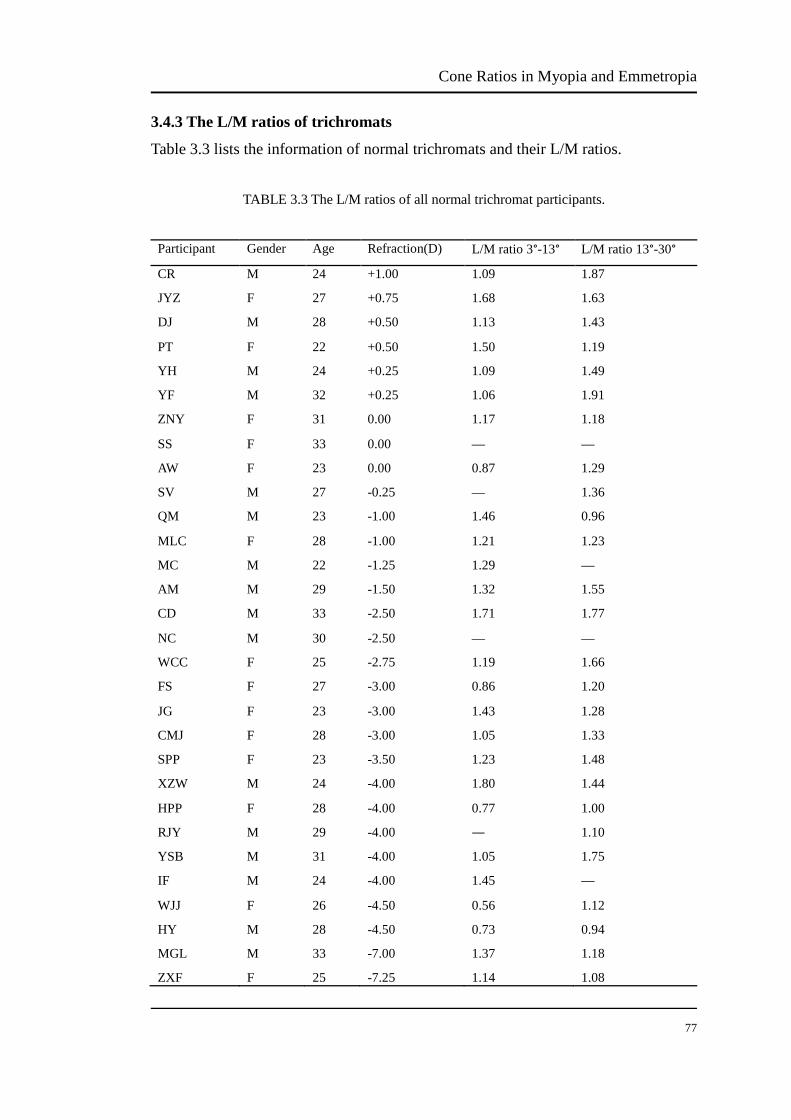
Cone Ratios in Myopia and Emmetropia
77
3.4.3 The L/M ratios of trichromats
Table 3.3 lists the information of normal trichromats and their L/M ratios.
TABLE 3.3 The L/M ratios of all normal trichromat participants.
Participant Gender Age Refraction(D) L/M ratio 3°-13° L/M ratio 13°-30°
CR M 24 +1.00 1.09 1.87
JYZ F 27 +0.75 1.68 1.63
DJ M 28 +0.50 1.13 1.43
PT F 22 +0.50 1.50 1.19
YH M 24 +0.25 1.09 1.49
YF M 32 +0.25 1.06 1.91
ZNY F 31 0.00 1.17 1.18
SS F 33 0.00 — —
AW F 23 0.00 0.87 1.29
SV M 27 -0.25 — 1.36
QM M 23 -1.00 1.46 0.96
MLC F 28 -1.00 1.21 1.23
MC M 22 -1.25 1.29 —
AM M 29 -1.50 1.32 1.55
CD M 33 -2.50 1.71 1.77
NC M 30 -2.50 — —
WCC F 25 -2.75 1.19 1.66
FS F 27 -3.00 0.86 1.20
JG F 23 -3.00 1.43 1.28
CMJ F 28 -3.00 1.05 1.33
SPP F 23 -3.50 1.23 1.48
XZW M 24 -4.00 1.80 1.44
HPP F 28 -4.00 0.77 1.00
RJY M 29 -4.00 ― 1.10
YSB M 31 -4.00 1.05 1.75
IF M 24 -4.00 1.45 —
WJJ F 26 -4.50 0.56 1.12
HY M 28 -4.50 0.73 0.94
MGL M 33 -7.00 1.37 1.18
ZXF F 25 -7.25 1.14 1.08

Cone Ratios in Myopia and Emmetropia
78
3.4.4 Data analysis between emmetropic, low myopic and high myopic groups
The One-way ANOVA analysis was conducted. When applying one-way analysis of
variance, three following assumptions should be satisfied: i) the populations from
which the samples were obtained should be normally or approximately normally
distributed; ii) the samples must be independent; iii) the variances of the population
must be equal. In this study, we recruited 30 participants and tested their own
LWS/MWS ratios, so the observations in this study were independent. The results of
the homogeneity of variances test revealed that there were no significant differences,
and the results showed that the normal distribution of population from which the
samples were recruited was not violated.
Within the central 3°-13° of retina, the L/M cone ratios of the emmetropic, low
myopic and high myopic groups were 1.20 ± 0.26, 1.28 ± 0.25 and 1.12 ± 0.39,
respectively. There were no significant differences in the value of L/M cone ratio
amongst the three groups (p=0.565).
Within the 13°-30° retinal ring, the L/M cone ratios of the emmetropic, low myopic
and high myopic groups were 1.49 ± 0.27, 1.37 ± 0.27 and 1.23 ± 0.27, respectively.
There were no significant differences in the value of L/M cone ratio amongst the
three groups (p=0.161).
3.4.5 Data analysis between emmetropic and myopic groups
All myopes were being grouped together and the independent-samples t-test analysis
was conducted. Three assumptions should be met for conducting the
independent-samples t-test: i) the populations from which the samples were obtained
should be normally or approximately normally distributed; ii) the samples must be
independent; iii) the variances of the population must be equal. This study tested the
participants’ own L/M ratio, so the observations in this study were independent, and
the homogeneity of variances test showed that here were no significant differences
and the normal distribution of population from which the samples were recruited was
not violated.

Cone Ratios in Myopia and Emmetropia
79
Within the central 3°-13° of retina, the L/M cone ratios of the emmetropic and
myopic group were 1.20 ± 0.26 and 1.20 ± 0.33, respectively. The L/M ratios of the
two groups were not different in the central ring (p=0.986).
Within the 13°-30° retinal ring, the L/M cone ratios of the emmetropic and myopic
group were 1.48 ± 0.27 and 1.30 ± 0.27, respectively. The L/M ratios of the two
groups were not different in the mid-peripheral ring (p=0.108).
3.4.6 Data analysis between central and peripheral retina
Paired-samples t-test was conducted between central 3°-13° and peripheral 13°-30°
of L/M cone ratios in 24 trichromat participants (SS, SV, NC, RJY, MC and IF were
excluded). There was significant statistic difference of L/M cone ratios between the
central and peripheral retina (p=0.017). The L/M cone ratios of the central retina
were 1.19±0.31. The L/M cone ratios of the peripheral retina were 1.37±0.29.
3.4.7 Post hoc effect size analysis
Although there was no statistical difference in the L/M ratios between myopes and
emmetropes, there was a trend toward significance for the most peripheral retinal
ring tested. Thus a post hoc power analysis was conducted on the peripheral data to
predict effect size for L/M ratio studies using mfVEP.
For one-way ANOVA, according to the data in the peripheral ring of current study,
the power value was 0.38 using GPower (3.1.5) software, and in order to get a power
value of 0.8, 66 participants in total are required.
For unpaired t-tests, according to the data in the peripheral ring of current study, the
power value was 0.34 using GPower (3.1.5) software, and in order to get a power
value of 0.8, 82 participants in total are required.

Discussion
79
CHAPTER 4
Discussion The present study estimated the L/M cone ratios of the central and mid-peripheral
retina using the mfVEP in 30 participants with normal colour vision. Statistical
analysis indicated that there were no significant differences in the L/M cone ratio
between the emmetropic, lower myopic and higher myopic groups for both the
central 3°-13° retina (p=0.565) and 13°-30° ring (p=0.161). There were also no
significant differences in L/M cone ratios between the emmetropic group and the
pooled data of all myopes, i.e to form one myopic group. The L/M cone ratios in
normal trichromat participants, comparisons between myopes and emmetropes, as
well as the reliability of the cone isolation stimuli and the limitations of the L/M
cone ratio estimates will be discussed.
4.1 Cone ratios in trichromats
In all normal trichromatic participants, the total L/M ratio ranged from 0.56 to 1.80
within the central 3°-13° and from 0.94 to 1.91 within the 13°-30° ring. A previous
study used mfVEP to estimate the L/M ratios in 6 colour normal trichromats (Hood
et al., 2002); the L/M ratio ranged from 1.1 to 1.7 within the central ring and 5.8° to
22.2° mid-peripheral ring. The range of L/M ratios reported here are thus similar to
the range reported in that paper; particularly given the small differences in visual
field area and the larger sample size (n=30) in this study.
Some of the factors that may impact on mfVEP responses have been investigated,
with Winn et al. (2005) concluding that mfVEP responses are affected by simulated
refractive errors, cataracts and fixations errors; these were not issues for the young,

Discussion
80
spectacle corrected participants of this study. The poor mfVEP responses were from
those participants who easily go to sleep during the experiments and were excluded
from the data. The test re-test reliability of the mfVEP is stated to be good, with an
r=0.85 for amplitude measures made on two separate days (Chen et al., 2003). Here
the agreement between the two test runs was r=0.95 for the L modulation and r=0.95
for the M modulation.
Other techniques have also been used to estimate L/M cone ratios. L/M cone ratios
determined using gene expression range from 1.3 to 4.9 in the central 40° of retina.
Direct imaging from the foveal retina gave L/M ratios ranging from 1.15 to 3.79.
Several psychophysical studies have been carried out and reported L/M ratios range
from 1.1 to 3.4 in the central 28° of retina. Electrophysiology has been widely used
to estimate L/M ratios, which range from 0.4 to 13 across the 124° of the retina; the
extreme values were rare, eighty percent of the L/M ratios were within the range of
1.0-4.0. These studies report a larger range of L/M cone ratios than our study, and
this probably reflects the difference in measured retinal areas and the principals of
the technique employed. For example, electrophysiological study which can measure
retinal area up to 124° gives L/M cone ratio from 0.4 to 13.
4.2 Myopes vs emmetropes
There was no statistical difference between the L/M ratio of the emmetropic and
myopic groups. Given the fact that not all protanopes are emmetropic and not all
deuteranopes are myopic, we predicted the L/M cone ratio was not a crucial factor in
the development of myopia. The finding of no difference of L/M cone ratios between
myopic and emmetropic groups is consistent with this prediction.
Some studies have suggested the L and M cone activities are related to myopic
refractive error. One small study has been carried out to determine the effect on
myopia progression of balancing the L and M cone activities in children (Neitz &
Neitz, 2011). This study indicated special eye glasses which equalize the L and M
cone activities reduced myopia progression to 10 times slower than that observed

Discussion
81
with normal eyeglasses. Another study has demonstrated that myopes are more
sensitive to the long-wavelength component (Rucker & Kruger, 2006). They
explained this may be due to a shift in cone pigment sensitivity towards
long-wavelength in myopia or relatively more L cones number than M cones in
myopia.
If the higher sensitivity of L cones related to myopia, it could be assumed that
protanopes without any L cones should not develop myopia. In contrast,
deuteranopes without any M cones should be myopic. One paper investigated the
prevalence of myopia in 309 red-green colour deficiency students (Qian et al., 2009).
They found that 43.7% protanopes and 47.3% deuteranopes are myopic, i.e the
prevalence of myopia was the same. This finding seems to challenge the above
assumption. While in the colour normal 927 students, myopia was present in 65.8%.
The difference of the prevalence in colour deficiency and colour normal group was
significant (random-effects logistic test: p<0.001). Therefore, the result that
red-green colour deficiency group had a lower prevalence of myopia cannot be
simply explained by L/M cone ratios. The L and M chromatic opponent has reduced
function in the red-green colour deficiency group, but the S chromatic opponent has
not been significantly affected.
In the 13°-30° diameter ring, the trend was for the L/M cone ratio to be lower in the
myopes; this is opposite to the predicted direction of the difference of a greater L/M
cone ratio in myopia. A post hoc power analysis of the peripheral ring data suggests
that with a power of 0.8, 27 participants in each group would be required to detect a
significantly lower cone ratio in myopes than in emmetropes in the peripheral ring. A
difference in this direction (i.e. lower L/M ratio in myopia), while not related to
myopia development per se, may occur as a consequence of myopia. Alternately a
recent study suggests that myopes may have lower L/M cone ratios; although this
was based on data of only 6 participants (Yamauchi et al., 2013). The lower L/M
ratio in myopes in Yamauchi’s study was consistent with the results in our study.
The peripheral eye shape could be considered as a reason that influences myopia
Discussion
82
development in the colour deficiency students. Most of the cones only take over a
small area of the fovea retina. The much bigger peripheral area of the retina may play
an important role in myopic progression. It has been reported that emmetropes and
myopes have different pattern of peripheral refractive errors (Charman, 2005; Mutti
et al., 2007; Seidemann et al., 2002; Stone & Flitcroft, 2004).
4.3 Central retina vs peripheral retina
There was a significant difference between the L/M cone ratio for the central 3°-13°
and peripheral 13°-30° rings. The L/M cone ratios of the central retina were lower
than that of the peripheral retina. This result is consistent with other L/M cone ratio
studies using different methods. In the mRNA analysis, the L/M cone ratios of the 20°
and 40° retina were 1.5 and 3.0 respectively (Hagstrom et al., 1998). The multifocal
pattern electroretinogram technique estimates of the L/M cone ratios for the 8° and
12.8°-26° retina areas were 1.00-2.78 and 1.29-2.78 respectively (Langrová et al.,
2007). The mfERG measurement suggested the L/M cone ratios were 1.4 for the
central 5° retina and 2.3 of the 40° retina (Albrecht et al., 2002).
This difference in estimated L/M ratio across the retina suggest the number of L
cones increases with retina excentricity or the number of M cones decreases with
retina excentricity. Direct images of trichromatic cone mosaic in human can address
this question. However, studies with this technique only measured the cone mosaic in
the foveal retina (Roorda, & Williams, 1988).
4.4 Validity of the cone isolating stimuli
The Smith and Pokony 10° fundamentals were used to calculate L and M isolating
stimuli in this study. Other fundamentals are also available for the calculation, e.g.
Smith and Pokony 2° fundamentals. As this study investigated the L/M cone ratios
for 30° retina, we chose the fundamentals calculated for the larger retina area. In fact,
using different fundamentals is stated to give only minor changes in the calculated
parameters of cone isolation stimuli (Kremers et al., 1999). This study did not correct

Discussion
83
for individual differences in pre-receptoral filtering by the lens or macular pigment,
which will affect cone isolation. The effect of lens attenuation however, would be
small due to the younger age range of the sample (22-33 years old).
The luminance output of CRT monitors change with the temperature and the
luminance output remain stable after they have been turned on for at least 40
minutes (Metha et al., 1993). All the calibrations and experiments described in this
thesis were conducted after the monitor was allowed to warm up for 1 hour; this
avoided the influence of luminance changes on cone isolating stimuli.
The cone isolating stimuli were also tested on one protanope and one deuteranope.
To minimize any unwanted signals, the cone isolating settings were adjusted slightly,
and we chose the best parameters (see section 3.4.1).
4.5 Limitation of the mfVEP study of L/M cone ratios
It might be possible that there are some small S cone and rod signals. We used a
three primaries CRT to display the mfVEP stimuli, but to isolate one of the
photoreceptor classes, four primaries are required (Zele et al., 2012). In this study,
the L or M cone was isolated from other types of cones by the silent substitution
technique. The activity of the rods was minimised by prior light adaption and a fast
flickering stimuli. The 75 Hz frame rate of the CRT monitor and the mean luminance
of the L and M cone modulation were suggested not bright enough to separately
investigate L or M cone responses (Kremers et al., 2009; Zele & Vingrys, 2005). The
average pupil size was 5 mm during the mfVEP measurements. The retinal
illuminance of L modulation and M modulation were approximately 565.2 Td and
863.5 Td, respectively, during experiments. It has been suggested that if the retinal
illuminance is below 1000 Td (Zele et al., 2008), the rod signals might impact on the
results.
The PC and MC pathways are known to process information from both L and M
cones (Lee, 1996). In the foveal 1° retina, mfVEP responses mainly come from the PC

Discussion
84
pathway, because 95% of the ganglion cells in the fovea are midget ganglion cells
which subject to the PC pathway (Dacey, 1993). It is suggested that a gain
adjustment resulting 1:1 L/M ratio in the PC pathway has taken place after the
mfERG but before the mfVEP is generated in the central fovea (Hood et al., 2002).
Outside the foveal retina, mfVEP combine signals mainly from both PC and MC
pathways, because the midget ganglion cells projecting PC pathway make up around
45% and the parasol ganglion cells projecting MC pathway contribute 20% of the
total ganglion cells in the peripheral retina (Dacey & Petersen, 1992). In this study,
the MC pathway is already saturated at high contrast (Baseler & Sutter, 1997), so the
combination of PC and MC pathways in mfVEP response is not linear to the
numerosity of cones. Moreover, the positive and negative peaks of mfVEP signals
from the PC and MC pathways can cancel out each other (Baseler & Sutter, 1997).
According to the results of this study, the sample size might be not enough to detect
real L/M cone ratio differences in the peripheral retina of myopic and emmetropic
groups. Although both one-way ANOVA and independent-samples t-test analysis
indicated similar L/M cone ratios in the central retina, the variation of the L/M cone
ratios in the peripheral retina were greater between individuals. The P value of
one-way ANOVA and independent-samples t-test analysis in the peripheral retina
were 0.161 and 0.108. Power calculations suggest that increasing the total participant
numbers to 27 in each group would be required to prove whether the lack of
difference is due to insufficient power or is actually a real difference. In any case, the
effect size is likely to be very small if the effect were real.
The practical limitations of recording mfVEP are the placement of electrodes and the
fixation of participants during experiments. A proper and clean electrodes placement
can reduce the signal to noise ratio of the mfVEP responses. Before starting
measurements, the scalp-electrode impedances were checked and measurements only
proceeded when these were below 5 kOhms. This study used one channel electrodes
placement, it has been suggested that additional electrodes and channels can improve
the mfVEP signals and reduce the signal to noise ratio (Hood et al., 2002). The
fixation of participants during mfVEP tests was checked visually by the examiner.
Discussion
85
An objective method using a camera to monitor the fixation can more accurately
monitor fixation; minor changes of fixation can produce large variations of the
amplitude of mfVEP signals (Menz & Sutter, 2004).
4.6 Future directions
A relative large number of participants were tested in this study, compared to
previous research, using mfVEP to determine L/M ratios. No statistical difference
has been detected in this study; according to the post hoc power analysis, 27
participants were required of each group to find such differences. This study with 10
participants of each group provided basic data for the future L/M ratios studies using
mfVEP. In the future study, more participants will be recruited to meet the
requirement of powers of at least 0.8.
This study recruited about 70% Asian participants. It is known that the prevalence of
myopia of Asia countries is the highest over the world, so the high proportion of
Asian participants in this study could bias the results to this group. Recruiting
different ethnic groups with balanced number of participants could answer the
question whether the L/M cone ratio only impacts myopia for some racial groups.
However, the results from the mfVEP indicate that there are no significant individual
differences in cone ratios between persons with emmetropia or myopia and thus
differences in the suggested experiments unlikely. The future study can match one
Asian participant to one Western participant to balance the ethnic bias. Alternatively,
only one racial group can be considered. There has been a study suggesting that
myopes may have lower L/M cone ratios in Japanese, but it only had 6 participants
(Yamauchi et al., 2013).

Bibliography
86
BIBLIOGRAPHY
Albrecht, J., Jägle, H., Hood, D. C. & Sharpe, L. T. (2002). The multifocal electroretinogram (mfERG) and cone isolating stimuli: variation in L- and M-cone driven signals across the retina. Journal of Vision, 2(8), 543-558.
Ashby, R., Ohlendorf, A. & Schaeffel, F. (2009). The effect of ambient illuminance on the development of deprivation myopia in chicks. Investigative Ophthalmology and Visual Science, 50(11), 5348-5354.
Ashby, R. S. & Schaeffel, F. (2010). The effect of bright light on lens compensation in chicks. Investigative Ophthalmology and Visual Science, 51(10), 5247-5253.
Baseler, H.A., Sutter, E.E. (1997). M and P component of the VEP and their visual field distribution. Vision Research 37(6), 675-690.
Beresford, J. A., Crewther, S. G. & Crewther, D. P. (1998). Anatomical correlates of experimentally induced myopia. Australian and New Zealand Journal of Ophthalmology, 26, S84-S87.
Bhat, S. P., Rayner, S. A., Chau, S. C. & Ariyasu, R. G. (2004). Pax-6 expression in posthatch chick retina during and recovery from form-deprivation myopia. Developmental Neuroscience, 26(5-6), 328-335.
Bowmaker, J. & Dartnall, H. (1980). Visual pigments of rods and cones in a human retina. The Journal of Physiology, 298(1), 501-511.
Brainard, D. H., Roorda, A., Yamauchi, Y., Calderone, J. B., Metha, A., Neitz, M. et al. (2000). Functional consequences of the relative numbers of L and M cones. Journal of the Optical Society of America A, 17(3), 607-614.
Brainard, G. C. & Morgan, W. W. (1987). Light-induced stimulation of retinal dopamine: a dose-response relationship. Brain Research, 424(1), 199-203.
Cao, D., Pokorny, J., Smith, V. C. & Zele, A. J. (2008). Rod contributions to color perception: Linear with rod contrast. Vision Research, 48(26), 2586-2592.
Carroll, J., McMahon, C., Neitz, M. & Neitz, J. (2000). Flicker-photometric electroretinogram estimates of L: M cone photoreceptor ratio in men with photopigment spectra derived from genetics. Journal of the Optical Society of America A, 17(3), 499-509.
Carroll, J., Neitz, J. & Neitz, M. (2002). Estimates of L: M cone ratio from ERG flicker photometry and genetics. Journal of Vision, 2(8), 531-542.
Charman, W. (2005). Aberrations and myopia. Ophthalmic and Physiological Optics, 25(4), 285-301.
Chen, C. S., Hood, D. C., Zhang, X., Karam, E. Z., Liebmann, J. M., Ritch, R. et al. (2003). Repeat reliability of the multifocal visual evoked potential in normal and glaucomatous eyes. Journal of Glaucoma, 12(5), 399-408.
Chen, J. C., Brown, B. & Schmid, K. L. (2006). Delayed mfERG responses in myopia. Vision Research, 46(8-9), 1221-1229.
Chen, J. C., Brown, B. & Schmid, K. L. (2006). Evaluation of inner retinal function in myopia using
Bibliography
87
oscillatory potentials of the multifocal electroretinogram. Vision Research, 46(24), 4096-4103.
Chen, J. C., Schmid, K. L. & Brown, B. (2003). The autonomic control of accommodation and implications for human myopia development: a review. Ophthalmic and Physiological Optics, 23(5), 401-422.
Cicerone, C. M. & Nerger, J. L. (1989). The relative numbers of long-wavelength-sensitive to middle-wavelength-sensitive cones in the human fovea centralis. Vision Research, 29(1), 115-128.
Colombo, E. & Derrington, A. (2001). Visual calibration of CRT monitors. Displays, 22(3), 87-95.
Curcio, C. A., Sloan, K. R., Kalina, R. E. & Hendrickson, A. E. (2004). Human photoreceptor topography. The Journal of Comparative Neurology, 292(4), 497-523.
Dacey, D. M. (1993). The mosaic of midget ganglion cells in the human retina. The Journal of Neuroscience, 13(12), 5334-5355.
Dacey, D. M. & Petersen, M. R. (1992). Dendritic field size and morphology of midget and parasol ganglion cells of the human retina. Proceedings of the National Academy of Sciences, 89(20), 9666-9670.
Dartnall, H., Bowmaker, J. & Mollon, J. (1983). Human visual pigments: microspectrophotometric results from the eyes of seven persons. Proceedings of the Royal society of London. Series B. Biological Sciences, 220(1218), 115-130.
DeMarco, P., Pokorny J., Smith VC. (1992). Full-spectrum cone sensitivity functions for X-chromosome-linked anomalous trichromats. Journal of the Optical Society of America A, 9, 1465-1476.
Ellingson, R.J. (1966). Development of visual evoked responses in human infants recorded by a response averager. Electroenceph Clin Neurophysiol, 21, 403-404.
Diether, S. & Schaeffel, F. (1997). Local changes in eye growth induced by imposed local refractive error despite active accommodation. Vision Research, 37(6), 659.
Edwards, M., Leung, S. & Lee, W. (1996). Do variations in normal nutrition play a role in the development of myopia? Optometry and Vision Science, 73(10), 638-643.
Estévez, O. & Spekreijse, H. (1982). The “silent substitution” method in visual research. Vision Research, 22(6), 681-691.
Fan, D. S. P., Lam, D. S. C., Lam, R. F., Lau, J. T. F., Chong, K. S., Cheung, E. Y. Y. et al. (2004). Prevalence, incidence, and progression of myopia of school children in Hong Kong. Investigative Ophthalmology and Visual Science, 45(4), 1071-1075.
Fischer, A. J., McGuire, J. J., Schaeffel, F. & Stell, W. K. (1999). Light-and focus-dependent expression of the transcription factor ZENK in the chick retina. Nature Neuroscience, 2(8), 706-712.
Fitzgerald, M. E. C., Wildsoet, C. F. & Reiner, A. (2002). Temporal relationship of choroidal blood flow and thickness changes during recovery from form deprivation myopia in chicks. Experimental Eye Research, 74(5), 561-570.
Fleming, P. A., Harman, A. M. & Beazley, L. D. (1997). Changing topography of the RPE resulting from experimentally induced rapid eye growth. Visual Neuroscience, 14(03), 449-461.
Bibliography
88
Flitcroft, D. I. (1998). A model of the contribution of oculomotor and optical factors to emmetropization and myopia. Vision Research, 38(19), 2869-2879.
Fujikado, T., Hosohata, J. & Omoto, T. (1996). ERG of form deprivation myopia and drug induced ametropia in chicks. Current Eye Research, 15(1), 79-86.
Fujikado, T., Kawasaki, Y., Suzuki, A., Ohmi, G. & Tano, Y. (1997). Retinal function with lens-induced myopia compared with form-deprivation myopia in chicks. Graefe's Archive for Clinical and Experimental Ophthalmology, 235(5), 320-324.
Fulk, G. W., Cyert, L. A. & Parker, D. A. (2002). Seasonal variation in myopia progression and ocular elongation. Optometry and Vision Science, 79(1), 46-51.
Godley, B. F. & Wurtman, R. J. (1988). Release of endogenous dopamine from the superfused rabbit retina in vitro: effect of light stimulation. Brain Research, 452(1), 393-395.
Graham, B. & Judge, S. J. (1999). Normal development of refractive state and ocular component dimensions in the marmoset (Callithrix jacchus). Vision Research, 39(2), 177-187.
Hagstrom, S. A., Neitz, J. & Neitz, M. (1998). Variations in cone populations for red-green color vision examined by analysis of mRNA. Neuroreport, 9(9), 1963-1967.
Hagstrom, S. A., Neitz, M. & Neitz, J. (2000). Cone pigment gene expression in individual photoreceptors and the chromatic topography of the retina. Journal of the Optical Society of America A, 17(3), 527-537.
Halliday, A. M., McDonald, W. I., Mushin, J. (1972). Delayed visual evoked response in opticneuritis. Lancet, 1, 982-985.
Hammond, C. J., Andrew, T., Tat Mak, Y. & Spector, T. D. (2004). A susceptibility locus for myopia in the normal population is linked to the PAX6 gene region on chromosome 11: A genomewide scan of dizygotic twins. The American Journal of Human Genetics, 75(2), 294-304.
Hammond, C. J., Snieder, H., Gilbert, C. E. & Spector, T. D. (2001). Genes and environment in refractive error: the twin eye study. Investigative Ophthalmology and Visual Science, 42(6), 1232-1236.
Harman, A. M., Hoskins, R. & Beazley, L. (1999). Experimental eye enlargement in mature animals changes the retinal pigment epithelium. Visual Neuroscience, 16(4), 619-628.
Hood, D. C., Odel, J. G. & Winn, B. J. (2003). The multifocal visual evoked potential. Journal of Neuro-ophthalmology, 23(4), 279-289.
Hood, D. C., Odel, J. G. & Zhang, X. (2000). Tracking the recovery of local optic nerve function after optic neuritis: a multifocal VEP study. Investigative Ophthalmology and Visual Science, 41(12), 4032-4038.
Hood, D. C., Yu, A. L., Zhang, X., Albrecht, J., Jägle, H. & Sharpe, L. T. (2002). The multifocal visual evoked potential and cone-isolating stimuli: Implications for L-to M-cone ratios and normalization. Journal of Vision, 2(2), 178-189.
Hood, D. C., Zhang, X., Greenstein, V. C., Kangovi, S., Odel, J. G., Liebmann, J. M. & Ritch, R. (2000). An interocular comparison of the multifocal VEP: a possible technique for detecting local damage to the optic nerve. Investigative Ophthalmology and Visual Science, 41(6), 1580-1587.
Hood, D. C., Zhang, X. & Winn, B. J. (2003). Detecting glaucomatous damage with multifocal visual

Bibliography
89
evoked potentials: how can a monocular test work? Journal of Glaucoma, 12(1), 3-15.
Ip, J. M., Saw, S.-M., Rose, K. A., Morgan, I. G., Kifley, A., Wang, J. J. & Mitchell, P. (2008). Role of near work in myopia: findings in a sample of Australian school children. Investigative Ophthalmology and Visual Science, 49(7), 2903-2910.
Iuvone, P., Tigges, M., Stone, R., Lambert, S. & Laties, A. (1991). Effects of apomorphine, a dopamine receptor agonist, on ocular refraction and axial elongation in a primate model of myopia. Investigative Ophthalmology and Visual Science, 32(5), 1674-1677.
Iuvone, P. M., Tigges, M., Fernandes, A. & Tigges, J. (1989). Dopamine synthesis and metabolism in rhesus monkey retina: development, aging, and the effects of monocular visual deprivation. Visual Neuroscience, 2(5), 465-471.
Jacobsen, N., Jensen, H. & Goldschmidt, E. (2008). Does the level of physical activity in university students influence development and progression of myopia?—a 2-year prospective cohort study. Investigative Ophthalmology and Visual Science, 49(4), 1322-1327.
Jaworski, A., Gentle, A., Zele, A. J., Vingrys, A. J. & McBrien, N. A. (2006). Altered visual sensitivity in axial high myopia: A local postreceptoral phenomenon? [Article]. Investigative Ophthalmology and Visual Science, 47(8), 3695-3702.
Jones, L. A., Sinnott, L. T., Mutti, D. O., Mitchell, G. L., Moeschberger, M. L. & Zadnik, K. (2007). Parental history of myopia, sports and outdoor activities, and future myopia. Investigative Ophthalmology and Visual Science, 48(8), 3524-3532.
Kawabata, H. & Adachi-Usami, E. (1997). Multifocal electroretinogram in myopia. Investigative Ophthalmology and Visual Science, 38(13), 2844-2851.
Kremers, J., Czop, D. & Link, B. (2009). Rod and S-cone driven ERG signals at high retinal illuminances. Documenta Ophthalmologica, 118(3), 205-216.
Kremers, J., Scholl, H. P. N., Knau, H., Berendschot, T. T. J. M., Usui, T. & Sharpe, L. T. (2000). L/M cone ratios in human trichromats assessed by psychophysics, electroretinography, and retinal densitometry. Optical Society of America A, 17(3), 517-526.
Kremers, J., Usui, T., Scholl, H. & Sharpe, L. T. (1999). Cone signal contributions to electroretinograms [correction of electrograms] in dichromats and trichromats. Investigative Ophthalmology and Visual Science, 40(5), 920-930.
Kröger, R. H. H. & Binder, S. (2000). Use of paper selectively absorbing long wavelengths to reduce the impact of educational near work on human refractive development. British Journal of Ophthalmology, 84(8), 890-893.
Lam, C. S. Y., Goldschmidt, E. & Edwards, M. H. (2004). Prevalence of myopia in local and international schools in Hong Kong. Optometry and Vision Science, 81(5), 317-322.
Lam, C. Y., Tam, P. O. S., Fan, D. S. P., Fan, B. J., Wang, D. Y., Lee, C. W. S. et al. (2008). A genome-wide scan maps a novel high myopia locus to 5p15. Investigative Ophthalmology and Visual Science, 49(9), 3768-3778.
Lam, D. S. C., Fan, D. S. P., Lam, R. F., Rao, S. K., Chong, K. S., Lau, J. T. F. et al. (2008). The effect of parental history of myopia on children's eye size and growth: results of a longitudinal study. Investigative Ophthalmology and Visual Science, 49(3), 873-876.
Lam, D. S. C., Tam, P. O. S., Fan, D. S. P., Baum, L., Leung, Y. & Pang, C. P. (2003). Familial high myopia linkage to chromosome 18p. Ophthalmologica, 217(2), 115-118.

Bibliography
90
Langrová, H., Jägle, H., Zrenner, E. & Kurtenbach, A. (2007). The multifocal pattern electroretinogram (mfPERG) and cone-isolating stimuli. Visual Neuroscience, 24(6), 805-816.
Lauber, J. & Kinnear, A. (1979). Eye enlargement in birds induced by dim light. Canadian Journal of Ophthalmology, 14(4), 265.
Lee, B. B. (1996). Receptive field structure in the primate retina. Vision Research, 36(5), 631-644.
Liang, H., Crewther, D. P., Gillard Crewther, S. & Barila, A. M. (1995). A role for photoreceptor outer segments in the induction of deprivation myopia. Vision Research, 35(9), 1217-1225.
Liang, H., Crewther, S. G., Crewther, D. P. & Junghans, B. M. (2004). Structural and elemental evidence for edema in the retina, retinal pigment epithelium, and choroid during recovery from experimentally induced myopia. Investigative Ophthalmology and VisualSscience, 45(8), 2463-2474.
Lin, L. L. K., Shih, Y. F., Tsai, C. B., Chen, C. J., Lee, L. A., Hung, P. T. & Hou, P. K. (1999). Epidemiologic study of ocular refraction among schoolchildren in Taiwan in 1995. Optometry and Vision Science, 76(5), 275-281.
Lin, T., Grimes, P. A. & Stone, R. A. (1993). Expansion of the retinal pigment epithelium in experimental myopia. Vision Research, 33(14), 1881-1885.
Lyhne, N., Sjølie, A. K., Kyvik, K. O. & Green, A. (2001). The importance of genes and environment for ocular refraction and its determiners: a population based study among 20–45 year old twins. British Journal of Ophthalmology, 85(12), 1470-1476.
Ma, J.-H., Shen, S.-H., Zhang, G.-W., Zhao, D.-S., Xu, C., Pan, C.-M. et al. (2010). Identification of a locus for autosomal dominant high myopia on chromosome 5p13.3-p15.1 in a Chinese family. Molecular Vision, 16, 2043-2054.
McBrien, N. A., Moghaddam, H. & Reeder, A. (1993). Atropine reduces experimental myopia and eye enlargement via a nonaccommodative mechanism. Investigative Ophthalmology and Visual Science, 34(1), 205-215.
McBrien, N. A., Moghaddam, H. O., Cottriall, C. L., Leech, E. M. & Cornell, L. M. (1995). The effects of blockade of retinal cell action potentials on ocular growth, emmetropization and form deprivation myopia in young chicks. Vision Research, 35(9), 1141-1152.
McCarthy, C. S., Megaw, P., Devadas, M. & Morgan, I. G. (2007). Dopaminergic agents affect the ability of brief periods of normal vision to prevent form-deprivation myopia. Experimental Eye Research, 84(1), 100-107.
Menz, M. & Sutter, E. (2004). The effect of fixation instability on the multifocal VEP. Documenta Ophthalmologica, 109(2), 147-156.
Metha, A., Vingrys, A. & Badcock, D. (1993). Calibration of a color monitor for visual psychophysics. Behavior Research Methods, 25(3), 371-383.
Meyer, C., Mueller, M., Duncker, G. & Meyer, H. J. (1999). Experimental animal myopia models are applicable to human juvenile-onset myopia. Survey of Ophthalmology, 44, S93-S102.
Mollon, J.D. (1989). "Tho'she kneel'd in that place where they grew…" The uses and origins of primate colour vision. Journal of Experimental Biology, 146(1), 21-38.
Bibliography
91
Michaelides, M., Johnson, S., Bradshaw, K., Holder, G. E., Simunovic, M. P., Mollon, J. D. et al. (2005). X-Linked cone dysfunction syndrome with myopia and protanopia. Ophthalmology, 112(8), 1448-1454.
Miele, D. L., Odel, J. G., Behrens, M. M., Zhang, X. & Hood, D. C. (2000). Functional bitemporal quadrantopia and the multifocal visual evoked potential. Journal of Neuro-ophthalmology, 20(3), 159-162.
Mutti, D. O., Hayes, J. R., Mitchell, G. L., Jones, L. A., Moeschberger, M. L., Cotter, S. A. et al. (2007). Refractive error, axial length, and relative peripheral refractive error before and after the onset of myopia. Investigative Ophthalmology and Visual Science, 48(6), 2510-2519.
Nathan, J., Crewther, S., Crewther, D. & Kiely, P. (1984). Effects of retinal image degradation on ocular growth in cats. Investigative Ophthalmology and Visual Science, 25(11), 1300-1306.
Neitz, J. & Neitz, M. (2011). Photoreceptor activity patterns and the cause and prevention of myopia. Optometry and Vision Science 88(3), 424.
Nerger, J. L. & Cicerone, C. M. (1992). The ratio of L cones to M cones in the human parafoveal retina. Vision Research, 32(5), 879-888.
Nickla, D. L. & Wildsoet, C. F. (2004). The effect of the nonspecific nitric oxide synthase inhibitor NG-nitro-L-arginine methyl ester on the choroidal compensatory response to myopic defocus in chickens. Optometry and Vision Science, 81(2), 111-118.
Norton, T. (1999). Animal Models of Myopia: Learning How Vision Controls the Size of the Eye. ILAR Journal/National Research Council, Institute of Laboratory Animal Resources, 40(2), 59-77.
Norton, T. T., Essinger, J. A. & McBRIEN, N. A. (1994). Lid-suture myopia in tree shrews with retinal ganglion cell blockade. Visual Neuroscience, 11, 143-143.
Odom, J. V., Bach, M., Brigell, M., Holder, G. E., McCulloch, D. L. & Tormene, A. P. (2010). ISCEV standard for clinical visual evoked potentials (2009 update). Documenta Ophthalmologica, 120(1), 111-119.
Otake, S. & Cicerone, C. M. (2000). L and M cone relative numerosity and red–green opponency from fovea to midperiphery in the human retina. Journal of the Optical Society of America A, 17(3), 615-627.
Paluru, P., Ronan, S. M., Heon, E., Devoto, M., Wildenberg, S. C., Scavello, G. et al. (2003). New locus for autosomal dominant high myopia maps to the long arm of chromosome 17. Investigative Ophthalmology and Visual Science, 44(5), 1830-1836.
Pickett Seltner, R. L. & Stell, W. K. (1995). The effect of vasoactive intestinal peptide on development of form deprivation myopia in the chick: a pharmacological and immunocytochemical study. Vision Research, 35(9), 1265-1270.
Pokorny, J., Lutze, M., Cao, D. & Zele, A. J. (2006). The color of night: Surface color perception under dim illuminations. Visual Neuroscience, 23(3/4), 525-530.
Pokorny, J. & Smith, V. (1987). L/M cone ratios and the null point of the perceptual red/green opponent system. Die Farbe, 34, 53–57.
Pokorny, J., Smith, V. C. & Wesner, M. F. (1991). Variability in cone populations and implications. From Pigments to Perception, Plenum New York, 23-34.
Bibliography
92
Qian, Y.-S., Chu, R.-Y., He, J. C., Sun, X.-H., Zhou, X.-T., Zhao, N.-Q. et al. (2009). Incidence of myopia in high school students with and without red-green color vision deficiency. Investigative Ophthalmology and Visual Science, 50(4), 1598-1605.
Rabin, J., Van Sluyters, R. & Malach, R. (1981). Emmetropization: a vision-dependent phenomenon. Investigative Ophthalmology and Visual Science, 20(4), 561-564.
Regan, D., Cartwright, R. F. (1970). A method of measuring the potentials evoked by simultaneous stimulation of different retinal regions. Electroenceph CLin Neurophysiol, 28, 314-319.
Rohrer, B., Spira, A. W. & Stell, W. K. (1993). Apomorphine blocks form-deprivation myopia in chickens by a dopamine D~ 2-receptor mechanism acting in retina or pigmented epithelium. Visual Neuroscience, 10, 447-447.
Roorda, A. & Williams, D. R. (1988). The arrangement of the three cone classes in the living human eye. Acoustical Society of America, 83, 1102-1116.
Rose, K. A., Morgan, I. G., Ip, J., Kifley, A., Huynh, S., Smith, W. & Mitchell, P. (2008). Outdoor activity reduces the prevalence of myopia in children. Ophthalmology, 115(8), 1279-1285.
Rose, K. A., Morgan, I. G., Smith, W., Burlutsky, G., Mitchell, P. & Saw, S.-M. (2008). Myopia, lifestyle, and schooling in students of Chinese ethnicity in Singapore and Sydney. Archives of Ophthalmology, 126(4), 527-530.
Rucker, F. J. & Kruger, P. B. (2006). Cone contributions to signals for accommodation and the relationship to refractive error. Vision Research, 46(19), 3079-3089.
Saw, S. M., Chua, W. H., Hong, C. Y., Wu, H. M., Chan, W. Y., Chia, K. S. et al. (2002). Nearwork in early-onset myopia. Investigative Ophthalmology and Visual Science, 43(2), 332-339.
Saw, S. M., Hong, R. Z., Zhang, M. Z., Fu, Z. F., Ye, M., Tan, D. & Chew, S. J. (2001). Near-work activity and myopia in rural and urban schoolchildren in China. Journal of Pediatric Ophthalmology and Strabismus, 38(3), 149-155.
Schippert, R. & Schaeffel, F. (2006). Peripheral defocus does not necessarily affect central refractive development. Vision Research, 46(22), 3935-3940.
Schmid, K. L. & Wildsoet, C. F. (2004). Inhibitory effects of apomorphine and atropine and their combination on myopia in chicks. Optometry and Vision Science, 81(2), 137-147.
Schwartz, M., Haim, M. & Skarsholm, D. (1990). X‐linked myopia: Bornholm Eye Disease. Clinical Genetics, 38(4), 281-286.
Seidemann, A., Schaeffel, F., Guirao, A., Lopez-Gil, N. & Artal, P. (2002). Peripheral refractive errors in myopic, emmetropic, and hyperopic young subjects. The Optical Society of America A, 19(12), 2363-2373.
Sherman, S. M., Norton, T. & Casagrande, V. (1977). Myopia in the lid-sutured tree shrew (Tupaia glis). Brain Research, 124(1), 154-157.
Shih, Y. F., Fitzgerald, M. E. C., Norton, T. T., Gamlin, P. D. R., Hodos, W. & Reiner, A. (1993). Reduction in choroidal blood flow occurs in chicks wearing goggles that induce eye growth toward myopia. Current Eye Research, 12(3), 219-227.
Siegwart Jr, J. T. & Norton, T. T. (2011). Perspective: How Might Emmetropization and Genetic Factors Produce Myopia in Normal Eyes? Optometry and Vision Science, 88(3), E365.
Bibliography
93
Simensen, B. & Thorud, L. O. (2009). Adult‐onset myopia and occupation. Acta Ophthalmologica, 72(4), 469-471.
Smith, E. L. (1998). Environmentally induced refractive errors in animals. Myopia and Nearwork. Oxford: Butterworth-Heinemann, 57-90.
Smith, E. L., Huang, J., Hung, L. F., Blasdel, T. L., Humbird, T. L. & Bockhorst, K. H. (2009). Hemiretinal form deprivation: evidence for local control of eye growth and refractive development in infant monkeys. Investigative Ophthalmology and Visual Science, 50(11), 5057-5069.
Smith, E. L., Kee, C., Ramamirtham, R., Qiao-Grider, Y. & Hung, L. F. (2005). Peripheral vision can influence eye growth and refractive development in infant monkeys. Investigative Ophthalmology and Visual Science, 46(11), 3965-3972.
Smith, E. L., Li-Fang, H. & Harwerth, R. S. (1994). Effects of optically induced blur on the refractive status of young monkeys. Vision Research, 34(3), 293-301.
Smith, E.L., Ramamirtham, R., Qiao-Grider, Y., Hung, L.F., Huang, J., Kee, C.S., Coats, D., Paysse, E. (2007). Effects of foveal ablation on emmetropization and form-deprivation myopia. Investigative Ophthalmology and Visual Science, 48, 3914-3922.
Smith, V. C. & Pokorny, J. (1975). Spectral sensitivity of the foveal cone photopigments between 400 and 500 nm. Vision Rresearch, 15(2), 161-171.
Stambolian, D., Ibay, G., Reider, L., Dana, D., Moy, C., Schlifka, M. et al. (2004). Genomewide linkage scan for myopia susceptibility loci among Ashkenazi Jewish families shows evidence of linkage on chromosome 22q12. American Journal of Human Genetics, 75(3), 448-459.
Stone, R. & Flitcroft, D. (2004). Ocular shape and myopia. Annals-academy of Medicine Singapore, 33(1), 7-15.
Stone, R. A., Lin, T. & Laties, A. M. (1991). Muscarinic antagonist effects on experimental chick myopia. Experimental Eye Research, 52(6), 755-758.
Stone, R. A., Lin, T., Laties, A. M. & Iuvone, P. M. (1989). Retinal dopamine and form-deprivation myopia. Proceedings of the National Academy of Sciences, 86(2), 704-706.
Thorington, L. (1985). Spectral, irradiance, and temporal aspects of natural and artificial light. Annals of the New York Academy of Sciences, 453(1), 28-54.
Ting, P. W. K., Lam, C. S. Y., Edwards, M. H. & Schmid, K. L. (2004). Prevalence of myopia in a group of Hong Kong microscopists. Optometry and Vision Science, 81(2), 88-93.
Tong, L., Wong, E. H., Chan, Y. H. & Balakrishnan, V. (2002). A multiple regression approach to study optical components of myopia in Singapore school children. Ophthalmic and Physiological Optics, 22(1), 32-37.
Troilo, D., Gottlieb, M. D. & Wallman, J. (1987). Visual deprivation causes myopia in chicks with optic nerve section. Current Eye Research, 6(8), 993-999.
Troilo, D. & Wallman, J. (1991). The regulation of eye growth and refractive state: an experimental study of emmetropization. Vision Research, 31(7), 1237-1250.
Usui, T., Kremers, J., Sharpe, L. T. & Zrenner, E. (1998). Flicker cone electroretinogram in dichromats and trichromats. Vision Research, 38(21), 3391-3396.
Bibliography
94
Varughese, S., Varghese, R. M., Gupta, N., Ojha, R., Sreenivas, V. & Puliyel, J. M. (2005). Refractive error at birth and its relation to gestational age. Current Eye Research, 30(6), 423-428.
Villarreal, M. G., Ohlsson, J., Abrahamsson, M., Sjöström, A. & Sjöstrand, J. (2001). Myopisation: the refractive tendency in teenagers. Prevalence of myopia among young teenagers in Sweden. Acta Ophthalmologica Scandinavica, 78(2), 177-181.
Vitale, S., Ellwein, L., Cotch, M. F., Ferris III, F. L. & Sperduto, R. (2008). Prevalence of refractive error in the United States, 1999–2004. Archives of Ophthalmology, 126(8), 1111-1119.
Wachtmeister, L. (1998). Oscillatory potentials in the retina: what do they reveal. Progress In Retinal And Eye Research, 17(4), 485-521.
Wallman, J., Adams, J. & Trachtman, J. (1981). The eyes of young chickens grow toward emmetropia. Investigative Ophthalmology and Visual Science, 20(4), 557-561.
Wallman, J., Gottlieb, M.D., Rajaram, V., Fugate-Wentzek, L.A. (1987). Local retinal regions control local eye growth and myopia. Science, 237, 73-77.
Wallman, J., Wildsoet, C., Xu, A., Gottlieb, M. D., Nickla, D. L., Marran, L. et al. (1995). Moving the retina: choroidal modulation of refractive state. Vision Research, 35(1), 37-50.
Wallman, J., Winawer, J. (2004). Homeostasis of the eye growth and the question of myopia. Neuron, 43, 447-468.
Weiss, S. & Schaeffel, F. (1993). Diurnal growth rhythms in the chicken eye: relation to myopia development and retinal dopamine levels. Journal of Comparative Physiology A: Neuroethology, Sensory, Neural, and Behavioral Physiology, 172(3), 263-270.
Wensor, M., McCarty, C. A. & Taylor, H. R. (1999). Prevalence and risk factors of myopia in Victoria, Australia. Archives of Ophthalmology, 117(5), 658-663.
Wienke, R. E. (1960). Refractive error and the green/red ratio. Journal of the Optical Society of America, 50(4), 341-341.
Wiesel, T. N. & Raviola, E. (1977). Myopia and eye enlargement after neonatal lid fusion in monkeys. Nature Publishing Group, 266, 66-68.
Wildsoet, C. (1997). Active emmetropization—evidence for its existence and ramifications for clinical practice. Ophthalmic and Physiological Optics, 17(4), 279-290.
Wildsoet, C. & Wallman, J. (1995). Choroidal and scleral mechanisms of compensation for spectacle lenses in chicks. Vision Research, 35(9), 1175-1194.
Wildsoet, C. F. (2003). Neural pathways subserving negative lens-induced emmetropization in chicks-Insights from selective lesions of the optic nerve and ciliary nerve. Current Eye Research, 27(6), 371-385.
Wilson, A. & Woo, G. (1989). A review of the prevalence and causes of myopia. Singapore Med J, 30(5), 479-484.
Winn, B., Shin, E., Odel, J., Greenstein, V., Hood, D. (2005). Interpreting the multifocal visual evoked potential: the effects of refractive errors, cataracts, and fixation errors. British Journal of Ophthalmology, 89(3), 340-344.
Wollensak, G., Iomdina, E., Dittert, D. D., Salamatina, O. & Stoltenburg, G. (2005). Cross‐linking of scleral collagen in the rabbit using riboflavin and UVA. Acta Ophthalmologica

Bibliography
95
Scandinavica, 83(4), 477-482.
Wong, L., Coggon, D., Cruddas, M. & Hwang, C. (1993). Education, reading, and familial tendency as risk factors for myopia in Hong Kong fishermen. Journal of Epidemiology and Community Health, 47(1), 50-53.
Wong, T. Y., Foster, P. J., Hee, J., Ng, T. P., Tielsch, J. M., Chew, S. J. et al. (2000). Prevalence and risk factors for refractive errors in adult Chinese in Singapore. Investigative Ophthalmology and Visual Science, 41(9), 2486-2494.
Wu, H. M., Seet, B., Yap, E. P. H., Saw, S. M., Lim, T. H. & Chia, K. S. (2001). Does education explain ethnic differences in myopia prevalence? A population-based study of young adult males in Singapore. Optometry and Vision Science, 78(4), 234-239.
Xu, L., Li, J., Cui, T., Hu, A., Fan, G., Zhang, R. et al. (2005). Refractive error in urban and rural adult Chinese in Beijing. Ophthalmology, 112(10), 1676-1683.
Yamauchi Y, Yatsu K, Kuchenbecker J, Neitz M, Neitz J. (2013). L:M Cone Ratio of Japanese Derived with ERG Flicker Photometry Method. The Association for Research in Vision and Ophthalmology, 619-B0190.
Young, T. L., Ronan, S. M., Alvear, A. B., Wildenberg, S. C., Oetting, W. S., Atwood, L. D. et al. (1998). A second locus for familial high myopia maps to chromosome 12q. The American Journal of Human Genetics, 63(5), 1419-1424.
Young, T. L., Ronan, S. M., Drahozal, L. A., Wildenberg, S. C., Alvear, A. B., Oetting, W. S. et al. (1998). Evidence that a locus for familial high myopia maps to chromosome 18p. The American Journal of Human Genetics, 63(1), 109-119.
Zele, A. J., Cao, D. & Pokorny, J. (2008). Rod-cone interactions and the temporal impulse response of the cone pathway. Vision Research, 48(26), 2593-2598.
Zele, A. J., Kremers, J. & Feigl, B. (2012). Mesopic rod and S-cone interactions revealed by modulation thresholds. Journal of the Optical Society of America A, 29(2), A19-A26.
Zele, A. J. & Vingrys, A. J. (2005). Cathode-ray-tube monitor artefacts in neurophysiology. Journal of Neuroscience Methods, 141(1), 1-7.
Zhang, Q., Guo, X., Xiao, X., Jia, X., Li, S. & Hejtmancik, J. F. (2005). A new locus for autosomal dominant high myopia maps to 4q22-q27 between D4S1578 and D4S1612. Molecular Vision, 11, 554-560.
Zhao, J., Pan, X., Sui, R., Munoz, S. R., Sperduto, R. D. & Ellwein, L. B. (2000). Refractive error study in children: results from Shunyi District, China. American Journal of Ophthalmology, 129(4), 427-435.

Appendix I
96
Appendix I
Original luminance output (cd/m2) of red light from the CRT monitor
1 0.321 38 0.321 75 2.613 112 5.272 149 12.32 186 20.22 223 30.77
2 0.321 39 0.321 76 2.613 113 6.875 150 13.04 187 20.44 224 30.77
3 0.321 40 0.321 77 2.613 114 7.282 151 13.04 188 20.44 225 30.77
4 0.321 41 0.321 78 2.613 115 8.116 152 13.98 189 21.39 226 32.6
5 0.321 42 0.321 79 2.619 116 8.263 153 13.98 190 21.39 227 33.19
6 0.321 43 0.321 80 3.326 117 8.263 154 14.18 191 22.36 228 33.19
7 0.321 44 0.321 81 3.326 118 8.118 155 13.99 192 23.11 229 33.19
8 0.321 45 0.321 82 3.326 119 8.118 156 14.18 193 23.11 230 32.9
9 0.321 46 0.321 83 3.326 120 8.271 157 14.18 194 23.36 231 32.9
10 0.321 47 0.321 84 3.326 121 8.271 158 14.18 195 23.36 232 33.16
11 0.321 48 0.321 85 3.326 122 8.271 159 14.77 196 23.36 233 34.64
12 0.321 49 0.9377 86 3.326 123 9.455 160 14.77 197 24.12 234 35.25
13 0.321 50 0.9377 87 3.326 124 9.455 161 14.77 198 24.64 235 35.25
14 0.321 51 0.9377 88 3.326 125 9.455 162 14.77 199 24.64 236 35.25
15 0.321 52 0.9435 89 3.326 126 8.261 163 15.79 200 24.11 237 35.25
16 0.321 53 0.9435 90 3.326 127 9.925 164 16.89 201 24.62 238 35.57
17 0.321 54 0.9435 91 3.079 128 9.457 165 16.89 202 24.62 239 36.49
18 0.321 55 0.9435 92 3.328 129 8.251 166 17.31 203 24.86 240 35.23
19 0.321 56 0.9416 93 5.166 130 10.08 167 17.31 204 24.86 241 36.5
20 0.321 57 0.9475 94 3.418 131 9.453 168 17.31 205 25.91 242 36.5
21 0.321 58 0.9475 95 3.418 132 9.927 169 17.97 206 26.44 243 36.77
22 0.321 59 0.9475 96 3.944 133 9.927 170 17.97 207 26.96 244 38
23 0.321 60 0.9475 97 3.944 134 9.927 171 17.97 208 26.96 245 38.03
24 0.321 61 0.9455 98 3.944 135 9.927 172 17.3 209 26.96 246 38.03
25 0.321 62 0.9455 99 5.162 136 10.09 173 18.84 210 26.96 247 38.03
26 0.321 63 0.9455 100 5.162 137 10.09 174 19.06 211 28.06 248 38.03
27 0.321 64 1.656 101 5.162 138 10.09 175 19.06 212 28.06 249 38.03
28 0.321 65 1.666 102 5.162 139 10.09 176 19.06 213 28.06 250 38.03
29 0.321 66 1.666 103 5.162 140 10.57 177 19.06 214 28.3 251 38.03
30 0.321 67 1.666 104 5.162 141 10.57 178 19.06 215 28.3 252 38.03
31 0.321 68 1.607 105 5.272 142 11.62 179 19.98 216 28.57 253 38.05
32 0.321 69 1.607 106 5.272 143 12.15 180 20.22 217 28.57 254 38.05
33 0.321 70 1.66 107 5.272 144 12.15 181 20.22 218 28.57 255 38.05
34 0.321 71 1.66 108 6.879 145 12.32 182 20.22 219 30.5
35 0.321 72 1.66 109 6.879 146 12.32 183 20.22 220 29.36
36 0.321 73 1.66 110 6.879 147 12.32 184 20.44 221 30.51
37 0.321 74 2.613 111 5.272 148 12.32 185 20.22 222 30.51
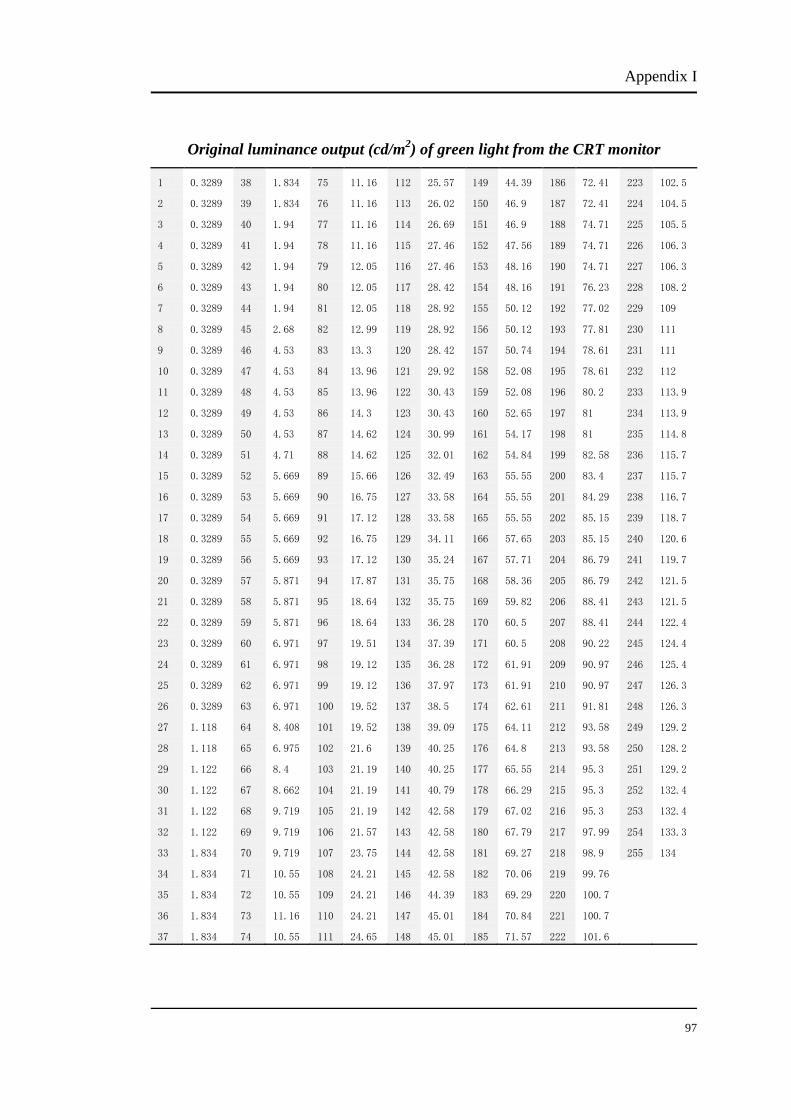
Appendix I
97
Original luminance output (cd/m2) of green light from the CRT monitor
1 0.3289 38 1.834 75 11.16 112 25.57 149 44.39 186 72.41 223 102.5
2 0.3289 39 1.834 76 11.16 113 26.02 150 46.9 187 72.41 224 104.5
3 0.3289 40 1.94 77 11.16 114 26.69 151 46.9 188 74.71 225 105.5
4 0.3289 41 1.94 78 11.16 115 27.46 152 47.56 189 74.71 226 106.3
5 0.3289 42 1.94 79 12.05 116 27.46 153 48.16 190 74.71 227 106.3
6 0.3289 43 1.94 80 12.05 117 28.42 154 48.16 191 76.23 228 108.2
7 0.3289 44 1.94 81 12.05 118 28.92 155 50.12 192 77.02 229 109
8 0.3289 45 2.68 82 12.99 119 28.92 156 50.12 193 77.81 230 111
9 0.3289 46 4.53 83 13.3 120 28.42 157 50.74 194 78.61 231 111
10 0.3289 47 4.53 84 13.96 121 29.92 158 52.08 195 78.61 232 112
11 0.3289 48 4.53 85 13.96 122 30.43 159 52.08 196 80.2 233 113.9
12 0.3289 49 4.53 86 14.3 123 30.43 160 52.65 197 81 234 113.9
13 0.3289 50 4.53 87 14.62 124 30.99 161 54.17 198 81 235 114.8
14 0.3289 51 4.71 88 14.62 125 32.01 162 54.84 199 82.58 236 115.7
15 0.3289 52 5.669 89 15.66 126 32.49 163 55.55 200 83.4 237 115.7
16 0.3289 53 5.669 90 16.75 127 33.58 164 55.55 201 84.29 238 116.7
17 0.3289 54 5.669 91 17.12 128 33.58 165 55.55 202 85.15 239 118.7
18 0.3289 55 5.669 92 16.75 129 34.11 166 57.65 203 85.15 240 120.6
19 0.3289 56 5.669 93 17.12 130 35.24 167 57.71 204 86.79 241 119.7
20 0.3289 57 5.871 94 17.87 131 35.75 168 58.36 205 86.79 242 121.5
21 0.3289 58 5.871 95 18.64 132 35.75 169 59.82 206 88.41 243 121.5
22 0.3289 59 5.871 96 18.64 133 36.28 170 60.5 207 88.41 244 122.4
23 0.3289 60 6.971 97 19.51 134 37.39 171 60.5 208 90.22 245 124.4
24 0.3289 61 6.971 98 19.12 135 36.28 172 61.91 209 90.97 246 125.4
25 0.3289 62 6.971 99 19.12 136 37.97 173 61.91 210 90.97 247 126.3
26 0.3289 63 6.971 100 19.52 137 38.5 174 62.61 211 91.81 248 126.3
27 1.118 64 8.408 101 19.52 138 39.09 175 64.11 212 93.58 249 129.2
28 1.118 65 6.975 102 21.6 139 40.25 176 64.8 213 93.58 250 128.2
29 1.122 66 8.4 103 21.19 140 40.25 177 65.55 214 95.3 251 129.2
30 1.122 67 8.662 104 21.19 141 40.79 178 66.29 215 95.3 252 132.4
31 1.122 68 9.719 105 21.19 142 42.58 179 67.02 216 95.3 253 132.4
32 1.122 69 9.719 106 21.57 143 42.58 180 67.79 217 97.99 254 133.3
33 1.834 70 9.719 107 23.75 144 42.58 181 69.27 218 98.9 255 134
34 1.834 71 10.55 108 24.21 145 42.58 182 70.06 219 99.76
35 1.834 72 10.55 109 24.21 146 44.39 183 69.29 220 100.7
36 1.834 73 11.16 110 24.21 147 45.01 184 70.84 221 100.7
37 1.834 74 10.55 111 24.65 148 45.01 185 71.57 222 101.6

Appendix I
98
Original luminance output (cd/m2) of blue light from the CRT monitor
1 0.323 38 0.323 75 0.323 112 1.259 149 4.902 186 6.902 223 11.15
2 0.323 39 0.323 76 0.323 113 1.259 150 4.902 187 6.902 224 11.15
3 0.323 40 0.323 77 0.323 114 1.259 151 4.902 188 6.902 225 11.15
4 0.323 41 0.323 78 0.323 115 2.018 152 4.902 189 6.902 226 11.25
5 0.323 42 0.323 79 0.323 116 2.063 153 4.902 190 6.902 227 11.16
6 0.323 43 0.323 80 0.323 117 2.063 154 4.902 191 7.828 228 11.16
7 0.323 44 0.323 81 0.323 118 2.063 155 4.902 192 7.828 229 11.16
8 0.323 45 0.323 82 0.323 119 2.063 156 4.902 193 7.828 230 11.16
9 0.323 46 0.323 83 0.323 120 2.063 157 4.902 194 7.828 231 11.16
10 0.323 47 0.323 84 0.323 121 2.063 158 4.902 195 7.828 232 11.26
11 0.323 48 0.323 85 0.323 122 2.063 159 4.962 196 8.923 233 11.26
12 0.323 49 0.323 86 0.323 123 2.063 160 4.962 197 8.923 234 12.59
13 0.323 50 0.323 87 0.323 124 2.063 161 4.962 198 8.923 235 12.59
14 0.323 51 0.323 88 0.323 125 2.063 162 4.962 199 7.836 236 12.59
15 0.323 52 0.323 89 0.323 126 2.063 163 4.962 200 8.924 237 12.59
16 0.323 53 0.323 90 0.323 127 2.063 164 4.962 201 8.924 238 12.59
17 0.323 54 0.323 91 0.323 128 2.063 165 4.962 202 8.924 239 12.59
18 0.323 55 0.323 92 2.018 129 2.063 166 4.968 203 9.51 240 12.59
19 0.323 56 0.323 93 1.257 130 2.063 167 4.968 204 8.928 241 14.22
20 0.323 57 0.323 94 0.323 131 2.063 168 6.812 205 9.394 242 14.22
21 0.323 58 0.323 95 0.323 132 2.063 169 4.974 206 9.498 243 14.22
22 0.323 59 0.323 96 0.323 133 2.063 170 6.065 207 10.4 244 13.5
23 0.323 60 0.323 97 0.323 134 2.063 171 4.976 208 9.404 245 11.26
24 0.323 61 0.323 98 0.323 135 2.063 172 6.068 209 9.469 246 13.51
25 0.323 62 0.323 99 2.014 136 2.063 173 6.068 210 9.412 247 13.51
26 0.323 63 0.323 100 2.014 137 3.232 174 4.972 211 9.5 248 14.22
27 0.323 64 0.323 101 2.014 138 3.232 175 6.061 212 9.508 249 13.5
28 0.323 65 0.323 102 2.014 139 3.232 176 6.812 213 9.508 250 14.22
29 0.323 66 0.323 103 2.014 140 3.232 177 6.812 214 11.15 251 14.22
30 0.323 67 0.323 104 1.259 141 3.232 178 6.812 215 9.51 252 14.22
31 0.323 68 0.323 105 1.259 142 3.232 179 6.9 216 9.51 253 14.22
32 0.323 69 0.323 106 1.259 143 3.743 180 6.82 217 9.51 254 14.33
33 0.323 70 0.323 107 1.259 144 3.743 181 6.902 218 11.15 255 15.16
34 0.323 71 0.323 108 1.259 145 3.743 182 6.902 219 11.15
35 0.323 72 0.323 109 1.259 146 3.743 183 6.902 220 11.15
36 0.323 73 0.323 110 1.259 147 3.743 184 6.902 221 11.15
37 0.323 74 0.323 111 1.259 148 4.902 185 6.902 222 11.15

Appendix II
99
Appendix II
Luminance output (cd/m2) of red light after gamma correction
49 6.383 79 10.523 109 16.584 139 19.830 169 25.936 199 30.028 229 34.475
50 6.383 80 11.786 110 16.584 140 20.264 170 25.936 200 29.726 230 34.335
51 6.383 81 11.786 111 14.641 141 20.264 171 25.936 201 30.016 231 34.335
52 6.403 82 11.786 112 14.641 142 21.178 172 25.482 202 30.016 232 34.461
53 6.403 83 11.786 113 16.580 143 21.622 173 26.511 203 30.152 233 35.165
54 6.403 84 11.786 114 17.031 144 21.622 174 26.655 204 30.152 234 35.451
55 6.403 85 11.786 115 17.916 145 21.762 175 26.655 205 30.736 235 35.451
56 6.396 86 11.786 116 18.067 146 21.762 176 26.655 206 31.026 236 35.451
57 6.416 87 11.786 117 18.067 147 21.762 177 26.655 207 31.307 237 35.451
58 6.416 88 11.786 118 17.918 148 21.762 178 26.655 208 31.307 238 35.599
59 6.416 89 11.786 119 17.918 149 21.762 179 27.244 209 31.307 239 36.023
60 6.416 90 11.786 120 18.075 150 22.345 180 27.396 210 31.307 240 35.441
61 6.410 91 11.364 121 18.075 151 22.345 181 27.396 211 31.893 241 36.028
62 6.410 92 11.790 122 18.075 152 23.080 182 27.396 212 31.893 242 36.028
63 6.410 93 14.503 123 19.239 153 23.080 183 27.396 213 31.893 243 36.151
64 8.446 94 11.939 124 19.239 154 23.233 184 27.534 214 32.020 244 36.706
65 8.470 95 11.939 125 19.239 155 23.088 185 27.396 215 32.020 245 36.720
66 8.470 96 12.774 126 18.065 156 23.233 186 27.396 216 32.161 246 36.720
67 8.470 97 12.774 127 19.678 157 23.233 187 27.534 217 32.161 247 36.720
68 8.323 98 12.774 128 19.240 158 23.233 188 27.534 218 32.161 248 36.720
69 8.323 99 14.497 129 18.054 159 23.677 189 28.120 219 33.150 249 36.720
70 8.455 100 14.497 130 19.821 160 23.677 190 28.120 220 32.570 250 36.720
71 8.455 101 14.497 131 19.237 161 23.677 191 28.705 221 33.155 251 36.720
72 8.455 102 14.497 132 19.680 162 23.677 192 29.148 222 33.155 252 36.720
73 8.455 103 14.497 133 19.680 163 24.423 193 29.148 223 33.286 253 36.729
74 10.511 104 14.497 134 19.680 164 25.200 194 29.294 224 33.286 254 36.729
75 10.511 105 14.641 135 19.680 165 25.200 195 29.294 225 33.286 255 36.729
76 10.511 106 14.641 136 19.830 166 25.489 196 29.294 226 34.190
77 10.511 107 14.641 137 19.830 167 25.489 197 29.732 227 34.475
78 10.511 108 16.584 138 19.830 168 25.489 198 30.028 228 34.475
Linearization Check (Lmax + Lmin = 2*Lave)
Lmax + Lmin: 43.02518117
Lave: 45.14217367
% Error (Lmax + Lmin - Lave)/(Lmax + Lmin + Lave): -0.02401107
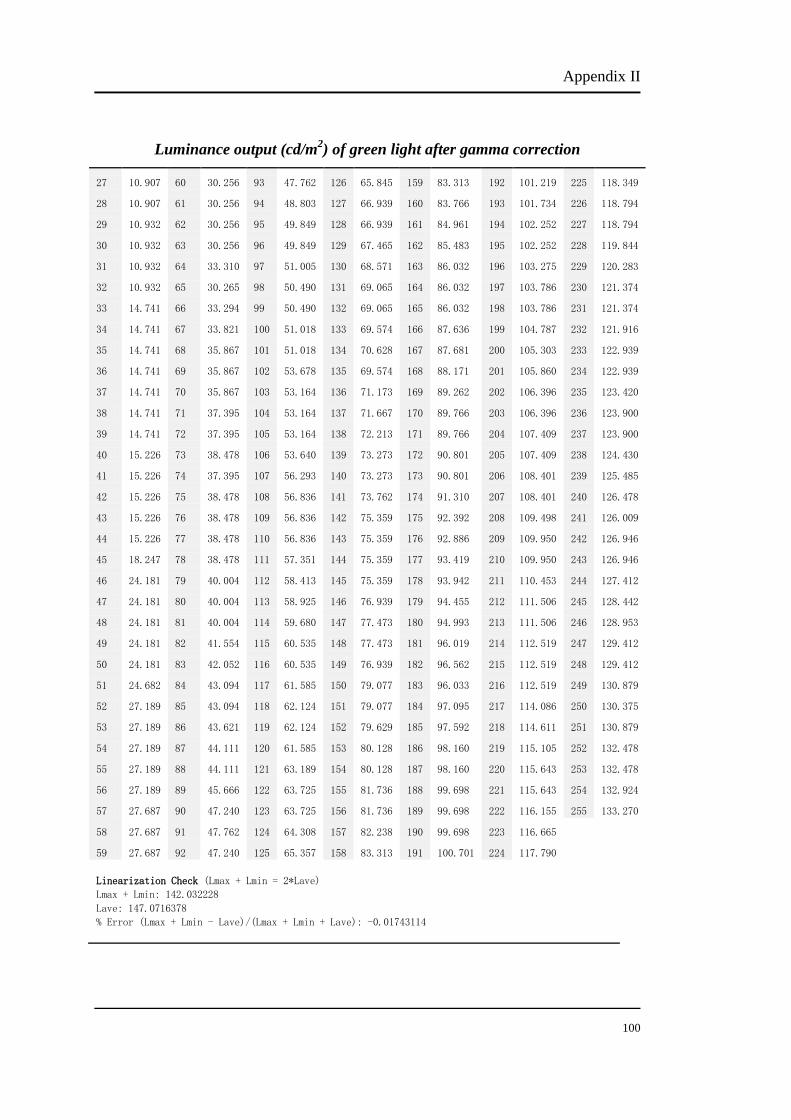
Appendix II
100
Luminance output (cd/m2) of green light after gamma correction
27 10.907 60 30.256 93 47.762 126 65.845 159 83.313 192 101.219 225 118.349
28 10.907 61 30.256 94 48.803 127 66.939 160 83.766 193 101.734 226 118.794
29 10.932 62 30.256 95 49.849 128 66.939 161 84.961 194 102.252 227 118.794
30 10.932 63 30.256 96 49.849 129 67.465 162 85.483 195 102.252 228 119.844
31 10.932 64 33.310 97 51.005 130 68.571 163 86.032 196 103.275 229 120.283
32 10.932 65 30.265 98 50.490 131 69.065 164 86.032 197 103.786 230 121.374
33 14.741 66 33.294 99 50.490 132 69.065 165 86.032 198 103.786 231 121.374
34 14.741 67 33.821 100 51.018 133 69.574 166 87.636 199 104.787 232 121.916
35 14.741 68 35.867 101 51.018 134 70.628 167 87.681 200 105.303 233 122.939
36 14.741 69 35.867 102 53.678 135 69.574 168 88.171 201 105.860 234 122.939
37 14.741 70 35.867 103 53.164 136 71.173 169 89.262 202 106.396 235 123.420
38 14.741 71 37.395 104 53.164 137 71.667 170 89.766 203 106.396 236 123.900
39 14.741 72 37.395 105 53.164 138 72.213 171 89.766 204 107.409 237 123.900
40 15.226 73 38.478 106 53.640 139 73.273 172 90.801 205 107.409 238 124.430
41 15.226 74 37.395 107 56.293 140 73.273 173 90.801 206 108.401 239 125.485
42 15.226 75 38.478 108 56.836 141 73.762 174 91.310 207 108.401 240 126.478
43 15.226 76 38.478 109 56.836 142 75.359 175 92.392 208 109.498 241 126.009
44 15.226 77 38.478 110 56.836 143 75.359 176 92.886 209 109.950 242 126.946
45 18.247 78 38.478 111 57.351 144 75.359 177 93.419 210 109.950 243 126.946
46 24.181 79 40.004 112 58.413 145 75.359 178 93.942 211 110.453 244 127.412
47 24.181 80 40.004 113 58.925 146 76.939 179 94.455 212 111.506 245 128.442
48 24.181 81 40.004 114 59.680 147 77.473 180 94.993 213 111.506 246 128.953
49 24.181 82 41.554 115 60.535 148 77.473 181 96.019 214 112.519 247 129.412
50 24.181 83 42.052 116 60.535 149 76.939 182 96.562 215 112.519 248 129.412
51 24.682 84 43.094 117 61.585 150 79.077 183 96.033 216 112.519 249 130.879
52 27.189 85 43.094 118 62.124 151 79.077 184 97.095 217 114.086 250 130.375
53 27.189 86 43.621 119 62.124 152 79.629 185 97.592 218 114.611 251 130.879
54 27.189 87 44.111 120 61.585 153 80.128 186 98.160 219 115.105 252 132.478
55 27.189 88 44.111 121 63.189 154 80.128 187 98.160 220 115.643 253 132.478
56 27.189 89 45.666 122 63.725 155 81.736 188 99.698 221 115.643 254 132.924
57 27.687 90 47.240 123 63.725 156 81.736 189 99.698 222 116.155 255 133.270
58 27.687 91 47.762 124 64.308 157 82.238 190 99.698 223 116.665
59 27.687 92 47.240 125 65.357 158 83.313 191 100.701 224 117.790
Linearization Check (Lmax + Lmin = 2*Lave)
Lmax + Lmin: 142.032228
Lave: 147.0716378
% Error (Lmax + Lmin - Lave)/(Lmax + Lmin + Lave): -0.01743114

Appendix II
101
Luminance output (cd/m2) of blue light after gamma correction
99 6.624 122 6.690 145 8.554 168 10.937 191 11.578 214 13.382 237 14.064
100 6.624 123 6.690 146 8.554 169 9.614 192 11.578 215 12.539 238 14.064
101 6.624 124 6.690 147 8.554 170 10.429 193 11.578 216 12.539 239 14.064
102 6.624 125 6.690 148 9.556 171 9.615 194 11.578 217 12.539 240 14.064
103 6.624 126 6.690 149 9.556 172 10.431 195 11.578 218 13.382 241 14.782
104 5.448 127 6.690 150 9.556 173 10.431 196 12.216 219 13.382 242 14.782
105 5.448 128 6.690 151 9.556 174 9.612 197 12.216 220 13.382 243 14.782
106 5.448 129 6.690 152 9.556 175 10.426 198 12.216 221 13.382 244 14.471
107 5.448 130 6.690 153 9.556 176 10.937 199 11.583 222 13.382 245 13.436
108 5.448 131 6.690 154 9.556 177 10.937 200 12.217 223 13.382 246 14.476
109 5.448 132 6.690 155 9.556 178 10.937 201 12.217 224 13.382 247 14.476
110 5.448 133 6.690 156 9.556 179 10.995 202 12.217 225 13.382 248 14.782
111 5.448 134 6.690 157 9.556 180 10.942 203 12.539 226 13.431 249 14.471
112 5.448 135 6.690 158 9.556 181 10.996 204 12.219 227 13.387 250 14.782
113 5.448 136 6.690 159 9.604 182 10.996 205 12.476 228 13.387 251 14.782
114 5.448 137 8.052 160 9.604 183 10.996 206 12.532 229 13.387 252 14.782
115 6.629 138 8.052 161 9.604 184 10.996 207 13.006 230 13.387 253 14.782
116 6.690 139 8.052 162 9.604 185 10.996 208 12.481 231 13.387 254 14.829
117 6.690 140 8.052 163 9.604 186 10.996 209 12.517 232 13.436 255 15.174
118 6.690 141 8.052 164 9.604 187 10.996 210 12.486 233 13.436
119 6.690 142 8.052 165 9.604 188 10.996 211 12.533 234 14.064
120 6.690 143 8.554 166 9.609 189 10.996 212 12.538 235 14.064
121 6.690 144 8.554 167 9.609 190 10.996 213 12.538 236 14.064
Linearization Check (Lmax + Lmin = 2*Lave)
Lmax + Lmin: 20.71972388
Lave: 21.01680659
% Error (Lmax + Lmin - Lave)/(Lmax + Lmin + Lave): -0.00711805

Appendix III
102
Appendix III
Normalized available range of red
49 0.005 79 0.150 109 0.295 139 0.440 169 0.585 199 0.729 229 0.874
50 0.010 80 0.155 110 0.300 140 0.444 170 0.589 200 0.734 230 0.879
51 0.014 81 0.159 111 0.304 141 0.449 171 0.594 201 0.739 231 0.884
52 0.019 82 0.164 112 0.309 142 0.454 172 0.599 202 0.744 232 0.889
53 0.024 83 0.169 113 0.314 143 0.459 173 0.604 203 0.749 233 0.894
54 0.029 84 0.174 114 0.319 144 0.464 174 0.609 204 0.754 234 0.899
55 0.034 85 0.179 115 0.324 145 0.469 175 0.614 205 0.758 235 0.903
56 0.039 86 0.184 116 0.329 146 0.473 176 0.618 206 0.763 236 0.908
57 0.043 87 0.188 117 0.333 147 0.478 177 0.623 207 0.768 237 0.913
58 0.048 88 0.193 118 0.338 148 0.483 178 0.628 208 0.773 238 0.918
59 0.053 89 0.198 119 0.343 149 0.488 179 0.633 209 0.778 239 0.923
60 0.058 90 0.203 120 0.348 150 0.493 180 0.638 210 0.783 240 0.928
61 0.063 91 0.208 121 0.353 151 0.498 181 0.643 211 0.787 241 0.932
62 0.068 92 0.213 122 0.357 152 0.502 182 0.647 212 0.792 242 0.937
63 0.072 93 0.217 123 0.362 153 0.507 183 0.652 213 0.797 243 0.942
64 0.077 94 0.222 124 0.367 154 0.512 184 0.657 214 0.802 244 0.947
65 0.082 95 0.227 125 0.372 155 0.517 185 0.662 215 0.807 245 0.952
66 0.087 96 0.232 126 0.377 156 0.522 186 0.667 216 0.812 246 0.957
67 0.092 97 0.237 127 0.382 157 0.527 187 0.671 217 0.816 247 0.961
68 0.097 98 0.242 128 0.386 158 0.531 188 0.676 218 0.821 248 0.966
69 0.101 99 0.246 129 0.391 159 0.536 189 0.681 219 0.826 249 0.971
70 0.106 100 0.251 130 0.396 160 0.541 190 0.686 220 0.831 250 0.976
71 0.111 101 0.256 131 0.401 161 0.546 191 0.691 221 0.836 251 0.981
72 0.116 102 0.261 132 0.406 162 0.551 192 0.696 222 0.841 252 0.986
73 0.121 103 0.266 133 0.411 163 0.556 193 0.700 223 0.845 253 0.990
74 0.126 104 0.271 134 0.415 164 0.560 194 0.705 224 0.850 254 0.995
75 0.130 105 0.275 135 0.420 165 0.565 195 0.710 225 0.855 255 1.000
76 0.135 106 0.280 136 0.425 166 0.570 196 0.715 226 0.860
77 0.140 107 0.285 137 0.430 167 0.575 197 0.720 227 0.865
78 0.145 108 0.290 138 0.435 168 0.580 198 0.725 228 0.870

Appendix III
103
Normalized available range of green
27 0.004 60 0.148 93 0.293 126 0.437 159 0.581 192 0.725 225 0.869
28 0.009 61 0.153 94 0.297 127 0.441 160 0.585 193 0.729 226 0.873
29 0.013 62 0.157 95 0.301 128 0.445 161 0.590 194 0.734 227 0.878
30 0.017 63 0.162 96 0.306 129 0.450 162 0.594 195 0.738 228 0.882
31 0.022 64 0.166 97 0.310 130 0.454 163 0.598 196 0.742 229 0.886
32 0.026 65 0.170 98 0.314 131 0.459 164 0.603 197 0.747 230 0.891
33 0.031 66 0.175 99 0.319 132 0.463 165 0.607 198 0.751 231 0.895
34 0.035 67 0.179 100 0.323 133 0.467 166 0.611 199 0.755 232 0.900
35 0.039 68 0.183 101 0.328 134 0.472 167 0.616 200 0.760 233 0.904
36 0.044 69 0.188 102 0.332 135 0.476 168 0.620 201 0.764 234 0.908
37 0.048 70 0.192 103 0.336 136 0.480 169 0.624 202 0.769 235 0.913
38 0.052 71 0.197 104 0.341 137 0.485 170 0.629 203 0.773 236 0.917
39 0.057 72 0.201 105 0.345 138 0.489 171 0.633 204 0.777 237 0.921
40 0.061 73 0.205 106 0.349 139 0.493 172 0.638 205 0.782 238 0.926
41 0.066 74 0.210 107 0.354 140 0.498 173 0.642 206 0.786 239 0.930
42 0.070 75 0.214 108 0.358 141 0.502 174 0.646 207 0.790 240 0.934
43 0.074 76 0.218 109 0.362 142 0.507 175 0.651 208 0.795 241 0.939
44 0.079 77 0.223 110 0.367 143 0.511 176 0.655 209 0.799 242 0.943
45 0.083 78 0.227 111 0.371 144 0.515 177 0.659 210 0.803 243 0.948
46 0.087 79 0.231 112 0.376 145 0.520 178 0.664 211 0.808 244 0.952
47 0.092 80 0.236 113 0.380 146 0.524 179 0.668 212 0.812 245 0.956
48 0.096 81 0.240 114 0.384 147 0.528 180 0.672 213 0.817 246 0.961
49 0.100 82 0.245 115 0.389 148 0.533 181 0.677 214 0.821 247 0.965
50 0.105 83 0.249 116 0.393 149 0.537 182 0.681 215 0.825 248 0.969
51 0.109 84 0.253 117 0.397 150 0.541 183 0.686 216 0.830 249 0.974
52 0.114 85 0.258 118 0.402 151 0.546 184 0.690 217 0.834 250 0.978
53 0.118 86 0.262 119 0.406 152 0.550 185 0.694 218 0.838 251 0.983
54 0.122 87 0.266 120 0.410 153 0.555 186 0.699 219 0.843 252 0.987
55 0.127 88 0.271 121 0.415 154 0.559 187 0.703 220 0.847 253 0.991
56 0.131 89 0.275 122 0.419 155 0.563 188 0.707 221 0.852 254 0.996
57 0.135 90 0.279 123 0.424 156 0.568 189 0.712 222 0.856 255 1.000
58 0.140 91 0.284 124 0.428 157 0.572 190 0.716 223 0.860
59 0.144 92 0.288 125 0.432 158 0.576 191 0.721 224 0.865

Appendix III
104
Normalized available range of blue
99 0.006 122 0.153 145 0.299 168 0.446 191 0.592 214 0.739 237 0.885
100 0.013 123 0.159 146 0.306 169 0.452 192 0.599 215 0.745 238 0.892
101 0.019 124 0.166 147 0.312 170 0.459 193 0.605 216 0.752 239 0.898
102 0.025 125 0.172 148 0.318 171 0.465 194 0.611 217 0.758 240 0.904
103 0.032 126 0.178 149 0.325 172 0.471 195 0.618 218 0.764 241 0.911
104 0.038 127 0.185 150 0.331 173 0.478 196 0.624 219 0.771 242 0.917
105 0.045 128 0.191 151 0.338 174 0.484 197 0.631 220 0.777 243 0.924
106 0.051 129 0.197 152 0.344 175 0.490 198 0.637 221 0.783 244 0.930
107 0.057 130 0.204 153 0.350 176 0.497 199 0.643 222 0.790 245 0.936
108 0.064 131 0.210 154 0.357 177 0.503 200 0.650 223 0.796 246 0.943
109 0.070 132 0.217 155 0.363 178 0.510 201 0.656 224 0.803 247 0.949
110 0.076 133 0.223 156 0.369 179 0.516 202 0.662 225 0.809 248 0.955
111 0.083 134 0.229 157 0.376 180 0.522 203 0.669 226 0.815 249 0.962
112 0.089 135 0.236 158 0.382 181 0.529 204 0.675 227 0.822 250 0.968
113 0.096 136 0.242 159 0.389 182 0.535 205 0.682 228 0.828 251 0.975
114 0.102 137 0.248 160 0.395 183 0.541 206 0.688 229 0.834 252 0.981
115 0.108 138 0.255 161 0.401 184 0.548 207 0.694 230 0.841 253 0.987
116 0.115 139 0.261 162 0.408 185 0.554 208 0.701 231 0.847 254 0.994
117 0.121 140 0.268 163 0.414 186 0.561 209 0.707 232 0.854 255 1.000
118 0.127 141 0.274 164 0.420 187 0.567 210 0.713 233 0.860
119 0.134 142 0.280 165 0.427 188 0.573 211 0.720 234 0.866
120 0.140 143 0.287 166 0.433 189 0.580 212 0.726 235 0.873
121 0.146 144 0.293 167 0.439 190 0.586 213 0.732 236 0.879
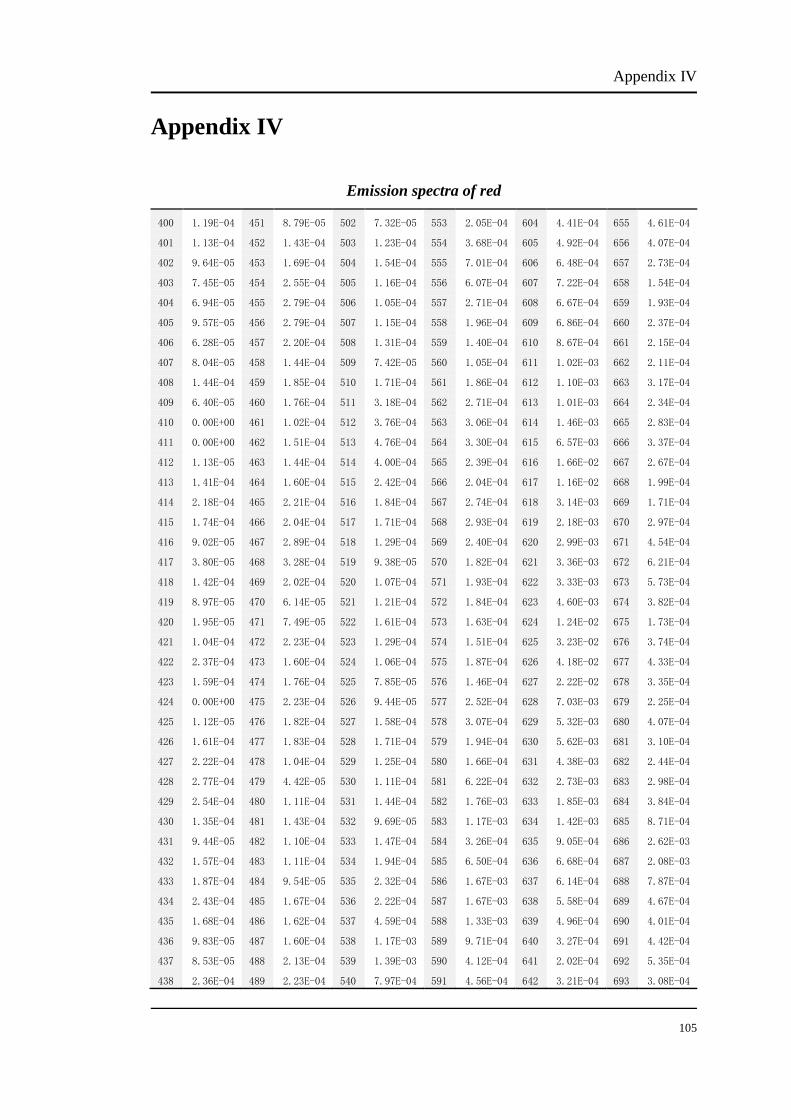
Appendix IV
105
Appendix IV
Emission spectra of red
400 1.19E-04 451 8.79E-05 502 7.32E-05 553 2.05E-04 604 4.41E-04 655 4.61E-04
401 1.13E-04 452 1.43E-04 503 1.23E-04 554 3.68E-04 605 4.92E-04 656 4.07E-04
402 9.64E-05 453 1.69E-04 504 1.54E-04 555 7.01E-04 606 6.48E-04 657 2.73E-04
403 7.45E-05 454 2.55E-04 505 1.16E-04 556 6.07E-04 607 7.22E-04 658 1.54E-04
404 6.94E-05 455 2.79E-04 506 1.05E-04 557 2.71E-04 608 6.67E-04 659 1.93E-04
405 9.57E-05 456 2.79E-04 507 1.15E-04 558 1.96E-04 609 6.86E-04 660 2.37E-04
406 6.28E-05 457 2.20E-04 508 1.31E-04 559 1.40E-04 610 8.67E-04 661 2.15E-04
407 8.04E-05 458 1.44E-04 509 7.42E-05 560 1.05E-04 611 1.02E-03 662 2.11E-04
408 1.44E-04 459 1.85E-04 510 1.71E-04 561 1.86E-04 612 1.10E-03 663 3.17E-04
409 6.40E-05 460 1.76E-04 511 3.18E-04 562 2.71E-04 613 1.01E-03 664 2.34E-04
410 0.00E+00 461 1.02E-04 512 3.76E-04 563 3.06E-04 614 1.46E-03 665 2.83E-04
411 0.00E+00 462 1.51E-04 513 4.76E-04 564 3.30E-04 615 6.57E-03 666 3.37E-04
412 1.13E-05 463 1.44E-04 514 4.00E-04 565 2.39E-04 616 1.66E-02 667 2.67E-04
413 1.41E-04 464 1.60E-04 515 2.42E-04 566 2.04E-04 617 1.16E-02 668 1.99E-04
414 2.18E-04 465 2.21E-04 516 1.84E-04 567 2.74E-04 618 3.14E-03 669 1.71E-04
415 1.74E-04 466 2.04E-04 517 1.71E-04 568 2.93E-04 619 2.18E-03 670 2.97E-04
416 9.02E-05 467 2.89E-04 518 1.29E-04 569 2.40E-04 620 2.99E-03 671 4.54E-04
417 3.80E-05 468 3.28E-04 519 9.38E-05 570 1.82E-04 621 3.36E-03 672 6.21E-04
418 1.42E-04 469 2.02E-04 520 1.07E-04 571 1.93E-04 622 3.33E-03 673 5.73E-04
419 8.97E-05 470 6.14E-05 521 1.21E-04 572 1.84E-04 623 4.60E-03 674 3.82E-04
420 1.95E-05 471 7.49E-05 522 1.61E-04 573 1.63E-04 624 1.24E-02 675 1.73E-04
421 1.04E-04 472 2.23E-04 523 1.29E-04 574 1.51E-04 625 3.23E-02 676 3.74E-04
422 2.37E-04 473 1.60E-04 524 1.06E-04 575 1.87E-04 626 4.18E-02 677 4.33E-04
423 1.59E-04 474 1.76E-04 525 7.85E-05 576 1.46E-04 627 2.22E-02 678 3.35E-04
424 0.00E+00 475 2.23E-04 526 9.44E-05 577 2.52E-04 628 7.03E-03 679 2.25E-04
425 1.12E-05 476 1.82E-04 527 1.58E-04 578 3.07E-04 629 5.32E-03 680 4.07E-04
426 1.61E-04 477 1.83E-04 528 1.71E-04 579 1.94E-04 630 5.62E-03 681 3.10E-04
427 2.22E-04 478 1.04E-04 529 1.25E-04 580 1.66E-04 631 4.38E-03 682 2.44E-04
428 2.77E-04 479 4.42E-05 530 1.11E-04 581 6.22E-04 632 2.73E-03 683 2.98E-04
429 2.54E-04 480 1.11E-04 531 1.44E-04 582 1.76E-03 633 1.85E-03 684 3.84E-04
430 1.35E-04 481 1.43E-04 532 9.69E-05 583 1.17E-03 634 1.42E-03 685 8.71E-04
431 9.44E-05 482 1.10E-04 533 1.47E-04 584 3.26E-04 635 9.05E-04 686 2.62E-03
432 1.57E-04 483 1.11E-04 534 1.94E-04 585 6.50E-04 636 6.68E-04 687 2.08E-03
433 1.87E-04 484 9.54E-05 535 2.32E-04 586 1.67E-03 637 6.14E-04 688 7.87E-04
434 2.43E-04 485 1.67E-04 536 2.22E-04 587 1.67E-03 638 5.58E-04 689 4.67E-04
435 1.68E-04 486 1.62E-04 537 4.59E-04 588 1.33E-03 639 4.96E-04 690 4.01E-04
436 9.83E-05 487 1.60E-04 538 1.17E-03 589 9.71E-04 640 3.27E-04 691 4.42E-04
437 8.53E-05 488 2.13E-04 539 1.39E-03 590 4.12E-04 641 2.02E-04 692 5.35E-04
438 2.36E-04 489 2.23E-04 540 7.97E-04 591 4.56E-04 642 3.21E-04 693 3.08E-04

Appendix IV
106
439 2.44E-04 490 1.51E-04 541 3.42E-04 592 4.91E-04 643 3.77E-04 694 5.18E-04
440 1.95E-04 491 7.63E-05 542 2.89E-04 593 1.52E-03 644 4.09E-04 695 8.19E-04
441 3.20E-04 492 1.16E-04 543 2.83E-04 594 5.42E-03 645 4.16E-04 696 2.08E-03
442 2.67E-04 493 1.13E-04 544 2.95E-04 595 6.33E-03 646 2.27E-04 697 1.72E-03
443 1.39E-04 494 1.81E-04 545 2.18E-04 596 3.59E-03 647 2.52E-04 698 1.23E-03
444 1.39E-04 495 3.14E-04 546 2.02E-04 597 1.09E-03 648 3.17E-04 699 9.98E-04
445 2.17E-04 496 3.54E-04 547 1.69E-04 598 6.59E-04 649 2.58E-04 700 7.97E-04
446 1.85E-04 497 2.38E-04 548 1.65E-04 599 6.18E-04 650 3.03E-04
447 1.72E-04 498 1.43E-04 549 1.42E-04 600 5.14E-04 651 3.96E-04
448 1.74E-04 499 2.06E-04 550 1.56E-04 601 5.10E-04 652 2.50E-04
449 1.48E-04 500 2.10E-04 551 2.10E-04 602 5.88E-04 653 3.29E-04
450 1.24E-04 501 9.10E-05 552 1.89E-04 603 4.53E-04 654 4.76E-04
Emission spectra of green
400 7.25E-06 451 2.13E-04 502 3.60E-03 553 4.68E-03 604 7.95E-04 655 2.77E-04
401 4.72E-05 452 2.98E-04 503 3.76E-03 554 4.59E-03 605 8.13E-04 656 3.47E-04
402 2.56E-05 453 2.90E-04 504 3.92E-03 555 4.48E-03 606 8.87E-04 657 2.95E-04
403 0.00E+00 454 3.91E-04 505 3.97E-03 556 4.40E-03 607 7.72E-04 658 2.43E-04
404 0.00E+00 455 4.04E-04 506 4.05E-03 557 4.32E-03 608 6.16E-04 659 1.84E-04
405 3.43E-05 456 3.96E-04 507 4.20E-03 558 4.28E-03 609 6.55E-04 660 7.05E-06
406 4.96E-05 457 4.23E-04 508 4.36E-03 559 4.08E-03 610 5.15E-04 661 1.06E-04
407 1.02E-05 458 2.05E-04 509 4.42E-03 560 4.01E-03 611 4.61E-04 662 1.33E-04
408 2.49E-05 459 2.72E-04 510 4.58E-03 561 3.93E-03 612 5.42E-04 663 2.49E-04
409 1.17E-04 460 3.52E-04 511 4.75E-03 562 3.88E-03 613 5.27E-04 664 1.57E-04
410 3.19E-05 461 3.25E-04 512 4.83E-03 563 3.81E-03 614 4.37E-04 665 2.42E-04
411 0.00E+00 462 3.45E-04 513 4.98E-03 564 3.66E-03 615 5.68E-04 666 1.44E-04
412 5.65E-06 463 3.23E-04 514 5.02E-03 565 3.57E-03 616 7.31E-04 667 1.07E-04
413 5.50E-05 464 4.13E-04 515 5.06E-03 566 3.38E-03 617 6.81E-04 668 1.22E-04
414 1.20E-04 465 4.95E-04 516 5.23E-03 567 3.29E-03 618 5.22E-04 669 1.51E-06
415 2.58E-04 466 4.64E-04 517 5.32E-03 568 3.18E-03 619 4.75E-04 670 2.69E-05
416 1.39E-04 467 5.52E-04 518 5.31E-03 569 3.03E-03 620 5.23E-04 671 1.24E-04
417 4.03E-06 468 6.51E-04 519 5.41E-03 570 3.03E-03 621 4.35E-04 672 2.59E-04
418 1.53E-05 469 6.99E-04 520 5.50E-03 571 3.04E-03 622 3.27E-04 673 3.12E-04
419 0.00E+00 470 7.88E-04 521 5.55E-03 572 2.89E-03 623 3.26E-04 674 2.78E-04
420 0.00E+00 471 7.89E-04 522 5.63E-03 573 2.75E-03 624 4.42E-04 675 1.56E-04
421 2.61E-05 472 8.09E-04 523 5.66E-03 574 2.66E-03 625 5.80E-04 676 1.60E-04
422 1.29E-04 473 8.45E-04 524 5.70E-03 575 2.62E-03 626 7.20E-04 677 1.54E-04
423 1.31E-04 474 8.73E-04 525 5.71E-03 576 2.53E-03 627 5.73E-04 678 1.30E-04
424 3.20E-05 475 1.07E-03 526 5.77E-03 577 2.43E-03 628 5.32E-04 679 1.21E-04
425 8.44E-05 476 1.08E-03 527 5.79E-03 578 2.38E-03 629 3.99E-04 680 4.10E-04
426 7.21E-05 477 1.10E-03 528 5.72E-03 579 2.25E-03 630 3.65E-04 681 2.81E-04
427 4.40E-06 478 1.15E-03 529 5.72E-03 580 2.16E-03 631 3.75E-04 682 4.72E-05
428 1.03E-04 479 1.24E-03 530 5.74E-03 581 2.14E-03 632 3.14E-04 683 1.74E-04

Appendix IV
107
429 1.72E-04 480 1.31E-03 531 5.71E-03 582 2.02E-03 633 2.83E-04 684 2.94E-04
430 1.44E-04 481 1.29E-03 532 5.67E-03 583 1.95E-03 634 3.78E-04 685 2.17E-04
431 1.75E-04 482 1.42E-03 533 5.71E-03 584 1.89E-03 635 2.21E-04 686 2.40E-04
432 1.84E-04 483 1.61E-03 534 5.65E-03 585 1.82E-03 636 1.52E-04 687 2.19E-04
433 1.22E-04 484 1.70E-03 535 5.65E-03 586 1.68E-03 637 2.66E-04 688 4.44E-04
434 1.57E-04 485 1.72E-03 536 5.65E-03 587 1.58E-03 638 2.06E-04 689 2.51E-04
435 1.58E-04 486 1.77E-03 537 5.56E-03 588 1.51E-03 639 2.23E-04 690 1.14E-04
436 5.69E-05 487 1.92E-03 538 5.49E-03 589 1.52E-03 640 1.66E-04 691 8.55E-05
437 1.33E-04 488 2.05E-03 539 5.47E-03 590 1.35E-03 641 8.03E-05 692 2.25E-04
438 3.27E-04 489 2.13E-03 540 5.51E-03 591 1.28E-03 642 1.98E-04 693 1.99E-04
439 3.43E-04 490 2.20E-03 541 5.42E-03 592 1.25E-03 643 2.84E-04 694 1.08E-04
440 3.33E-04 491 2.33E-03 542 5.29E-03 593 1.18E-03 644 3.34E-04 695 0.00E+00
441 4.21E-04 492 2.47E-03 543 5.21E-03 594 1.21E-03 645 2.51E-04 696 7.05E-05
442 3.80E-04 493 2.55E-03 544 5.20E-03 595 1.15E-03 646 2.87E-05 697 2.63E-04
443 2.09E-04 494 2.69E-03 545 5.20E-03 596 1.16E-03 647 9.97E-05 698 4.33E-04
444 2.42E-04 495 2.76E-03 546 5.16E-03 597 1.12E-03 648 2.88E-04 699 2.03E-04
445 2.44E-04 496 2.84E-03 547 5.08E-03 598 1.06E-03 649 1.96E-04 700 2.61E-04
446 1.20E-04 497 3.00E-03 548 5.00E-03 599 1.00E-03 650 1.35E-04
447 1.65E-04 498 3.11E-03 549 4.96E-03 600 9.43E-04 651 2.67E-04
448 2.93E-04 499 3.23E-03 550 4.84E-03 601 8.68E-04 652 1.93E-04
449 3.58E-04 500 3.38E-03 551 4.80E-03 602 9.07E-04 653 2.20E-04
450 2.97E-04 501 3.44E-03 552 4.77E-03 603 8.44E-04 654 2.57E-04
Emission spectra of blue
400 8.84E-04 451 6.32E-03 502 1.07E-03 553 1.23E-04 604 7.66E-05 655 2.40E-04
401 1.04E-03 452 6.30E-03 503 1.06E-03 554 1.57E-04 605 2.98E-05 656 2.54E-04
402 1.15E-03 453 6.12E-03 504 1.05E-03 555 1.85E-04 606 6.57E-05 657 7.06E-05
403 1.17E-03 454 6.14E-03 505 9.93E-04 556 1.32E-04 607 2.10E-05 658 0.00E+00
404 1.20E-03 455 6.18E-03 506 9.42E-04 557 1.42E-04 608 0.00E+00 659 2.49E-05
405 1.25E-03 456 6.08E-03 507 9.33E-04 558 2.25E-04 609 9.13E-05 660 3.60E-06
406 1.43E-03 457 5.85E-03 508 8.34E-04 559 1.72E-04 610 4.72E-05 661 0.00E+00
407 1.60E-03 458 5.72E-03 509 7.66E-04 560 1.16E-04 611 1.71E-06 662 1.06E-05
408 1.69E-03 459 5.60E-03 510 7.76E-04 561 1.21E-04 612 5.89E-05 663 1.27E-04
409 1.79E-03 460 5.58E-03 511 7.26E-04 562 1.82E-04 613 3.01E-05 664 5.47E-05
410 1.76E-03 461 5.50E-03 512 6.87E-04 563 1.69E-04 614 0.00E+00 665 5.57E-05
411 1.90E-03 462 5.44E-03 513 6.77E-04 564 1.88E-04 615 5.79E-05 666 5.98E-05
412 2.20E-03 463 5.44E-03 514 6.24E-04 565 1.24E-04 616 2.65E-04 667 6.13E-05
413 2.46E-03 464 5.25E-03 515 6.16E-04 566 9.28E-05 617 2.72E-04 668 7.41E-05
414 2.69E-03 465 5.14E-03 516 6.10E-04 567 1.73E-04 618 1.59E-04 669 1.04E-04
415 2.69E-03 466 4.94E-03 517 5.57E-04 568 1.22E-04 619 2.75E-05 670 0.00E+00
416 2.81E-03 467 4.78E-03 518 4.81E-04 569 7.28E-05 620 1.23E-05 671 8.15E-05
417 2.99E-03 468 4.72E-03 519 4.51E-04 570 3.55E-05 621 3.97E-05 672 2.44E-04
418 3.10E-03 469 4.62E-03 520 4.65E-04 571 6.69E-05 622 0.00E+00 673 3.13E-04
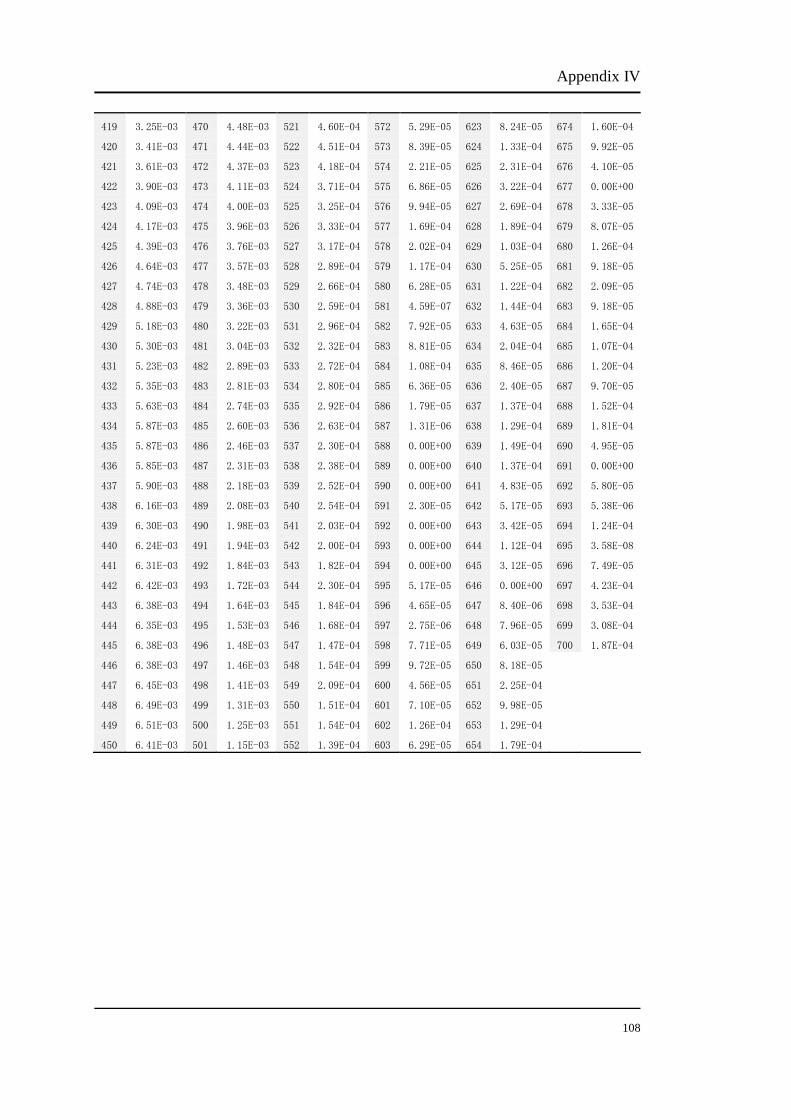
Appendix IV
108
419 3.25E-03 470 4.48E-03 521 4.60E-04 572 5.29E-05 623 8.24E-05 674 1.60E-04
420 3.41E-03 471 4.44E-03 522 4.51E-04 573 8.39E-05 624 1.33E-04 675 9.92E-05
421 3.61E-03 472 4.37E-03 523 4.18E-04 574 2.21E-05 625 2.31E-04 676 4.10E-05
422 3.90E-03 473 4.11E-03 524 3.71E-04 575 6.86E-05 626 3.22E-04 677 0.00E+00
423 4.09E-03 474 4.00E-03 525 3.25E-04 576 9.94E-05 627 2.69E-04 678 3.33E-05
424 4.17E-03 475 3.96E-03 526 3.33E-04 577 1.69E-04 628 1.89E-04 679 8.07E-05
425 4.39E-03 476 3.76E-03 527 3.17E-04 578 2.02E-04 629 1.03E-04 680 1.26E-04
426 4.64E-03 477 3.57E-03 528 2.89E-04 579 1.17E-04 630 5.25E-05 681 9.18E-05
427 4.74E-03 478 3.48E-03 529 2.66E-04 580 6.28E-05 631 1.22E-04 682 2.09E-05
428 4.88E-03 479 3.36E-03 530 2.59E-04 581 4.59E-07 632 1.44E-04 683 9.18E-05
429 5.18E-03 480 3.22E-03 531 2.96E-04 582 7.92E-05 633 4.63E-05 684 1.65E-04
430 5.30E-03 481 3.04E-03 532 2.32E-04 583 8.81E-05 634 2.04E-04 685 1.07E-04
431 5.23E-03 482 2.89E-03 533 2.72E-04 584 1.08E-04 635 8.46E-05 686 1.20E-04
432 5.35E-03 483 2.81E-03 534 2.80E-04 585 6.36E-05 636 2.40E-05 687 9.70E-05
433 5.63E-03 484 2.74E-03 535 2.92E-04 586 1.79E-05 637 1.37E-04 688 1.52E-04
434 5.87E-03 485 2.60E-03 536 2.63E-04 587 1.31E-06 638 1.29E-04 689 1.81E-04
435 5.87E-03 486 2.46E-03 537 2.30E-04 588 0.00E+00 639 1.49E-04 690 4.95E-05
436 5.85E-03 487 2.31E-03 538 2.38E-04 589 0.00E+00 640 1.37E-04 691 0.00E+00
437 5.90E-03 488 2.18E-03 539 2.52E-04 590 0.00E+00 641 4.83E-05 692 5.80E-05
438 6.16E-03 489 2.08E-03 540 2.54E-04 591 2.30E-05 642 5.17E-05 693 5.38E-06
439 6.30E-03 490 1.98E-03 541 2.03E-04 592 0.00E+00 643 3.42E-05 694 1.24E-04
440 6.24E-03 491 1.94E-03 542 2.00E-04 593 0.00E+00 644 1.12E-04 695 3.58E-08
441 6.31E-03 492 1.84E-03 543 1.82E-04 594 0.00E+00 645 3.12E-05 696 7.49E-05
442 6.42E-03 493 1.72E-03 544 2.30E-04 595 5.17E-05 646 0.00E+00 697 4.23E-04
443 6.38E-03 494 1.64E-03 545 1.84E-04 596 4.65E-05 647 8.40E-06 698 3.53E-04
444 6.35E-03 495 1.53E-03 546 1.68E-04 597 2.75E-06 648 7.96E-05 699 3.08E-04
445 6.38E-03 496 1.48E-03 547 1.47E-04 598 7.71E-05 649 6.03E-05 700 1.87E-04
446 6.38E-03 497 1.46E-03 548 1.54E-04 599 9.72E-05 650 8.18E-05
447 6.45E-03 498 1.41E-03 549 2.09E-04 600 4.56E-05 651 2.25E-04
448 6.49E-03 499 1.31E-03 550 1.51E-04 601 7.10E-05 652 9.98E-05
449 6.51E-03 500 1.25E-03 551 1.54E-04 602 1.26E-04 653 1.29E-04
450 6.41E-03 501 1.15E-03 552 1.39E-04 603 6.29E-05 654 1.79E-04
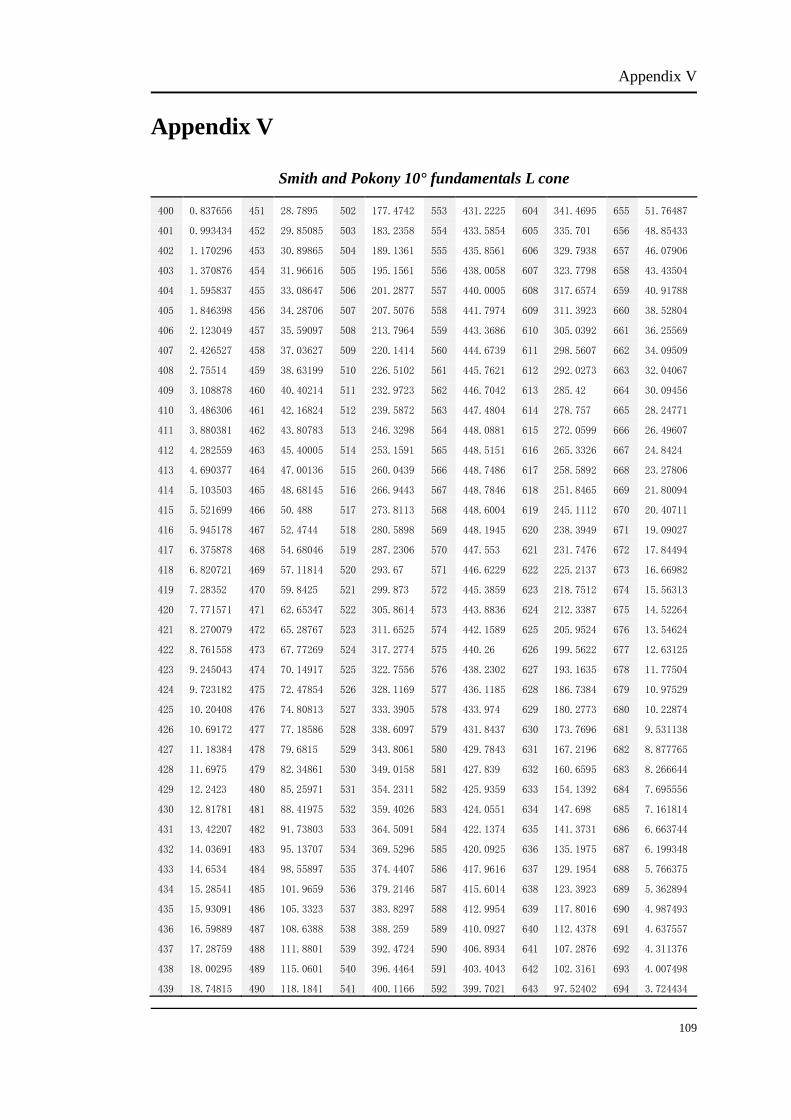
Appendix V
109
Appendix V
Smith and Pokony 10° fundamentals L cone
400 0.837656 451 28.7895 502 177.4742 553 431.2225 604 341.4695 655 51.76487
401 0.993434 452 29.85085 503 183.2358 554 433.5854 605 335.701 656 48.85433
402 1.170296 453 30.89865 504 189.1361 555 435.8561 606 329.7938 657 46.07906
403 1.370876 454 31.96616 505 195.1561 556 438.0058 607 323.7798 658 43.43504
404 1.595837 455 33.08647 506 201.2877 557 440.0005 608 317.6574 659 40.91788
405 1.846398 456 34.28706 507 207.5076 558 441.7974 609 311.3923 660 38.52804
406 2.123049 457 35.59097 508 213.7964 559 443.3686 610 305.0392 661 36.25569
407 2.426527 458 37.03627 509 220.1414 560 444.6739 611 298.5607 662 34.09509
408 2.75514 459 38.63199 510 226.5102 561 445.7621 612 292.0273 663 32.04067
409 3.108878 460 40.40214 511 232.9723 562 446.7042 613 285.42 664 30.09456
410 3.486306 461 42.16824 512 239.5872 563 447.4804 614 278.757 665 28.24771
411 3.880381 462 43.80783 513 246.3298 564 448.0881 615 272.0599 666 26.49607
412 4.282559 463 45.40005 514 253.1591 565 448.5151 616 265.3326 667 24.8424
413 4.690377 464 47.00136 515 260.0439 566 448.7486 617 258.5892 668 23.27806
414 5.103503 465 48.68145 516 266.9443 567 448.7846 618 251.8465 669 21.80094
415 5.521699 466 50.488 517 273.8113 568 448.6004 619 245.1112 670 20.40711
416 5.945178 467 52.4744 518 280.5898 569 448.1945 620 238.3949 671 19.09027
417 6.375878 468 54.68046 519 287.2306 570 447.553 621 231.7476 672 17.84494
418 6.820721 469 57.11814 520 293.67 571 446.6229 622 225.2137 673 16.66982
419 7.28352 470 59.8425 521 299.873 572 445.3859 623 218.7512 674 15.56313
420 7.771571 471 62.65347 522 305.8614 573 443.8836 624 212.3387 675 14.52264
421 8.270079 472 65.28767 523 311.6525 574 442.1589 625 205.9524 676 13.54624
422 8.761558 473 67.77269 524 317.2774 575 440.26 626 199.5622 677 12.63125
423 9.245043 474 70.14917 525 322.7556 576 438.2302 627 193.1635 678 11.77504
424 9.723182 475 72.47854 526 328.1169 577 436.1185 628 186.7384 679 10.97529
425 10.20408 476 74.80813 527 333.3905 578 433.974 629 180.2773 680 10.22874
426 10.69172 477 77.18586 528 338.6097 579 431.8437 630 173.7696 681 9.531138
427 11.18384 478 79.6815 529 343.8061 580 429.7843 631 167.2196 682 8.877765
428 11.6975 479 82.34861 530 349.0158 581 427.839 632 160.6595 683 8.266644
429 12.2423 480 85.25971 531 354.2311 582 425.9359 633 154.1392 684 7.695556
430 12.81781 481 88.41975 532 359.4026 583 424.0551 634 147.698 685 7.161814
431 13.42207 482 91.73803 533 364.5091 584 422.1374 635 141.3731 686 6.663744
432 14.03691 483 95.13707 534 369.5296 585 420.0925 636 135.1975 687 6.199348
433 14.6534 484 98.55897 535 374.4407 586 417.9616 637 129.1954 688 5.766375
434 15.28541 485 101.9659 536 379.2146 587 415.6014 638 123.3923 689 5.362894
435 15.93091 486 105.3323 537 383.8297 588 412.9954 639 117.8016 690 4.987493
436 16.59889 487 108.6388 538 388.259 589 410.0927 640 112.4378 691 4.637557
437 17.28759 488 111.8801 539 392.4724 590 406.8934 641 107.2876 692 4.311376
438 18.00295 489 115.0601 540 396.4464 591 403.4043 642 102.3161 693 4.007498
439 18.74815 490 118.1841 541 400.1166 592 399.7021 643 97.52402 694 3.724434
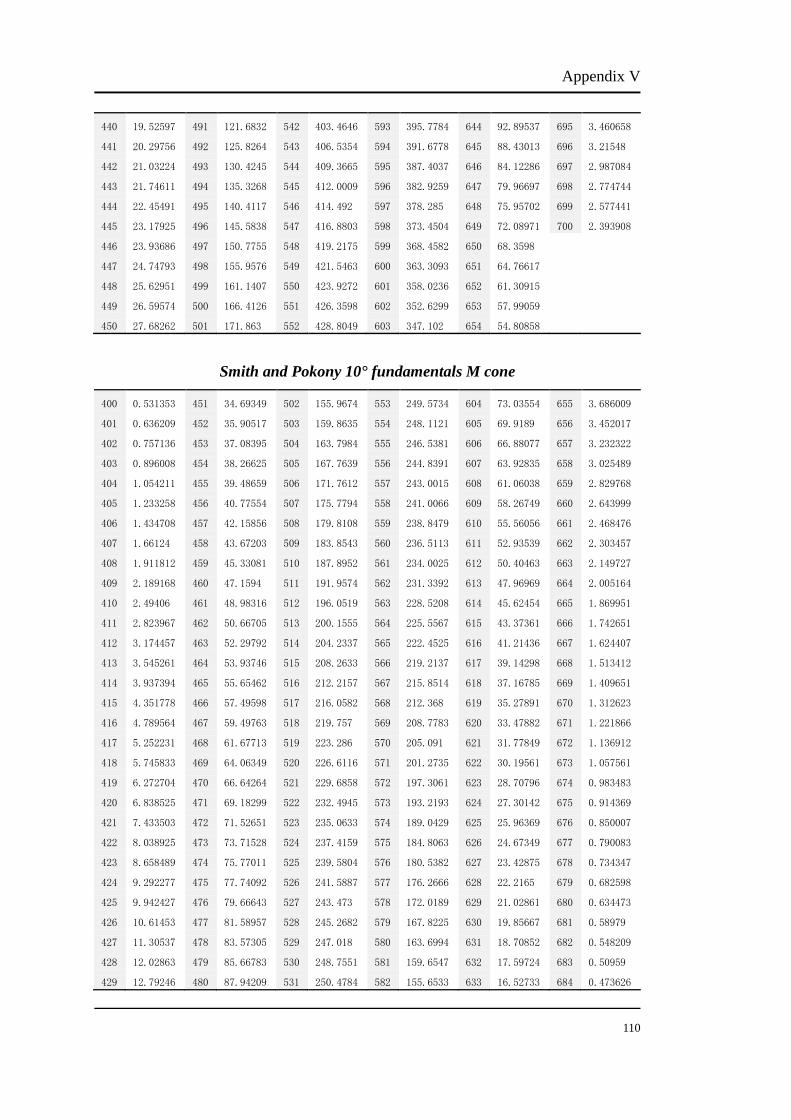
Appendix V
110
440 19.52597 491 121.6832 542 403.4646 593 395.7784 644 92.89537 695 3.460658
441 20.29756 492 125.8264 543 406.5354 594 391.6778 645 88.43013 696 3.21548
442 21.03224 493 130.4245 544 409.3665 595 387.4037 646 84.12286 697 2.987084
443 21.74611 494 135.3268 545 412.0009 596 382.9259 647 79.96697 698 2.774744
444 22.45491 495 140.4117 546 414.492 597 378.285 648 75.95702 699 2.577441
445 23.17925 496 145.5838 547 416.8803 598 373.4504 649 72.08971 700 2.393908
446 23.93686 497 150.7755 548 419.2175 599 368.4582 650 68.3598
447 24.74793 498 155.9576 549 421.5463 600 363.3093 651 64.76617
448 25.62951 499 161.1407 550 423.9272 601 358.0236 652 61.30915
449 26.59574 500 166.4126 551 426.3598 602 352.6299 653 57.99059
450 27.68262 501 171.863 552 428.8049 603 347.102 654 54.80858
Smith and Pokony 10° fundamentals M cone
400 0.531353 451 34.69349 502 155.9674 553 249.5734 604 73.03554 655 3.686009
401 0.636209 452 35.90517 503 159.8635 554 248.1121 605 69.9189 656 3.452017
402 0.757136 453 37.08395 504 163.7984 555 246.5381 606 66.88077 657 3.232322
403 0.896008 454 38.26625 505 167.7639 556 244.8391 607 63.92835 658 3.025489
404 1.054211 455 39.48659 506 171.7612 557 243.0015 608 61.06038 659 2.829768
405 1.233258 456 40.77554 507 175.7794 558 241.0066 609 58.26749 660 2.643999
406 1.434708 457 42.15856 508 179.8108 559 238.8479 610 55.56056 661 2.468476
407 1.66124 458 43.67203 509 183.8543 560 236.5113 611 52.93539 662 2.303457
408 1.911812 459 45.33081 510 187.8952 561 234.0025 612 50.40463 663 2.149727
409 2.189168 460 47.1594 511 191.9574 562 231.3392 613 47.96969 664 2.005164
410 2.49406 461 48.98316 512 196.0519 563 228.5208 614 45.62454 665 1.869951
411 2.823967 462 50.66705 513 200.1555 564 225.5567 615 43.37361 666 1.742651
412 3.174457 463 52.29792 514 204.2337 565 222.4525 616 41.21436 667 1.624407
413 3.545261 464 53.93746 515 208.2633 566 219.2137 617 39.14298 668 1.513412
414 3.937394 465 55.65462 516 212.2157 567 215.8514 618 37.16785 669 1.409651
415 4.351778 466 57.49598 517 216.0582 568 212.368 619 35.27891 670 1.312623
416 4.789564 467 59.49763 518 219.757 569 208.7783 620 33.47882 671 1.221866
417 5.252231 468 61.67713 519 223.286 570 205.091 621 31.77849 672 1.136912
418 5.745833 469 64.06349 520 226.6116 571 201.2735 622 30.19561 673 1.057561
419 6.272704 470 66.64264 521 229.6858 572 197.3061 623 28.70796 674 0.983483
420 6.838525 471 69.18299 522 232.4945 573 193.2193 624 27.30142 675 0.914369
421 7.433503 472 71.52651 523 235.0633 574 189.0429 625 25.96369 676 0.850007
422 8.038925 473 73.71528 524 237.4159 575 184.8063 626 24.67349 677 0.790083
423 8.658489 474 75.77011 525 239.5804 576 180.5382 627 23.42875 678 0.734347
424 9.292277 475 77.74092 526 241.5887 577 176.2666 628 22.2165 679 0.682598
425 9.942427 476 79.66643 527 243.473 578 172.0189 629 21.02861 680 0.634473
426 10.61453 477 81.58957 528 245.2682 579 167.8225 630 19.85667 681 0.58979
427 11.30537 478 83.57305 529 247.018 580 163.6994 631 18.70852 682 0.548209
428 12.02863 479 85.66783 530 248.7551 581 159.6547 632 17.59724 683 0.50959
429 12.79246 480 87.94209 531 250.4784 582 155.6533 633 16.52733 684 0.473626
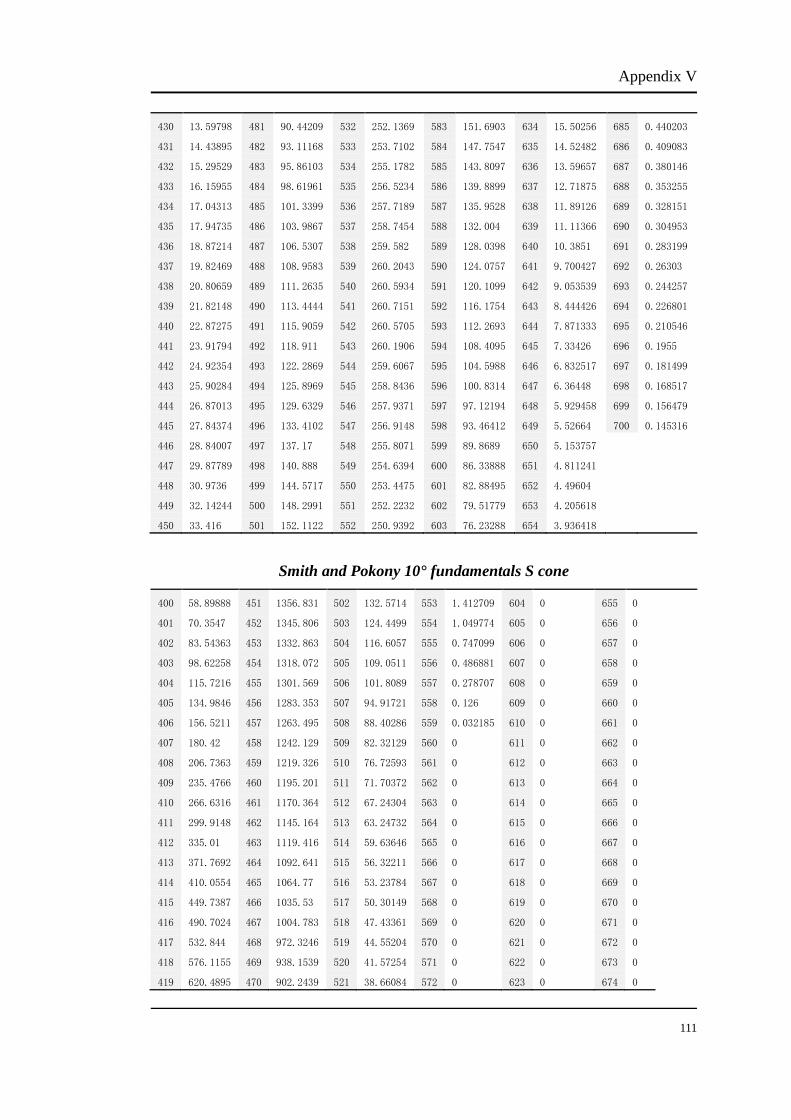
Appendix V
111
430 13.59798 481 90.44209 532 252.1369 583 151.6903 634 15.50256 685 0.440203
431 14.43895 482 93.11168 533 253.7102 584 147.7547 635 14.52482 686 0.409083
432 15.29529 483 95.86103 534 255.1782 585 143.8097 636 13.59657 687 0.380146
433 16.15955 484 98.61961 535 256.5234 586 139.8899 637 12.71875 688 0.353255
434 17.04313 485 101.3399 536 257.7189 587 135.9528 638 11.89126 689 0.328151
435 17.94735 486 103.9867 537 258.7454 588 132.004 639 11.11366 690 0.304953
436 18.87214 487 106.5307 538 259.582 589 128.0398 640 10.3851 691 0.283199
437 19.82469 488 108.9583 539 260.2043 590 124.0757 641 9.700427 692 0.26303
438 20.80659 489 111.2635 540 260.5934 591 120.1099 642 9.053539 693 0.244257
439 21.82148 490 113.4444 541 260.7151 592 116.1754 643 8.444426 694 0.226801
440 22.87275 491 115.9059 542 260.5705 593 112.2693 644 7.871333 695 0.210546
441 23.91794 492 118.911 543 260.1906 594 108.4095 645 7.33426 696 0.1955
442 24.92354 493 122.2869 544 259.6067 595 104.5988 646 6.832517 697 0.181499
443 25.90284 494 125.8969 545 258.8436 596 100.8314 647 6.36448 698 0.168517
444 26.87013 495 129.6329 546 257.9371 597 97.12194 648 5.929458 699 0.156479
445 27.84374 496 133.4102 547 256.9148 598 93.46412 649 5.52664 700 0.145316
446 28.84007 497 137.17 548 255.8071 599 89.8689 650 5.153757
447 29.87789 498 140.888 549 254.6394 600 86.33888 651 4.811241
448 30.9736 499 144.5717 550 253.4475 601 82.88495 652 4.49604
449 32.14244 500 148.2991 551 252.2232 602 79.51779 653 4.205618
450 33.416 501 152.1122 552 250.9392 603 76.23288 654 3.936418
Smith and Pokony 10° fundamentals S cone
400 58.89888 451 1356.831 502 132.5714 553 1.412709 604 0 655 0
401 70.3547 452 1345.806 503 124.4499 554 1.049774 605 0 656 0
402 83.54363 453 1332.863 504 116.6057 555 0.747099 606 0 657 0
403 98.62258 454 1318.072 505 109.0511 556 0.486881 607 0 658 0
404 115.7216 455 1301.569 506 101.8089 557 0.278707 608 0 659 0
405 134.9846 456 1283.353 507 94.91721 558 0.126 609 0 660 0
406 156.5211 457 1263.495 508 88.40286 559 0.032185 610 0 661 0
407 180.42 458 1242.129 509 82.32129 560 0 611 0 662 0
408 206.7363 459 1219.326 510 76.72593 561 0 612 0 663 0
409 235.4766 460 1195.201 511 71.70372 562 0 613 0 664 0
410 266.6316 461 1170.364 512 67.24304 563 0 614 0 665 0
411 299.9148 462 1145.164 513 63.24732 564 0 615 0 666 0
412 335.01 463 1119.416 514 59.63646 565 0 616 0 667 0
413 371.7692 464 1092.641 515 56.32211 566 0 617 0 668 0
414 410.0554 465 1064.77 516 53.23784 567 0 618 0 669 0
415 449.7387 466 1035.53 517 50.30149 568 0 619 0 670 0
416 490.7024 467 1004.783 518 47.43361 569 0 620 0 671 0
417 532.844 468 972.3246 519 44.55204 570 0 621 0 672 0
418 576.1155 469 938.1539 520 41.57254 571 0 622 0 673 0
419 620.4895 470 902.2439 521 38.66084 572 0 623 0 674 0
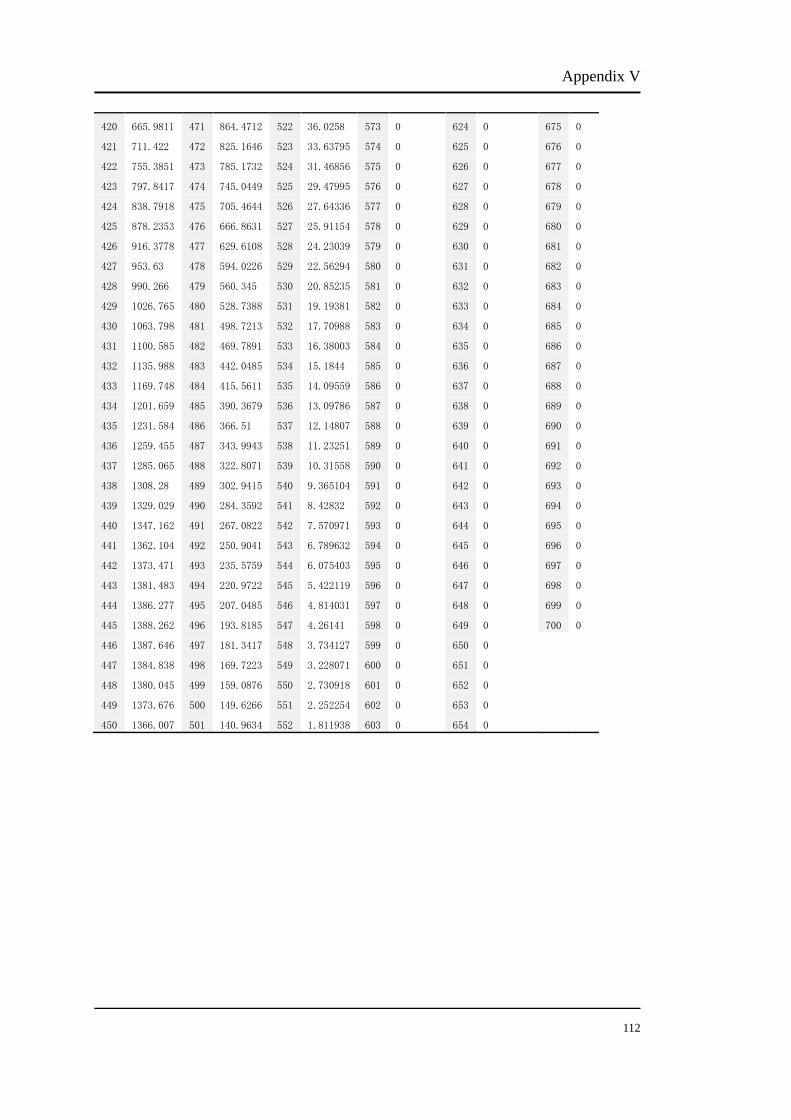
Appendix V
112
420 665.9811 471 864.4712 522 36.0258 573 0 624 0 675 0
421 711.422 472 825.1646 523 33.63795 574 0 625 0 676 0
422 755.3851 473 785.1732 524 31.46856 575 0 626 0 677 0
423 797.8417 474 745.0449 525 29.47995 576 0 627 0 678 0
424 838.7918 475 705.4644 526 27.64336 577 0 628 0 679 0
425 878.2353 476 666.8631 527 25.91154 578 0 629 0 680 0
426 916.3778 477 629.6108 528 24.23039 579 0 630 0 681 0
427 953.63 478 594.0226 529 22.56294 580 0 631 0 682 0
428 990.266 479 560.345 530 20.85235 581 0 632 0 683 0
429 1026.765 480 528.7388 531 19.19381 582 0 633 0 684 0
430 1063.798 481 498.7213 532 17.70988 583 0 634 0 685 0
431 1100.585 482 469.7891 533 16.38003 584 0 635 0 686 0
432 1135.988 483 442.0485 534 15.1844 585 0 636 0 687 0
433 1169.748 484 415.5611 535 14.09559 586 0 637 0 688 0
434 1201.659 485 390.3679 536 13.09786 587 0 638 0 689 0
435 1231.584 486 366.51 537 12.14807 588 0 639 0 690 0
436 1259.455 487 343.9943 538 11.23251 589 0 640 0 691 0
437 1285.065 488 322.8071 539 10.31558 590 0 641 0 692 0
438 1308.28 489 302.9415 540 9.365104 591 0 642 0 693 0
439 1329.029 490 284.3592 541 8.42832 592 0 643 0 694 0
440 1347.162 491 267.0822 542 7.570971 593 0 644 0 695 0
441 1362.104 492 250.9041 543 6.789632 594 0 645 0 696 0
442 1373.471 493 235.5759 544 6.075403 595 0 646 0 697 0
443 1381.483 494 220.9722 545 5.422119 596 0 647 0 698 0
444 1386.277 495 207.0485 546 4.814031 597 0 648 0 699 0
445 1388.262 496 193.8185 547 4.26141 598 0 649 0 700 0
446 1387.646 497 181.3417 548 3.734127 599 0 650 0
447 1384.838 498 169.7223 549 3.228071 600 0 651 0
448 1380.045 499 159.0876 550 2.730918 601 0 652 0
449 1373.676 500 149.6266 551 2.252254 602 0 653 0
450 1366.007 501 140.9634 552 1.811938 603 0 654 0