conductivity study of microemulsions: dependence of structural behavior of water/oil systems on...
TRANSCRIPT

350 J . Phys. Chem. 1990, 94, 350-355
fluid/microemulsion systems. The results presented above include several that will influence the choice of conditions for the inverse microemulsion polymerization of acrylamide within near-critical or supercritical continuous phases.
First, as in other C,E,/water/alkane systems, acrylamide acts as a cosurfactant, implying that it resides in the interfacial region (as opposed to the micelle core). This cosurfactant behavior of acrylamide is useful in that it allows study of microemulsions using the Brij surfactants at room temperature in propane or ethane continuous phases yet may cause some difficulties during the course of a polymerization. As acrylamide is consumed during polymerization, a point may be reached where insufficient co- surfactant remains to stabilize the microemulsion. In addition, the mobility of the acrylamide, and thus its accessibility to a reacting chain, may be hindered by coordination about the ethylene oxide units of the surfactant.
Second, the density and temperature of the continuous phase appear to determine the phase boundary, rather than the pressure or composition, at least in mixtures of ethane and propane. This may be due to the nearly ideal mixing behavior exhibited by ethane and propane or their thermodynamic similarity relative to the C,, alkane tail of the surfactant. However, we currently have no evidence regarding preferential clustering of either the ethane or the propane in the neighborhood of the micelle’s outer shell. Finally, we can increase the total volume fraction of the dispersed phase while lowering the pressure required to stabilize the mi-
croemulsion, although increasing 4 reduces the temperature range over which the microemulsion is stable.
Significantly, many of the present observations made can be explained by using methodologies developed for C,E,/water/alkane systems at atmospheric pressure, combined with consideration of high-pressure liquid-liquid-phase behavior. Thus, either the generalized ternary-phase diagrams of KahlweitZ3 or the more structural analysis of Hou and ShahZS can be invoked to explain the observed cosurfactant behavior of acrylamide and the effect of dispersed-phase loading on stability. The effect of pressure on the microemulsion phase behavior can be seen in light of the effects of pressure on the various two-component phase diagrams (that of water/oil, surfactant/oil, and surfactant/water, which combine to form the three-component prism) or in view of in- creased screening of micelle-micelle attractive interactions. In a future paper, we explore the effects of pressure, temperature, and composition on the structure of the microemulsion.
Acknowledgment. We thank the U S . Army Research Office for their support of this work through Contract No. DAAL03- 87-K-0137. We also appreciate the helpful discussions and suggestions of E. W. Kaler (University of Washington) and J. L. Fulton (of our laboratory).
Registry No. 852,9004-95-9; B30,9002-92-0; AM, 79-06-1; ethane, 74-84-0; propane, 74-98-6.
Conductivity Study of Microemulsions. Dependence of Structural Behavior of Water/Oil Systems on Surfactant, Cosurfactant, Oil, and Temperature
Satyaranjan Bisal, Pranab Kumar Bhattacharya, and Satya Priya Moulik* Department of CBemistry, Jadavpur University, Calcutta 700 032, India (Received: December 21, 1988; In Final Form: July 14, 1989)
Structural features of w/o microemulsions have been conductometrically evaluated. The radius of the water pool, the effective radius of the droplets, their number per unit volume, the effective surface area of the water pool, and the aggregation number of the surfactant and cosurfactant molecules per droplet in the oil/water interphase have been estimated. Three oils (n-heptane, n-decane, and xylene), three surfactants (CTAB, SDS, and AOT) and two cosurfactants (1-butanol and n-hexylamine) have been used; their effects on the structural properties of microemulsions have been studied at two different temperatures, 293 and 303 K, at two weight ratios of surfactant/cosurfactant, 0.33 and 0.50. The droplet radius has been found to be oil dependent and follows the order n-heptane < n-decane < xylene. The values at 293 K are greater than those at 303 K. The dependence of the radius on the surfactant is in the order SDS > AOT > CTAB. I-Butanol yields greater radius than n-hexylamine with SDS and AOT, and the order is reversed with CTAB. The aggregation number of the surfactant and cosurfactant per droplet increases and decreases, respectively, with elevation of temperature. The RJRw (ratio of the effective radius of the droplet and the radius of its water core) remains fairly constant under all situations, the average value being 1 .I5 f 0.10.
Introduction With the progress of the studies on microemulsions, the
knowledge on their structure has become inevitably important. Methods used toward the understanding of the microdroplet dimensions of w o type systems have been ultracentrifugation,1-2 light scattering,i8 small-angle neutron and X-ray scattering,9-”
( I ) Eicke, H. F.; Rehak, J . Helu. Chim. Acta 1976, 59, 2883. (2) Robinson, B. H.; Steyler, D. C.; Tack, R. D. J. Chem. Soc., Faraday
(3) Zulauf, M.; Eicke, H. F. J. Phys. Chem. 1979, 83, 480. (4) Nicholson. J. D.; Clarke, J. H. R. In Surfactant in Solution; Mittal,
( 5 ) Sein, E.; Lalanne, J . R.; Buchert, J.; Kielich, S. J. Colloid Interface
(6) Day, R. A.; Robinson, B. H.; Clarke, J. H. R.; Doherty, J. V. J . Chem.
(7) Gulari. E.; Bedwell, B.; Alkhafaji, S . J. Colloid Interface Sci. 1980,
Trans. I 1979, 75, 48 I .
K., Lindman, B., Eds.; Plenum: New York, 1984; Vol. 3, 1663.
Sci. 1979, 72, 363.
Soc., Faraday Trans. I 1979, 75, 132.
77, 202.
and time-resolved fluorescence.18-21 Most studies in this area have been on AOT-derived w/o systems in which the requirement
(8) Clarke, J. H. R.; Nicholson, J. D.; Regan, K. N. J. Chem. Soc., Far-
(9) Cabos, C.; Delord, P. J. Appl. Crystallogr. 1979, 12, 502. (10) Robinson, B. H.; Toprakciaglu, C.; Dore, J. C.; Chieux, P. J. Chem.
( I I ) Toprakciaglu, C.; Dore, J. C.; Robinson, B. H.; Howe, A. J . Chem.
(12) Kotlarchyk, M.; Chen, S. H.; Huang, J. S. J. Phys. Chem. 1982,86,
aday Trans. I 1985, 81, 1173.
Sor., Faraday Trans. I 1984,80, 13.
Soc., Faraday Trans. I 1984, 80, 413.
,979 J L I J .
(13) Kotlarchyk, M.; Chen, S . H.; Huang, J. S.; Kim, M. W. Phys. Reo.
(14) Kotlarchyk, M.; Huang, J. S . ; Chen, S . H. J. Phys. Chem. 1985,89, A 1984, 29, 2054.
4382.
35. ( 1 5 ) Assih, T.; Larche, F.; Delord, P. J. Colloid Interface Sci. 1982, 89,
(16) Cabos, C.; Marignan, J. J. Phys. Lett. 1985, 46, L-267. (17) Pileni, M. P.; Zemb, T.; Petit, C. Chem. Phys. Letr. 1985, 118, 414.
0022-3654/90/2094-0350$02.50/0 0 1990 American Chemical Society

Conductivity Study of Microemulsions
of cosurfactant may not be essential. The dynamic method of conductance has been shown to be able
to give information about the percolation states of many micro- emulsion system^.^^-^^ Lagourette et aLz5 and Lagues et a1.26 have proposed and tested conductivity equations for microemulsions near the percolation threshold. Recently Fang and Venable2' have used the conductivity method for the elucidation of the structure of w/o microemulsion of heptane using SDS as surfactant and hexylamine as cosurfactant. They have applied the effective medium theory of conductance on their system and have been able to derive the size and number of microemulsion droplets as well as the ratio of the surfactant and cosurfactant molecules that remain associated on the particle surface. The effective medium theory of conductance has been also used by others on micro- emulsions .28-3O
We have used the effective medium theory of conductance in the past for deriving information on the axial ratio and hydration of globular proteins3' and the dimension as well as hydration of micelle^.^^,^^ It is understood that the method is useful and can extract potential information about the structural characteristics of different w/o microemulsion systems. Herein we report the conductometric evaluation of the structure of several w/o mi- croemulsion systems at two different temperatures using CTAB, SDS, and AOT as surfactants, 1-butanol, and n-hexylamine as cosurfactants and n-heptane, n-decane, and xylene as oils. It will be seen that the results are consistent to help understanding the effects of the nature of the surfactant, cosurfactant, and oil on the microscopic state of the studied w/o systems. It is to be mentioned that, although AOT can form microemulsion without a cosurfactant, we have used it in combination with I-butanol and n-hexylamine to compare its behavior under similar conditions with CTAB and SDS.
Experimental Section Materials. The chemical characteristics of all the components
used for the preparation of the microemulsions have been described in our recent publication^.^^^^^ The hexylamine used was pro analysi grade of E. Merck, Germany, having a density of 0.76 gm/cm3. It was used as received. Doubly distilled conductivity water of specific conductance 2-3 $3 cm-' at 303 K was used throughout the experiments.
Method. Conductance measurements were taken with a Jen- way, U K , conductivity meter at 1 KHz. A temperature-com- pensated cell of cell constant 1.1 1 cm-' was employed. All measurements were taken in a thermostated water bath accurate within f0.02 OC. Two weight ratios (a) of surfactant/cosurfactant 0.33 and 0.50 were used in the study. In actual experiment, a mixture of known weights of surfactant, cosurfactant, and oil was taken in a container which was placed in the water bath. Water
(18) Atik, S. S.; Thomas, J. K. J. Am. Chem. Soc. 1981, 103, 3543. (19) Bridge, N . J.; Fletcher, P. D . I. J . Chem. Soc., Faraday Trans. I
(20) Ganz, A. M.; Boeger, B. E. J . Colloid Interface Sci. 1986, 109, 504. (21) Lang, J.; Jada, A.; Malliaris, A . J . Phys. Chem. 1988, 92, 1946. (22) Chen, S. J.; Evans, D. F.; Ninham, B. W. J . Phys. Chem. 1984,88,
(23) Bisal, S. R.; Bhattacharya, P. K.; Moulik, S. P. J . Surf. Sci. Technol.
(24) Bisal, S . R . ; Bhattacharya, P. K.; Moulik, S. P. Indian J. Chem., in
(25) Lagourette, B.; Peyrelasse, J . ; Boned, C.; Clausse, M . Nature 1979,
(26) Lagiies, M.; Ober, R . ; Taupin, C. J . Phys. (Paris) Lert. 1978, 39,
(27) Venable, R. L.; Fang, J . J. Colloid Interface Sci. 1987, 116, 269. (28) Clausse, M.; Peyrelasse, J . ; Boned, C.; Heil, J.; Nicoles, L.; Zradba,
A . In Solurion Properties of Surfactants; Mittal, K. L., Ed.; Plenum: New York, 1983.
(29) Hanai, T. Kolloid-Z. 1960, 171, 20. (30) Eicke, H. F.; Denss, A. In Solution Chemistry of Surfactants; Mittal,
K . L., Ed.; Plenum: New York, 1979; p 699. (31) Moulik, S. P. Electrochim. Acta 1973, 18, 981. (32) Mandal, A. B.; Ray, S.; Biswas, A . M.; Moulik, S. P. J . Phys. Chem.
(33) Mandal, A . B.; Gupta, S.; Moulik, S. P. Indian J . Chem. 1985, 24,
1983, 79, 2161.
1631.
1988, 4, 121.
press.
281. 60.
L-487.
1980, 84, 856.
670.
The Journal of Physical Chemistry, Vol. 94, No. I , 1990 351
was added in installments from a microburet to the mixture with constant stirring, the conductance being measured at each addition after allowing sufficient time for the attainment of constant temperature. The course was followed till the mixture exhibited opalescence. The range of water addition was known from the phase behavioral studies reported e l s e ~ h e r e . ~ ~ . ~ ~ The experiments with heptane were performed at two temperatures, 293 and 303 K, at n = 0.50. The maximum error limit of conductance mea- surements was &OS%.
Choice of Conductance Equation and Method of Calculation At constant temperature and above the percolation threshold,
the conductance of w/o microemulsion follows the scaling law2s,26
k (4 - 'A' (1) where k is the conductance, 4 is the volume fraction of the droplets, & is the volume fraction at the percolation threshold, and t is a constant. According to Lagourette et aLz5 and Clausse et a1.,28 the value of t is 1.6; at higher concentration it is unity.
In the effective medium theory (EMT), equations for the conductance of binary mixtures have been proposed by Brugge- man34 and B o t t ~ h e r ~ ~ and subsequently by other^.^^,^' Granqvist and Hunderij8 have extended the EMT theory with dipole-dipole interactions to account for the conductance of binaries with el- lipsoidal inclusions. Nonspherical dispersions and spheres in clusters (which may occur in concentrated dispersions) are required to be treated in the light of their EMTDD theory.
When the dispersion medium is nonconducting, the equation of Bottcher transforms into the scaling equation with t = 1. The applicability of Bottcher equation to the w/o microemulsion systems has been established by several Very recently, its usefulness in microemulsion systems has been shown by Fang and Venable.27
In terms of the conductivities of the solution ( k ) , the continuous medium (k,) and the spherical disperse phase ( k d ) , the equation of Bottcher is expressed as
k - k , kd - k , ( 2 ) -- --
3k kd + 2k' where 4 is the volume fraction of the disperse phase. For oil- continuous microemulsions, k, can be taken to be zero, so that eq 2 transforms into the scaling form with t = 1
( 3 ) Thus the conductance is directly proportional to 4, and kd can be evaluated from the slope of the linear plot between k and (4 - The equation suggests that w/o microemulsions have a percolation threshold at 33% of the droplet volume fraction.
According to the EMT theory of B o t t ~ h e r ~ ~ (eq 3 ) and the EMTDD theory of Granqvist and H ~ n d e r i , ~ ~ k versus 4 plots for spherical dispersions in a medium of very low conductance should yield intercept on the x axis at 4 = 1 / 3 . The EMTDD theory for nonspherical dispersion provides a near-linear variation between the conductance and the volume fraction with intercepts on the x axis at 4 C 1/3. The percolation thresholds, therefore, depend on the type of dispersions, and an appropriate theory for the system has to be used to derive structural informations. We have assumed nonclustered spherical surfactant stabilized microwater droplets for all the systems and used eq 3. The following is stated in support. The transmission electron microscopic (TEM) mea- surements of Jahn and st re^^^ have conclusively evidenced non- clustered, spherical AOT-stabilized w/o microemulsions above the percolation point. Spherical SDS-stabilized oil-continuous systems with low and high water content have been documented from viscosity, conductivity, sedimentation, small-angle neutron scattering,"O electron micro~copy,~' and light scattering4* mea-
(34) Bruggeman, D. A . G. Ann. Phys. 1935, 24, 636. (35) Bottcher, C . J . F. Red . Truu. Chim. 1945, 64, 47. (36) Kirkpatrick, S. Phys. Reo. Letr. 1971, 27, 1722. (37) Stroud, D. Phys. Reo. B 1975, 12, 3368. (38) Granqvist, C. G.; Hunderi, 0. Phys. Reo. B 1978, 18, 1554. (39) Jahn, W.; Strey, R. J . Phys. Chem. 1988, 92, 2294.

352 The Journal of Physical Chemistry, Vol. 94, No. I , 1990 Bisal et al.
h Y k’€ A 0 0 1 0 2 0 3 0 0 1
1 0 2 0 3
: @ - 1/31 - I @ - I - Figure 1. (a) Conductivity ( k ) vs ($ - plot for the AOT-butanol/ heptane/water system at u = 0.50 and T = 293 K. (b) Conductivity ( k ) vs ($ - plot for the AOT-hexylamine/heptane/water system at u = 0.50 and T = 293 K.
surements. Information on the shape and structure of CTAB stabilized microwater droplets in oil, on the other hand, does not exist in literature. Jahn and st re^^^ have shown deformed spheres for n-octane-water-DDAB system. We have assumed spherical geometry of water microdroplet produced in oil in presence of CTAB.
The volume fraction of the disperse phase 4 in eq 3 refers to the microdroplets of water with associated surfactant and co- surfactant molecules at the interphase. It is assumed that all the surfactant molecules are present in the interphase of water and oil, the cosurfactant present being dissolved in the water phase, the interphase, and the oil phase. We have used two cosurfactants, I-butanol, and n-hexylamine. 1 -Butanol has 7% (wt/wt) solubility in water at 298 K; the major portion of the alkanol is present between the oil phase and the interphase. The water-soluble amount of it was determined by the partition method at the experimental compositions of oil and water. It was assumed that the concentration of I-butanol in the aqueous medium in the presence of surfactant is equal to that in its absence. The solubility of hexylamine is very low (- 1 %), and therefore it was assumed to be present only in the oil phase and the interphase. The average ratio of the cosurfactant (cs) and the surfactant (s) in the w/o interphase is taken as
r = Nc,/Ns (4) where N,, and N, mean the number of molecules of cosurfactant and surfactant, respectively. The ratio has been considered to be independent of water content of the microemulsion; as water increases microemulsion droplets coalesce to grow in size main- taining the ratio constant. Following the line of Fang and Ven- able,27 the volume fraction of the disperse phase is given by the relation
where Pd and pt are the densities of the disperse phase and the total solution, respectively; w,, w;, and w, are the weight fractions of surfactant, of cosurfactant in the aqueous phase, and of water, respectively, and M,, and M , are the molecular weights of the cosurfactant and surfactant, respectively. w’, has a contribution when I-butanol is the cosurfactant; for hexylamine w;, = 0.
A reasonable assumption of the structural ratio r is required to derive 4 to be used in eq 3 to test the conductivity behavior of the w/o microemulsion. In practice, several r values were assumed and the k values were plotted against (4 - ‘/J calculated at each r corresponding to different weight fractions of added
(40) Dvolaitzky,, M.; Guyot, M.; Lagiies, M.; Le Pesant, J. P.; Ober, R.: Sauterey. C.; Taupln, C. J . Chem. Phys. 1978, 69, 3279. Lagues, M.; Sau- terey, C. J . Phys. Chem. 1980, 84, 3503.
(41) Bellocq, M. A.; Biais, J.; Clin, B.; Lalanne, P.; Lemaneeau, B. J . Colloid Interface Sei. 1919, 70, 524.
(42) Cazabat, A. M.; Langevin, D.; Pouchelon, A. J . Colloid Interface Sci. 1980, 73, 1.
(@-!/3 I-
Figure 2. (a) Conductivity ( k ) vs ($ - plot for the CTAB-buta- nol/heptane/water system at u = 0.50 and T = 293 K . (b) Conductivity ( k ) vs ($ - plot for the CTAB-hexylamine/heptane/water system at u = 0.50 and T = 293 K.
water. Good straight lines were obtained in the microemulsion range. Figures 1 and 2 depict several representative systems; others are not presented to save space. The correct value of r to yield zero intercept in terms of eq 3 was evaluated graphically by plotting the intercepts against the assumed values of r. The plots were linear and r values corresponding to zero intercept were found without ambiguity. Deviations were observed from the linear plots between k and (+ - in the lower range of water addition below the percolation threshold and at a fairly high concentration of water. Only the good straight-line portion of the graph was used for data analysis. The constancy of r revealed in the study are in line with the arguments and observations made by other^.^^,^'
The radius of the water droplets of the disperse phase was calculated by the relation2’
I @ - 1/3 I -
3[Ms + rMcs + KWW + wlc,)/w,J~,l Rw = (6)
Npd(as + rats) where N is the Avogadro number and a, and a,, are the cross- sectional areas of the head groups of the surfactant and cosur- factant molecules, respectively. The values were considered to be independent of the temperatures of the study. The number of water droplets per milliliter of microemulsion, Ne, was evaluated from the relation
Ne = 3C#J/4aRw3 (7)
and the total surface area of droplets per milliliter was found by the relation
A , = 4aRW2N, (8) The effective radius of the droplet (water core plus interphase) was obtained by the relation
(9)
where L‘, the effective volume of a microemulsion droplet, is given by the relation
in which the new terms A, and A,, represent the aggregation numbers of the surfactant and cosurfactant molecules per droplet, respectively. The value of A , can be obtained in terms of r and A, by eq 4. The densities of the materials used for calculation were taken to be 1.0, 1.17, 1.01, 1.13, 0.80, 0.76, 0.677, 0.729, and 0.86 g/mL for water, SDS,27 CTAB,43 AOT,44 1-butanol,
(43) Reiss-Husson, F.; Luzzati. V. J . Phys. Chem. 1964, 68, 3504.

Conductivity Study of Microemulsions
TABLE I: Conductance of the Disperse Phase (k,) and the Structural Parameter ( r ) for the Systems Studied under Conditions of Different ua and Temperature
svstem temp, kd.
K r S m-I 1 -Butanol
heptane-CTAB (a = 0.33) 293 heptane-CTAB (a = 0.50) 293 heptane-CTAB ( u = 0.50) 303 decane-CTAB (a = 0.50) 293 heptane-SDS (a = 0.33) 293 heptane-SDS ( u = 0.50) 293 heptane-SDS (a = 0.50) 303 decane-SDS (a = 0.50) 293 xylene-SDS (a = 0.50) 293 30% (w/v) cholesterol 293
heptane-AOT ( u = 0.33) 293 heptane-AOT (a = 0.50) 293 heptane-AOT (a = 0.50) 303 decane-AOT (a = 0.50) 293
heptane-CTAB (a = 0.50) 293 heptane-CTAB (a = 0.50) 303 decane-CTAB (a = 0.50) 293 heptane-SDS (a = 0.50) 293 heptane-SDS (a = 0.50) 303 decane-SDS (a 0.50) 293 heptane-AOT (a = 0.50) 293 heptane-AOT (a = 0.50) 303 decane-AOT (a = 0.50) 29 3
in xylene-SDS (a = 0.50)
n-Hexylamine
4.88 2.48 2.55 2.64 2.20 0.45 0.60 0.23 0.13 0.19
3.78 0.65 1.14 0.73
1.03 1.18 1 .oo 0.50 0.60 0.49 0.63 1.14 0.57
1.14 1.61 1.46 1.41 1.69 2.63 2.94 2.69 2.26 2.28
0.65 0.91 0.76 0.89
2.61 2.86 2.46 3.03 3.17 2.91 0.86 0.83 0.82
a s / o = 1.33 (wt /wt) at a = 0.50; s/o = 1.0 (wt/wt) at a = 0.33.
n-hexylamine, n-heptane, n-decane, and xylene, respectively. The cross-sectional areas of CTAB$5 SDS:7 AOT,46 1 -butanol$5 and n - h e ~ y l a m i n e ~ ~ are 50.5, 35.0,67.8, 20, and 25 A2, respectively.
Results and Discussion Formation Characteristics of Microemulsions. The phase
behavior and physicochemical properties of butanol-derived mi- croemulsions have been recently rep0rted.2~9~~ Fang and Venable27 have described the SDS-hexylamine system with heptane. In this study, we have examined the SDS-hexylamine preparation in decane as well as CTAB-hexylamine and AOT-hexylamine preparations in both heptane and decane to find out the range of water addition for stable microemulsion formation. To save space these phase diagrams are not presented.
Bansal et aL4’ have proposed a mixing model for w/o micro- emulsion formation, which proposes that the sum of the chain lengths of the cosurfactant and the oil needs to be comparable with the length of the surfactant molecule to yield a stable mi- croemulsion. Accordingly, when l-butanol and n-heptane are used, SDS should form better microemulsion than CTAB. With n- decane, SDS and CTAB are expected to offer similar effects (the sum of the CH2 groups of butanol and decane is two units more and two units less than the chain lengths of SDS and CTAB, respectively). In the presence of n-hexylamine, SDS is a better choice than CTAB for heptane, whereas CTAB is better than SDS for decane. On similar grounds, the expected sequence of better microemulsion formation with AOT is butanol-heptane > hex- ylamine-heptane > butanoldecane > hexylamine-decane. Since the effective length of the nonpolar part of the AOT molecule is equivalent to a polymethylene chain of six CH2 groups (config- urationally, there are two tails of equal lengths each containing six CH2 groups), in terms of the mixing model of Bansal et al.,47 the surfactant should yield poor microemulsion characteristics
(44) Ghosh, 0.; Miller, C. A. J . Phys. Chem. 1987, 91, 4528. (45) Adamson, A. W. Physical Chemistry of Surfaces; Interscience: New
(46) Ekwall, P. In Adoanced in Liquid Crystals; Brown, G. H., Ed.; Ac-
(47) Bansal. V . K.; Shah, D. 0.; OConnell, J. P. J . Colloid Interface Sci.
York, 1960; Chapter 111.
ademic Press: New York, 1975; p 45.
1980, 75, 462.
The Journal of Physical Chemistry, Vol. 94, No. I , 1990 353
r - Figure 3. Conductivity of the disperse phase (kd) vs structural parameter ( r ) profile at 293 K. Circles represent butanol systems, and squares represent hexylamine systems. 0 or 0, Hp at u = 0.50; e, Hp at a = 0.33; 0 or 0, Hp at u = 0.50 at 303 K; 0 or H, Dc at a = 0.50; 0, xylene at u = 0.50; 8, cholesterol-containing xylene at a = 0.50. Unprimed, single-primed, and double-primed symbols represent SDS-, CTAB-, and AOT-containing systems, respectively.
compared to SDS and CTAB. But the AOT-containing systems have shown easier formation with appreciable uptake of water. The butanol- and hexylamine-derived systems for heptane only follow the rule when in combination with SDS and CTAB. The radical difference of AOT from SDS and CTAB may be essen- tially due to its double chain configuration.
The Nature of r and kd. The values of the parameters r a n d kd for the studied systems with their compositions at two tem- peratures 293 and 303 K at u values 0.33 and 0.50 at s/o weight ratios 1.0 and 1.33, respectively, are listed in Table I . The value of r decreases with increase in the s/cs ratio (a) and decreases with increase in temperature. It also depends on the type of oil; at constant u and temperature, the order is heptane < decane < xylene. The kd values increase with decrease in r; this is expected because more surfactant molecules are at the interphase when r is smaller. The order of kd for the three surfactants used is SDS > CTAB > AOT at equal u; this is the order of the molar con- centrations of the surfactants in the interphase. kd values with hexylamine are greater than those with butanol for both CTAB and SDS, and they are close for the AOT-derived systems. The trend in kd with r is exemplified in Figure 3; although scattered, a linear trend is observed. AOT-containing systems are notably off from the trend which may reflect its structural difference from SDS and CTAB.
Droplet Size and Number and Surface Concentration of S and CS. The several structural parameters evaluated from the values of r are typically displayed in Figures 4-6. The results for all the systems at a constant weight fraction of water (ww = 0.2) are presented in Table 11. Figure 4 depicts the profiles of the average radius of the water core of a droplet with the weight fraction of water in the microemulsion. The size of the microdroplets rapidly increases at higher percentages of water; smaller droplets coalesce forming bigger droplets a t constant u. The surface free energy decreases through agglomeration of smaller droplets into bigger ones making the process thermodynamically favorable. At any stage of water addition, the radius of the microdroplets is more when u is greater (Table 11). The radii of the water pool are of
354 The Journal of Physical Chemistry, Vol. 94, No. 1 ~ 1990
t - *I
E > 2 P 3 0 - - x u) c
- n 0, 0 .I-
8
b 01 2 0 - 8 L 3 v)
r
1 0
Bisal et al.
I I I I I
0 1 0 2 0 3 O L 0 5 0
1oC
+- (Y
?i 16- e
t 12-
-0 .I-
n 5 z
8-
4 /
L-
6' I
0 2 0 0 1 0 2 0 3 O L 0 5
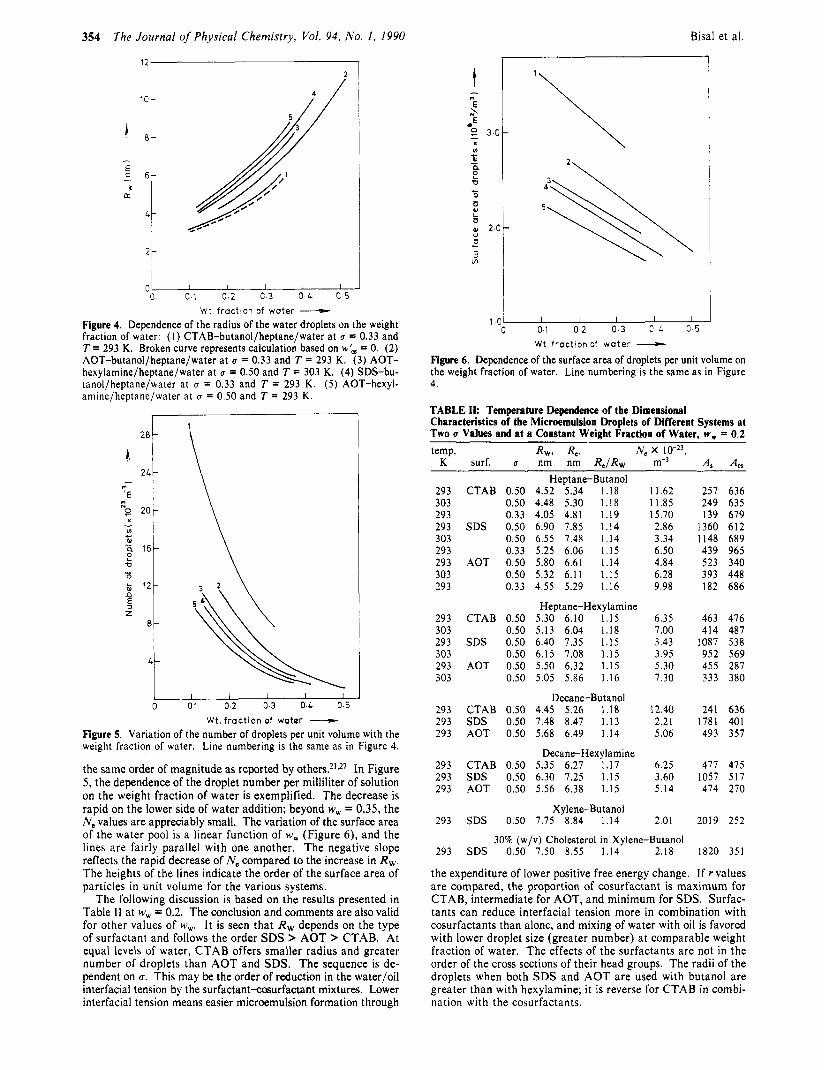
W t fraction of water - Figure 4. Dependence of the radius of the water droplets on the weight fraction of water: ( I ) CTAB-butanol/heptane/water at u = 0.33 and T = 293 K. Broken curve represents calculation based on w', = 0. (2) AOT-butanol/heptane/water at u = 0.33 and T = 293 K. (3) AOT- hexylamine/heptane/water at u = 0.50 and T = 303 K. (4) SDS-bu- tanol/heptane/water at u = 0.33 and T = 293 K. (5) AOT-hexyl- amine/heptane/water at u = 0.50 and T = 293 K .
I I I I I 0 01 0 2 0 3 OL 0.5
Wt. fraction of water - Figure 5. Variation of the number of droplets per unit volume with the weight fraction of water. Line numbering is the same as in Figure 4.
the same order of magnitude as reported by other^.^'*^' In Figure 5, the dependence of the droplet number per milliliter of solution on the weight fraction of water is exemplified. The decrease is rapid on the lower side of water addition; beyond w, = 0.35, the Ne values are appreciably small. The variation of the surface area of the water pool is a linear function of w, (Figure 6), and the lines are fairly parallel with one another. The negative slope reflects the rapid decrease of Ne compared to the increase in Rw. The heights of the lines indicate the order of the surface area of particles in unit volume for the various systems.
The following discussion is based on the results presented in Table I I at w, = 0.2. The conclusion and comments are also valid for other values of w,. It is seen that Rw depends on the type of surfactant and follows the order SDS > AOT > CTAB. At equal levels of water, CTAB offers smaller radius and greater number of droplets than AOT and SDS. The sequence is de- pendent on u. This may be the order of reduction in the water/oil interfacial tension by the surfactant-murfactant mixtures. Lower interfacial tension means easier microemulsion formation through
TABLE 11: Temperature Dependence of the Dimensional Characteristics of the Microemulsion Droplets of Different Systems at Two u Values and at a Constant Weight Fraction of Water, w , = 0.2 temp, Rw? Re, N< x 10-23,
K surf. u nm nm Re/Rw mW3 A, A,
29 3 303 293 293 303 293 293 303 293
293 303 293 303 293 303
29 3 293 293
293 293 293
293
293
Heptane-Butanol CTAB 0.50 4.52 5.34 1.18
0.50 4.48 5.30 1.18 0.33 4.05 4.81 1.19
SDS 0.50 6.90 7.85 1.14 0.50 6.55 7.48 1.14 0.33 5.25 6.06 1.15
AOT 0.50 5.80 6.61 1.14 0.50 5.32 6.11 1.15 0.33 4.55 5.29 1.16
11.62 11.85 15.70 2.86 3.34 6.50 4.84 6.28 9.98
Heptane-Hexylamine CTAB 0.50 5.30 6.10 1.15 6.35
0.50 5.13 6.04 1.18 7.00 SDS 0.50 6.40 7.35 1.15 3.43
0.50 6.15 7.08 1.15 3.95 AOT 0.50 5.50 6.32 1.15 5.30
0.50 5.05 5.86 1.16 7.30
Decane-Butanol CTAB 0.50 4.45 5.26 1.18 12.40 SDS 0.50 7.48 8.47 1.13 2.21 AOT 0.50 5.68 6.49 1.14 5.06
Decane-Hexylamine CTAB 0.50 5.35 6.27 1.17 6.25 SDS 0.50 6.30 7.25 1.15 3.60 AOT 0.50 5.56 6.38 1.15 5.14
X ylene-Butanol
30% (w/v) Cholesterol in Xylene-Butanol SDS 0.50 7.75 8.84 1.14 2.01
SDS 0.50 7.50 8.55 1.14 2.18
257 636 249 635 139 679
1360 612 1148 689 439 965 523 340 393 448 182 686
463 476 414 487
1087 538 952 569 455 287 333 380
241 636 1781 401 493 357
477 475 1057 517 474 270
2019 252
1820 351
the expenditure of lower positive free energy change. If r values are compared, the proportion of cosurfactant is maximum for CTAB, intermediate for AOT, and minimum for SDS. Surfac- tants can reduce interfacial tension more in combination with cosurfactants than alone, and mixing of water with oil is favored with lower droplet size (greater number) at comparable weight fraction of water. The effects of the surfactants are not in the order of the cross sections of their head groups. The radii of the droplets when both SDS and AOT are used with butanol are greater than with hexylamine; it is reverse for CTAB in combi- nation with the cosurfactants.

Conductivity Study of Microemulsions
For both the u values (0.33 and 0.50), the radius of the droplets has been found to depend on the type of oil, the order being heptane < decane C cholesterol containing xylene < xylene in combination with SDS and butanol. Heptane and decane have yielded comparable radii with CTAB and AOT. The order of the size of the droplets with hexylamine follows the same trend as with butanol but the dependence on the type of oil is minor. An insignificant effect of the type of oil on the w/o microemulsion droplet size has been reported by Robinson et a1.I0 by small-angle neutron scattering method using only AOT as the stabilizer and hexane, heptane, octane, and decane as oils. An abrupt increase in the radius has been observed in the case of dodecane which they cannot explain. We have observed oil-independent droplet size formation with AOT in the presence of cosurfactants.
In Table I 1 the effective radii of the droplets (Re) are given along with the water core radius (Rw). The R,/Rw values are more or less independent of oil, surfactant, cosurfactant as well as temperature but have a minor decreasing tendency with in- creasing w,. Lagourette et al.25 have reported a value 1.18 f 0.01 for this ratio. The average RJRw of all the systems herein reported is I . 15 f 0. IO . The agreement is satisfactory.
Temperature Effect on the Structural Properties. Recent small-angle neutron scattering experiments of Toprakciaglu et al." have shown a minor temperature effect (a slight decreasing effect) on the dimension of w/o microemulsion droplets stabilized by AOT using decane, undecane, and dodecane. Using the same method Rouviere et al.48 have reported a 20% decrease of the AOT-stabilized droplets of D 2 0 in decane for a temperature change of 23 O C . Recently from time-resolved fluorescence probing of AOT-stabilized water droplets in several hydrocarbons, Lang et have observed 25-35% increase in radius with increase of temperature of nearly 35 OC. All these results are conflicting on similar kinds of AOT-stabilized microemulsions between hy- drocarbon and water. Methodology has therefore an important say in this regard. The aggregation number of AOT molecules on the surface of the droplets, produced at various stages of water addition, increases with temperature (Table 11). Lang et aL2' have observed even a 50% increase in the number of AOT molecules for only 18 "C rise in temperature for which the increase in the radius is only 14%. The temperature difference of the present study is IO "C. It has been observed that there is a decrease in radius for all the surfactants SDS, CTAB, and AOT with heptane as the oil with hexylamine; the radius decreases with temperature in the case of SDS and AOT but remains unchanged for CTAB. Among the systems studied, the decrease in the case of CTAB with butanol is minimum. The extents of decrease are 1 , 5 , 8,
(48) Rouviere, J.; Court, J. M.; Lindheimer, A.; Lindheimer, M.; Brun, 9. J . Chim. Phys. 1979, 76, 291.
The Journal of Physical Chemistry, Vol. 94, No. I , 1990 355
3,4, and 8% for CTAB-butanol, SDS-butanol, AOT-butanol, CTAB-hexylamine, SDS-hexylamine, and AOT-hexylamine, respectively. In line with our observations for a I O "C rise in temperature, the 20% decrease observed by Rouviere et al.48 for a temperature increase of 23 OC is, though striking, not surprising. The percentage increase of the number of microdroplets is 2, 17, 30, 10, 15, and 38% for the respective systems listed above. The decrease in radius is associated with an increase in the number of droplets. It is observed that with rise of temperature the aggregation number of the surfactant on the surface of water droplets decreases, whereas that of the cosurfactant increases; CTAB-butanol is an exception to this trend. The percentage decreases in the aggregation of the surfactant are 3, 16, 25, 1 1 , 13, and 27% for CTAB-butanol, SDS-butanol, AOT-butanol, CTAB-hexylamine, SDS-hexylamine, and AOT-hexylamine combinations, respectively. The respective increases in the co- surfactants are 0, 13, 32,2,6, and 32% for the above combinations. Lang et aL2I have observed a 50% increase in aggregation of AOT for a temperature rise of 18 OC for n-decane. According to their report the increase can be even more than 100% in n-decane for a rise in temperature by 40 OC. The present surfactant-cosur- factant-stabilized systems show more moderate behavior in this regard than the only AOT-stabilized systems of Lang et ai. Although the temperature effects on the aggregation numbers of surfactant and cosurfactant follow opposite trends, their sum always decreases with increase of temperature. This is expected because, for Ne to increase, the surface area per droplet must decrease and the total number of entities required to cover the surface also need to be decreased. But with the increase of Ne at constant w,, the overall (total) surface area increases. The surfactant molecules present in the interphase get distributed over a larger area so their coverage per droplet surface decreases. The cosurfactant molecules are transferred to the interphase from the oil phase for stabilization. The value of r thus increases with temperature. Increase of temperature reduces the interfacial tension between oil/water, the dispersion of water into oil is thus favored with increased droplet number of smaller size. The ex- planation may not be unique; altered distribution of the surfactant and cosurfactant in the interphase and their orientation and mutual interaction (dispersion and polar) in the interphase as well as that with water are important factors for the overall effect. The present state of knowledge is inadequate for a quantitative account.
Acknowledgment. This work was supported by CSIR, Gov- ernment of India, with a fellowship to S.R.B. We thank one of the reviewers for the suggestion to include the EMTDD theory of conductance by Granqvist and Hunderi.
Registry No. CTAB, 57-09-0; SDS, 151-21-3; AOT, 577-1 1-7; hep- tane, 142-82-5; decane, 124-18-5; xylene, 1330-20-7; butanol, 71-36-3; hexylamine, 1 1 1-26-2.