conditional tau coefficient for assessment of producer's accuracy of classified remotely sensed...
TRANSCRIPT

ELSEVIER ISPRS Journal of Photogrammetry & Remote Sensing 51 (1996) 91-98
PHOTOGRAMMETRY & REMOTE SENSING
Conditional tau coefficient for assessment of producer's accuracy of classified remotely sensed data
Erik N~esset
Department of Forest Sciences, Agricultural Universi~' of Norway. P.O. Box 5044, N-1432 ~s, Norway
Received 15 August 1995; revised version accepted 29 December 1995
Abstract
The error matrix is frequently used for accuracy assessment of the classification of remotely sensed data. The classification accuracy for each individual category is often expressed by the percentage correct classified and/or the conditional kappa coefficient. In the classification of remotely sensed data, the distribution of the reference data over various categories is often unknown beforehand. In such cases, conditional kappa may give erroneous estimates of classification accuracy. An alternative measure for classification accuracy of individual categories is proposed. It is denoted as conditional tau, and it expresses the agreement obtained after removal of the random agreement expected by chance. Formulae for computation of conditional tau appropriate for classifications based on equal and unequal probabilities of category membership are presented. Three numerical examples are used to demonstrate the calculation and interpretation of the measure. In the examples, conditional tau correctly estimates the classification accuracy, whilst the results show that conditional kappa may overestimate as well as underestimate the classification accuracy.
1. Introduction
A square error matrix is frequently used in the evaluation of the image classification accuracy of remotely sensed data. The accuracy of the classi- fied remotely sensed data compared to the reference data is often expressed by measures of agreement, such as the overall percentage correctly classified and the kappa coefficient (Cohen, 1960; Congalton and Mead, 1983; Congalton et al., 1983; Hudson and Ramm, 1987). Investigators in remote sensing have also been searching for an accuracy value for each individual category within the matrix. The percent- age correct classified within the individual categories has been applied frequently, and has been expressed by the user's approach (based on errors by commis- sion) (Story and Congalton, 1986) as well as the
Elsevier Science B.V. Pll SO924-2716(69)OOOO7-X
producer's approach (based on errors by omission). An excellent review on this topic is given by Con- galton (1991). The conditional kappa coefficient for agreement within individual categories (Light, 1971; Bishop et al., 1975; Rosenfield and Fitzpatrick-Lins, 1986) has been demonstrated on remotely sensed data as a measure of both user's accuracy (Rosenfield and Fitzpatrick-Lins, 1986) and producer's accuracy (N~esset, 1995).
The kappa coefficients have been considered gen- erally as representing the proportion of agreement obtained after removing the proportion of agreement that could be expected to occur by chance. The kappa coefficients are based on a posteriori probabilities of category membership, i.e. "the marginal proportions of the error matrix are known to the assigner be- fore classifying the objects into categories" (Brennan
92 E. Ncesset / l SPRS Journal o f Photogrammetry & Remote Sensing 51 (1996) 9 1 - 9 8
and Prediger, 1981). Foody (1992) showed that the calculation of the proportion of chance agreement for the calculation of the overall kappa coefficient may be overestimated with a resultant under rep- resentation of classification accuracy. Foody (1992) also described a modified kappa coefficient for use when the marginals of the error matrix are not fixed a priori, i.e. whenever the marginals are not known before the classification process is undertaken, as is often the case in image classification. This coeffi- cient uses equal probability of category membership as index of chance agreement, as proposed by Bren- nan and Prediger (1981). Ma and Redmond (1995) introduced overall tau coefficients of agreement to the remote sensing community. Tau is superficially similar to kappa. For the special case that the a pri- ori probabilities of category membership are equal for a classification, the tau coefficient is equal to the modified kappa coefficient proposed by Foody (1992). Tan is appropriate also for classifications with unequal probabilities.
Whenever the marginals of an error matrix are not known a priori, the proportion of chance agree- ment for the conditional kappa coefficient may be erroneously estimated too. In order to provide unbi- ased estimates of classification accuracy for individ- ual categories, the calculation of chance agreement of conditional kappa should be modified. In the present paper, modified conditional coefficients are introduced. Coefficients based on equal and unequal probabilities are presented by expanding on the find- ings of Ma and Redmond (1995). An example data analysis is employed to illustrate the coefficients. This paper is restricted to the descriptive characteris- tics of these indices.
2 . M e t h o d s
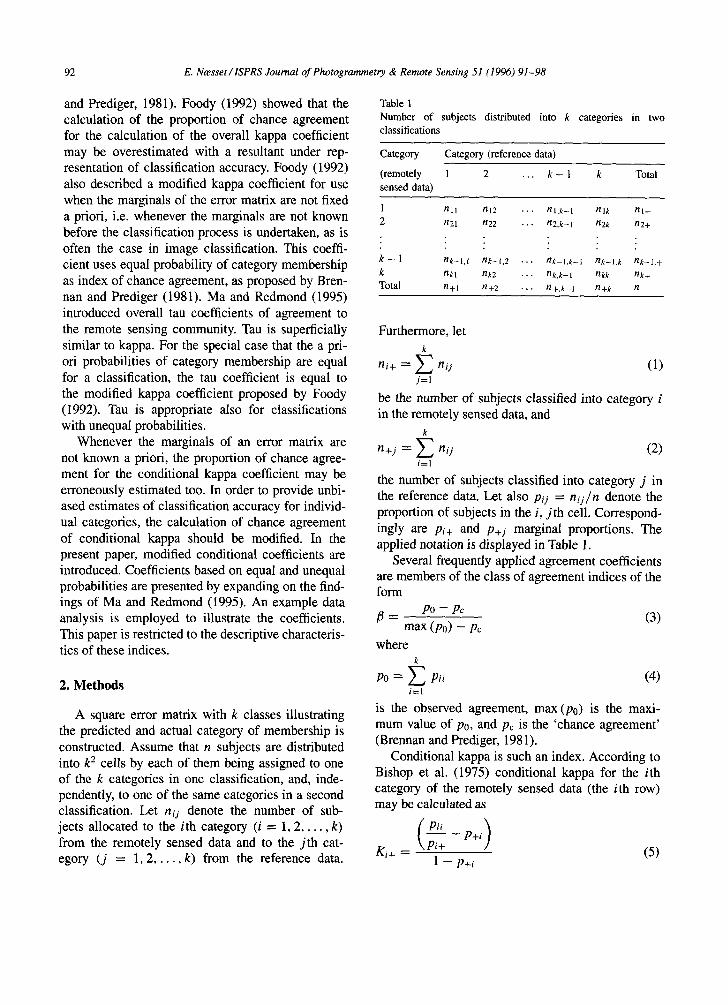
A square error matrix with k classes illustrating the predicted and actual category of membership is constructed. Assume that n subjects are distributed into k 2 cells by each of them being assigned to one of the k categories in one classification, and, inde- pendently, to one of the same categories in a second classification. Let nij denote the number of sub- jects allocated to the ith category (i = 1, 2 . . . . . k) from the remotely sensed data and to the j th cat- egory (j --- 1, 2 . . . . . k) from the reference data.
Table 1 Number of subjects distributed into k categories in two classifications
Category Category (reference data)
(remotely 1 2 . , . k - 1 k Total sensed data)
1 ni l n12 . , . n t , k - I nlk hi+ 2 n21 n22 . • • n2,k-I n2k n2+
k - 1 nk- l , [ nk- l ,2 . . . n k - l , k - I nk - l . k nk - l .+
k nkl nk2 . • • nk,k-I nkk nk+
Total n+l n+2 • • • n+.k-I n+k n
Furthermore, let k
n i + ~- Z n i j (1) j = l
be the number of subjects classified into category i in the remotely sensed data, and
k n + j = ~ n i j (2)
i=1
the number of subjects classified into category j in the reference data. Let also Pij = ngi/n denote the proportion of subjects in the i, j th cell. Correspond- ingly are pi+ and p+j marginal proportions. The applied notation is displayed in Table 1.
Several frequently applied agreement coefficients are members of the class of agreement indices of the form
/5 _ p o - p c ( 3 )
max (Po) - Pc where
k PO ~- ~ . ~ Pi i (4)
i=1
is the observed agreement, max (P0) is the maxi- mum value of p0, and pc is the 'chance agreement' (Brennan and Prediger, 1981).
Conditional kappa is such an index. According to Bishop et al. (1975) conditional kappa for the ith category of the remotely sensed data (the ith row) may be calculated as
( Pii -- p+i)
Ki+ = \Pi+ (5) 1 - P+i

E. Na, sset / l S P R S Journal o f Photogrammetry & Remote Sensing 51 (1996) 9 1 - 9 8 93
Here Pii/Pi+ is the observed agreement according to the user's approach. It is denoted as P0(~+~- Further, P+i is the agreement expected to occur by chance, and will be denoted as Peli+). Thus, still keeping in mind that the error matrix was built with the remotely sensed data across the rows, conditional kappa for the ith row can be expressed by
K i + : PO(i+) - - Pe(i+) (6) 1 - - Pet i+)
Correspondingly, the kappa conditioned on the ith column (the producer's approach) may be expressed by
K + i = Po~+i) - Pea+i) (7) 1 - - Pel+i)
The chance agreement indices of the conditional kappa coefficients (Pe~i+) and Pe(+i)) assume that the marginals are known before the classification process is undertaken. The overall tau coefficient proposed by Ma and Redmond (1995) assumes, however, that the actual marginals are not known before classifying the remotely sensed data. According to Ma and Red- mond (1995) the tau coefficient may be calculated as
T = P0 - Pr (8) 1 - Pr
where k
pr = ~ p+iPi (9) i=l
is the 'random agreement' (chance agreement). Here Pi represents a priori probabilities of category mem- bership. The overall tau coefficient is obviously a member of the class of indices indicated by Eq. 3.
When the marginals are not known in advance, the kappa conditioned on the columns should be modified. Following the definition of random agree- ment (Eq. 9) as an index of chance agreement, a coefficient which shall be denoted as conditional tau is obtained. In conditional tau, the chance agreement is expressed by the a priori probabilities of cate- gory membership (Pi)- Conditional tau for the ith category of the reference data (the ith column) is labelled T+i, where
T+i - - Po(+i) - P i (10) 1 - Pi
Correspondingly, consider the agreement condi- tioned on the rows. According to the definition of random agreement (Eq. 9), the chance agreement of a tau coefficient conditioned on the ith row would be p+i. Thus, a tau coefficient conditioned on the rows and the kappa coefficient conditioned on the rows (Eq. 6) would be identical. Defining a tau co- efficient based on the user's approach is therefore superfluous.
When specific a priori probabilities of category membership (Pi) are not defined, the expected prob- ability for each category is 1/k (Brennan and Predi- ger, 1981). In this case, in which pi = 1/k for all i = 1, 2 . . . . . k, Tel+il is defined as conditional tau for use with classifications based on equal probabil- ities of category membership. It may be computed as
1 Pol+i) - - ~ k n i i - n + i
- - - - ( 1 1 ) Te(+i) 1 (k - - 1) n + i
1 - - - k
Te<+i~ is the conditional index corresponding to the overall tau coefficient based on equal probabilities (Te) proposed by Ma and Redmond (1995) and the modified kappa coefficient (K,,) derived by Brennan and Prediger (1981). Bishop et al. (1975) indicated that the numerator and denominator of kappa are obtained by summing respective numerators and de- nominators of conditional kappa separately over all k categories. Te may be computed in a similar manner by summing respective numerators and denomina- tors of the k Te<+i~s of the latter ratio of Eq. 11 separately, i.e.
k
(knii - n+i) Te : i=1 k (12)
Z ( k - 1)n+i i=1
3 . E x a m p l e d a t a a n a l y s i s
3.1. Example 1
Equal a priori probabilities of category member- ship are often assumed in classification of remotely sensed data, for example in classifications based on

94 E. Neesset / lSPRS Journal of Photogrammetry & Remote Sensing 51 (1996) 91-98
Table 2 Classification based on equal probability taken from Ma and Redmond (1995, table 1), and agreement and tau computed for individual categories
Category Category (reference data) po(i+)
(classification) I 2 3 4 5 6 7 8 9 Totals
1 713 0 1 0 0 0 1 0 0 715 0.997 2 2 32 49 83 7 4 26 8 0 211 0.152 3 4 0 338 40 6 1 6 14 0 409 0.826 4 0 8 26 4430 8 1 57 7 0 4537 0.976 5 0 9 120 206 50 3 34 10 0 432 0.116 6 0 0 6 5 3 261 56 100 1 432 0.604 7 0 1 9 207 1 16 707 63 2 1006 0.703 8 2 0 17 25 0 13 34 262 2 355 0.738 9 0 0 1 2 1 8 5 49 22 88 0.250 Totals 721 50 567 4998 76 307 926 513 27 8185
Po(+i) 0.989 0.640 0.596 0.886 0.658 0.850 0.764 0.511 0.815 Te(+i ~ 0.988 0.595 0.546 0.872 0.615 0.831 0.734 0.450 0.792
1. Water. 2. Wetland. 3. Conifer. 4. Broadleaf. 5. Mixed forests. 6. Agriculture. 7. Rangeland. 8. Urban. 9. Gravel pit.
aerial photo interpretation and in unsupervised im- age classifications. In example 1, the classification was based on equal probabilities. The error matrix employed to illustrate the computation of Te(+i) (Ta- ble 2) was taken from Ma and Redmond (1995, Table 1). They stated that the matrix was built with reference data down the columns and classified data across the rows. Their computations indicate, how- ever, that the reference data were presented across the rows. Ma and Redmonds's matrix was therefore transposed to have the classification results on the r o w s .
In Table 2, user's accuracy (Po(i+)) was in the range 0.116-0.997. The user's accuracy is indicative of the probability that a pixel classified in the im- age actually represents that category on the ground (Story and Congalton, 1986).
Producer's accuracy indicates the probability of a pixel being correctly classified (Congalton, 1991). Producer's accuracy (P0(+i)) ranged from 0.511 to 0.989, whereas conditional tau based on equal prob- abilities of category membership (Te(+i)) was in the range 0.450-0.988. Clearly, P0c+i) differs from Tee+i). These differences merely indicate the effect of ad- justing the observed agreement by the number of categories.
3.2. Example 2
Unequal a priori probabilities of category mem- bership are sometimes assumed, for example in su- pervised image classifications with unequal proba- bilities. In example 2, the classification was based on unequal probabilities. The error matrix employed to illustrate such a case was taken from Ma and Redmond (1995, Table 2) too. This matrix was also transposed to have the classification results on the rows. The transposed matrix is presented in Table 3.
Now, Tp(+i~ is defined as conditional tau for use with classifications based on unequal probabilities of category membership. In the classification presented in Table 3, the marginal distribution of the reference data was used to determine the a priori probabilities, i.e. Pi ~- P+i for all i = 1, 2 . . . . . k. In this specific case, Tp(+i~ may be computed as
PO(+i) -- P+i nn i i -- n2+i (13) Tp(+i) - - 1 - P+i - - (n - n+i ) nwi
Tp(+i~ is the conditional index corresponding to the overall tau coefficient (Tp) of Ma and Redmond (1995) determined using the marginal distribution of the reference data as a priori probabilities (Pi). The numerator and denominator of Tp may be obtained by summing respective numerators and denomina- tors of Tp(+i) (the latter ratio of Eq. 13) separately

E. Ntesset / lSPRS Journal of Photogrammetry & Remote Sensing 51 (1996) 91-98 95
Table 3
Classification based on unequal probability taken from Ma and Redmond (1995, Table 2), and agreement and tau computed for individual categories
Category Category (reference data) po(i+)
(classification) I 2 3 4 5 6 7 8 9 Totals
1 714 0 1 0 0 0 1 0 0 716 0.997 2 1 18 17 3 0 2 8 l 0 50 0.360 3 4 14 447 74 41 4 16 21 0 621 0.720 4 0 12 64 4734 26 2 105 12 0 4955 0.955 5 0 0 4 1 2 0 0 0 0 7 0.286 6 0 0 2 2 2 249 29 83 2 369 0.675 7 0 6 13 157 4 28 734 91 3 1036 0.708 8 2 0 19 27 1 20 33 301 12 415 0.725 9 0 0 0 0 0 2 0 4 10 16 0.625 Totals 721 50 567 4998 76 307 926 513 27 8185
P0(+i) 0.990 0.360 0.788 0.947 0.026 0.811 0.793 0.587 0.370 Tp(+i) 0.989 0.356 0.773 0.864 0.017 0.804 0.766 0.559 0.368
1. Water. 2. Wetland. 3. Conifer. 4. Broadleaf. 5. Mixed forests. 6. Agriculture. 7. Rangeland. 8. Urban. 9. Gravel pit.
over all k categories, as indicated for cases with equal probabilities, i.e.
k
i=l (14) Tv= k
Z (n -- n+i) n+i i=1
Indeed, for any set of unequal a priori probabili- ties, overall tau may be computed from the sum of the numerators and denominators of the individual conditional taus.
In Table 3, user's accuracy (P0(i+)) w a s in the range 0.286--0.997. Producer's accuracy (P0(+i))
ranged from 0.026 to 0.990, whereas conditional tau based on unequal probabilities of category mem- bership (Tp(+i)) was in the range 0.017--0.989. For most of the categories the accuracy of the classi- fication based on equal probabilities (Table 2) was quite similar to the accuracy obtained with unequal probabilities (Table 3).
Conditional tau, based on equal as well as unequal a priori probabilities, may be regarded as the ratio between the number of subjects that are correctly classified and the number of subjects that are not correctly classified according to random assignment. For example for category 4 of the classification based on unequal probabilities, the value of Tp~+4) indicated
that 86.4% (Table 3) more subjects were classified correctly than would be expected according to ran- dom assignment.
3.3. Example 3
In example 3, a kappa analysis as well as a con- ditional kappa analysis were performed. Conditional tau and overall tau were also computed. The com- putations were based on the error matrix presented in Table 4. It was taken from N~esset (1995). The error matrix was generated from aerial photo inter- pretation of tree species in pure and mixed forest stands of Norway spruce (Picea abies Karst.) and Scots pine (Pinus sylvestris L.) using five mutually exclusive categories. The categories were defined ac- cording to the proportion of each tree species. For each stand reference data were collected by intensive field measurements. The distribution of the various tree species in the study area was unknown to the photo interpreters beforehand. Equal probabilities of category membership were therefore assumed for the tau analysis.
In Table 4, the small number of subjects on the diagonal representing correct classification, clearly indicates large disagreements between the photo interpretation and the reference data. The overall agreement (P0) was 0.455. The overall kappa co-

96 E. Neesset / lSPRS Journal of Photogrammetry & Remote Sensing 51 (1996) 91-98
Table 4 Error matrix for photointerpretation of tree species taken from N2esset (1995), and accuracy computed for all categories and for individual categories
Category Category (reference data) Poo+) Ki+
(photointerpretation) 1 2 3 4 5 Totals
1 73 21 16 3 1 2 13 32 39 5 0 3 5 13 35 7 2 4 1 3 29 28 3 5 0 0 13 48 17 Totals 92 69 132 91 23
PO(+i) 0.793 0.464 0.265 0.308 0.739 K+i 0.713 0.314 0.133 0.179 0.677 Te(+i) 0.742 0.330 0.081 0.135 0.674
P0 K Te
114 0.640 0.535 89 0.360 0.229 62 0.565 0.355 64 0.438 0.276 78 0.218 0.171
407
0.455 0.322 0.318
1. Pure spruce forest. 2. Spruce dominated forest. 3. Mixed conifer forest (spruce and pine). 4. Pine dominated forest. 5. Pure pine forest.
efficient (K) was 0.322, which according to Fleiss (1981) and Monserud and Leemans (1992) repre- sents a poor classification accuracy.
Since equal probabilities were assumed, the over- all and conditional tau indices based on equal prob- abilities of category membership correctly estimate random agreement. In Table 4, overall tau (Te) was 0.318. Thus, overall kappa overestimated classifi- cation accuracy and consequently underestimated chance agreement.
For some of the individual categories user's (p0(i+)) and producer's accuracy (po(+i)) as well as conditional kappa (Ki+ and K+i) and conditional tau (Te(+i)) indicated moderate and good agree- ment. However, the agreement varied substantially between categories. Conditional kappa based on the producer's approach (K+i) was in the range 0.133- 0.713, whereas conditional tau (T~(+i)) ranged from 0.081 to 0.742. For categories 1 and 2 conditional tau was larger than conditional kappa, which implies that conditional kappa underestimated classification accuracy. For categories 3, 4, and 5 conditional kappa was larger than conditional tau.
By means of Table 4 and some computation it can be verified that overall tau may be computed from the sum of the numerators and denominators of the individual conditional taus (Eq. 12).
4. Discussion and conclusions
Under the assumption of unknown marginal dis- tributions, the random agreement (Pi) of conditional tau (Eq. 10) is a measure of random assignment. Thus, conditional tau is a direct measure of improve- ment of a classification over a random assignment (Ma and Redmond, 1995). Therefore, conditional tau is easy to understand and interpret.
Kappa, however, measures the improvement of a classification over a chance agreement which depends on the level of actual agreement in the marginals. When the marginals of the reference data are not available in the classification process, it does not seem reasonable to allow the index of chance agreement to depend on the level of actual agree- ment in the marginals (Brennan and Prediger, 1981). In most classifications of remotely sensed data the marginals of the reference data are not known be- forehand, and thus the assumption of kappa and conditional kappa of known marginals is broken. Therefore, it would be difficult to interpret the re- suits of kappa and conditional kappa analysis in such cases.
Although Foody (1992), by means of one single numerical example, showed that the calculation of the proportion of chance agreement of the kappa coefficient overestimated the proportion of random
E. Ncesset /ISPRS Journal of Photogrammetry & Remote Sensing 51 (1996) 91-98 97
agreement of the tau coefficient with equal cate- gory probabilities, no specific relation exists between the chance agreement (Pe~+i)) of conditional kappa (Eq. 7) and the random agreements (1/k and P+i) of the conditional taus (Eqs. 11 and 13, respec- tively). In Table 4, it was found that conditional tau was smaller than conditional kappa for three of the categories (categories 3, 4, and 5). The overall tau value (0.318, Table 4) was smaller than the overall kappa coefficient (0.322, Table 4) too. This finding is in contrast to the findings of Ma and Redmond (1995). On the basis of six error matrices that all showed larger values for overall tau than for overall kappa, they stated that "the tau coefficients correctly estimate random agreements", and consequently that their empirical results "show that kappa constantly overestimates chance agreement and underestimates classification accuracy".
The use of 1/k as the probability of chance agreement in the conditional tau coefficient based on equal category probabilities may be criticised. For a fixed observed agreement (P0~+i), Eq. 11), the tau coefficient (Tel+i)) increases as the number of categories increases, i.e. Te~+i) approaches Po(+i) in value. Thus, if non-functional categories are used in a study, conditional tau may be artificially large (Brennan and Prediger, 1981). A further discussion of limitations regarding use of 1/k as the probability of chance agreement is provided by Lawlis and Lu (1972) and Brennan and Prediger (1981). However, in spite of the limitations, Brennan and Prediger (1981) state that this definition of chance agreement "appears to be useful in many studies in which marginals are not fixed a priori".
Nevertheless, the current analysis illustrates the simplicity of the calculation and the interpretation of the conditional tau coefficients. Furthermore, it indicates that the conditional tau analysis is more ap- propriate than the conditional kappa analysis in clas- sification accuracy assessment of remotely sensed data with unknown marginal distributions. The use- fulness of conditional indices in general is well documented by several previous real-life studies. Thus, the proposed indices of classification accuracy should be appropriate in cases where users require measures of accuracy which indicate the proportion of agreement present after the removal of the random agreement expected according to the assumptions of
the classification procedure. Because the conditional tau analysis provides detailed insight into the classi- fication accuracy of each category, it seems also to be a natural extension of the overall tau analysis.
Acknowledgements
I wish to thank the two anonymous referees for their helpful and constructive criticisms. This re- search was supported by the Research Council of Norway, and is a contribution to research project No. 103478/110.
References
Bishop, Y.M.M., Fienberg, S.E. and Holland, EW., 1975. Dis- crete Multivariate Analysis: Theory and Practice. The MIT Press, Cambridge, MA, 557 pp.
Brennan, R.L. and Prediger, D.J., 1981. Coefficient kappa: some uses, misuses, and alternatives. Educ. Psychol. Meas., 41: 687-699.
Cohen, J., 1960. A coefficient of agreement for nominal scales. Educ. Psychol. Meas., 20: 37-46.
Congalton, R.G., 1991. A review of assessing the accuracy of classifications of remotely sensed data. Remote Sensing Environ., 37: 35-46.
Congalton, R.G. and Mead, R.A., 1983. A quantitative method to test for consistency and correctness in photointerpretation. Photogramm. Eng. Remote Sensing, 49: 6%74.
Congalton, R.G., Oderwald, R.G. and Mead, R.A., 1983. Assess- ing Landsat classification accuracy using discrete multivari- ate analysis statistical techniques. Photogramm. Eng. Remote Sensing. 49: 1671-1678.
Fleiss, J.L., 1981. Statistical Methods for Rates and Proportions. 2nd ed., John Wiley and Sons, Inc., New York, 321 pp.
Foody, G.M., 1992. On the compensation for chance agreement in image classification accuracy assessment. Photogramm. Eng. Remote Sensing, 58: 1459-1460.
Hudson, W.D. and Ramm, C.W., 1987. Correct formulation of the kappa coefficient of agreement. Photogramm. Eng. Remote Sensing, 53: 421-422.
Lawlis, G.E and Lu, E., 1972. Judgments of counseling process: reliability, agreement, and error. Psychol. Bull., 78: 17-20.
Light, R.J., 1971. Measures of response agreement for qualitative data: some generalizations and alternatives. Psychol. Bull., 76: 365-377.
Ma, Z. and Redmond, R.L., 1995. Tau coefficient for accu- racy assessment of classification of remote sensing data. Pho- togramm. Eng. Remote Sensing, 61: 435-439.
Monserud, R.A. and Leemans, R., 1992. Comparing global veg- etation maps with the kappa statistic. Ecol. Model., 62: 275- 293.
N~esset, E., 1995. A method to test for systematic differences between maps and reality using error matrices. Int. J. Remote Sensing, in press.

98 E. Naesset / lSPRS Journal of Photogrammetry & Remote Sensing 51 (1996) 91-98
Rosenfield, G.H. and Fitzpatrick-Lins, K., 1986. A coefficient of agreement as a measure of thematic classification accuracy. Photogramm. Eng. Remote Sensing, 52: 223-227.
Story, M. and Congalton, R., 1986, Accuracy assessment: a user's perspective. Photogramm. Eng. Remote Sensing, 52: 397-399.