condition report backup - eric · 2013-08-02 · the ohio board of regents ohio needs educated...
TRANSCRIPT

Report on the Condition of Higher Education in Ohio:
Meeting the State’s Future NeedsMarch 31, 2008
The Ohio Board of Regents
Ohio needs educated college graduates in thenumbers and disciplines required to meet theworkforce needs of a thriving 21st century economy.
Photo: Miami University

Donna Alvarado, President, Aguila International, Chair, Ohio Board of Regents, former Chair,Governor's Workforce Policy Board, former member of the Board of Trustees of Central Ohio TechnicalCollege and executive committee the Ohio Association of Community College, Governor's Commissionon Higher Education and the Economy, member of Ohio Board of Regents Funding Commission
Bruce R. Beeghly, President, Altronic, Inc., Vice Chair, Ohio Board of Regents, Former Trustee andChair of the Board of Trustees, Youngstown State University, Member, Northeast Ohio UniversitiesCollaboration & Innovation Study Commission, Member of Ohio Board of Regents Funding Commission
James M. Tuschman, Esq., Of Counsel, Barkan and Robon, Ltd, Secretary, Ohio Board of Regents,Chair, Ohio Board of Regents Condition Report Committee, Former member of Governor's Commissionon Higher Education and the Economy and Vice Chairman of its Committee on Governance Structureand Finance, former Trustee and Chair of the Board of the University of Toledo, Member National AlumniCouncil, Moritz College of Law, The Ohio State University
Edmund J. Adams, Esq., Frost Brown Todd LLC, Former Chair, Ohio Board of Regents, Co-Chair,Committee on Governance, Structure and Finance, Governor's Commission on Higher Education andthe Economy, former Chair of the Economics Center for Education and Research at the University ofCincinnati, a former Director of the Ohio College Access Network program
Jeanette G. Brown, Retired Director of Corporate Research, BP America, Former Chair, Ohio Board ofRegents, former Distinguished Visiting Professor and Director, Research Enhancement, at OhioUniversity, former Chair of the Ohio University Board of Trustees, former Chair of the board of theCleveland Scholarship Programs and founding member of the Ohio College Access Network
Anthony D. Houston, President, Houston St. Clair Capital Partners, former director, City of ClevelandEmpowerment Zone, former member Cleveland Workforce Investment Board, former member,Cleveland Social Venture Partners, Director, Policybridge, Advisory Board, Cleveland ScholarshipPrograms, member, Caseplace, an affiliate of the Aspen Institute and Association of Governing Boards ofColleges and Universities, former Chair, Access and Success Committee and Advisory member OhioCollege Access Network
James F. Patterson, Owner, Patterson Fruit Farm, Former member and Chair of The Ohio StateUniversity Board of Trustees, former Chair of The Ohio State University Alumni Advisory Committee,member of the Ohio Agricultural Research and Development Center and The Ohio State UniversityExtension Support Councils
Dr. Walter A. Reiling, Jr., Surgeon, Gem City Surgical Associates, Inc., Voluntary faculty member ofthe Wright State University School of Medicine's voluntary faculty since its inception, Charter member ofWright State's Academy of Medicine, member and former chair of the Academy Board of Trustees, for-mer Wright State University Foundation Trustee and member of the Finance and Audit Committee
Jerry Tatar, Retired Chair, MeadWestvaco, Co-Chair, Access and Success Committee and member ofthe Steering Committee, Governor's Commission on Higher Education and the Economy, former mem-ber and Chair of the Sinclair Community College Board of Trustees, former board member and chair ofthe Ohio Foundation of Independent Colleges
EExx--ooffffiicciioo mmeemmbbeerrss:: Senator Joy Padgett, Ohio SenateRepresentative Arlene Setzer, Ohio House of Representatives
Eric D. Fingerhut, Chancellor, Ohio Board of RegentsFormer Ohio State Senator, former member of the U. S. House of Representatives,Director of Economic Development Education and Entrepreneurship as a member ofthe Business Administration faculty at Baldwin-Wallace College and as an adjunct facul-ty member in the Case Western Reserve University Department of Political Science,School of Law, and Weatherhead School of Management
Brenda Norman Albright served as the consultant to the Board of Regents in thedevelopment of the Condition Report.
Ohio Board of Regents

The Ohio Board of Regents presents its March 31, 2008 Report on the Condition of Higher Education in Ohio.The report will be issued annually and is a statutory responsibility under House Bill 2 of the 127th GeneralAssembly. Its purpose is to provide policymakers and the general public a snapshot of where Ohio standsin providing the higher education services Ohio needs to be competitive in today's world.
The Regents believe that Ohio needs college graduates in the numbers and disciplines required to meet theworkforce demands of a thriving 21st century economy and to ensure a higher quality of life for its citizens.The Regents also believe that continuous innovation through expanded workforce development, researchand technology transfer are vitally important for Ohio. “Meeting the state’s future needs” is the context forthe Condition Report.
To make the report easily accessible to readers:
We present a limited set of questions and facts focused on higher education's readiness toproduce college graduates, workforce development, research and technology transfer need-ed for a thriving 21st century. We then make conclusions and portray higher education'sreadiness with a dashboard.
Most of the information presents higher education as a whole – public and private – andwhen appropriate, public institutions only.
We identify 10 crucial challenges in educating, graduating and retaining more citizens andexpanding workforce development, research and technology transfer.
We believe that Ohio's higher education system is an extraordinary asset. Ohio's colleges and universitieseducate future leaders who will provide the talent, energy and innovation to keep Ohio competitive in aknowledge-based economy. Many of our academic, research and public service programs are nationally andinternationally recognized for their high quality. Students, faculty and institutional leaders are enormouslycapable, talented and committed.
When we assess the current condition of higher education, Ohio’s performance parallels other states inmany areas. However, when we assess “How well is higher education positioned to provide the needededucational services for a thriving 21st century economy?” we conclude that current levels and trends ineducational and degree attainment, participation, preparation, affordability, productivity and finance areinsufficient and must change.
We are optimistic and strongly support higher education. Reports from the Federal Reserve Bank ofCleveland and other state and national organizations underscore the pivotal role of higher education forOhio. Increasing degree attainment and workforce training, research and technology transfer activitiescan result in greater economic prosperity and a higher quality of life for all Ohioans. These actionsrequire greater institutional productivity and additional state, federal and private investments. In thelong-term, Ohio will reap tremendous benefits.
Sincerely,
Donna M. Alvarado, ChairBruce R. Beeghly, Vice ChairJames M.Tuschman, Secretary

ACKNOWLEDGEMENTS
The Regents benefited greatly from the insights and comments of numerous people, Chancellor Eric Fingerhut andmembers of his staff including Harry Andrist, Dave Brunson, Michael Chaney, Kimberly Chapple, Dee Delaney, TomFellrath, Deborah Gavlik, Darrell Glenn, Lori McCarthy, Rich Petrick, Noah Sudow, and William Wagner were enormously helpful. Trustees, college leadership and the various statewide stakeholder organizations including theInter-university Council, the Ohio Association of Community Colleges, the Association of Independent Collegesand Universities of Ohio, the Ohio Faculty Council, the Ohio Faculty Council of Community and Technical Colleges,the Ohio Department of Education and the Ohio Student Government Association provided excellent feedback thatshaped the Report. Dr. Joel A. Elvery and his colleagues at Cleveland State University provided useful earnedincome projections. Brenda Albright served as consultant for the overall effort.

Table of Contents
Executive Summary. . . . . . . . . . . . . . . . . . . . . . . . . . . . . . . . . . . . . . . . . . . . 6
Report on the Condition of Higher Education in Ohio . . . . . . . . . . . 16
Section 1: Ohio’s Economy and Its Relationship to Education . . . . . . . . . . 18
Section 2: Educational and Degree Attainment . . . . . . . . . . . . . . . . . . . . . . 22
Section 3: Participation . . . . . . . . . . . . . . . . . . . . . . . . . . . . . . . . . . . . . . . . . 26
Section 4: Preparation. . . . . . . . . . . . . . . . . . . . . . . . . . . . . . . . . . . . . . . . . . . 30
Section 5: Affordability . . . . . . . . . . . . . . . . . . . . . . . . . . . . . . . . . . . . . . . . . . 34
Section 6: Institutional Context – Breadth and Quality . . . . . . . . . . . . . . . . 38
Section 7: Financial Condition and Productivity . . . . . . . . . . . . . . . . . . . . . 44
Section 8: Economic Development: Workforce Development, Research and Technology Transfer . . . . . . . . . . . . . . . . . . . . 48
Section 9: Summary and Next Steps . . . . . . . . . . . . . . . . . . . . . . . . . . . . . . 52
Appendices, Resources and End Notes . . . . . . . . . . . . . . . . . . . . . . . . . 56

Executive SummaryPhoto: University of Cincinnati
What can Ohio do to ensure a better quality of life for its citizens and greater economic prosperity in thefuture? Ohio must produce and retain more college graduates, attract more college graduates from otherstates and countries and increase workforce development, research and technology transfer activities in acontext of ever-growing global economic competition. The bottom line is that more Ohioans than ever beforein our history must obtain college degrees that prepare them to operate on the outer edge of knowledge andto innovate.
If Ohio is successful in producing more degrees, what will it mean for the state? Producing up to 30% morebachelor’s or higher degrees and increasing the number of associate’s degrees will give Ohio an additional$1.4 billion of annual expected earned income in 10 years and $5.6 billion more by 2030 (estimates are inconstant dollars and were calculated by Cleveland State University’s Urban University Program, seeAppendix B). Attracting and retaining more college graduates will further increase the estimated dollarimpact. More income will mean greater consumer spending, a more robust economy and a better quality oflife for Ohioans.
In preparing the Report on the Condition of Higher Education in Ohio, the Regents set a context by asking:How well is higher education positioned to provide essential educational, research and public services for athriving 21st century economy? We answer this question by assessing Ohio’s:
Educational and degree attainment and participation
Preparation
Affordability
Financial condition and productivity
Workforce development, research and technology transfer
Capabilities and strengths of Ohio’s higher education system
Six questions form the core of The Condition Report.
Ohio’s future is linked to
education and innovation
Executive Summary
7

What we know:
Ohio produces more bachelor’s degrees per capi-ta than the national average, but, like severalother states, many college graduates leave Ohio.However, fewer college graduates relocate toOhio than other states. The result is that the netpercentage of Ohioans with associate’s or higherdegrees is lower than most other states. (U. S.Census, American Community Survey, 2006)
The educational attainment for Ohio’s black andHispanic citizens is far below its white population.Associate’s degree and higher attainment forblack males is about 61%, black females is about71%, Hispanic males is about 68% and Hispanicfemales is about 84% of the white population.(Appendix D, Chart 2)
Ohio's public and private institutions are award-ing more degrees than in past years. In 2000,about 90,000 degrees were awarded, and in2006, about 118,000 degrees were awarded. (Boardof Regents' Data System and NCES, Integrated PostsecondaryData System)
Ohio is so far behind other states in educationalattainment that it will take extraordinary meas-ures for Ohio to catch up. (U. S. Census, AmericanCommunity Survey, 2006)
Ohio’s enrollment of 18-24 year-olds in college orgraduate school closely parallels the nation, butenrollment of 25-49 year-olds is almost 20%below the national average. Ohio is belowMidwest averages for participation in all agegroups. (Appendix C, Table 3)
The chart below shows Ohio’s current associate orhigher degree attainment. What does it take for Ohioto be average? Nearly 230,000 additional Ohioanswith associate’s, bachelor’s or higher degrees. Whatdoes it take to be a top-performing Midwest state likeMinnesotai? More than 600,000 additional Ohioanswith associate’s, bachelor’s or higher degrees.
Question #1
Are current levels of educational and degree attainment and participation inhigher education adequate for the 21st century economy?
We conclude:
Ohio’s participation, educational and degree attainment are not competitive with otherstates and must improve.
8

What we know:
More than one-third of recent high school gradu-ates must enroll in remedial math and/or Englishin college. (Board of Regents’ Performance Report, 2006)
In 2007, Ohio enacted legislation for a more rigorous core curriculum. While this legislation isa positive step forward, the core curriculum doesnot mandate four years of increasingly more rigorous math courses or any foreign languagerequirements. Recent research indicates that themost effective preparation exceeds the traditionalcore curriculum across most subject areas.Trustees have emphasized the importance of astrong P-16 continuum that includes effective student counseling.
Ohio is close to the bottom of Midwest states in9th to 12th graders taking at least one upper levelscience course. (Appendix C, Table 2) Note: The effects ofrecent changes in the high school graduation requirementsregarding science may not be fully reflected in these statistics.
High school students take fewer AdvancedPlacement (AP) courses than students in otherstates. (The 4th Annual AP Report to the Nation, 2008, TheCollege Board)
Students can dramatically improve their prepara-tion by taking more highly-rigorous high schoolcourses, particularly AP.ii
When Ohioans are not academically prepared, they are less likely to enroll or graduate from college. Lack ofpreparation also has a negative effect on higher education’s efficiency and productivity because colleges mustinvest more resources to help students become college-ready. In addition, college is more expensive for students who lack preparation because it takes longer for students to graduate so they pay more in tuition.
Question #2
Are Ohio’s citizens adequately prepared for college?
We conclude:
Too many Ohio citizens are not adequately prepared for college and preparationmust improve.
9

What we know:
As the chart below shows, tuition and fees forOhio’s public four-year and two-year institutionsare almost 50% above national averages and,until the current tuition freeze, rose rapidly. Ohioranks among the 10 most expensive states intuition and fee charges.
Ohioans pay different tuitions for a two-year col-lege education based on where they live becauseuniversity branches and technical colleges chargesignificantly more than community colleges.
When combined with federal Pell grants, the newCollege Opportunity grants are designed to fully-fund tuition at public two-year institutions forOhio’s neediest citizens (typically students fromfamilies with annual incomes of $25,000 or less).iii
Some students, in both urban and rural areas,still may have as much as $2,000 in unmet finan-cial need, which is a significant barrier to accessand success.
Students pay high tuition and fees in Ohiobecause state and local tax support for highereducation is low. In 2006 Ohio’s tax support wasmore than $1600 less than the national average.
Are Ohio’s public higher education institutions affordable?
Question #3
We conclude:
Ohio’s public institutions are are among the least affordable in the nation and this situation must change.
10

Question #4
What we know:
While Ohio’s current state appropriations plus tuition and other revenues dedicated to educate studentsare about average when compared with other states, unlike most states, Ohio relies heavily on studenttuition to fund higher education. This has the consequence that Ohio families must shoulder 30% of family income to pay for public two-year colleges’ expenses and 42% for public four-year institutions’expenses. Moreover, Ohio relies on institutions to pay for substantial capital renewal with local facilitiesdebt, which means that Ohio's colleges and universities have less flexibility in using tuition revenuesthan institutions in many other states. (Appendix C, Table 4)
Ohio’s as well as other state’s higher education institutions have a number of financial pressures including:
Skyrocketing energy and health care costs
High costs for capital renewal to renovate, rehabilitate or replace aging facilities
Substantial costs of specialized high tech equipment and facilities
Environmental issues including costly government regulations, energy con-
servation and reductions of greenhouse gases
Ohio’s colleges and universities have documented a number of academic and administrative productivityimprovements, and Ohio has a strong fiscal health reporting system.
Degree completion rates are a proxy for the relative efficiency of the state’s postsecondary system. Ohio’stwo-year college completion rate is near the average for the midwest region and the nation. Ohio’s six-year bachelor’s degree completion rate is near the national average but is behind all but two other statesin the midwest region.
Enrolling many more students and expanding research will require renovation to current campus infra-structure and possibly some new buildings.
Are Ohio’s public institutions currently able to financially support substantial increases in enrollments and degrees?
We conclude:
Ohio's institutions need to improve productivity and additional state, federal, and pri-vate investments are necessary to support additional students
11

What we know about workforce:
All campuses are extensively involved in work-force development activities. Enterprise Ohio hasbeen created as a network of focused activity forworkforce development.
Ohio is launching the Ohio Skills Bank to supportregional partnerships in twelve designated eco-nomic regions. The purpose of the Bank is toaddress critical occupational and skill shortageswithin the regions and create convenient, cus-tomized learning pathways that prepare adultlearners to fill available jobs.
Ohio’s Workforce Investment Act program is suc-cessfully meeting the needs of many participantsthrough increased employment and employmentretention rates. However, for July 1, 2005 throughJune 30, 2006, Ohio under spent its availableWorkforce Investment Act monies by nearly $42.5million, more than 20% of available funds forworkforce development for dislocated workers,adults and youth.iv
Are higher education’s current contributions to workforce development,research and technology transfer adequate to support a thriving
21st century economy?
What we know about research:
Research funding has almost doubled in the past10 years, but is still below national benchmarks.
Applications for patents, invention disclosuressubmitted, licenses, options executed and grosslicense income have increased dramatically.
Ohio jumpstarted the expansion of its researchand technology transfer activities in 2002 by cre-ating the Third Frontier Project, a 10-year, $1.6 bil-lion initiative.
Ohio’s has made substantial investments in majorhigher education research programs, including itsResearch and Eminent Scholars programs andmedical education.
Question #5
We conclude:
While Ohio has made progress, additional investments in research and technologytransfer are critical to future success.
We conclude:
Innovative changes are needed to expand employability skills programs to develop ahigh-talent, flexible workforce and a new cadre of entrepreneurs who can compete in arapidly changing global economy.
12

What we know:
Ohio’s higher education system is an extraordinary asset:
All citizens live within 30 miles of a college or university campus; however, only about four per-cent of the adult population (ages 25 and older) are taking advantage of the availability of highereducation by enrolling in college.
Ohio’s high quality academic, research and public service programs are nationally and interna-tionally recognized.
Students who graduate from Ohio’s colleges and universities succeed in passing licensure exams,have higher incomes and contribute to their communities and the state. (Board of Regents’Performance Report, 2006)
Ohio has the infrastructure and many collaborative partnerships needed to support expandededucation, research and public service activities.
The high quality and capabilities of Ohio’s higher education system are exceptional resources that can pro-vide the educational, research and public services needed to support a thriving 21st century economy.
Is Ohio’s higher education system capable of providing educational,research and public services needed to support a
thriving 21st century economy?
Question #6
We conclude:
Ohio’s higher education system is well-positioned for the 21st century, but institutionsneed to improve focus on their core strengths, reposition themselves to serve addi-tional and more diverse students and increase collaboration to benefit all Ohioans.
13

As other state and national reports have concluded, Ohio’s is losing ground in its economic prosperity, which isdirectly related to educational attainment, workforce training, research and technology transfer. If Ohio is to havecollege graduates in the numbers and disciplines that it needs for a thriving 21st century economy, how ready ishigher education to help Ohio achieve this goal? The Regents assess higher education’s condition in the follow-ing dashboard:
Higher Education in Ohio – 2008 Condition Dashboard
How ready is higher education to meet the needs of a thriving 21st century economy?
Summary and Next Steps
14
How well is higher education positioned to provide the needed educational
services for a thriving 21st century economy? Current trends in educational
and degree attainment, participation, preparation, affordability, productivi-
ty and finance, and workforce development, research and technology
transfer are insufficient and must change.
Within the overall context of producing more college graduates and increasing workforce development, researchand technology transfer, Ohio faces 10 significant challenges:
1. Projected declines in the State’s youth and working age population.
2. Enrolling and graduating more adults (over 25 year olds).
3. Improving college-going rates directly from high school.
4. Improving participation and degrees awarded in educationally underserved counties.
5. Improving college and university retention, graduation, two-year to four-year transfer
rates and P-12 linkages.
6. Increasing the number of students taking more rigorous high school courses, including
Advanced Placement and Postsecondary Education Opportunity courses.
7. Making higher education more affordable.
8. Achieving equitable financial access to 2-year colleges in all geographic regions.
9. Increasing state, federal and private investments for education and research.
10. Increasing degree attainment while maintaining high quality.
Future Annual Condition Reports will closely monitor each of these areas and address underlying causes thatexplain Ohio’s performance as well as additional topics. BBeeccaauussee ooff tthhee ssttrreennggtthh ooff OOhhiioo’’ss hhiigghheerr eedduuccaattiioonn ssyyss--tteemm,, wwee aarree ooppttiimmiissttiicc aanndd ccoonnffiiddeenntt tthhaatt OOhhiioo wwiillll ssuucccceessssffuullllyy ccoonnffrroonntt tthheessee cchhaalllleennggeess.. IInnccrreeaassiinngg tthhee nnuumm--bbeerr ooff ccoolllleeggee ggrraadduuaatteess aanndd wwoorrkkffoorrccee ddeevveellooppmmeenntt,, rreesseeaarrcchh aanndd tteecchhnnoollooggyy ttrraannssffeerr aaccttiivviittiieess wwiillll lleeaadd ttoo bbeett--tteerr eeccoonnoommiicc pprroossppeerriittyy aanndd aa hhiigghheerr qquuaalliittyy ooff lliiffee ffoorr OOhhiiooaannss.. TToo aacchhiieevvee tthheessee rreessuullttss,, iinnssttiittuuttiioonnss mmuusstt bbeemmoorree pprroodduuccttiivvee,, aanndd aaddddiittiioonnaall ssttaattee,, ffeeddeerraall aanndd pprriivvaattee iinnvveessttmmeennttss aarree rreeqquuiirreedd.. IInn tthhee lloonngg--tteerrmm,, OOhhiioo wwiillllrreeaapp ttrreemmeennddoouuss bbeenneeffiittss..
15

Report on the Condition of Higher Education in Ohio
“- the task of building a knowledge driven economy by maximizing higher education’s potential forgenerating new ideas, innovative products and better trained workers cannot be left to chance.”
Governor’s Commission on Higher Education and the Economy, 2004
Photo: Kent State University
For “states that do not perform well in increasingthe educational level of their population, the resultswill cost them dearly.”v What can Ohio do to ensurethat it has educated college graduates in the num-bers and disciplines required to meet the workforceneeds of a thriving 21st century economy and toensure a higher quality of life for its citizens? Ohiocan graduate more students from college, retainmore graduates and attract more well-educatedindividuals to the state. Increasing workforce devel-opment, research and technology transfer activitieswill also result in a stronger economy.
This task is not easy. In assessing the current condi-tion of higher education, Ohio is average in manyareas. How well is higher education positioned toprovide the needed educational services for a thriv-ing 21st century economy? Current trends in educa-tional attainment, degrees, participation, prepara-tion, affordability, productivity and finance, andworkforce development, research and technologytransfer are insufficient and must change. The fol-lowing nine sections of the Condition Report high-light the Regents conclusions about the condition ofhigher education in Ohio.
The Regents sought feedback from several organiza-tions as noted in Appendix A and held a videocon-ference and web cast with college and universitytrustees. The feedback was most helpful in shapingThe Condition Report.
Meeting the state’s future needs
Report on the Condition of Higher Education in Ohio
Section 1:Ohio’s Economy and Its Relationship to Education
Section 2:Educational and Degree Attainment
Section 3:Participation
Section 4:Preparation
Section 5:Affordability
Section 6:Institutional Context: Breadth and Quality
Section 7:Financial Condition andProductivity
Section 8:Economic DevelopmentWorkforce Development, Research andTechnology Transfer
Section 9:Summary and Next Steps
17

Summary: Ohio is falling behind other states in economic prosperity. This trend will likely continue unless Ohio graduatesmore students from college, retains more graduates in the state andattracts more well-educated individuals to Ohio. Increasing work-force development, research and technology transfer could alsoimprove the economy.
Ohio’s Economy andIts Relationship to Education
“Why do residents of some states have higher incomes
than residents of other states? Why have these income
differences persisted for the past 75 years?
Over the long run, factors like innovation and a skilled
labor force appear to make a big difference in explain-
ing why some states have grown more than others.”
– Federal Reserve Bank of Cleveland, 2005
Photo: Wright State University - Lake Campus

SECTION 1
Ohio’s Economy andIts Relationship toEducation
Ohioans’ income, once above the national aver-age, has declined steadily relative to otherstates for several decades. As the followingchart shows, in the past 10 years, Ohio’s percapita income has fallen from 97% of the nation-al average to 92%.
A recent national study showed that:
“Across every income group, Americans aremore likely to surpass their parents’ incomein absolute terms if they earn a collegedegree, reinforcing the conventional wisdomthat higher education provides a means foropportunity.”vi YYoouu aarree ffoouurr ttiimmeess mmoorree lliikkee--llyy ttoo mmoovvee ffrroomm ppoovveerrttyy ttoo wweeaalltthh iiff yyoouueeaarrnn aa ccoolllleeggee ddeeggrreeee tthhaann iiff yyoouu ddoo nnoott..
“Family background plays an equally, if notmore important, role than education.” If youare born into wealth, you have a 23% chanceof remaining wealthy if you don’t obtain aneducation. Yet if you’re born into poverty,you only have a 19% chance of moving tothe top, and that’s if you earn a collegedegree. There’s only a 5% chance if you don’tget an education.vii
“... highereducationprovides ameans foropportunity.”
Ohio has many strong attributes. It ranks seventh in the country in economic output and fifth in Fortune 500companies (Department of Development Website, 2008). Historically, economic prosperity has been linked toeducation, and the link is expected to be stronger in the future with estimates that nearly 80% of all new jobsduring the next 20 years will require some education beyond high school.
How does Ohio’s economic prosperity compare with other states?What we know:
Section 1: Ohio’s Economy and Its Relationship to Education 19

Ohio can graduate more citizens from college,take actions to increase the likelihood that peoplewith degrees will stay and attract more well-edu-cated people to Ohio.
What does producing more degrees mean forOhio?
Producing up to 30% more bachelor’s or high-er degrees and increasing the number of asso-ciate’s degrees means an additional $1.4 billionannual expected earned income in 10 yearsand $5.6 billion by 2030. (Estimates are in constantdollars and were calculated by Cleveland State University’sUrban University Program, see Appendix B) Attractingand retaining more college graduates wouldincrease the estimated dollar impact.
Demographics are a challenge for educatingmore citizens:
Ohio’s population is expected to remainessentially unchanged by 2030. Only NorthDakota, Iowa and West Virginia are expectedto experience slower population growth thanOhio, and the U. S. population is projected toincrease by 23%. (Appendix C, Table 1)
Ohio will have actual declines in the state’syouth (under age 18) and individuals in theirprime working years of 18-64 while the num-ber of individuals age 65 and over is expectedto increase by nearly 55%. (Appendix C, Table 1)
How can Ohio change its future economic prosperity?What we know:
How does Ohio’s economic prosperity compare with other states?
We conclude: Ohio is falling behind other states and mustincrease degree attainment, workforce develop-ment, research and technology transfer.
20 Section 1: Ohio’s Economy and Its Relationship to Education


Summary: Ohio produces more bachelor’s degrees per capita than the nation-al average, but, like several other states, many of Ohio’s college graduates leave thestate. When the number of college graduates with a bachelor’s degree or higher wholeft Ohio is combined with the number who moved in, Ohio loses graduates. Thistrend has a significant impact on the state’s educational attainment. Ohio is so farbehind other states in educational attainment of adults that it will take extraordinarymeasures for Ohio to catch up. Producing more graduates, keeping graduates inOhio and importing more degree holders are critical for Ohio’s future prosperity.Ohio cannot close the gap by enrolling and graduating more traditional college stu-dents. Ohio must enroll and graduate more working adults from its colleges anduniversities. Improving retention rates, particularly at four-year campuses, couldalso increase degree attainment.
Educational and Degree Attainment
“The knowledge economy is unforgiving for individu-
als who do not have education or training beyond
high school – and for communities, states, and
nations that do not have high percentages of their
populations with some education or training beyond
high school.”- The National Center for Public Policy and
Higher Education and the National Center for Higher Education Management Systems, 2007
Photo: Bowling Green State University

SECTION 2
Educational and Degree Attainment
How does Ohio’s educational attainment compare with other states?What we know:
The chart on the right shows that Ohio is sub-stantially below the national average in adultswith associate’s, bachelor’s or higher degrees,and Ohio has made no progress in changing itsrelative position in the past 16 years.
Ohio is slightly below the national average ofadults with two-year (associate) degrees. (U. S.Census, American Community Survey, 2006)
In the Midwest, Ohio is ahead of only Indiana inpercentage of adults with a four-year (bache-lor’s) or higher degree. (Appendix C, Table 1)
The educational attainment for Ohio’s black andHispanic citizens is far below its white popula-tion. Associate’s degree and higher attainmentfor black males is about 61%, black females isabout 71%, Hispanic males is about 68% andHispanic females is about 84% of the whitepopulation. (Appendix D, Chart 2)
What does it take for Ohio to be average?Nearly 230,000 additional Ohioans with associ-ate’s, bachelor’s or higher degrees. What does ittake to be a top-performing Midwest state likeMinnesota? More than 600,000 additionalOhioans with associate’s, bachelor’s or higherdegrees. viii
Section 2: Educational and Degree Attainment 23
Reviewing trends in degree attainment, student persistence, college graduates leaving the State and college gradu-ates moving into the state are helpful in identifying the underlying causes for Ohio’s educational attainment.

How competitive is Ohio’s degree attainment?What we know:
24 Section 2: Educational and Degree Attainment
Ohio produces more four-year (bachelor’s) degrees,slightly fewer graduate and professional degrees,and fewer two-year (associate’s) degrees per capitathan the national average. (Appendix D, Chart 1)
Ohio’s associate degree attainment per capita was92% of the U.S. level in 1995, but dropped to 84%in 2005. (Ohio Board of Regents’ Performance Report, 2006)
Ohio's public and private institutions are award-ing more degrees than in past years. In 2000,about 90,000 degrees were awarded, and in2006, about 118,000 degrees were awarded. (Boardof Regents' Data System and NCES, Integrated PostsecondaryData System) Associate degrees awarded, particular-ly in science, technology, engineering, math, andhealth fields are growing at a fast pace. (AppendixD, Chart 3)
Nationally, about 16% of community college stu-dents earn an associate’s degree and about 53%of four-year college students earn a bachelor’sdegree within five years. Graduation rates forlow-income and minority students at two- andfour-year colleges lag substantially behind thosefor middle- and high-income students, as well asfor white students.ix
The barriers to postsecondary success for low-income adults are especially high. Nationally, asizeable portion of college students are low-income adults, who are much less likely to suc-ceed than their traditional-aged, more affluentpeers. Nationally, two-thirds of low-income adultswho entered college in 1995-1996 reported thatthey were seeking a bachelor’s or associate’sdegree. However, of those adults, only 7% earneda bachelor’s degree and only 8% earned an asso-ciate’s degree within six years.x
How is degree attainment affected by student persistence and transfer? What we know:
Ohio’s two-year colleges’ persistence rate fromthe first to second year is near the average forthe Midwest and slightly below the nation.(Appendix C, Table 3)
The four-year college persistence rate is belowthe national average and behind all but two otherMidwest states. (Appendix C, Table 3)
Only 7% of bachelor’s degree graduates in 2005transferred at least 30 semester hours from com-munity colleges and 11% transferred credits fromregional campuses. (Board of Regents’ PerformanceReport, 2006)
The transfer process from two-year to four-yearinstitutions must go smoothly if non-traditionalstudents are to succeed in attaining bachelor’sdegrees.
A user-friendly statewide transfer system hasbeen implemented to enable students to transfereasily among public institutions. However, sometwo-year college faculty have said that the cur-rent system is not nearly “user-friendly” enoughnor does it enable students to transfer easilyamong institutions. Faculty observed thatalthough credits may transfer, they sometimes donot apply to the student’s degree.

Like several other states, many of Ohio’s college graduates leave the state. However, fewer college graduatesrelocate to Ohio than other states. For example, Ohio and Illinois are similar in terms of college graduatesleaving the state. However, more college graduates move into Illinois than leave. For Ohio, more graduatesleave than move in. For the one year period of 2004 to 2005, when the number of college graduates with abachelor’s degree or higher who left Ohio is combined with the number who moved in, Ohio lost 9,000 grad-uates. In contrast, Illinois gained 9,000 graduates.xi
Community college faculty have emphasized that cooperative education, internships, clinical experiencesand service learning are effective ways to keep graduates from leaving the state. These programs can alsohelp students pay for college and improve graduation rates.
Do college graduates stay or move out of Ohio?What we know:
Section 2: Educational and Degree Attainment 25
Within one-half year of graduation,
41% of medical school graduates leave Ohio
37% of the doctoral graduates leave Ohio
34% of the law graduates leave Ohio
27% of the bachelor’s graduates leave Ohio
24% of the master’s graduates leave Ohio
13% of the associate graduates leave Ohio (Appendix D, Chart 4)
Is Ohio’s educational and degree attainment competitive for the future?
We conclude: Ohio’s educational and degree attainment is not competitive with other states and must improve.
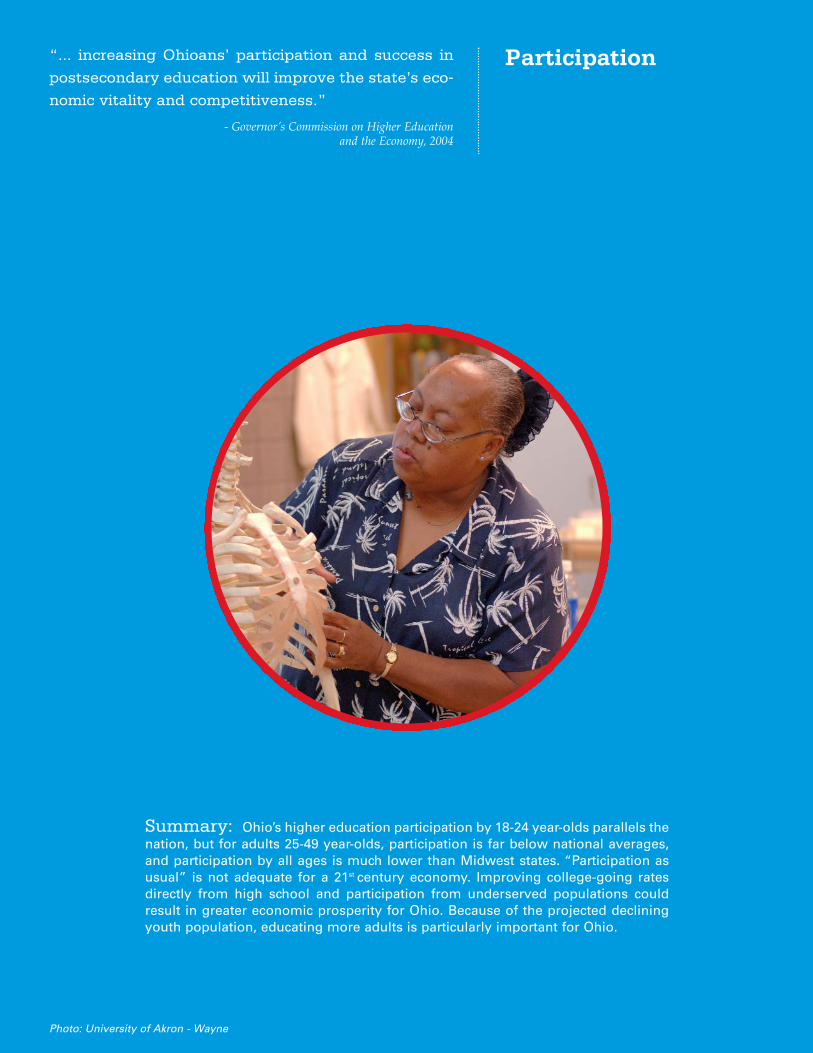
Summary: Ohio’s higher education participation by 18-24 year-olds parallels thenation, but for adults 25-49 year-olds, participation is far below national averages,and participation by all ages is much lower than Midwest states. “Participation asusual” is not adequate for a 21st century economy. Improving college-going ratesdirectly from high school and participation from underserved populations couldresult in greater economic prosperity for Ohio. Because of the projected decliningyouth population, educating more adults is particularly important for Ohio.
Participation“... increasing Ohioans’ participation and success in
postsecondary education will improve the state’s eco-
nomic vitality and competitiveness.”
- Governor’s Commission on Higher Education and the Economy, 2004
Photo: University of Akron - Wayne

SECTION 3
Participation
In assessing Ohio’s participation in higher education, it is important to examine the pipeline. How many studentsare in the traditional high school pipeline? Do students graduate from high school? Do students go to collegedirectly from high school? What about adults? What is Ohio’s participation from all age groups? Is it adequate?
Is Ohio’s educational pipeline adequate to meet the needs of a 21st
century economy?What we know:
Ohio will see a modest increase (1%) in publichigh school graduates from 2003 through 2018.(Knocking At The College Door, Western InterstateCommission on Higher Education, 2003)
The chart on the right and information inAppendix D show:
Ohio’s high school graduation rates are con-siderably above the averages of other statesand have improved since 1996. (Appendix D,Chart 5)
Ohio’s college-going rate directly followinghigh school graduation is below the nationalaverage, and it has dropped since 2002.(Appendix D, Chart 5)
High school graduation rates vary significantlyamong counties. Athens County, Wood Countyand Portage County lead the state in this meas-ure (for 18-24 year olds) while Geauga, Vintonand Holmes counties have the lowest percent-ages. (U. S. Census, American Community Survey, 2006)
Section 3: Participation 27

Ohio’s enrollment of 18-24 year-olds in college orgraduate school closely parallels the nation, but25-49 year-olds participation is almost 20% belowthe national average and Ohio is below Midwestaverages for participation in all age groups.(Appendix C, Table 3)
Enrollment has increased significantly since 2001.(Board of Regents’ Performance Report, 2006)
The 127th General Assembly recognized the needto educate more Ohioans and enacted legislationcalling for increasing the number of Ohioansenrolled by 230,000 by 2017 and increasing grad-uation rates.
The Ohio College Access Network (OCAN) wasfounded in 1999 as the first statewide coordinat-ing body for college access programs in thenation. OCAN helps Ohio residents pursue post-secondary education. Currently, 35 college accessprograms serve nearly 205 of Ohio’s 612 schooldistricts, touching 173,000 students annually.
Participation of adults is particularly important forOhio. A recent national study concluded thatdespite the many programs and services thatinstitutions provide for low-income adults, with-out financial support and affordable childcare,many adults still struggle to succeed in highereducation.xiv
The traditional pipeline of high school studentswill not address Ohio’s educational needs. Toreach international competitiveness by 2025,Ohio cannot close the gap with traditional collegestudents. Ohio must rely on the re-entry pipeline-getting older adults back into the education sys-tem and on track to attaining college degrees.xii
Ohio has expanded educational opportunitiesthough E-Learning (online, interactive video, tele-vision, CD, DVD and correspondence courses).
The Ohio Learning Network is a consortium of 81of Ohio’s public and private colleges and univer-sities. More than 85% of E-Learning courses areoffered via the Web.
In 2006, Ohio public and independent collegesand universities enrolled nearly 100,000 people inE-Learning courses, a 55% increase from 2005.Adults (25 and older) make up half of the enroll-ments. Ohio’s community and technical collegesenroll 63% of all the public undergraduate E-Learning students.xiii
Is participation in higher education adequate?What we know:
Is Ohio’s participation in higher education adequate for the future?
We conclude: Ohio’s participation for 18-24 year-olds parallelsthe nation, but participation by 25-49 year-olds isfar below national averages and these trendsmust improve.
28 Section 3: Participation


Summary: Research shows that students who take multiple remedial coursesin college are less likely to graduate. When citizens are not academically preparedfor higher education, they are less likely to enroll or graduate from college. In addition, lack of preparation has a negative effect on higher education's efficiencyand productivity. Colleges must invest more resources to help students be college-ready. In addition, college is more expensive for students who lack adequate preparation because it takes longer for students to graduate so they pay moretuition. Students can dramatically improve their preparation by taking more highly-rigorous high school courses, including AP courses and Postsecondary EducationOpportunity courses. Students who succeed on two or more AP Exams are muchmore likely than their peers to complete a bachelor's degree in four years or less.xx
Preparation“College readiness skills are indistinguishable from
those needed for success in modern jobs.”
– Achieve, Inc., 2008
Photo: The Ohio State University - Marion

SECTION 4
Preparation
In assessing the condition of Ohioans’ college readiness, enrollments in high school courses and college remedi-al courses were examined. In addition, national research was reviewed to identify underlying causes that explainOhio’s performance.
Are Ohioans adequately prepared for college?What we know:
As the chart shows, more than one-third ofrecent high school graduates must enroll inremedial math or English.
For students over the age of 20, 40% must enrollin remedial math or English.
Students who successfully complete all remedialcourses (54% of all remedial course-takers) atOhio’s public colleges and universities doalmost as well in the second year as studentswho did not take any remedial courses. Theyreturn to college in the second year at about thesame rate, the pass rates for credits taken areabout the same and the average grade pointaverage is about the same. (Board of Regents’Performance Report, 2006)
Ohio’s math teachers are among the most highlyqualified in the Midwest region as measured bythe percentage of high school students whoseteachers majored in math in college. More Ohiohigh school students take one upper level mathcourse than students in other states. (Appendix C,Table 2)
Section 4: Preparation 31

Ohio’s 2006 graduating class scored slightlyabove the national average on the ACT tests.(Appendix D, Chart 6)
In January 2007, Ohio enacted legislation for amore rigorous core curriculum. While this legisla-tion is a positive step forward, the core curricu-lum does not mandate four years of increasinglymore rigorous math courses or any foreign lan-guage requirements. Recent research indicatesthat the most effective preparation is a curricu-lum that exceeds the traditional core curriculumacross most subject areas. Trustees have empha-sized the importance of a strong P-16 continuumwith effective student counseling.
Ohio’s 8th grade test takers scored at or above“proficient” on the National Assessment ofEducational Progress (NAEP) tests in math, sci-ence, reading and writing. (Measuring Up, 2007)
What we know about the underlying causes forOhio’s academic preparation:
Not enough high school students are taking ahighly rigorous curriculum. Feedback from facultyunderscores the need for students to takeTrigonometry in high school. They observed thata generation ago, Trigonometry was taught withAlgebra 2, and now it is typically taught in Pre-Calculus, which is taken by considerably fewerstudents.
Ohio has low-participation in AdvancedPlacement (AP) course-taking. (Note: The AdvancedPlacement program was established by the College Board in 1955and is designed to provide rigorous, college-level courses andassessments for high school students). Ohio’s AdvancedPlacement (AP) course-taking is growing, butOhio is below the national average. If AP courseswere taken at the national rate, an additional8,000 Ohio students would enroll each year.National studies show a strong relationship withthe AP program and successful postsecondaryperformance and persistence. Students who taketwo or more AP exams are more likely to attain abachelor’s degree.xv
Only about 4% of 11th and 12th graders takePostsecondary Education Opportunity courses.(Board of Regents’ Performance Report, 2006)
Only two-thirds of Ohio’s science teachersmajored in science in college – the lowest rate inthe Midwest region. Ohio is near the bottom ofMidwest states in 9th to 12th graders taking at lestone upper level science course. (Appendix C, Table 2)Note: recent changes in the high school graduation requirementsregarding science may not be fully reflected in the available sta-tistics.
Only 61% of Ohio’s 7th to 12th graders are enrolledin academic core courses (math, science, English,and social studies) which are taught by individu-als with a college major directly related to theirteaching subject. Ohio is below the national aver-age of 70%, and at the bottom in the Midwest.(Appendix C, Table 2)
What we know from national research:
Students who take two or more remedial educa-tion courses are less likely to complete a postsec-ondary certificate or degree (41% compared with69% of those who do not take remediation).xvi
Nationally, more than half, 55%, of first-genera-tion students took remedial education. A rigoroushigh school curriculum, including advancedmathematics narrows the gap in postsecondaryoutcomes for first-generation students.xvii
National studies show that despite a higher rateof remediation and more family obligations, low-income adult students earn slightly better grades,on average, than do traditional students.xviii
Making college awareness services and activitiesavailable to students and parents has significantand positive effects on students’ preparation andplans for college.xix
Are Ohioans adequatelyprepared for college?
We conclude: Too many Ohio citizens are not adequately pre-pared for college and preparation must improve.
32 Section 4: Preparation


Summary: Tuition levels can price academically able students out of the sys-tem. Affordability is connected to preparation, participation and degree attainment.Ohio’s public colleges and universities are among the least affordable in the nation.Ohio is seeking to improve affordability for its neediest students through a combi-nation of freezing/limiting fee increases and expanding need-based financial aid.
Affordability
Photo: Miami University - Middletown

SECTION 5
Affordability
To assess the affordability of higher education, tuition and fees were reviewed and their relationship with familyincome as well as student financial aid. Many states collect “net price” information, which is useful in assessingaffordability for students. The Board of Regents plans to collect this information in the future.
How affordable are Ohio’s public higher education institutions?What we know:
Ohio ranks as one of the most expensive 10states in tuition and fee charges. As the chart onthe next page shows, tuition and fees for Ohio’spublic four-year and two-year institutions arealmost 50% above national averages, and, untilthis biennium, rose rapidly.
Financial access to two-year colleges is not equi-table because university branches and technicalcolleges charge significantly more than commu-nity colleges.
Students pay high tuition and fees in Ohiobecause state and local tax support per student islow. In 2006, Ohio’s tax support was more than$1600 less than the national average.xxi Becauseof debt incurred to finance facilities, Ohio’s col-leges and universities have less flexibility withtuition revenues than many other institutions.
The Ohio College Access Network, formed in1999 provides free counseling to families and students on sources of financial aid.
Ohio is expanding its student financial aid programs:
The Ohio College Opportunity Grant, whencombined with federal Pell grants, will fully-fund tuition at public two-year institutions forOhio’s neediest citizens (typically studentsfrom families with annual incomes of $25,000or less). The Grant will improve the chancesthat needy students will enroll and succeed inhigher education.xxii Some students, in bothurban and rural areas, still may have as muchas $2,000 in unmet financial need, which is asignificant barrier to access and success.
The new Choose Ohio First ScholarshipProgram will support undergraduate and/orgraduate education for many Ohio residents inscience, technology, engineering, and math(STEM) fields, medicine, and STEM education.
Section 5: Affordability 35

What does research say about affordability?
The two main reasons that students leave schoolwithout a degree are: they needed to work (26%)and other financial reasons (16%).xxiii
Studies show that perceptions of high net pricesdeter adequate academic preparation and thataspirations decline by the 12th grade because ofconcerns about college costs and the availabilityof financial aid.xxiv
Many eligible low-income students (1.5 million)do not apply for federal financial aid and moder-ate and low-income families do not understandcosts and financial aid.xxv
Nationally, three-fourths of full-time, first yearundergraduates receive some type of financialaid, and about 45% of all full-time, first-timeundergraduates have a loan.xxvi Studies show thatproviding generous financial aid packages andtargeting financial aid to those with financialneed can encourage students to take more cours-es and reduce time spent working outside theclassroom.
How affordable are Ohio’s public higher education institutions?
We conclude: Ohio’s colleges and universities are among theleast affordable in the nation and this situationmust change.
36 Section 5: Affordability


Summary: Ohio’s colleges and universities are diverse. Tuition charged by public two-year campuses varies significantly and affects geographical access andparticipation in higher education. The high quality and capabilities of Ohio’s highereducation system are exceptional resources. If bold steps are taken that fostergreater collaboration and increased services, higher education can provide the education, research and public services needed to support a thriving 21st centuryeconomy.
Institutional ContextBreadth and Quality
Photo: Sinclair Community College

SECTION 6
Institutional ContextBreadth and Quality
Ohio’s colleges and universities are exceptional resources. They educate future leaders who will provide the tal-ent, energy and innovation to keep Ohio competitive in a knowledge-based economy.
Is higher education capable of providing educational, research, andpublic services needed to support a thriving 21st century economy?What we know:
All citizens live within 30 miles of a college oruniversity campus; however, only about 4% ofthe adult population (ages 25 and older) are taking advantage of the availability of higher education by enrolling in college.
The high quality of many of Ohio’s institutions,academic, research and public service programsis nationally and internationally recognized. Inrecent months
Ohio students continue to be selected asRhodes Scholars.
Ohio institutions lead the country in most fac-ulty chosen as “fellows” for various scientificorganizations.
Several campuses have been successful inattracting major federal and private grants ina wide range of fields, including medical, edu-cation and commercialization programs.
Colleges continue to form partnerships witheach other and businesses to address work-force needs.
Students who graduate from Ohio’s colleges anduniversities succeed in passing licensure exams,have higher incomes and contribute to their com-munities and the state. (Board of Regents’ PerformanceReport, 2006)
Ohio has a strong higher education infrastructureand many collaborative partnerships needed tosupport expanded education, research and publicservice activities. Appendix F is a map of Ohio'sstate supported and independent higher educa-tion institutions.
Quality education can be delivered in both largeand small classes. In fall 2005, for public institu-tions, the median size of a lecture class was 22students with 21% of course enrollment in class-es with fewer than 20 students and 23% of courseenrollments in classes with 50 or more students.(Board of Regents’ Performance Report, 2006)
For public institutions, more than half (57%) of allundergraduate credit hours were taught by full-time faculty. (Board of Regents’ Performance Report, 2006)
Section 6: Institutional Context – Breadth and Quality 39
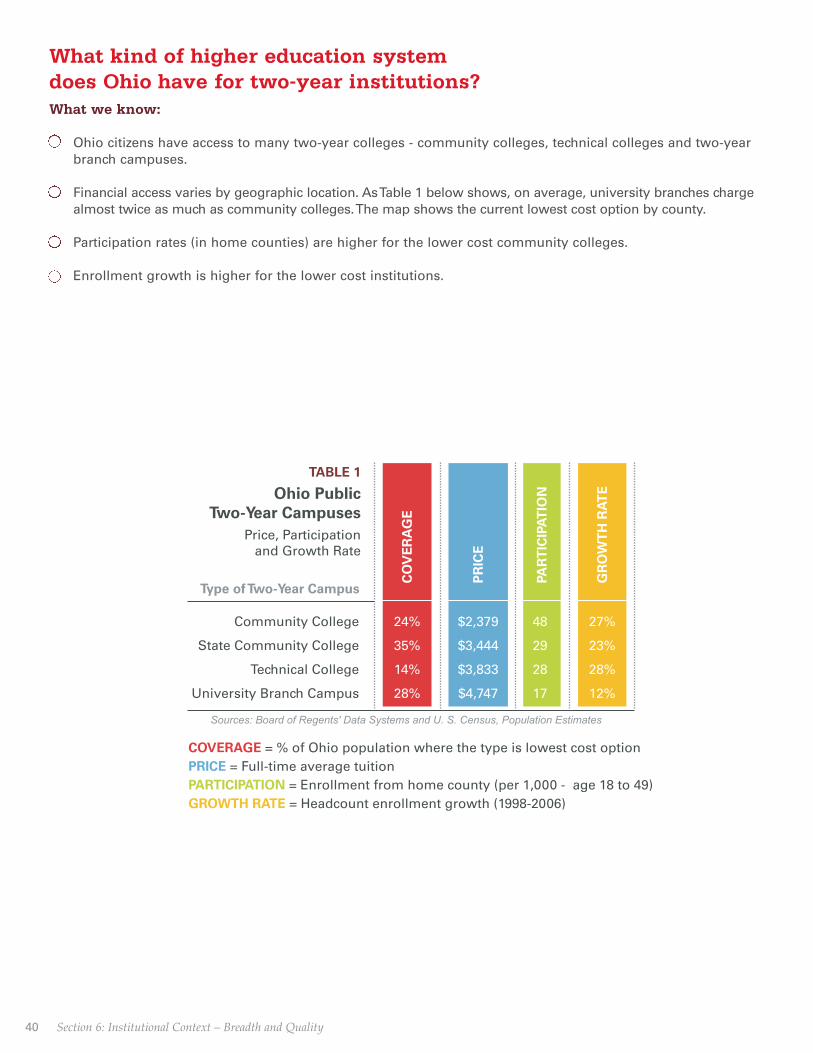
What kind of higher education system does Ohio have for two-year institutions?What we know:
Ohio citizens have access to many two-year colleges - community colleges, technical colleges and two-yearbranch campuses.
Financial access varies by geographic location. As Table 1 below shows, on average, university branches chargealmost twice as much as community colleges. The map shows the current lowest cost option by county.
Participation rates (in home counties) are higher for the lower cost community colleges.
Enrollment growth is higher for the lower cost institutions.
40 Section 6: Institutional Context – Breadth and Quality

Section 6: Institutional Context – Breadth and Quality 41
1. Belmont Technical CollegeOhio University – Belmont
2. Central Ohio Technical CollegeThe Ohio State University – Newark
3. Cincinnati State Technical & Community CollegeUniversity of Cincinnati – Raymond WaltersUniversity of Cincinnati – University College
4. Clark State Community College5. Columbus State Community College6. Cuyahoga Community College7. Edison State Community College8. Hocking Technical College9. Jefferson State Community College10. Lakeland Community College11. Lima Technical College
The Ohio State University – Lima12. Lorain County Community College13. Marion Technical College
The Ohio State University – Marion14. Muskingum Area Technical College
Ohio University – Zanesville15. North Central Technical College
The Ohio State University - Mansfield16. Northwest State Community College
17. Owens State Community CollegeUniversity of Toledo – Community & Technical College
18. Rio Grande Community College19. Sinclair Community College20. Southern State Community College21. Stark State College of Technology
Kent State University – Stark22. Terra State Community College23. Washington State Community College24. Bowling Green State University – Firelands25. Kent State University – Geauga
Kent State University – Ashtabula26. Kent State University – East Liverpool
Kent State University – TrumbullKent State University – Salem
27. University of Akron – Community & Technical College28. University of Akron – Wayne29. Kent State University – Tuscarawas30. Ohio University – Lancaster31. University of Cincinnati – Clermont32. Miami University – Hamilton
Miami University – Middletown33. Wright State University – Lake Campus34. Shawnee State University
Ohio University – Ironton

42 Section 6: Institutional Context – Breadth and Quality
What kind of higher education system does Ohio have for four-year institutions?What we know:
Ohio citizens have access to diverse four-year colleges.
As Table 2 below shows, undergraduate tuition for public universities varies from $5,300 to $11,400.
Selectivity for public universities varies with ACT scores averaging less than 21 to more than 24.
Graduation rates for public universities vary from 29% to 84%.
As Table 3 on the right shows, most university research is at The Ohio State University and the University of Cincinnati.

Is higher education capable of providing educational, research, and public
services needed to support a thriving 21st century economy?
We conclude: Ohio’s higher education system is well-positionedfor the 21st century, but institutions need to improvefocus on their core strengths, reposition them-selves to serve additional and more diverse stu-dents and increase collaboration to benefit allOhioans.
Section 6: Institutional Context – Breadth and Quality 43

Summary: Higher education has worked to improve productivity in the lastdecade. Additional productivity improvements can and must be part of the solutionto educating more Ohioans. Institutions, particularly four-year, can Improve gradua-tion and retention rates and make other curricular changes, such as including moretechnology in courses and expanding on-line learning. Improving productivity couldinclude shortening time to degree, addressing unnecessary duplication among insti-tutions, removing state subsidies from unproductive majors and programs, reengi-neering delivery of large courses, and a number of other strategies that have beenundertaken by several states.xxviii In addition, productivity can be improved throughmore collaborative programming and use of facilities and services. Productivitychanges will not fully support costs to enroll and graduate several thousand moreOhioans. Additional state, federal, and private investments are required for Ohio tomeet this challenge.
Financial Conditionand Productivity
By 2012, states are likely to face substantial revenue
gaps assuming the current revenue structure.
In most states, higher education expenditures are
expected to grow less rapidly than total state and
local government spending.
- Nelson A. Rockefeller Institute of Government, 2002
Photo: Cleveland State University

Educating thousands of additional Ohioans is a formidable task. Is higher education financially capable ofachieving this goal? Are accountability systems in place to monitor financial condition?
Are Ohio’s public institutions currently able to financially support sub-stantial increases in enrollments and degrees at a high quality level?What we know:
SECTION 7
Financial Conditionand Productivity
While Ohio’s current state appropriations plus tuition and other revenues dedicated to educate students areaverage when compared with other states, unlike most states, Ohio relies heavily on student tuition to fundhigher education as shown in the chart on the following page. This has the consequence that Ohio familiesmust shoulder 30% of family income to pay for public two-year colleges’ expenses and 42% for public four-year institutions’ expenses. (Appendix C, Table 4)
Unlike many other states, Ohio has a two-year tuition freeze. Moreover, Ohio relies on institutions to pay forsubstantial capital renewal with local facilities debt.
Ohio’s and other states’ higher education institutions have a number of financial pressures including:
Skyrocketing energy and health care costs
High costs for capital renewal to renovate, rehabilitate or replaceaging facilities
Substantial costs of specialized high tech equipment and facilities
Environmental issues including costly government regulations, energy conservation and reductions of greenhouse gases.
Enrolling many more students and expanding research will require renovation to current campus infrastruc-ture and possibly some new buildings.
Section 7: Financial Condition and Productivity 45

Can productivity be improved? Are Ohio students completing their degrees?
Ohio’s public higher education institutions have documented administrative and academic cost savings.(Results Through Productivity Report, Ohio Board of Regents, 2007)
Ohio’s two-year college completion rate is near the average for the Midwest region and the nation.
Ohio’s 54% six-year bachelor’s degree completion rate is near the national average, but is behind all but twoother states in the Midwest region. Completion rates are a proxy for the relative efficiency of the state’s post-secondary system. (Responding to Constituents’ Needs in a Changing Climate, Midwestern Higher Education Compact, January 2007)
Many students are taking fewer courses per term than a decade ago. Nationally, the average student obtains afour-year degree in about 4.6 years. In many instances, students are working. The result is higher costs for stu-dents and families because they pay more tuition, fees and living expenses for the extended stay in college.
Are appropriate fiscal health accountability systems in place?What we know:
Each college produces an annual financial reportusing nationally accepted accounting practices asdetermined by the Governmental AccountingStandards Board (GASB).
Annual audits are conducted by or at the directionof the Auditor of State and posted on the web.
The Regents’ Vice Chancellor for Finance reviewseach audit.
The audited data are used in calculating financialratios required by legislation enacted in 1997. Thefinancial ratios and other financial data are postedon the web. The most recent ratios are includedin Appendix E.
Campuses submit quarterly financial reportswhich are distributed to elected and appointedstate officials.
Regents’ staff periodically conducts enrollmentand financial aid audits of state colleges and uni-versities.
Regents’ staff periodically conducts financial aidaudits of private colleges and universities.
46 Section 7: Financial Condition and Productivity

Improving the preparation of high school stu-dents and adults for college-level work; andcreating effective transitions between schoolsand colleges, two- and four-year colleges, andthe workplace.
Streamlining the educational process, includ-ing curriculum and course redesign, forgreater productivity and cost-effectiveness;and adopting educational policies to reducecourse repetition, to offer incentives fordegree completion, and to assess and recog-nize academic proficiency acquired outsidethe institution.
Accommodating enrollment growth throughinstitutions that focus on providing high-qual-ity, cost-effective undergraduate education;avoiding program proliferation and increasesin research capacity that come at the expenseof productivity and undergraduate growth;encouraging collaboration to address unmeteducational needs and underserved regions;assuring effective utilization of facilities; andencouraging and creating new institutionsand systems of educational delivery.xxvii
Ohio has taken a number of steps to improve productivity in administrative and academic areas, includingadopting business practices when appropriate and encouraging collaborative programs, collaborative use offacilities and on-line learning. The combination of the University of Toledo and the Medical University of Ohiodemonstrated the value of bold steps in achieving meaningful improvements in productivity and efficiency at theuniversity level. As Ohio moves forward, additional efforts will be required from all institutions.
One excellent example of the opportunity for increased productivity and efficiency lies in Northeast Ohio wherefive universities are located in four contiguous counties. The Northeast Ohio Universities Collaboration &Innovation Study Commission recently issued its report recommending a number of steps that, if implemented,would foster increased productivity and efficiency through collaboration. Those initiatives include:
By 2009, establish a common academic calendarand application process to assist students inapplying and transferring within the northeastOhio network of public universities. This is a steptaken long ago by many other states.
Review low-demand programs, involving academics from outside Ohio to determine theircontinuance or combination into a single regionalprogram at a specific institution.
Establish a combined academic program anddepartment among the four universities in com-puter science to achieve a scale and prominencebeyond that of any single institution in this critical STEM field.
Establish a common technology transfer entityfor the participating universities of northeastOhio.
Implement a common healthcare purchase planfor all the public institutions of northeast Ohio,directly addressing a high and fast growing areaof cost for every institution.
Are Ohio’s public institutions currentlyable to financially support substantial
increases in enrollments and degrees ata high quality level?
We conclude: Ohio's institutions need to improve productivityand additional state, federal, and private investments are necessary to support additional students.
A recent national report identified ways to improve educational productivity:
Section 7: Financial Condition and Productivity 47
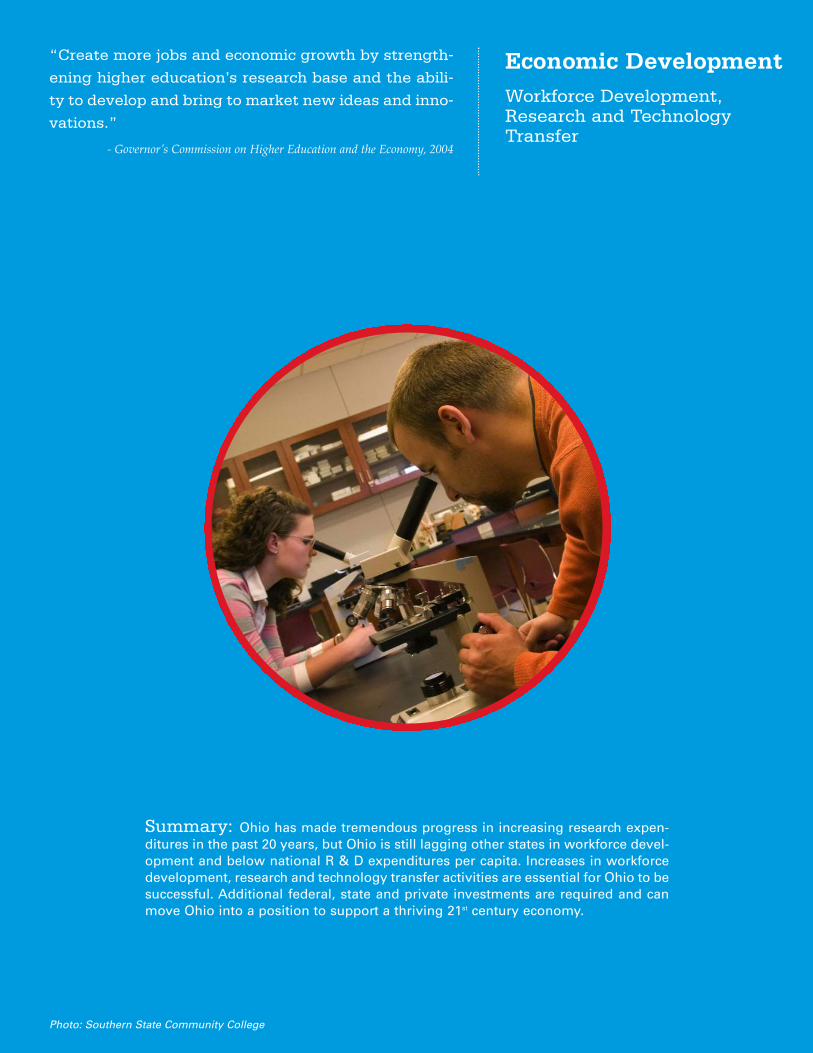
Summary: Ohio has made tremendous progress in increasing research expen-ditures in the past 20 years, but Ohio is still lagging other states in workforce devel-opment and below national R & D expenditures per capita. Increases in workforcedevelopment, research and technology transfer activities are essential for Ohio to besuccessful. Additional federal, state and private investments are required and canmove Ohio into a position to support a thriving 21st century economy.
Economic DevelopmentWorkforce Development,Research and TechnologyTransfer
“Create more jobs and economic growth by strength-
ening higher education’s research base and the abili-
ty to develop and bring to market new ideas and inno-
vations.”
- Governor’s Commission on Higher Education and the Economy, 2004
Photo: Southern State Community College

SECTION 8
Economic Development:Workforce Development,Research and TechnologyTransfer
Are Ohio’s current levels of workforce development adequate to support a thriving 21st century economy?What we know:
All campuses are extensively involved in work-force development.
Ohio has formed Enterprise Ohio as a network offocused workforce development. More than halfof the Network contracts are for companies with100 or fewer employees. (Appendix D, Chart 9)
In 2007, Ohio’s General Assembly enacted HouseBill 119, which transfers adult, post high-schoolprograms to the Board of Regents by January 1,2009. This transfer is designed to maximize thestrength and flexibility of Ohio’s adult workforceeducation assets and to improve the overall qual-ity of adult education and workforce developmentprograms.
Ohio is launching the Ohio Skills Bank office with-in the Board of Regents to support regional part-nerships in twelve designated economic regions.The Bank will address critical occupational andskill shortages within the regions and create con-venient, customized learning pathways that pre-pare adult learners to fill available jobs.
Ohio’s Tech Prep program allows a student tojump start a college degree while in high schooland prepares students for high skill, high demandtechnical careers in a competitive environment.
The Board of Regents is collaborating with theOhio Department of Aging to find ways to reen-gage baby boomers and others in the workforce.
Economic growth is an issue for Ohio.
Four reasons for Ohio’s slow economic
growth were identified in a Battelle study:
Lack of new business formation
Slow-paced new product innovation
Delayed commercialization of technology from thestate’s research institutions
Failure to provide sufficient employment opportuni-ties for graduates of Ohio’s colleges and universities.
1.
2.
3.
4.
Section 8: Economic Development 49

As the chart on the right shows, Ohio has madesignificant progress in reaching national averagesin Research and Development expenditures percapita. In 2005, Ohio was 86% of the nationalaverage as compared with 59% in 1985.
A 2008 National Science Foundation study, whichranks states by quartile, shows:
Ohio is in the third quartile of states in percent-age of workforce employed in science and engi-neering occupations.
Ohio is in the third quartile of states in researchand development as a share of the grossdomestic product (2004).
Ohio is in the third quartile of states in academ-ic research and development per $1000 of grossdomestic product (2005).
Ohio ranks in the second quartile of states inacademic patents awarded per 1,000 scienceand engineering doctorate holders in academia.(2006).
Ohio ranks in the fourth quartile of states inventure capital disbursed per $1000 of grossdomestic product (2006).xxx
Higher education research expenditures havealmost doubled in the past 10 years. (Appendix D,Chart 7)
Ohio jumpstarted its research and technologytransfer activities in 2002 through creating theThird Frontier Project, a 10-year, $1.6 billion initia-tive to expand Ohio’s high-tech research capabili-ties and promote innovation and company forma-tion. More than $500 million have been allocatedwith more than half of these funds awarded topublic and private higher education institutions.
The impetus for creation of the Third FrontierProject was the Ohio Plan for Technology andDevelopment, which was conceptualized by theOhio Board of Regents as a way to connect Ohiobusiness and industry, institutions of higherlearning and state government in a partnership toidentify research based economic developmentopportunities.
Ohio is making substantial investments in threemajor higher education research programs.Ohio’s programs are designed to leverage federalfunds, build on unique research areas that havepotential for national competitiveness and sup-port long-term economic growth.
Ohio’s Workforce Investment Act program is suc-cessfully meeting the workforce developmentneeds of many participants through increasedemployment and employment retention rates.However, from July 1, 2005 through June 30,2006, Ohio under spent its available WorkforceInvestment Act monies by nearly $42.5 million,more than 20% of available funds for workforcedevelopment for dislocated workers, adults andyouth.xxix
Are Ohio public higher education graduatesmeeting the expectations of Ohio’s employerswhen hired? Some states conduct employer satis-faction surveys, and Ohio plans to do so in theupcoming year. Having baseline and nationalbenchmarks for employer satisfaction could be ofgreat value to higher education.
Are Ohio’s current levels of research and technology transfer adequate to support a thriving 21st century economy?What we know:
Are Ohio’s current levels of workforcetraining adequate to support a thriving
21st century economy?
We conclude: Innovative changes are needed to expandemployability skills programs to develop a high-talent, flexible workforce and a new cadre ofentrepreneurs that can compete in a rapidlychanging global economy.
50 Section 8: Economic Development

Substantial funding of $135 million in the cur-rent biennium for the new Ohio ResearchScholars Program will support increased num-bers of highly-qualified faculty in critical sci-ence, technology, engineering, math, and med-ical areas. (Note: from 1982 to 2007, Ohio supported anEminent Scholars Program with similar goals.)
Ohio’s Action Fund ($5.5 million for the currentbiennium) provides matching capital funds forresearch facilities and instrumentation.
Ohio’s Research Incentive ($18 million annually)is a performance-based program that rewardsinstitutions for past successes in attractingexternal research support.
Ohio has implemented a number of other pro-grams, including the TechnologyCommercialization Incentive Program andInnovation Incentive, which was focused onstrengthening doctoral programs through reallo-cation and additional resources.
The new Choose Ohio First Scholarship Program,funded at $100 million for the current biennium,will support undergraduate and/or graduate edu-cation for many Ohio residents in science, tech-nology, engineering, and math (STEM) fields,medicine, and STEM education.
Ohio’s Supercomputer facility is a powerfulresearch tool, and an important resource for pub-lic and private institutions as well as businessand industry throughout the state.
Ohio’s applications for patents, invention disclo-sures submitted, licenses, options executed andgross license income have increased dramaticallysince 2001. (Appendix D, Chart 8)
In its U.S. Licensing Activity Survey: FY 2006, theAssociation of University Technology Managersreported that Ohio’s public and private universi-ties launched 19 start-up companies. While Ohiohas made impressive gains, Ohio is behind manyestablished programs, including MIT with 23start-ups and the University of California Systemwith 39 start-ups.
Are Ohio’s current levels of research andtechnology transfer adequate to support a
thriving 21st century economy?
We conclude: While Ohio has made progress, additional invest-ments in research and technology transfer arecritical to future success.
Section 8: Economic Development 51

Summary and Next Steps
Photo: Rio Grande Community College

SECTION 9
Summary and Next Steps
Section 9: Summary and Next Steps 53
As other state and national reports have concluded, Ohio’s is losing ground in its economic prosperity, which isdirectly related to educational attainment, workforce development, research and technology transfer. If Ohio is tohave college graduates in the numbers and disciplines that it needs for a thriving 21st century economy, howready is higher education to help Ohio achieve this goal? The Regents assess higher education’s condition in thefollowing dashboard:
Higher Education in Ohio – 2008 Condition Dashboard
How ready is higher education to meet the needs of a thriving 21st century economy?

54 Section 9: Summary and Next Steps
How well is higher education positioned to provide the needed educational
services for a thriving 21st century economy? Current trends in educational
and degree attainment, participation, preparation, affordability, productivi-
ty and finance, and workforce development, research and technology
transfer are insufficient and must change.
Within the overall context of producing more college graduates and increasing workforce development, researchand technology transfer, Ohio faces 10 significant challenges:
1. Projected declines in the State’s youth and working age population.
2. Enrolling and graduating more adults (over 25 year olds).
3. Improving college-going rates directly from high school.
4. Improving participation and degrees awarded in educationally underserved counties.
5. Improving college and university retention, graduation, two-year to four-year transfer
rates and P-12 linkages.
6. Increasing the number of students taking more rigorous high school courses, including
Advanced Placement and Postsecondary Education Opportunity courses.
7. Making higher education more affordable.
8. Achieving equitable financial access to 2-year colleges in all geographic regions.
9. Increasing state, federal and private investments for education and research.
10. Increasing degree attainment while maintaining high quality.
Future Annual Condition Reports will closely monitor each of these areas and address underlying causes thatexplain Ohio’s performance as well as additional topics. BBeeccaauussee ooff tthhee ssttrreennggtthh ooff OOhhiioo’’ss hhiigghheerr eedduuccaattiioonn ssyyss--tteemm,, wwee aarree ooppttiimmiissttiicc aanndd ccoonnffiiddeenntt tthhaatt OOhhiioo wwiillll ssuucccceessssffuullllyy ccoonnffrroonntt tthheessee cchhaalllleennggeess.. IInnccrreeaassiinngg tthhee nnuumm--bbeerr ooff ccoolllleeggee ggrraadduuaatteess aanndd wwoorrkkffoorrccee ddeevveellooppmmeenntt,, rreesseeaarrcchh aanndd tteecchhnnoollooggyy ttrraannssffeerr aaccttiivviittiieess wwiillll lleeaadd ttoo bbeett--tteerr eeccoonnoommiicc pprroossppeerriittyy aanndd aa hhiigghheerr qquuaalliittyy ooff lliiffee ffoorr OOhhiiooaannss.. TToo aacchhiieevvee tthheessee rreessuullttss,, iinnssttiittuuttiioonnss mmuusstt bbeemmoorree pprroodduuccttiivvee,, aanndd aaddddiittiioonnaall ssttaattee,, ffeeddeerraall aanndd pprriivvaattee iinnvveessttmmeennttss aarree rreeqquuiirreedd.. IInn tthhee lloonngg--tteerrmm,, OOhhiioo wwiillllrreeaapp ttrreemmeennddoouuss bbeenneeffiittss..

55

Appendices
Resources
End Notes
Photo: Owens State Community College

APPENDIX A
Stakeholder Feedback
Public and Private College and University TrusteesICUOACCAICUOGovernor's Workforce Policy Board BAHEEAssociation for Career and Technical EducationOhio Association of Joint Vocational SchoolsOhio Faculty CouncilTwo-year faculty CouncilOhio Association of Student Financial Aid AdministratorsOhio Student Government AssociationOhio House, Majority CaucusOhio House, Minority CaucusOhio Senate, Majority CaucusOhio Senate, Minority CaucusState Board of Education
57

APPENDIX B
Earned Income Projections"With Change" means with increase in the number of graduates and 70% retention rateNumbers in parentheses are negative.
Numbers based on projections 2000 2007 2017 2030
Earned income per capita (in year 2000 dollars)
US 17,329 18,050 18,194 17,362
Ohio 16,588 17,174 17,252 16,482
Difference from US (741) (876) (942) (880)
Ohio with change 16,588 17,174 17,371 16,967
Difference from US (741) (876) (823) (395)
Expected earned income (in billions of year 2000 dollars)
US 4,876.83 5,432.07 5,962.17 6,312.37
Ohio 188.33 197.80 200.79 190.37
Ohio with change 188.33 197.80 202.18 195.98
Percent of people aged 25 to 69 with a BA or higher
US 26.1 29.2 32.6 35.6
Ohio 22.7 25.4 28.6 32.3
Difference from US (3.4) (3.8) (4.0) (3.4)
Ohio with change 22.7 25.4 29.8 36.3
Difference from US (3.4) (3.8) (2.7) 0.6
Number of people aged 25 to 69 with a BA or higher
Ohio 1,427,872 1,651,774 1,899,507 2,001,355
Ohio with change 1,427,872 1,651,774 1,981,152 2,249,225
Difference 81,646 247,870
Notes: Expected earned income is the total earnings of people aged 25 to 69. Earned income per capita is expected earned incomedivided by the total population. This figure is lower than a typical per capita income figure would be, but the direction of change is thesame.
Projections Prepared by: Dr. Joel A. Elvery With Ellen Cyran and Dr. Mark Salling of the Northern Ohio Data Information ServiceLevin College of Urban AffairsCleveland State University
58

APPENDIX C
Analysis by the Midwestern Higher Education CompactAppendix C includes selected tables from Responding to Constituents' Needs in a Changing Climate, pre-pared by the Midwestern Higher Education Compact (MHEC) in January 2007. This information was compiledfrom several national data sources as noted on each table.
Projectedchange in
total population2005-20301
Projectedchange inunder-18
age group2005-20301
Projectedchange in
18-64age group2005-20301
Projectedchange inover 64
age group2005-20301
Population25 years and
over withless than ahigh schooldiploma orequivalent
(2005)2
Population 25 years andover with abachelor'sdegree or
higher(2005)2
Residentsenrolling incollege for
the first timewho do so inother states
(2004)3
Net migra-tion of allfirst-time
degree-seek-ing under-
graduate stu-dents (2004)3
OH 0.6% -6.3% -8.2% 54.9% 13.7% 23.3% 14% -1.0%US 23.0% 16.4% 11.5% 94.7% 15.8% 27.2% 17% 3.5%
IA -0.6% -8.0% -10.4% 52.2% 10.4% 23.8% 11% 18.2%IL 5.8% 1.0% -2.4% 58.6 % 14.3% 29.2% 20% -9.2%IN 9.0% 6.6% -0.3% 60.8% 14.7% 21.3% 12% 10.6%KS 6.9% 1.0% -3.1% 65.6% 11.3% 28.2% 14% 7.1%MI 4.8% -4.8% -3.5% 67.0% 13.0% 24.7% 10% -0.4%MN 21.9% 17.9% 9.9% 93.4% 9.1% 30.7% 20% -3.0%MO 11.5% 5.6% 1.5% 69.1% 15.0% 24.0% 16% 4.0%ND -4.5% -14.1% -17.0% 62.7% 11.8% 25.5% 29% 18.4%NE 4.3% 2.5% -7.3% 61.1% 10.5% 27.3% 17% 0.5%WI 10.7% 2.3% -0.7% 82.0% 11.2% 25.0% 17% -1.9%
Table 1: Leading Demographic IndicatorsOhio Compared to other MHEC States and the National Average
1National Center for Higher Education Management Systems. Data from the U.S. Census Bureau2U.S. Census Bureau, 2005 American Community Survey3U.S. Department of Education, National Center for Education Statistics, Integrated Postsecondary Education Data System (IPEDS), Spring 2005
18-24 year-oldswith a high
school credential
(2002-2004)
9th-12th graderstaking at least
one upper-levelmath course
(2003-04)
9th-12th graderstaking at least
one upper-levelscience course
(2003-04)
7th-12th gradersin math coursestaught by teach-
ers with amajor
in their field(1999-2000)
7th-12th gradersin science cours-
es taught byteachers with a
majorin their field(1999-2000)
7th-12th gradersin academic
core courses3
taughtby teachers
with a majorin their field(1999-2000)
OH 86% 60% 28% 75% 65% 61%Top performing
states2 94% 64% 40% 84% 88% 81%U.S. 87% 53% 31% 65% 73% 70%
IA 90% 57% 43% 70% 90% 80%IL 87% n/a n/a 63% 87% 70%IN 89% 47% 30% 71% 82% 79%
KS 88% n/a n/a 56% 77% 70%MI 90% 35% 23% 63% 78% 66%
MN 92% 46% 29% 88% 88% 92%MO 88% 54% 35% 51% 70% 66%ND 95% 53% 34% 76% 81% 73%NE 90% 61% 37% 84% 82% 80%WI 91% 61% 38% 69% 86% 81%
Table 2: Postsecondary PreparationOhio Compared to other MHEC States and "Top Performing" States in the Nation1
1All data in the table are from the National Center for Public Policy and Higher Education, Measuring Up 2004. Data are from the U.S. Census Bureau, theCouncil of Chief State School Officers, and the U.S. Department of Education's National Center for Education Statistics.2For this and all subsequent tables, the benchmark for "top performing states" is the median performance level of the top five states on a given indicator(i.e., the third highest scoring state).3Core courses include: English, Math, Social Studies, and Science.
59

Chance forcollege
by age 19(2002)2
18-24 year-olds enrolled
in college(2002-04)
25-49 year-olds enrolledpart-time in
any type of postsec-
ondary education
(2003)
First to second year
persistence offull-time
students attwo-year
institutions (Fall 2004)
First to second year
persistence offull-time
students atfour-year
institutions(Fall 2004)
First-time, full-time students earning abachelors
within 6 yearsof enrollment
(2003-04)
Certificates,degrees, and
diplomasawarded at all
institutionsper 100 under-
graduates(2003-04)
OH 41% 35% 3.2% 51% 73% 54% 17Top performing
states 52% 41% 5.1% 62% 82% 64% 20U.S. 38% 35% 3.9% 53% 77% 55% 17
IA 51% 35% 3.5% 48% 75% 64% 19IL 42% 35% 4.9% 51% 76% 58% 17IN 42% 29% 3.2% 54% 76% 55% 18
KS 50% 38% 4.0% 50% 74% 53% 18MI 38% 42% 4.4% 57% 74% 55% 15
MN 53% 38% 3.7% 50% 78% 57% 20MO 39% 33% 4.0% 51% 73% 56% 18ND 62% 41% 2.9% 48% 71% 48% 18NE 48% 37% 4.0% 55% 75% 55% 17WI 46% 35% 3.8% 57% 79% 57% 20
Table 3: Postsecondary Participation, Persistence, and CompletionOhio Compared to other MHEC States and "Top Performing" States in the Nation1
1Information in this table is from the National Center for Public Policy in Higher Education, Measuring Up 2006, with data from Thomas Mortenson andPostsecondary Education OPPORTUNITY, the U.S. Census Bureau, the National Center for Higher Education Management Systems, and the National Centerfor Education Statistics.2"Chance for college" is defined as the relative probability that a student entering ninth grade will finish high school in four years and proceed directly tocollege.
% of averageannual family
income neededto pay for pub-lic 2-year col-lege expensesafter financialaid, 2005-061
% of averageannual family
income neededto pay for pub-lic 4-year col-lege expensesafter financialaid, 2005-061
% of averageannual family
income neededto pay for pri-
vate 4-year col-lege expensesafter financialaid, 2005-061
Family share ofpublic higher
education oper-ating revenues
(2005)2
Family share ofpublic higher
education oper-ating revenues
(1995)2
% of averageincome neededfor the poorest20% of families
to pay listedtuition in the
states' lowest-priced colleges,
2005-061
Average annualper student
borrowing offederal under-graduate edu-cation loans,
2004-051,3
OH 30% 42% 67% 50% 44% 25% $3,552U.S. 24% 31% 72% 37% 31% 16% $3,619
IA 26% 30% 59% 49% 34% 23% $3,112IL 24% 35% 69% 28% 20% 17% $3,770IN 24% 30% 66% 50% 41% 19% $3,549KS 20% 26% 47% 38% 30% 15% $3,377MI 24% 36% 48% 52% 44% 17% $3,120MN 22% 26% 54% 45% 30% 24% $3,234MO 23% 31% 54% 40% 38% 18% $3,407ND 24% 28% 34% 44% 36% 25% $3,110NE 21% 27% 50% 36% 27% 14% $3,447WI 21% 26% 61% 37% 28% 21% $3,277
Table 4: Affordability of Higher EducationOhio Compared to Other MHEC States and the National Average
1National Center for Public Policy and Higher Education, Measuring Up 2006. Data from National Center for Higher Education Management Systems,National Center for Education Statistics, and the U.S. Census Bureau.2State Higher Education Executive Officers, State Higher Education Finance, FY 2005.3Figures include both student and parent subsidized and unsubsidized loans, but do not include loans originating from state sources or private loans(including credit card debt). The figure is therefore not an accurate measure of total student borrowing, which is higher than the figures listed. Accordingto College Board, students at all levels in 2005-06 borrowed a total of $16 billion in private bank loans, compared to $69 billion in federal loans.
APPENDIX C (cont’d)
60

APPENDIX D
Supporting Data
Chart 1: Degree Attainment
Sources: U.S. Census Surveys and National Center for Education Statistics, IntegratedPostsecondary Education Data System (IPEDS)
Black or African American Alone 19.2% 13.9% 21.7% 14.3%White Alone, not Hispanic or Latino 31.5% 25.2% 30.5% 22.8%Hispanic or Latino 21.3% 16.0% 25.7% 16.2%American Indian and Alaska Native Alone 26.2% 17.9% 18.7% 9.5%Asian Alone 72.1% 68.4% 60.4% 55.3%Native Hawaiian and Other Pacific Islander Alone Data not available Data not availableSome Other Race Alone 20.6% 15.6% 25.8% 13.4%Two or More Races 26.2% 19.0% 25.4% 17.2%TOTAL OHIO 30.7% 24.6% 29.9% 22.1%
Black or African American Alone 23.5% 16.6% 25.7% 17.8%White Alone, not Hispanic or Latino 38.8% 31.7% 36.7% 28.3%Hispanic or Latino 16.5% 11.8% 18.3% 12.7%American Indian and Alaska Native Alone 21.1% 13.5% 22.9% 13.7%Asian Alone 59.6% 53.1% 53.1% 45.6%Native Hawaiian and Other Pacific Islander Alone 22.1% 15.4% 24.5% 15.5%Some Other Race Alone 13.9% 9.4% 16.0% 10.6%Two or More Races 31.4% 23.3% 32.5% 24.0%TOTAL NATION 35.2% 28.5% 34.0% 26.0%
Associate or Higher
Bachelor'sor Higher
Associateor Higher
Bachelor'sor Higher
Male Female
HIGHEST DEGREE LEVEL
RACE
OH
ION
AT
ION
Source: 2005 American Community Survey
Educational Attainment for the Population 25 Years And Over by Race and Gender – 2005
Chart 2: Educational Attainment by Race and Gender
61

APPENDIX D (cont’d)
Chart 3: Degree Trends
Chart 4: Retention of College Graduates
TTrreennddss iinn DDeeggrreeeess AAwwaarrddeedd bbyy LLeevveell aanndd FFiieellddOhio Public and Private Institutions – 2002 to 2006
%Level 2002 2003 2004 2005 2006 ChangeAssociate DegreesTotal 19,796 20,859 22,200 22,391 23,891 21%STEM 8,049 8,988 10,351 10,374 11,220 39%Non-STEM 11,747 11,871 11,849 12,017 12,671 8%
Bachelor’s DegreesTotal 52,288 54,344 56,252 56,428 57,997 11%STEM 12,282 12,104 12,745 12,615 13,347 9%Non-STEM 40,006 42,240 43,507 43,813 44,650 12%
Graduate and Professional DegreesTotal 23,224 23,719 24,467 25,710 25,916 12%STEM 5,886 5,618 6,165 6,475 6,426 9%Non-STEM 17,338 18,101 18,302 19,235 19,490 12%Sources: Board of Regents' Data System and Information provided by Ohio's Private Institutions
Source: Board of Regents' Data System
62

APPENDIX D (cont’d)
Chart 5: Educational Pipeline
Source: PostsecondaryEducation Opportunity, 2006,Thomas Mortenson
Chart 6: ACT Scores
Source: American College Testing Service, 2002 - 2006
63

APPENDIX D (cont’d)
Chart 7: Research
Chart 8:Technology Transfer
Source: National Science Foundation, 1996 - 2005
% IncreaseFY FY FY FY FY FY 2001
Activity 2001 2002 2003 2004 2005 to FY 2005Total U.S. Patent Applications 270 323 331 399 438 62%
U.S. Patents Issued 107 112 108 121 97 -9%
Invention Disclosures Submitted 449 593 583 731 759 69%
Licenses & Options Executed 95 92 131 120 138 45%
Gross License Income Received $16.5 $16.3 $18.4 $22.7 $23.8 44%($ millions)
Start-up Companies Formed 17 17 15 20 17 0%
Source: Board of Regents' Data System and Institutional Surveys
TTeecchhnnoollooggyy TTrraannssffeerr aanndd CCoommmmeerrcciiaalliizzaattiioonn AAccttiivviittiieess aatt OOhhiioo’’ss UUnniivveerrssiittiieess
FY 2001 to 2005
64

APPENDIX D (cont’d)
Chart 9: Workforce Development Enterprise Ohio
Source: Board of Regents' Data System
65

APPENDIX EFY 2007 Financial Ratio AnalysisInstitutional Ratios and Scores
UniversitiesBOWLING GREEN 4.20 175.0% 4.00 7.6% 5.00 43.7% 4.00 CENTRAL STATE 2.40 243.7% 4.00 0.0% 1.00 9.6% 2.00 CLEVELAND STATE 3.40 48.8% 2.00 4.4% 4.00 31.7% 4.00 KENT STATE 4.70 121.8% 4.00 14.4% 5.00 70.6% 5.00 MIAMI UNIV. 4.70 104.2% 4.00 13.3% 5.00 51.0% 5.00 NEOUCOM 5.00 2946.6% 5.00 15.0% 5.00 58.6% 5.00 OHIO STATE 4.20 133.8% 4.00 12.1% 5.00 40.8% 4.00 OHIO UNIVERSITY 3.20 69.1% 3.00 4.2% 4.00 23.9% 3.00 SHAWNEE STATE 3.80 102.7% 4.00 2.8% 3.00 40.5% 4.00 UNIV. AKRON 3.60 49.5% 2.00 9.1% 5.00 33.4% 4.00 UNIV. CINCINNATI 2.80 21.1% 1.00 9.7% 5.00 23.1% 3.00 UNIV. TOLEDO/MUO** 3.70 74.2% 3.00 4.2% 4.00 29.3% 4.00 WRIGHT STATE 4.30 313.3% 5.00 4.0% 4.00 34.6% 4.00 YOUNGSTOWN ST. 3.70 205.7% 4.00 6.5% 5.00 23.9% 3.00
Community CollegesCINCINNATI ST. 2.60 25.0% 1.00 4.6% 4.00 18.0% 3.00 CLARK STATE 3.90 90.5% 3.00 9.1% 5.00 31.1% 4.00 COLUMBUS ST. 5.00 470.0% 5.00 9.8% 5.00 66.9% 5.00 CUYAHOGA 4.20 200.8% 4.00 8.0% 5.00 47.6% 4.00 EDISON STATE 3.10 56.5% 2.00 16.1% 5.00 16.3% 3.00 JEFFERSON 4.10 276.6% 5.00 1.2% 3.00 35.1% 4.00 LAKELAND 3.20 317.7% 5.00 -0.6% 1.00 21.0% 3.00 LORAIN 5.00 684.5% 5.00 13.1% 5.00 61.1% 5.00 NORTHWEST ST. 3.90 25528.1% 5.00 0.7% 2.00 30.0% 4.00 OWENS STATE 3.60 5616.7% 5.00 2.6% 3.00 23.5% 3.00 RIO GRANDE 3.00 N/A 5.00 -6.5% 0.00 15.6% 3.00 SINCLAIR 4.20 N/A 5.00 -3.01% 1.00 74.2% 5.00 SOUTHERN ST. 3.10 169.1% 4.00 0.2% 2.00 21.0% 3.00 TERRA STATE 3.70 2509.6% 5.00 -1.0% 1.00 42.1% 4.00 WASHINGTON ST. 3.20 N/A 5.00 -3.6% 1.00 16.6% 3.00
Technical CollegesBELMONT TECH 5.00 N/A 5.00 6.0% 5.00 63.6% 5.00 COTC 4.50 263.6% 5.00 15.7% 5.00 45.5% 4.00 HOCKING 3.30 132.8% 4.00 2.0% 3.00 14.0% 3.00 JAMES RHODES ST 4.30 264.3% 5.00 3.5% 4.00 33.0% 4.00 MARION TECH 4.30 N/A 5.00 3.2% 4.00 26.9% 4.00 ZANE STATE (MATC) 4.10 4237.8% 5.00 2.9% 3.00 35.4% 4.00 NORTH CENTRAL 3.20 538.4% 5.00 -0.8% 1.00 18.2% 3.00 STARK STATE 4.00 N/A 5.00 6.6% 5.00 19.4% 3.00
Composite Viability Net Income Primary ReserveInstitution Score Ratio* Score Ratio Score Ratio Score
NNootteess::
The viability ratio is not calculated for campuses that do not have long-termplant debt. In such instances, a viability score of 5.0 is automatically assigned.
In FY 2007, the University of Toledo and the Medical University of Ohiomerged to become one institution.
The FY 2007 financial ratios for Hocking College are based on the college's pre-liminary FY 2007 Financial Report. As of February 20, 2008, Hocking College'sFY 2007 Financial Report is still under review by the Auditor of the State.
The FY 2007 financial ratios for Marion Technical College are based on thecollege's preliminary FY 2007 Financial Report. Per a request of MarionTechnical College, the Auditor of the State granted a filling extension through February 29, 2008.
Pursuant to the administrative rule (126:3-1-01) established by Senate Bill 6, a composite score of or below 1.75 for two consecutive years would result in a campus being placed on fiscal watch.
BBaacckkggrroouunndd ffoorr FFiinnaanncciiaall RRaattiiooss::In 1997, the 122nd General Assembly enacted legislation designed to increase financial accountability at state colleges and universities by using a standardset of measures to monitor the fiscal health of campuses. Three ratios are calculated. The Viability ratio is expendable net assets divided by plant debt. ThePrimary Reserve ratio is expendable net assets divided by total operating expenses. The Net Income ratio is total net assets divided by total revenues.
66

APPENDIX FOhio Higher Education InstitutionsState Supported and Independent
67
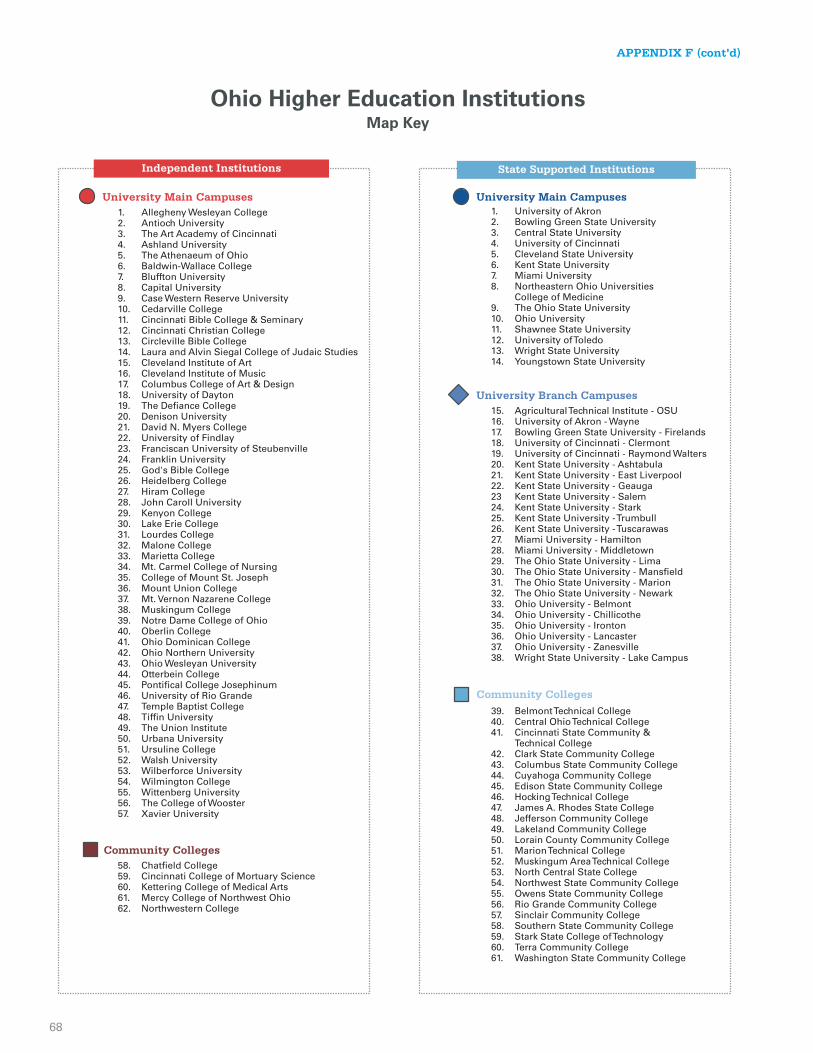
APPENDIX F (cont’d)
68
RESOURCES
Adding it Up: State Challenges for Increasing College Access and Success, the National Center for Higher EducationManagement Systems and Jobs for the Future, 2007
Adult Learners and State Policies, Richard A. Voorhees and Paul E. Lingenfelter, SHEEO and CAEL, 2003
Advanced Placement Report to the Nation, College Board, 2007
The 4th Annual AP Report to the Nation, 2008, The College Board, 2008
Altered States: A Perspective on 75 Years of State Income Growth, Annual Report, Cleveland Reserve Bank, 2005
American Community Survey, U. S. Census, 2006
The AP Program and Student Outcomes: A Summary of Research, Maureen Ewing, The College Board, 2007
Building on Knowledge and Investing in People: Higher Education and the Future of Ohio's Economy, Governor'sCommission on Higher Education and the Economy, 2004
Campus Programs and Policies for Low-Income Adults, American Council on Education, 2005
Catalyst for Change: E-Learning in Ohio, Ohio Learning Network, 2007
Closing the Expectations Gap, Achieve, Inc., 2008
The Condition of Education, National Center for Education Statistics, 2007
The Dream Deferred: Increasing the College Preparedness of At-risk Students, P.Terenzini, A. Cabrera, R. Deil-Amen, andA. Lambert, Washington, DC: U.S. Department of Education, 2005
Enrollment in Postsecondary Institutions, Fall 2005; Graduation Rates, 1999 and 2002 Cohorts; and Financial Statistics,Fiscal Year 2005, L. Knapp, J. Kelly-Reid, R. Whitmore, and E. Miller, U.S. Department of Education, National Center forEducation Statistics, 2007
First Generation Students in Postsecondary Education: A Look at their College Transcripts, X. Chen, U.S. Department ofEducation, National Center for Education Statistics, 2005
Getting Ahead or Losing Ground: Economic Mobility in America, J. Isaacs, I. Sawhill, and R. Haskins, The BrookingsInstitution, Washington, D. C., 2008
Good Policy, Good Practice, National Center for Public Policy and Higher Education and National Center for HigherEducation Management Systems, 2007
Higher Education and the Future of Ohio: Imperatives and Policy Alignment, Presentation by Dennis Jones to theNortheast Ohio Commission, October 24, 2007
Knocking at the College Door, Western Interstate Commission on Higher Education, 2003
Low-Income Adults in Profile: Improving Lives through Higher Education, American Council on Education, 2004
Measuring Up: The National Report Card on Higher Education, the National Center for Public Policy and HigherEducation, 2006
Missed Opportunities Revisited: New Information on Students who do not Apply for Financial Aid, American Council onEducation, 2006
Mortgaging our Future: How Financial Barriers to College Undercut America's Global Competitiveness, AdvisoryCommittee on Student Financial Assistance, 2006
Online Nation: Five Years of Growth in On-line Learning, L. Elaine Allen and Jeff Seaman, 2007
The Performance Report for Ohio's Colleges and Universities, 2006, Ohio Board of Regents, 2007
69

RESOURCES (cont’d)
Positioning Ohio and Its Research Institutions, Batelle, 2005
Principal Indicators of Student Academic Histories in Postsecondary Education, 1972-2000, C. Adelman, U.S. Departmentof Education, Institute of Education Sciences, 2004
Responding to Constituents' Needs in a Changing Climate, Midwestern Higher Education Compact, January 2007
Results through Productivity Report for Ohio Public Higher Education, Ohio Board of Regents, 2007
Science and Engineering Indicators, National Science Foundation, 2008
Short-term Enrollment in Postsecondary Education: Student Background and Institutional Differences in Reasons forEarly Departure, 1996-98, E Bradburn, U.S. Department of Education, National Center for Education Statistics, 2002
State Growth Empirics: The Long-Run Determinants of State Income Growth, Working Paper, P. Bauer, M. Schweitzer, andS. Shane, Federal Bank of Cleveland, 2006
State Higher Education Finance, Fiscal Year 2006, State Higher Education Executive Officers, 2007
State Spending for Higher Education in the Coming Decade, Dan Boyd, Nelson A. Rockefeller Institute of Government,Prepared for the National Center for Higher Education Management Systems, October, 2002
Student Success in Colleges and Universities, Association of State Colleges and Universities, 2005
Trends in College Pricing, College Board, 2007
Workforce Investment Act Program Year 2005 Annual Report, July 1, 2005 - June 30, 2006, State of Ohio, Department ofJobs and Family Services
U. S. Licensing Activity Survey, 2006, the Association of University Technology Managers, 2007
70

END NOTES
i Of the Midwestern states, Minnesota has the highest percentage of its population with an associate's degree or high-er and ranks among the top ten states nationally.
ii The AP Program and Student Outcomes: A Summary of Research, 2007, M. Ewing, The College Board
iii For 2007-8, two university regional campuses are slightly above the amount funded by the federal Pell and CollegeOpportunity Grant.
iv Workforce Investment Act Program Year 2005 Annual Report, July 1, 2005 - June 30, 2006, State of Ohio, Departmentof Jobs and Family Services
v Good Policy, Good Practice, National Center for Public Policy and Higher Education and National Center for HigherEducation Management Systems, 2007
vi Getting Ahead or Losing Ground: Economic Mobility in America, J. Isaacs, I. Sawhill, and R. Haskins, The BrookingsInstitution, Washington, D. C., 2008
vii Getting Ahead or Losing Ground: Economic Mobility in America, J. Isaacs, I. Sawhill, and R. Haskins, The BrookingsInstitution, Washington, D. C., 2008
viii Of the Midwestern states, Minnesota has the highest percentage of its population with an associate's degree or high-er and ranks among the top ten states nationally.
ix National Center for Education Statistics, The Condition of Education, 2007
x Low-Income Adults in Profile: Improving lives through Higher Education, American Council on Education, 2004
xi U. S. Census, American Community Survey, 2006.xii Higher Education and the Future of Ohio: Imperatives and Policy Alignment, Presentation by Dennis Jones to the
Northeast Ohio Commission, October 24, 2007
xiii Ohio's growth rate for online enrollment appears to be exceeding the national growth rate, but a lower percentage ofstudents were taking at least one online course in the fall of 2006 with 20% nationally versus 11% of public under-graduate students in Ohio for both four- and two-year institutions and almost one in five at community and technicalcolleges. (Note: national numbers include private institutions while the statistics quoted in this paragraph includepublic only so there may be comparability issues.) Catalyst for Change: E-Learning in Ohio, Ohio Learning Network,December 2007
xiv Campus Programs and Policies for Low-Income Adults, American Council on Education, 2005
xv Advanced Placement Report to the Nation 2007, College Board, 2007 and The AP Program and Student Outcomes: ASummary of Research, M. Ewing, The College Board, 2007
xvi Principal Indicators of Student Academic Histories in Postsecondary Education, 1972-2000, C. Adelman, U.S.Department of Education, Institute of Education Sciences, 2004
xvii First Generation Students in Postsecondary Education: A Look at their College Transcripts, X. Chen, U.S. Departmentof Education, National Center for Education Statistics, 2005
xviii Low-Income Adults in Profile: Improving Lives through Higher Education, American Council on Education, 2004
xix The Dream Deferred: Increasing the College Preparedness of At-risk Students, P.Terenzini, A. Cabrera, R. Deil-Amen,and A. Lambert, U.S. Department of Education, 2005
xx The AP Program and Student Outcomes: A Summary of Research, M. Ewing, The College Board, 2007
xxi State Higher Education Finance, Fiscal Year 2006, State Higher Education Executive Officers, 2007
xxii For 2007-8, two university regional campuses are slightly above the amount funded by the federal Pell and CollegeOpportunity Grant.
xxiii Short-term Enrollment in Postsecondary Education: Student Background and Institutional Differences in Reasons for
71

Early Departure, 1996-98, E. Bradburn, U.S. Department of Education, National Center for Education Statistics, 2002
xxiv Mortgaging our Future: How Financial Barriers to College Undercut America's Global Competitiveness, AdvisoryCommittee on Student Financial Assistance, 2006
xxv Missed Opportunities Revisited: New Information on Students who do not Apply for Financial Aid. American Councilon Education, 2006
xxvi Enrollment in Postsecondary Institutions, Fall 2005; Graduation Rates, 1999 and 2002 Cohorts; and Financial Statistics,Fiscal Year 2005, L. Knapp, J. Kelly-Reid, R. Whitmore, and E. Miller, U.S. Department of Education, National Centerfor Education Statistics, 2007
xxvii Good Policy, Good Practice, National Center for Public Policy and Higher Education and National Center for HigherEducation Management Systems, 2007
xxviii Good Policy, Good Practice, National Center for Public Policy and Higher Education and National Center for HigherEducation Management Systems, 2007
xxix Workforce Investment Act Program Year 2005 Annual Report, July 1, 2005 - June 30, 2006, State of Ohio, Departmentof Jobs and Family Services
xxx Science and Engineering Indicators, National Science Foundation, 2008
END NOTES (cont’d)
72

