condition of education - educateiowa.gov · ... i’m excited that the department is introducing an...
TRANSCRIPT

Education Condition of
2017 Annual Report
Iowa Department of Education


State of Iowa Department of Education
Grimes State Office Building 400 E. 14th St.
Des Moines, IA 50319-0146
State Board of EducationCharles C. Edwards, Jr., President, Des MoinesMichael L. Knedler, Vice President, Council BluffsBrooke Axiotis, Des MoinesMichael Bearden, GladbrookBettie Bolar, MarshalltownDiane Crookham-Johnson, OskaloosaAngela English, DyersvilleMike May, Spirit LakeMary Ellen Miller, Wayne CountyRobert Nishimwe, Student Member, Des Moines
AdministrationRyan M. Wise, Director and Executive Officer of the State Board of Education
It is the policy of the Iowa Department of Education not to discriminate on the basis of race, creed, color, sexual orientation, gender identity, national origin, sex, disability, religion, age, political party affiliation, or actual or potential parental, family or marital status in its programs, activities, or employment practices as required by the Iowa Code sections 216.9 and 256.10(2), Titles VI and VII of the Civil Rights Act of 1964 (42 U.S.C. § 2000d and 2000e), the Equal Pay Act of 1973 (29 U.S.C. § 206, et seq.), Title IX (Educational Amendments, 20 U.S.C.§§ 1681 – 1688), Section 504 (Rehabilitation Act of 1973, 29 U.S.C. § 794), and the Americans with Disabilities Act (42 U.S.C. § 12101, et seq.). If you have questions or complaints related to compliance with this policy by the Iowa Department of Education, please contact the legal counsel for the Iowa Department of Education, Grimes State Office Building, 400 E. 14th Street, Des Moines, IA 50319-0146, telephone number: 515-281-5295, or the Director of the Office for Civil Rights, U.S. Department of Education, Citigroup Center, 500 W. Madison Street, Suite 1475, Chicago, IL 60661-4544, telephone number: 312-730-1560, FAX number: 312-730-1576, TDD number: 877-521-2172, email: [email protected].
The Annual Condition of Education Report 2017iii

Iowa Department of Education
Division of Learning and ResultsDavid Tilly, Deputy Director
Bureau of Information and Analysis Services
Jay Pennington, ChiefDianne Chadwick, Administrative ConsultantXiaoping Wang, Administrative ConsultantTom Deeter, Lead ConsultantConnie Brooks, ConsultantXia Chen, ConsultantBetsy Lundy, ConsultantJeff Weiss, ConsultantKim Wilson, Secretary
Bureau of Learner Strategies and Supports
Greg Feldmann, Consultant
Bureau of School Improvement
Amy Williamson, ChiefJanell Brandhorst, Administrative ConsultantJennifer Adkins, ConsultantMeredith MacQuigg, Consultant
Division of School Finance and Support ServicesMarcia Krieger, Executive Officer
Bureau of Finance, Facilities, Operation and Transportation Services
Tom Cooley, ChiefJanice Evans, ConsultantDenise Ragias, ConsultantCarla Schimelfenig, ConsultantGary Schwartz, Consultant
The Annual Condition of Education Report 2017iv

Dear Iowans,
Data and information are important components of school improvement. They show how schools are changing and how students are progressing. Providing and interpreting data is one of the critical functions of the Iowa Department of Education.
The annual Condition of Education report provides valuable data about our students, educators and school districts across a number of statewide mea-sures. They include shifts in student populations and demographics, teacher and administrator salaries and characteristics, student achievement results, and school financial information.
This year, I’m excited that the Department is introducing an online companion to the print version of the Condition of Education report. The new online features allow education stakeholders to dive deeper into enrollment and staffing data at the state and district level. We will continue development of the online Condition of Education report, which is available at http://reports.educateiowa.gov/COE/.
Thanks for all you do to support Iowa’s schools and students.
Sincerely,
Ryan M. Wise, Director
Iowa Department of Education
The Annual Condition of Education Report 2017v

AcknowledgmentsThe authors of the Annual Condition of Education Report wish to thank the staff of the Iowa Department of Education who contributed to the production of this report. A special acknowledgement is extended to individuals outside the Department of Education who made important contributions in sharing their data and thoughts with us. They are: Dr. Steve Dunbar and Dr. Catherine Welch, Iowa Testing Programs.
The Annual Condition of Education Report 2017vi

IntroductionWith the 28th edition of the Annual Condition of Education (COE) report, the Department of Education is releasing both a print and online version. The online COE adds a new dimension to the report by allowing for interactive analyses at the state, area education agency (AEA) and district level. It supports the public by allowing examination and localize results to Iowa communities. The first version of the online COE will start with a few measures including: K-12 enrollment, enrollment trends and staffing. Future editions of the online COE will include expanded measures and additional content areas.
The print edition of the COE includes a rich set of measures for evaluating Iowa’s education system. Data in the report provide important information about our students, teachers and schools. It includes infor-mation such as the demographic characteristics of our students, assessment results, college readiness measures, course taking patterns and school finance. Below are highlights from the 2017 Annual Condi-tion of Education report.
Enrollment• The number of students in Iowa’s public school districts continues to climb. After a 17-year decline,
there has been six years of enrollment gains statewide. • Minority students make up 23.5 percent of the student body. The number of minority students in
Iowa’s public schools continues to increase and is at an all-time high (113,076). • The percentage of students eligible for free-or-reduced priced lunch declined slightly in the 2016-
17 school year to 41.3 percent. • The percent of students who are English language learners (ELL) increased from 5.7 to 5.9 percent
in 2016-17. This is up from 2.3 percent of ELL students in 2000-01.
Iowa Educators• Iowa’s average regular teacher salary increased 2.3 percent to $55,703 in the 2016-17 school year. • Iowa’s average teacher salary is 22nd in national rankings and 5th when compared to other Midwest
states.• The number of full-time teachers in public schools increased to 36,279 in 2016-17 from 35,883 in
2015-16.
Student Performance• Since 2011-12, Iowa Testing Programs introduced Forms E and F. The 2012-14 biennium included
an addition of a new form (F) of the Iowa Assessments which was introduced during the 2013-14 school year.
• Across all grades (4th, 8th and 11th) in both reading and mathematics, biennium proficiency rates are slightly down from the prior biennium period.
• The percent of students taking higher-level mathematics and chemistry increased for the class of 2017 compared to the class of 2016. The percent of students taking foreign languages remained the same, while there was a slight decrease in the percent of students taking physics.
• 46.2 percent of students took a higher-level mathematics course, 71.9 percent took chemistry and 30.5 percent took physics for the class of 2017. This is compared to the class of 2016 in which 45.3 percent of students took a higher-level mathematics course, 71.0 percent took chemistry and 30.7
The Annual Condition of Education Report 2017vii

took physics. 85.2 percent of students took a foreign language for the classes of 2016 and 2017. • Iowa continues to have one of the top graduation rates nationally. The four-year cohort graduation
rate for the class of 2016 was 91.3 percent which is an increase from 90.8 percent for the class of 2015.
• The percent of students in the class of 2017 who took the ACT decreased to 67 percent from 68 percent for the class of 2016.
• There was a decrease in the composite ACT score for the class of 2017 (21.9) compared to the class or 2016 (22.1).
• Among states for which ACT is the primary college entrance exam (greater than 50 percent), Iowa’s average composite (21.9) score ranks second nationally.
• The number of students taking AP courses and total AP enrollment continues an upward trend. In the 2016-17 school year, 16,762 students took 25,286 AP courses. The percent of school districts offering AP courses increased to 53.3 from 51.3 in the prior year.
• Statewide concurrent enrollment continues to increase. 43,843 students in grades 9-12 took 96,031 courses in 2016-17.
• The number of Iowa Advanced Placement (AP) test takers and exams saw a decrease in 2016-17. In 2016-17, 19,084 AP exams were taken by Iowa students compared to 19,790 in 2015-16. There was also a decrease in the total number of AP exams (12,119) in 2016-17 compared to the prior year (12,439). Over the past decade, the long-term trends show a significant increase in the total number of students taking AP exams.
Technology Readiness• There was a significant increase in the overall expenditures in technology in the 2015-16 ($86.5
million) school year in Iowa districts compared to the 2014-15 school year ($73.9 million). • The percent of Iowa schools equipped with 100 MB or more of bandwidth continues to grow. In
2016-17, 81.8 percent of schools reported having 100 MB or more of bandwidth compared to just 76.2 in 2015-16.
Sincerely,
Jay Pennington, ChiefBureau of Information and Analysis
The Annual Condition of Education Report 2017viii
Contents
Enrollment � � � � � � � � � � � � � � � � � � � � � � � � � � � � � � � � � � � � � � � � � � � � � � � � � � � � � � � � � � � � � � � � � � � � � � � � � � � � �1Enrollment Trends � � � � � � � � � � � � � � � � � � � � � � � � � � � � � � � � � � � � � � � � � � � � � � � � � � � � �3Projected Enrollment � � � � � � � � � � � � � � � � � � � � � � � � � � � � � � � � � � � � � � � � � � � � � � � � �4 K-12 Enrollments by District Size Category � � � � � � � � � � � � � � � � � � � � � � � � �5Enrollment in Iowa’s Area Education Agencies (AEAs) � � � � � � � � � � � �6Open Enrollment � � � � � � � � � � � � � � � � � � � � � � � � � � � � � � � � � � � � � � � � � � � � � � � � � � � � � �6Subgroup Enrollments � � � � � � � � � � � � � � � � � � � � � � � � � � � � � � � � � � � � � � � � � � � � � � � �8
Students Eligible for Free or Reduced Price Lunch � � � � � � � � � � � � � � � � � � � � � � � � � � � � � � � � � 8Special Education Enrollment � � � � � � � � � � � � � � � � � � � � � � � � � � � � � � � � � � � � � � � � � � � � � � � � � 9Enrollment by Race and Ethnicity � � � � � � � � � � � � � � � � � � � � � � � � � � � � � � � � � � � � � � � � � � � � � � 9Enrollment of English Language Learners (ELL) � � � � � � � � � � � � � � � � � � � � � � � � � � � � � � � � � � 11Migrant Student Enrollment � � � � � � � � � � � � � � � � � � � � � � � � � � � � � � � � � � � � � � � � � � � � � � � � � 13
Early Childhood Education � � � � � � � � � � � � � � � � � � � � � � � � � � � � � � � � � � � � � � � � � � � � � � � � � � � � �15Preschool Programs � � � � � � � � � � � � � � � � � � � � � � � � � � � � � � � � � � � � � � � � � � � � � � � � 15
Preschool Enrollment � � � � � � � � � � � � � � � � � � � � � � � � � � � � � � � � � � � � � � � � � � � � � � � � � � � � � � � 15
Statewide Voluntary Preschool Program for Four-Year-Old Children � � � � � � � � � � � � � � � � � � � � � � � � � � � � � � � � � � � � � � � � � � � � � � � � � � � � � � � � � � � � � � 18Kindergarten � � � � � � � � � � � � � � � � � � � � � � � � � � � � � � � � � � � � � � � � � � � � � � � � � � � � � � � � 22Preschool Attendance (Parent Report) � � � � � � � � � � � � � � � � � � � � � � � � � � � � 24
Staff � � � � � � � � � � � � � � � � � � � � � � � � � � � � � � � � � � � � � � � � � � � � � � � � � � � � � � � � � � � � � � � � � � � � � � � � � � � � � � � � � � � �25Teachers � � � � � � � � � � � � � � � � � � � � � � � � � � � � � � � � � � � � � � � � � � � � � � � � � � � � � � � � � � � � � � 26Principals � � � � � � � � � � � � � � � � � � � � � � � � � � � � � � � � � � � � � � � � � � � � � � � � � � � � � � � � � � � � 39Superintendents � � � � � � � � � � � � � � � � � � � � � � � � � � � � � � � � � � � � � � � � � � � � � � � � � � � � � 43Teacher, Principal, and Superintendent Salary Comparison � � � � 47Public School Professional School Counselors � � � � � � � � � � � � � � � � � � � � 49Public School Library/Media Staff � � � � � � � � � � � � � � � � � � � � � � � � � � � � � � � � � 53Area Education Agency (AEA) Licensed Staff � � � � � � � � � � � � � � � � � � � � � 55Licensed Staff State Totals � � � � � � � � � � � � � � � � � � � � � � � � � � � � � � � � � � � � � � � � � 57Public School Nurses � � � � � � � � � � � � � � � � � � � � � � � � � � � � � � � � � � � � � � � � � � � � � � � � 58
The Annual Condition of Education Report 2017ix

Program � � � � � � � � � � � � � � � � � � � � � � � � � � � � � � � � � � � � � � � � � � � � � � � � � � � � � � � � � � � � � � � � � � � � � � � � � � � � � �59Districts and Schools � � � � � � � � � � � � � � � � � � � � � � � � � � � � � � � � � � � � � � � � � � � � � � � � 59Carnegie Unit Taught � � � � � � � � � � � � � � � � � � � � � � � � � � � � � � � � � � � � � � � � � � � � � � � 60Enrollments in Foreign Language, Algebra II, Higher-Level Mathematics, and Higher-Level Science Courses � � � � � � � � � � � � � � � � 62Senior Year Plus � � � � � � � � � � � � � � � � � � � � � � � � � � � � � � � � � � � � � � � � � � � � � � � � � � � � � 72
Advanced Placement (AP) Courses � � � � � � � � � � � � � � � � � � � � � � � � � � � � � � � � � � � � � � � � � � � � 72Concurrent Enrollment � � � � � � � � � � � � � � � � � � � � � � � � � � � � � � � � � � � � � � � � � � � � � � � � � � � � � � 75Postsecondary Enrollment Options (PSEO) Act � � � � � � � � � � � � � � � � � � � � � � � � � � � � � � � � � � � 78
Class Size � � � � � � � � � � � � � � � � � � � � � � � � � � � � � � � � � � � � � � � � � � � � � � � � � � � � � � � � � � � � � 81Overview � � � � � � � � � � � � � � � � � � � � � � � � � � � � � � � � � � � � � � � � � � � � � � � � � � � � � � � � � � � � � � � � � 81Trends � � � � � � � � � � � � � � � � � � � � � � � � � � � � � � � � � � � � � � � � � � � � � � � � � � � � � � � � � � � � � � � � � � � 81Class Size vs. District Size � � � � � � � � � � � � � � � � � � � � � � � � � � � � � � � � � � � � � � � � � � � � � � � � � � � � 86Class Size Funding and Expenditures � � � � � � � � � � � � � � � � � � � � � � � � � � � � � � � � � � � � � � � � � � � 87
Technology � � � � � � � � � � � � � � � � � � � � � � � � � � � � � � � � � � � � � � � � � � � � � � � � � � � � � � � � � � � 88Expenditures for Computer Hardware and Software � � � � � � � � � � � � � � � � � � � � � � � � � � � � � � 88Availability of Computers � � � � � � � � � � � � � � � � � � � � � � � � � � � � � � � � � � � � � � � � � � � � � � � � � � � � 91Bandwidth � � � � � � � � � � � � � � � � � � � � � � � � � � � � � � � � � � � � � � � � � � � � � � � � � � � � � � � � � � � � � � � � 95
Student Performance � � � � � � � � � � � � � � � � � � � � � � � � � � � � � � � � � � � � � � � � � � � � � � � � � � � � � � � � � � � �97State Indicators of Student Success � � � � � � � � � � � � � � � � � � � � � � � � � � � � � � � 97
Iowa Student Counts for Iowa Assessment Reading, Mathematics, and Science Test-Takers Including Subgroups � � � � � � � � � � � � � � � � � � � � � � � � � � � � � � � � � � � � � � � � � � � � � � � � � � 98Reading � � � � � � � � � � � � � � � � � � � � � � � � � � � � � � � � � � � � � � � � � � � � � � � � � � � � � � � � � � � � � � � � � 103Mathematics � � � � � � � � � � � � � � � � � � � � � � � � � � � � � � � � � � � � � � � � � � � � � � � � � � � � � � � � � � � � � 120Science � � � � � � � � � � � � � � � � � � � � � � � � � � � � � � � � � � � � � � � � � � � � � � � � � � � � � � � � � � � � � � � � � � 135Dropouts � � � � � � � � � � � � � � � � � � � � � � � � � � � � � � � � � � � � � � � � � � � � � � � � � � � � � � � � � � � � � � � � 145High School Graduation Rates � � � � � � � � � � � � � � � � � � � � � � � � � � � � � � � � � � � � � � � � � � � � � � �147Postsecondary Education/Training Intentions � � � � � � � � � � � � � � � � � � � � � � � � � � � � � � � � � �148Probable Postsecondary Success � � � � � � � � � � � � � � � � � � � � � � � � � � � � � � � � � � � � � � � � � � � � �149
Student Performance by Tests and Areas � � � � � � � � � � � � � � � � � � � � � � � �151Iowa Assessments � � � � � � � � � � � � � � � � � � � � � � � � � � � � � � � � � � � � � � � � � � � � � � � � � �151
Iowa Assessments Achievement Level Distributions � � � � � � � � � � � � � � � � � � � � � � � � � � � � �151Achievement Levels for Reading � � � � � � � � � � � � � � � � � � � � � � � � � � � � � � � � � � � � � � � � � � � � �152Achievement Levels for Mathematics � � � � � � � � � � � � � � � � � � � � � � � � � � � � � � � � � � � � � � � � �155Achievement Levels for Science � � � � � � � � � � � � � � � � � � � � � � � � � � � � � � � � � � � � � � � � � � � � � �158
National Assessment of Educational Progress (NAEP) � � � � � � � � �160Scores Reported � � � � � � � � � � � � � � � � � � � � � � � � � � � � � � � � � � � � � � � � � � � � � � � � � � � � � � � � � �160
The Annual Condition of Education Report 2017x

ACT � � � � � � � � � � � � � � � � � � � � � � � � � � � � � � � � � � � � � � � � � � � � � � � � � � � � � � � � � � � � � � � � � �166ACT Score Comparisons for English, Mathematics, Reading, and Science for Iowa and the Nation � � � � � � � � � � � � � � � � � � � � � � � � � � � � � � � � � � � � � � � � � � � � � � � � � � � � � � � � � � � � � � � � � � 168ACT Scores for Core and Less-than-Core Students � � � � � � � � � � � � � � � � � � � � � � � � � � � � � � �169ACT Composite Score Distributions � � � � � � � � � � � � � � � � � � � � � � � � � � � � � � � � � � � � � � � � � � �172ACT Scores by Enrollment Category � � � � � � � � � � � � � � � � � � � � � � � � � � � � � � � � � � � � � � � � � �174ACT Scores by Gender � � � � � � � � � � � � � � � � � � � � � � � � � � � � � � � � � � � � � � � � � � � � � � � � � � � � � �177ACT Composite Scores by Student Planned Educational Majors � � � � � � � � � � � � � � � � � � � �178
SAT � � � � � � � � � � � � � � � � � � � � � � � � � � � � � � � � � � � � � � � � � � � � � � � � � � � � � � � � � � � � � � � � � � �179Advanced Placement (AP) � � � � � � � � � � � � � � � � � � � � � � � � � � � � � � � � � � � � � � � �180Pursuit of Postsecondary Education/Training � � � � � � � � � � � � � � � � � � �183Dropouts � � � � � � � � � � � � � � � � � � � � � � � � � � � � � � � � � � � � � � � � � � � � � � � � � � � � � � � � � � � �187High School Graduates and Graduation Rates � � � � � � � � � � � � � � � � � �192
High School Graduates � � � � � � � � � � � � � � � � � � � � � � � � � � � � � � � � � � � � � � � � � � � � � � � � � � � � �192High School Graduation Rates � � � � � � � � � � � � � � � � � � � � � � � � � � � � � � � � � � � � � � � � � � � � � � �193
Suspensions and Expulsions � � � � � � � � � � � � � � � � � � � � � � � � � � � � � � � � � � � � � � �198
Special Education � � � � � � � � � � � � � � � � � � � � � � � � � � � � � � � � � � � � � � � � � � � � � � � � � � � � � � � � � � � � � � � 207Context of Special Education in Iowa � � � � � � � � � � � � � � � � � � � � � � � � � � � �207
Identification Rates � � � � � � � � � � � � � � � � � � � � � � � � � � � � � � � � � � � � � � � � � � � � � � � � � � � � � � � �207Placement � � � � � � � � � � � � � � � � � � � � � � � � � � � � � � � � � � � � � � � � � � � � � � � � � � � � � � � � � � � � � � � 208Disproportionality � � � � � � � � � � � � � � � � � � � � � � � � � � � � � � � � � � � � � � � � � � � � � � � � � � � � � � � � �210
Are Students Going to School in Safe and Caring Environments? � � � � � � � � � � � � � � � � � � � � � � � � � � � � � � � � � � � � � � � � � � � � �211
Positive Behavioral Interventions and Supports (PBIS) � � � � � � � � � � � � � � � � � � � � � � � � � � �211Discipline � � � � � � � � � � � � � � � � � � � � � � � � � � � � � � � � � � � � � � � � � � � � � � � � � � � � � � � � � � � � � � � � 211
Are Students Achieving at High Levels? � � � � � � � � � � � � � � � � � � � � � � � � �213National Assessment of Educational Progress (NAEP) � � � � � � � � � � � � � � � � � � � � � � � � � � �213Iowa Assessments � � � � � � � � � � � � � � � � � � � � � � � � � � � � � � � � � � � � � � � � � � � � � � � � � � � � � � � � �215
Are Students Leaving School Ready for Life? � � � � � � � � � � � � � � � � � � � �218Graduation Rates � � � � � � � � � � � � � � � � � � � � � � � � � � � � � � � � � � � � � � � � � � � � � � � � � � � � � � � � � � � 218
Finance� � � � � � � � � � � � � � � � � � � � � � � � � � � � � � � � � � � � � � � � � � � � � � � � � � � � � � � � � � � � � � � � � � � � � � � � � � � � � 219Function Category Expenditures � � � � � � � � � � � � � � � � � � � � � � � � � � � � � � � � � �219Object Category Expenditures � � � � � � � � � � � � � � � � � � � � � � � � � � � � � � � � � � � �220Revenues � � � � � � � � � � � � � � � � � � � � � � � � � � � � � � � � � � � � � � � � � � � � � � � � � � � � � � � � � � � �222Taxable Valuation � � � � � � � � � � � � � � � � � � � � � � � � � � � � � � � � � � � � � � � � � � � � � � � � � �225Expenditures Per Pupil � � � � � � � � � � � � � � � � � � � � � � � � � � � � � � � � � � � � � � � � � � � � �228State Aid � � � � � � � � � � � � � � � � � � � � � � � � � � � � � � � � � � � � � � � � � � � � � � � � � � � � � � � � � � � �231
The Annual Condition of Education Report 2017xi

Property Taxes � � � � � � � � � � � � � � � � � � � � � � � � � � � � � � � � � � � � � � � � � � � � � � � � � � � � � �232Income Surtaxes � � � � � � � � � � � � � � � � � � � � � � � � � � � � � � � � � � � � � � � � � � � � � � � � � � � �236Instructional Support � � � � � � � � � � � � � � � � � � � � � � � � � � � � � � � � � � � � � � � � � � � � � �237Budget Adjustment � � � � � � � � � � � � � � � � � � � � � � � � � � � � � � � � � � � � � � � � � � � � � � � �240Bond Elections � � � � � � � � � � � � � � � � � � � � � � � � � � � � � � � � � � � � � � � � � � � � � � � � � � � � � �242Physical Plant and Equipment Elections � � � � � � � � � � � � � � � � � � � � � � � � �242Secure an Advanced Vision for Education (SAVE) � � � � � � � � � � � � � � �243Total Elementary and Secondary Education Budgets� � � � � � � � � � �245
The Annual Condition of Education Report 2017xii

EnrollmentThe public and nonpublic enrollment trends in Iowa, by district size and area education agency (AEA) are presented in this chapter, including data on student characteristics such as race/ethnicity, English language learners (ELL), percent of students eligible for free or reduced price lunch, special education enrollment, and migrant enrollment. These data come from the Basic Educational Data Survey (BEDS), certified enroll-ment, Student Reporting in Iowa (SRI), and Iowa special education records.
Certified enrollment counts are used for the Iowa School Finance Formula calculation, and include resident students, supplemental weightings for sharing programs, weighting for ELL students, nonpublic school assistance, and dual enrollments. Enrollment data by grade and race/ethnicity are calculated by the at-tending district.
Enrollment in 2016-2017 continues to increase after a 14-year decline between 1997-1998 and 2011-2012. The public school enrollment projection shows an enrollment increase in the next five years, while the nonpublic school enrollment trend remained the same (Figure 1-1). More than two-thirds of Iowa public school districts in 2000-2001 had district enrollments less than 1,000 and these districts served about 28 percent of K-12 students. Over two-thirds of the districts in 2015-2016 and 2016-2017 had less than 1,000 students and served 25 percent of K-12 public school students (Table 1-3). There are nine AEAs in Iowa that serve students. The largest is Heartland AEA which serves 27.8 percent of Iowa students in 2016-2017 (Table 1-4).
The Open Enrollment Act (Iowa Code 282.18) of 1989-1990 states, “It’s the goal of the general assembly to permit a wide range of educational choices for children enrolled in schools in this state and to maximize ability to use those choices…,[To] maximize parental choices and access to educational opportunities that are not available to children because of where they live.” The number and percent of students taking advantage of the Open Enrollment Act continues to increase (Table 1-5). The smallest and largest enroll-ment categories in 2015-2016 and 2016-2017 had more students open-enrolling out than open-enrolling in. The 1,000-2,499 enrollment category gained the most students from the open enrollment legislation (Table 1-6).
Children from families with incomes at or below 130 percent of the poverty level are eligible for free lunch and children from families with incomes between 130 percent and 185 percent of the poverty level are eligible for reduced lunch, according to the National School Lunch Program. In 2016-2017 the percent of students eligible for free or reduced lunch decreased slightly (Figure 1-2). Districts in the largest and smallest enrollment categories had the highest percentage of students eligible for free or reduced price lunch (Table 1-7).
Children requiring special education are “Persons under 21 years of age, including children under five years of age, who have a disability because of a head injury, autism, behavior disorder, or physical, mental, communication, or learning disability, as defined by the rules of the department of education” (Iowa Code 256.2). The special education students in Iowa public schools accounted for 13 percent of the total certi-fied enrollment in 2005-2006. For the last three years, the percentage remained 11.6 (Table 1-8).
The percent of minority students in public and nonpublic schools continued to increase in 2016-2017 (Table 1-9, Table 1-10, and Figure 1-3). The largest enrollment category had the highest percent of minor-ity students at 40 percent while the two smallest enrollment categories had the lowest percent of minority students (Table 1-11).
The Annual Condition of Education Report 20171

The percent of English Language Learner (ELL) students in public schools increased slightly in 2016-2017, as well as the number of ELL students in nonpublic schools (Figure 1-4). The majority of ELL students spoke Spanish in all three years presented (Table 1-12). An ELL student is eligible for 0.22 weighted funding for four years. Districts with more students had more weighted ELL students in all years presented in Table 1-13.
The U.S. Department of Education defines a “migratory child” as a child who is (or whose parent or spouse is) a migratory agricultural worker or migratory fisher. A migratory agricultural worker or migratory fisher is one who has moved from one school district to another in the preceding 36 months in order to obtain temporary or seasonal employment in agricultural or fishing work. Migrant student data are collected by the Iowa Department of Education through a directed certified system. The number and percent of migrant students in the 2015-2016 and 2016-2017 school year are displayed in Table 1-14.
The Annual Condition of Education Report 20172

Enrollment TrendsFigure 1-1t
Iowa’s Public and Nonpublic School K-12 Enrollments 1972-1973, 1988-1989, 1993-1994, 1998-1999, 2003-2004, 2008-2009 and 2012-2013 to 2016-2017
and Projected Enrollments 2017-2018 to 2021-2022
-
100,000
200,000
300,000
400,000
500,000
600,000
700,000
800,000
Enr
ollm
ent
School Year
Total Public Nonpublic
Source: Iowa Department of Education, Bureau of Information and Analysis.
The Annual Condition of Education Report 20173

Projected EnrollmentTable 1-1
Iowa’s Public School K-12 Enrollments 2015-2016 to 2016-2017 and Projected Enrollments 2017-2018 to 2021-2022 by Grade
Source: Iowa Department of Education, Bureau of Information and Analysis.Notes: PKIEP: prekindergarten individualized education programs. Figures may not total due to rounding.
Certified Enrollment
Projected Certified Enrollment
Grade 2015-2016
2016-2017
2017-2018
2018-2019
2019-2020
2020-2021
2021-2022
K 39,355 38,327 38,830 39,212 39,773 39,790 39,8431 36,510 36,155 35,113 35,574 35,924 36,438 36,4542 37,717 36,747 36,248 35,203 35,665 36,016 36,5313 37,682 38,028 36,902 36,400 35,352 35,815 36,1674 37,178 37,995 38,226 37,094 36,590 35,535 36,0025 36,467 37,474 38,196 38,428 37,290 36,783 35,7236 36,091 36,905 37,762 38,490 38,724 37,577 37,0667 36,505 36,521 37,284 38,151 38,886 39,122 37,9638 36,127 36,717 36,730 37,498 38,369 39,108 39,3469 37,288 37,328 37,741 37,755 38,544 39,439 40,199
10 37,413 37,130 37,064 37,474 37,488 38,271 39,16011 36,271 36,750 36,497 36,432 36,835 36,848 37,61912 36,645 36,833 37,426 37,168 37,102 37,512 37,526
PKIEP 2,204 2,237 2,226 1,940 1,703 1,514 1,322State 483,451 485,147 486,245 486,818 488,243 489,770 490,922
The Annual Condition of Education Report 20174

Table 1-2
Iowa’s Nonpublic School K-12 Enrollments 2015-2016 to 2016-2017and Projected Enrollments 2017-2018 to 2021-2022 by Grade
Source: Iowa Department of Education, Bureau of Information and Analysis.Note: Figures may not total due to rounding.
K-12 Enrollments by District Size CategoryTable 1-3
Iowa’s Public School Districts and K-12 Students by Enrollment Category 2000-2001, 2015-2016 and 2016-2017
Source: Iowa Department of Education, Bureau of Information and Analysis, Certified Enrollment.Note: Figures may not total due to rounding.
Enrollment Projected EnrollmentGrade 2015-
20162016-2017
2017-2018
2018-2019
2019-2020
2020-2021
2021-2022
K 3,287 3,187 3,168 3,199 3,245 3,246 3,2501 3,077 3,090 3,005 2,987 3,016 3,059 3,0612 3,053 3,035 3,065 2,981 2,963 2,992 3,0353 3,136 3,037 3,028 3,058 2,974 2,956 2,9854 3,077 3,054 3,002 2,993 3,022 2,939 2,9225 2,908 3,011 3,004 2,953 2,944 2,973 2,8916 2,775 2,706 2,862 2,855 2,807 2,798 2,8267 2,260 2,420 2,332 2,466 2,461 2,419 2,4118 2,275 2,244 2,386 2,300 2,432 2,426 2,3859 1,786 1,696 1,677 1,784 1,719 1,818 1,814
10 1,835 1,672 1,663 1,645 1,749 1,686 1,78311 1,799 1,765 1,652 1,643 1,625 1,728 1,66512 1,772 1,705 1,727 1,616 1,608 1,590 1,691
State 33,040 32,622 32,571 32,479 32,564 32,630 32,718
2000-2001 2015-2016 2016-2017Enrollment
CategoryDistrict Students District Students District Students
N % N % N % N % N % N %<300 38 10.2 8,176 1.7 40 11.9 8,873 1.8 38 11.4 8,663 1.8
300-599 116 31.0 52,162 10.6 101 30.1 46,037 9.5 103 30.9 47,325 9.8600-999 104 27.8 78,916 16.0 85 25.3 63,362 13.1 82 24.6 61,470 12.7
1,000-2,499 83 22.2 126,118 25.5 77 22.9 116,020 24.0 77 23.1 116,271 24.02,500-7,499 24 6.4 96,410 19.5 22 6.5 95,647 19.8 22 6.6 96,535 19.9
7,500+ 9 2.4 132,509 26.8 11 3.3 153,512 31.8 11 3.3 154,884 31.9State 374 100.0 494,291 100.0 336 100.0 483,451 100.0 333 100 485,147 100
The Annual Condition of Education Report 20175

Enrollment in Iowa’s Area Education Agencies (AEAs)Table 1-4
Total Iowa Public and Nonpublic K-12 Students by AEA 2016-2017
Source: Iowa Department of Education, Bureau of Information and Analysis, Basic Educational Data Survey and Student Reporting in Iowa.
Note: Figures may not total due to rounding.
Open EnrollmentTable 1-5
Number and Percent of Public School K-12 Open Enrolled Out Students 1990-1991, 1995-1996, 2000-2001, 2005-2006, 2010-2011 to 2016-2017
Source: Iowa Department of Education, Bureau of Information and Analysis, Certified Enrollment and Student Reporting in Iowa.
.
Public Schools Nonpublic Schools TotalAEA Enrollment Percent Enrollment Percent Enrollment Percent
Keystone 28,477.9 5.9 4,267 13.1 32,745 6.3AEA 267 62,430.1 12.9 3,113 9.5 65,543 12.7
Prairie Lakes 29,992.0 6.2 2,166 6.6 32,158 6.2Mississippi Bend 46,995.3 9.7 3,248 10.0 50,243 9.7
Grant Wood 69,472.2 14.3 4,490 13.8 73,962 14.3Heartland 135,915.5 28.0 8,140 25.0 144,056 27.8
Northwest 39,279.1 8.1 5,039 15.4 44,318 8.6Green Hills 37,620.9 7.8 1,026 3.1 38,647 7.5
Great Prairie 34,964.3 7.2 1,133 3.5 36,097 7.0State 485,147.3 100 32,622 100.0 517,769 100.0
% Open Enrolled Out # Open Enrolled Out Certified Enrollment1990-1991 0.6 2,757 483,399
1995-1996 2.5 12,502 504,505
2000-2001 3.8 18,554 494,291
2005-2006 4.8 23,155 483,105
2010-2011 5.5 25,831 473,4932011-2012 5.6 26,743 473,5042012-2013 5.8 27,651 476,2452013-2014 6.0 28,632 478,9212014-2015 6.1 29,372 480,7722015-2016 6.3 30,463 483,4512016-2017 6.5 31,369 485,147
The Annual Condition of Education Report 20176

Table 1-6
Open Enrollment in Iowa’s Public Schools by Enrollment Category 2000-2001, 2015-2016 and 2016-2017
Source: Iowa Department of Education, Bureau of Information and Analysis, Certified Enrollment and Student Reporting in Iowa.Notes: wt indicates with. Figures may not total due to rounding.
Enrollment Category
<300 300-599 600-999 1,000-2,499 2,500-7,499
7,500+ State
2000-2001 Total # Districts 38 116 104 83 24 9 374
# Students 8,176 52,162 78,916 126,118 96,410 132,509 494,291
# Students Open In 398 3,366.6 4,177.9 5,295.4 3,571.6 1,625.4 18,434.9
# Students Open Out 1,036.2 3,499.3 3,742.3 3,955.6 3,141.0 3,179.5 18,553.9
Net Gains/Losses -638.2 -132.7 435.6 1,339.8 430.6 -1,554.1
# Districts wt Gains 6 47 49 53 13 0 168
# Districts wt Losses 30 65 54 30 11 9 199
# Districts wt No Gain/Loss 2 4 1 0 0 0 7
2015-2016 Total # Districts 40 101 85 77 22 11 336
# Students 8,873 46,037 63,362 116,020 95,647 153,512 483,451
# Students Open In 1,190.0 6,796.0 5,499.0 8,465.0 5,938.0 2,575.0 30,463.0
# Students Open Out 1,901.0 5,038.0 5,152.0 6,068.0 5,537.0 6,768.0 30,463.0
Net Gains/Losses -711.0 1,758.0 347.0 2,397.0 401.0 -4,193.0
# Districts wt Gains 13 47 40 45 11 0 156
# Districts wt Losses 27 53 45 32 11 11 179
# Districts wt No Gain/Loss 0 1 0 0 0 0 1
2016-2017 Total # Districts 38 103 82 77 22 11 333
# Students 8,662.6 47,325.3 61,469.5 116,270.8 96,535.4 154,883.7 485,147.3
# Students Open In 1,242.4 7,363.6 5,464.8 8,970.3 5,797.5 2,530.8 3,1369.4
# Students Open Out 1,840.9 5,432.2 5,059.3 6,433.0 5,626.8 6,977.2 31,369.4
Net Gains/Losses -598.5 1,931.4 405.5 2,537.3 170.7 -4,446.4
# Districts wt Gains 13 52 40 44 11 0 160
# Districts wt Losses 25 50 42 33 11 11 172
# Districts wt No Gain/Loss 0 1 0 0 0 0 1
The Annual Condition of Education Report 20177

Subgroup EnrollmentsStudents Eligible for Free or Reduced Price LunchFigure 1-2
Percent of Public School K-12 Students Eligible for Free or Reduced Price Meals 2000-2001, 2005-2006, 2010-2011 to 2016-2017
27.0%
32.1%
38.9% 40.1% 41.0% 41.1% 41.0% 41.8% 41.3%
19.2%
24.4%
30.9%32.6%
34.2% 34.5% 34.0% 34.7% 34.3%
7.8% 8.2% 8.1% 7.5% 6.8% 6.7% 7.0% 7.1% 7.0%
0%
10%
20%
30%
40%
50%
2000-2001 2005-2006 2010-2011 2011-2012 2012-2013 2013-2014 2014-2015 2015-2016 2016-2017
Per
cent
Free/Reduced Free Reduced
School Year
Source: Iowa Department of Education, Bureau of Information and Analysis, Basic Educational Data Survey and Student Report-ing in Iowa.
Table 1-7
K-12 Public School Students Eligible for Free or Reduced Price Lunch by Enrollment Category 2000-2001, 2015-2016 and 2016-2017
Source: Iowa Department of Education, Bureau of Information and Analysis, Basic Educational Data Survey and Student Report-ing in Iowa.
2000-2001 2015-2016 2016-2017Enrollment
CategoryK-12
(BEDS) Enrollment
# Free/Reduced Eligible
% Free/Reduced Eligible
K-12 (BEDS)
Enrollment
# Free/Reduced Eligible
% Free/Reduced Eligible
K-12 (BEDS)
Enrollment
# Free/Reduced Eligible
% Free/Reduced Eligible
<300 6,711 2,256 33.6 7,256 3,414 47.1 7,208 3,529 49.0300-599 50,933 13,511 26.5 47,726 17,002 35.6 49,071 17,141 34.9600-999 77,327 17,966 23.2 63,694 22,944 36.0 61,911 21,960 35.5
1,000-2,499 122,830 29,876 24.3 117,598 44,589 37.9 117,916 44,852 38.02,500-7,499 93,322 21,433 23.0 95,600 34,513 36.1 96,145 32,786 34.1
7,500+ 125,804 43,874 34.9 148,188 78,198 52.8 149,337 78,617 52.6State 476,927 128,916 27.0 480,062 200,660 41.8 481,588 198,885 41.3
The Annual Condition of Education Report 20178

Special Education EnrollmentTable 1-8
Iowa’s Public School Special Education Weighted Enrollment 2000-2001, 2003-2004 to 2016-2017
Sources: Iowa Department of Education, Bureau of Information and Analysis, Certified Enrollment files, Bureau of Learner Strategies and Supports, Last Friday of October Special Education Weighted Enrollment files.
Enrollment by Race and EthnicityTable 1-9
Iowa’s Public School K-12 Enrollments by Race/Ethnicity 2000-2001, 2015-2016 and 2016-2017
Source: Iowa Department of Education, Bureau of Information and Analysis, Basic Educational Data Survey and Student Reporting in Iowa.
School Year Percent Special Education Students Number Special Education Students Certified Enrollment2000-2001 12.8 63,392 494,291
2003-2004 13.4 65,027 485,0112004-2005 13.5 65,065 483,3352005-2006 13.3 64,350 483,1052006-2007 13.1 63,411 482,5842007-2008 12.9 61,859 480,6092008-2009 12.7 60,581 477,0192009-2010 12.6 59,967 474,2272010-2011 12.7 60,223 473,4932011-2012 12.5 59,104 473,5042012-2013 12.1 57,494 476,2452013-2014 11.8 56,550 478,9212014-2015 11.6 55,923 480,7722015-2016 11.6 56,039 483,4512016-2017 11.7 56,813 485,147
2000-2001 2015-2016 2016-2017Race/Ethnicity Group N % N % N %
All Minority 46,250 9.7 108,345 22.6 113,076 23.5
African American 18,510 3.9 27,361 5.7 28,812 6.0American Indian 2,447 0.5 1,835 0.4 1,810 0.4
Asian 8,274 1.7 11,450 2.4 11,866 2.5Native Hawaiian/Pacific Islander - - 1,032 0.2 1,175 0.2
Two or More Races - - 17,128 3.6 18,033 3.7Hispanic 17,019 3.6 49,539 10.3 51,380 10.7
White 430,677 90.3 371,717 77.4 368,512 76.5Total 476,927 100.0 480,062 100.0 481,588 100.0
The Annual Condition of Education Report 20179

Table 1-10
Iowa’s Nonpublic K-12 Enrollments by Race/Ethnicity 2000-2001, 2015-2016 and 2016-2017
Source: Iowa Department of Education, Bureau of Information and Analysis, Basic Educational Data Survey and Student Reporting in Iowa.
Figure 1-3
Iowa’s Public and Nonpublic Minority Enrollment as a Percentage of Total K-12 Enrollment 2000-2001, 2005-2006, 2010-2011 to 2016-2017
9.7%
13.4%
18.5% 19.3%20.2%
21.1% 21.8% 22.6%23.5%
4.7%6.5%
10.7% 11.4%12.4% 13.1% 13.8%
14.9%15.9%
9.3%
12.9%
17.9%18.9% 19.7%
20.6% 21.3% 22.1%23.0%
0%
5%
10%
15%
20%
25%
2000-2001 2005-2006 2010-2011 2011-2012 2012-2013 2013-2014 2014-2015 2015-2016 2016-2017
Public NonPublic Public and Nonpublic
School Year
Per
cent
Source: Iowa Department of Education, Bureau of Information and Analysis, Basic Educational Data Survey and Student Reporting in Iowa.
2000-2001 2015-2016 2016-2017Race/Ethnicity Group N % N % N %
All Minority 1,946 4.7 4,929 14.9 5,186 15.9African American 492 1.2 739 2.2 740 2.3American Indian 70 0.2 44 0.1 67 0.2
Asian 563 1.4 945 2.9 896 2.7Native Hawaiian/Pacific Islander - - 64 0.2 61 0.2
Two or More Races - - 659 2.0 720 2.2Hispanic 821 2.0 2,478 7.5 2,702 8.3
White 39,118 95.3 28,111 85.1 27,436 84.1Total 41,064 100.0 33,040 100.0 32,622 100.0
The Annual Condition of Education Report 201710

Table 1-11
Iowa’s Public School Percent of K-12 Minority Students by Enrollment Category 2000-2001, 2015-2016 and 2016-2017
Source: Iowa Department of Education, Bureau of Information and Analysis, Basic Educational Data Survey and Student Reporting in Iowa.
Enrollment of English Language Learners (ELL)Figure 1-4
Percent of Public School and Nonpublic School K-12 English Language Learner Students 2000-2001, 2005-2006, 2010-2011 to 2016-2017
Enrollment Category 2000-2001 2015-2016 2016-2017<300 1.5 8.3 9.5
300-599 2.4 7.7 8.0600-999 2.6 10.3 10.8
1,000-2,499 5.9 15.7 16.42,500-7,499 9.0 22.6 23.5
7,500+ 21.7 38.8 40.0State 9.7 22.6 23.5
Source: Iowa Department of Education, Bureau of Information and Analysis, Basic Educational Data Survey and Student Reporting in Iowa.
2.3%
3.5%
4.6% 4.8% 5.0%5.3%
5.7% 5.7%5.9%
0.5%1.0%
1.5%2.0%
2.4%
3.0%2.6%
3.0%3.3%
0%
2%
4%
6%
8%
2000-2001 2005-2006 2010-2011 2011-2012 2012-2013 2013-2014 2014-2015 2015-2016 2016-2017
Per
cent
School Year
Public Nonpublic
The Annual Condition of Education Report 201711
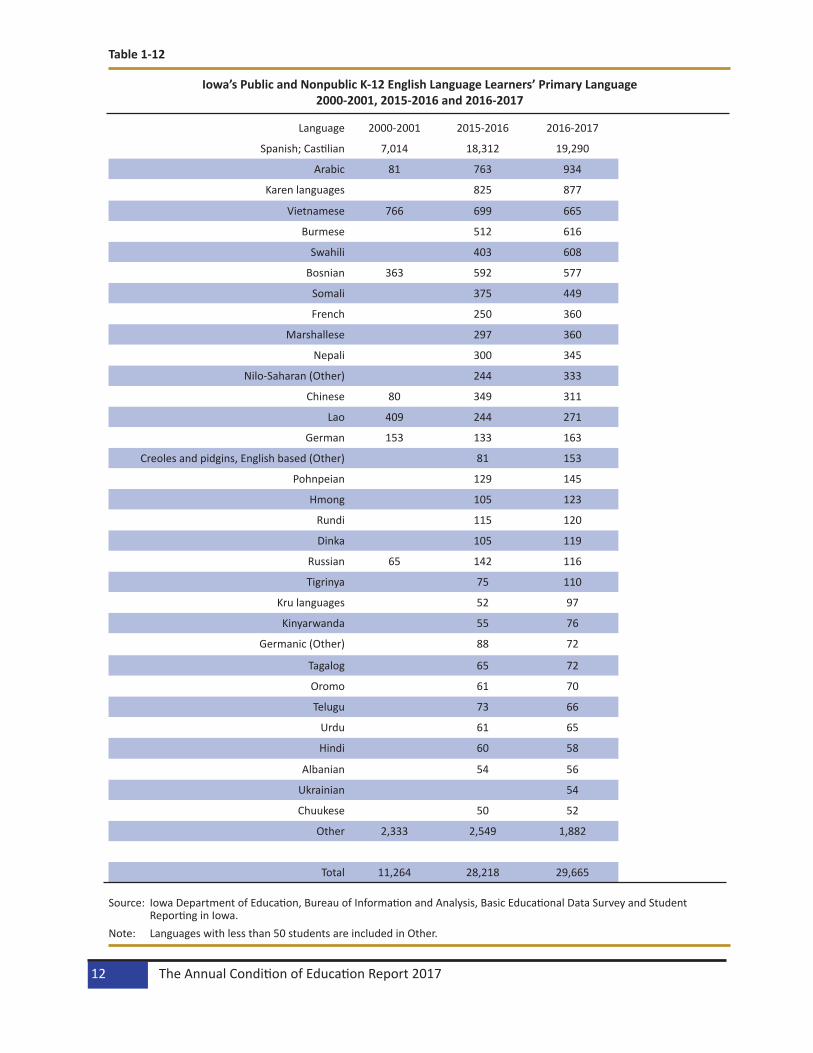
Table 1-12
Iowa’s Public and Nonpublic K-12 English Language Learners’ Primary Language 2000-2001, 2015-2016 and 2016-2017
Language 2000-2001 2015-2016 2016-2017
Spanish; Castilian 7,014 18,312 19,290
Arabic 81 763 934
Karen languages 825 877
Vietnamese 766 699 665
Burmese 512 616
Swahili 403 608
Bosnian 363 592 577
Somali 375 449
French 250 360
Marshallese 297 360
Nepali 300 345
Nilo-Saharan (Other) 244 333
Chinese 80 349 311
Lao 409 244 271
German 153 133 163
Creoles and pidgins, English based (Other) 81 153
Pohnpeian 129 145
Hmong 105 123
Rundi 115 120
Dinka 105 119
Russian 65 142 116
Tigrinya 75 110
Kru languages 52 97
Kinyarwanda 55 76
Germanic (Other) 88 72
Tagalog 65 72
Oromo 61 70
Telugu 73 66
Urdu 61 65
Hindi 60 58
Albanian 54 56
Ukrainian 54
Chuukese 50 52
Other 2,333 2,549 1,882
Total 11,264 28,218 29,665
Source: Iowa Department of Education, Bureau of Information and Analysis, Basic Educational Data Survey and Student Reporting in Iowa.
Note: Languages with less than 50 students are included in Other.
The Annual Condition of Education Report 201712
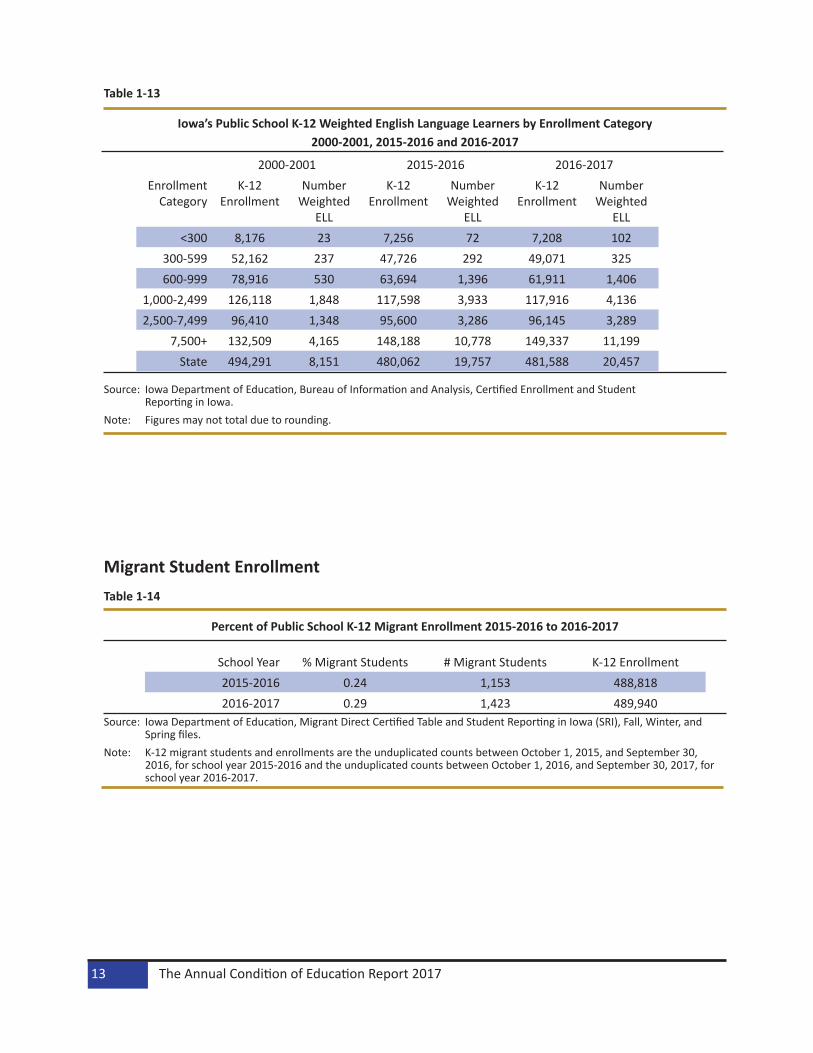
Table 1-13
Iowa’s Public School K-12 Weighted English Language Learners by Enrollment Category 2000-2001, 2015-2016 and 2016-2017
Source: Iowa Department of Education, Bureau of Information and Analysis, Certified Enrollment and Student Reporting in Iowa.
Note: Figures may not total due to rounding.
Migrant Student EnrollmentTable 1-14
Percent of Public School K-12 Migrant Enrollment 2015-2016 to 2016-2017
School Year % Migrant Students # Migrant Students K-12 Enrollment2015-2016 0.24 1,153 488,8182016-2017 0.29 1,423 489,940
Source: Iowa Department of Education, Migrant Direct Certified Table and Student Reporting in Iowa (SRI), Fall, Winter, and Spring files.
Note: K-12 migrant students and enrollments are the unduplicated counts between October 1, 2015, and September 30, 2016, for school year 2015-2016 and the unduplicated counts between October 1, 2016, and September 30, 2017, for school year 2016-2017.
2000-2001 2015-2016 2016-2017Enrollment
CategoryK-12
Enrollment Number
Weighted ELL
K-12 Enrollment
Number Weighted
ELL
K-12 Enrollment
Number Weighted
ELL <300 8,176 23 7,256 72 7,208 102
300-599 52,162 237 47,726 292 49,071 325600-999 78,916 530 63,694 1,396 61,911 1,406
1,000-2,499 126,118 1,848 117,598 3,933 117,916 4,1362,500-7,499 96,410 1,348 95,600 3,286 96,145 3,289
7,500+ 132,509 4,165 148,188 10,778 149,337 11,199State 494,291 8,151 480,062 19,757 481,588 20,457
The Annual Condition of Education Report 201713

The Annual Condition of Education Report 201714

Early Childhood EducationData on Early Childhood Education are reported by school districts through the Basic Educational Data Survey (BEDS) program level data collection forms and the Student Reporting in Iowa student level data collection. This chapter describes preschool and kindergarten programs in 2015-2016 and 2016-2017.
Preschool ProgramsPreschool EnrollmentDistricts throughout the state offer preschool to three- and four-year-old children. Table 2-1 shows the number of districts that offered preschool during the past two school years and Table 2-2 shows the pre-school enrollment by enrollment category for the past two years. About 98.5 percent of school districts offered preschool during the 2016-2017 school year. Table 2-3 shows the breakdown of preschool enroll-ment by subgroup for the past two years. More students participate in a district sponsored preschool program than in 2015-2016.
The Annual Condition of Education Report 201715

Table 2-1
Iowa Public School Districts Offering Preschool by Enrollment Category 2015-2016 to 2016-2017
Enrollment Category Total Districts Districts Offering Preschool Percent of Districts Offering Preschool
2015-2016
<300 40 38 95.0
300-599 101 97 96.0
600-999 85 83 97.6
1,000-2,499 77 77 100.0
2,500-7,499 22 22 100.0
7,500+ 11 11 100.0
State 336 328 97.6
2016-2017
<300 38 38 100.0
300-599 103 100 97.1
600-999 82 80 97.6
1,000-2,499 77 77 100.0
2,500-7,499 22 22 100.0
7,500+ 11 11 100.0
State 333 328 98.5
Source: Iowa Department of Education, Bureau of Information and Analysis, Student Reporting in Iowa files.
The Annual Condition of Education Report 201716

Table 2-2
Iowa Public School Preschool Enrollment by Enrollment Category 2015-2016 and 2016-2017
Source: Iowa Department of Education, Bureau of Information and Analysis, Student Reporting in Iowa files.
Table 2-3
Iowa Public School Preschool Students by Subgroup 2015-2016 and 2016-20172015-2016 2016-2017
Subgroup N % N %All Minority 6,056 20.9 6,407 21.8
African American 1,392 4.8 1,486 5.1American Indian 81 0.3 95 0.3
Asian 771 2.7 821 2.8Native Hawaiian/Pacific Islander 52 0.2 62 0.2
Two or More Races 1,036 3.6 1,153 3.9Hispanic 2,724 9.4 2,790 9.5
White 22,945 79.1 22,937 78.2PELL 470 513 1.7
Free/Reduced Meal 7,392 25.5 7,019 23.9Male 15,104 52.1 15,263 52.0
Female 13,897 47.9 14,081 48.0Total 29,001 100.0 29,344 100.0
Source: Iowa Department of Education, Bureau of Information and Analysis, Student Reporting in Iowa files. Note: PELL - Potential English Language Learner.
2015-2016 2016-2017Enrollment Category N % N %
<300 772 2.7% 736 2.5%300-599 3,536 12.2% 3,636 12.4%600-999 4,081 14.1% 4,043 13.8%
1,000-2,499 7,337 25.3% 7,392 25.2%2,500-7,499 5,259 18.1% 5,477 18.7%
7,500+ 8,016 27.6% 8,060 27.5%State 29,001 100.0% 29,344 100.0%
The Annual Condition of Education Report 201717

Statewide Voluntary Preschool Program for Four-Year-Old ChildrenThe Statewide Voluntary Preschool Program (SWVPP) for Four-Year-Old Children was established May 10, 2007, with signing of House File 877. The SWVPP legislation provides an opportunity for all four-year-old children in Iowa to enter school ready to learn by expanding access to research-based preschool curricula and early childhood licensed teaching staff. The allocation of funds for the SWVPP is to improve access to high quality early childhood education through predictable, equitable, and sustainable funding to increase the number of children participating in quality programs.
Table 2-4 shows the number of districts that provided the SWVPP, number of students funded, and the to-tal number of students who participated in the program. These districts continue to operate the Statewide Voluntary Preschool Program through ongoing funding generated by the student count. The same table and Figure 2-1 represent the number of four-year-old children funded from 2015-2016 to 2016-2017. Children served in SWVPP classrooms may also include 3- and 5-year-olds. Numbers of students served in Table 2-4 include the children who are younger or older (ages 3 and 5) who participate in the SWVPP (see the last row in Table 2-4). The number of students funded and served by the SWVPP continues to increase.
The Annual Condition of Education Report 201718

Table 2-4
Statewide Voluntary Preschool Program, 2015-2016 to 2016-2017
Source: Iowa Department of Education, Early Childhood Services, Statewide Voluntary Preschool Application Data.
Figure 2-1
Statewide Voluntary Preschool Program Funded Enrollment Count 2015-2016 to 2016-2017
23,141 23,518
10,000
12,000
14,000
16,000
18,000
20,000
22,000
24,000
26,000
2015-2016 2016-2017
Num
ber o
f Fou
r-Yea
r-Old
Chi
ldre
n E
nrol
led
Source: Iowa Department of Education, Bureau of Information and Analysis, Student Reporting in Iowa, fall files.
The number of SWVPP students by age and Individualized Education Program (IEP) status is shown in Table 2-5. Instructional IEPs and support only IEPs are listed separately since they have different funding sources. The number of students receiving special education services (IEP) in SWVPP decreased between 2015-2016 and 2016-2017. Table 2-6 indicates the number of 3-, 4-, and 5-year-old children served in the SWVPP by race/ethnicity, free/reduced price meals, and gender. Free/Reduced meals data may be underreported since the SWVPP is only required to meet ten hours per week and preschool students may not receive meals. Information on Potential English Language Learners (PELL) was collected for the first time during 2014-2015. The percentage of children participating in district sponsored preschool programs who were identified to have potential language learning needs during 2016-2017 was 2.0 percent. The numbers of three-, four-, and five-year-olds served in SWVPP increased from 2015-2016 to 2016-2017.
2015-2016 2016-2017Number of Districts Participated 322 322
Number of Students Funded 23,141 23,518Number of Students Served 24,734 24,961
The Annual Condition of Education Report 201719

Table 2-5
SWVPP Students Served by Age and IEP Status 2015-2016 and 2016-2017
2015-2016 2016-2017Age 3 Age 4 Age 5 All Ages Age 3 Age 4 Age 5 All Ages
IEP Instruction 278 641 57 976 299 592 71 962IEP Support Services 16 282 4 302 8 270 2 280
Regular Education 325 22,987 144 23,456 322 23,248 149 23,719Total Served 619 23,910 205 24,734 629 24,110 222 24,961
Source: Iowa Department of Education, Bureau of Information and Analysis, Student Reporting in Iowa, fall files.Notes: IEP - Individualized Education Program. SWVPP - Statewide Voluntary Preschool Program.
The Annual Condition of Education Report 201720

Table 2-6
SWVPP Students Served by Subgroup 2015-2016 and 2016-2017
Source: Iowa Department of Education, Bureau of Information and Analysis, Student Reporting in Iowa fall files.Notes: SWVPP - Statewide Voluntary Preschool Program. PELL - Potential English Language Learner.
2015-2016Age 3 % Age 4 % Age 5 % All %
All Students Served
619 23,910 205 24,734
All Minority 124 20.0% 4,980 20.8% 27 13.2% 5,131 20.7%African American 24 3.9% 1,110 4.6% 5 2.4% 1,139 4.6%American Indian 1 0.2% 72 0.3% 2 1.0% 75 0.3%
Asian 15 2.4% 617 2.6% 1 0.5% 633 2.6%Native Hawaiian/
Pacific Islander1 0.2% 47 0.2% 0 0.0% 48 0.2%
Two or More Races
35 5.7% 845 3.5% 6 2.9% 886 3.6%
Hispanic 48 7.8% 2,289 9.6% 13 6.3% 2,350 9.5%White 495 80.0% 18,930 79.2% 178 86.8% 19,603 79.3%
PELL 6 1.0% 426 1.8% 3 1.5% 435 1.8%Free/Reduced
Meal168 27.1% 5,523 23.1% 51 24.9% 5,742 23.2%
Female 242 39.1% 11,745 49.1% 65 31.7% 12,052 48.7%Male 377 60.9% 12,165 50.9% 140 68.3% 12,682 51.3%
2016-2017All Students
Served629 24,110 222 24,961
All Minority 109 17.3% 5,305 22.0% 26 11.7% 5,440 21.8%African American 21 3.3% 1,182 4.9% 7 3.2% 1,210 4.8%American Indian 2 0.3% 82 0.3% 0 0.0% 84 0.3%
Asian 13 2.1% 685 2.8% 0 0.0% 698 2.8%Native Hawaiian/
Pacific Islander0 0.0% 54 0.2% 1 0.5% 55 0.2%
Two or More Races
19 3.0% 960 4.0% 7 3.2% 986 4.0%
Hispanic 54 8.6% 2,342 9.7% 11 5.0% 2,407 9.6%White 520 82.7% 18,805 78.0% 196 88.3% 19,521 78.2%
PELL 5 0.8% 482 2.0% 2 0.9% 489 2.0%Free/Reduced
Meal164 26.1% 5,277 21.9% 49 22.1% 5,490 22.0%
Female 257 40.9% 11,896 49.3% 64 28.8% 12,217 48.9%Male 372 59.1% 12,214 50.7% 158 71.2% 12,744 51.1%
The Annual Condition of Education Report 201721

KindergartenSchool districts report the type of kindergarten program offered in their district on the spring Basic Educa-tional Data Survey (BEDS). The types of kindergarten programs reported include all day every day, half day every day, alternate day, three days a week, and other combinations. As shown in Table 2-7, the majority of districts in 2016-2017 offered all day, every day kindergarten.
School districts in Iowa are required by Iowa Administrative Code (IAC) 279.60 to administer a valid and reliable universal screening instrument, as prescribed by the Iowa Department of Education (Department) to every kindergarten student enrolled in the district no later than October 1. The Department integrated this legislative change with the IAC 279.68 regarding early literacy. The Department provides a list of approved assessments that can be used to implement the requirements of IAC 279.68; however, a district may administer an assessment that is not on the list as long as it addresses technical adequacy. In the fall of 2016, as shown in Table 2-8, the majority of buildings used the earlyReading Composite from the Formative Assessment System for Teachers (i.e., FAST) assessment suite. The percentage of buildings using FAST as a universal screening of early literacy skills in kindergarten has continued to increase annually. The FAST earlyReading Composite provides an estimate of broad early literacy skills during the fall screening window, typically within the first six weeks of school. FAST assessments during the fall of kindergarten include Concepts of Print (requires learner to distinguish among familiar literacy cues related to print such as directionality, letter or word order), Letter Names (requires the learner to expressively name visually presented upper and lower case letters), Onset Sounds (requires learner to identify sounds found at the beginning of words), and Letter Sounds (requires the learner to provide sounds for visually presented upper and lowercase letters).
Table 2-9 displays the number and percent of public school kindergarten students by each type of kinder-garten literacy assessment taken during the fall of 2016-2017.
Table 2-10 lists the number and percent of students identified as at or above benchmark by assessment during the fall 2016-2017 screening window. Note the percentage of students at or above benchmark is likely to be somewhat different during the winter and spring windows as the screening demands and students’ skills each increase. The percent of students at or above benchmark, categorized by fall screen-ing tool, ranged from 41.7 percent to 84.5 percent.
Table 2-7
Iowa Public School Kindergarten Program Type 2016-2017
Source: Iowa Department of Education, Bureau of Information and Analysis, Student Reporting in Iowa and Spring BEDS Files.
Enrollment Category
Number of Districts Number of Districts Offering All Day Every Day Kindergarten
Percent of Districts Offering All Day Every Day Kindergarten
<300 38 37 97.4%300-599 103 101 98.1%600-999 82 80 97.6%
1,000-2,499 77 73 94.8%2,500-7,499 22 21 95.5%
7,500+ 11 11 100.0%State 333 323 97.0%
The Annual Condition of Education Report 201722

Table 2-8
Number and Percent of Iowa Public School Buildings by Kindergarten Literacy Assessment Administered 2016-2017
Source: Iowa Department of Education, Bureau of Information and Analysis, Student Reporting in Iowa files.Note: Districts may offer more than one kind of assessment tool; percentages do not total 100 percent.
Table 2-9
Number and Percent of Iowa Public School Kindergarten Students by Kindergarten Literacy Assessment Taken 2016-2017
Source: Iowa Department of Education, Bureau of School Improvement, Iowa TIER Data System.Note: Data are based on the school-selected default assessment administered.
Table 2-10
Number and Percent of Public School Kindergarten Students Proficient by Kindergarten Literacy Assessment Taken, 2016-2017
Assessment Number of Students Number Proficient Percent ProficientAIMS Web Letter
Names393 274 69.72%
AIMS Web Letter Sounds
206 174 84.47%
FAST Kindergarten Composite
36,788 24,886 67.65%
STAR Early Literacy 180 75 41.67%Total Students 37,567 25,409 67.64%
Source: Iowa Department of Education, Bureau of School Improvement, Iowa TIER Data System.Note: Data are based on the school-selected default assessment administered.
Assessment Number PercentAIMS Web Letter Names 8 1.25%AIMS Web Letter Sounds 1 0.16%
FAST Kindergarten Composite 628 98.43%STAR Early Literacy 1 0.16%
Total Buildings with Assessment Data 638
Assessment Number PercentAIMS Web Letter Names 393 1.05% 0.99%AIMS Web Letter Sounds 206 0.55% 0.67%
FAST Kindergarten Composite 36,788 97.93% 97.21%STAR Early Literacy 180 0.48% 0.96%
Total Students Assessed 37,567 0.16%
The Annual Condition of Education Report 201723

Preschool Attendance (Parent Report)Information on kindergarten students who attended preschool prior to kindergarten is reported by dis-tricts through Student Reporting in Iowa in the fall. Districts gather information on preschool experience through parent report or district records. Some districts report this indicator based on the number of kindergarten students who participated in the SWVPP and have a state identification number prior to kindergarten entry. The term “preschool” has not been specifically defined in legislation and thus could result in different meanings ranging from SWVPP, childcare, or a private enterprise. Table 2-11 shows the number and percent of kindergarten students who were reported as having attended preschool prior to kindergarten. The percentage of children reported to participate in preschool prior to kindergarten increased from 2015-2016 to 2016-2017.
Table 2-11
Iowa Public School Kindergarten Students Preschool Attendance (Parent Report), 2015-2016 to 2016-2017
2015-2016 2016-2017Number Percent Number Percent
Kindergarten Students Who Attended Preschool
26,145 66.6% 30,659 80.3%
Kindergarten Students Who did not Attend Preschool
13,092 33.4% 7,537 19.7%
Total Kindergarten Students 39,237 100.0% 38,196 100.0%Source: Iowa Department of Education, Bureau of Information and Analysis, Student Reporting in Iowa files.
The Annual Condition of Education Report 201724

StaffThis chapter presents information on licensed and non-licensed staff in Iowa’s schools and area education agencies (AEAs). Data on characteristics such as age, race/ethnicity, gender, experience, and salary for teachers, principals, superintendents, professional school counselors, and library/media specialists are included in this chapter. Information on instructional aides, pupil-teacher ratios, and nurses for public schools is also included. The data are summarized at the state level, by enrollment category (based on district certified enrollment) and by AEA. National and regional state comparative data are also presented where available. Some information is broken out by public and nonpublic schools.
An unlimited number of positions/assignments can be reported for each staff member. Some staff mem-bers are reported as serving in multiple positions. For example, a professional school counselor may also be a principal or a teacher. Salary is not reported separately for each position/assignment combination. Therefore, salary reported for staff may be impacted by additional duties. In 2008-2009, data on shared staff were collected on the Fall Basic Educational Data Survey (BEDS). Beginning in 2008-2009, shared staff members were reported in each district they served. However, the district that held the contract was the only district to report salary for the staff. The district that did not hold the contract for shared staff did not report any salary. In 2008-2009 and 2009-2010, the district that held the contract was also the only district to report the staff as full-time if they held a full-time contract. The district that did not hold the contract for shared staff reported the shared staff as having a part-time contract in 2008-2009 and 2009-2010. Beginning in 2010-2011, full-time equivalencies (FTE) were collected for each position. The district that held the contract reported the entire FTE for shared staff. The district that was purchasing services only reported FTE for their district. In all figures presented in this chapter, staff members are reported only once in the district that held the contract.
In previous years, information on licensed staff in Iowa was collected from schools through the Licensed Staff Detail report on BEDS. The data that were collected included age, gender, race/ethnicity, salary, contract days, contract type, degrees, majors, positions, and the assignments that go along with each position. Beginning in 2010-2011, a new web application was used to collect this same data on licensed and non-licensed staff in Iowa.
Full-time teachers in 2010-2011 to 2016-2017 were defined as staff with at least one teaching position code (including teacher leaders), a full-time equivalency for licensed positions of 0.8 or higher, and at least 180 contract days. Full-time teachers in 2016-2017 had base salary (salary paid for regular posi-tion responsibilities, including salary paid from teacher leadership grant funds and excluding professional development) of at least $33,500. There were about 12,000 teachers in 2016-2017 that were reported as serving in other positions, such as administrative (e.g., principal, superintendent) or student support services (e.g., coach, counselor, teacher leader). Salary is not reported separately for each position/as-signment combination. Therefore, salary reported for these teachers may be impacted by the additional duties. In each section, minority counts include staff with a reported ethnicity of Hispanic and/or reported race of American Indian/Alaskan Native, African American, Asian, Pacific Islander or multiple races. Teach-ers and principals with advanced degrees include staff with a master’s, specialist, or doctorate degree.
Salary information collected through Fall BEDS included base salary, salary paid from teacher leadership grant funds, salary paid for professional development, and extra duty pay. The portion of salary that is paid for regular position responsibilities is called regular salary. Extra duty salary includes salary paid for extra duties such as yearbook sponsorship and coaching. Total salary is the sum of the regular salary and extra duty pay.
The Annual Condition of Education Report 201725

TeachersThis section includes data on public and nonpublic teachers and teacher leaders in Iowa. In 2016-2017, 3.9 percent of teachers were beginning teachers—teachers in their first year of teaching (Tables 3-2 and 3-3). The percent of teachers with advanced degrees and the percent of minority teachers was highest in the larger enrollment categories (Table 3-4). Heartland AEA 11 had the largest percent of teachers in the state in 2016-2017, 26.9 percent (Table 3-5). About 75 percent of the full-time teachers in public schools in Iowa were female in 2016-2017. The salary for male teachers was 4.1 percent higher than female teachers, while the percent of teachers with advanced degrees was higher for females than males (Table 3-6). The percent of teachers that were minorities in 2016-2017 was 2.4 percent. The average salary of non-minority teachers was about 2 percent higher than the average salary of minority teachers. The average experience and percent of female teachers was also higher for non-minority teachers than minority teachers (Table 3-7).
Staff in Iowa public schools are eligible to receive full retirement benefits through the Iowa Public Em-ployee Retirement System (IPERS) if they are at least 55 years old and the sum of their age and total IPERS covered employment is equal to or greater than 88. According to this rule, 5.9 percent of teachers was eligible to retire in 2016-2017 (Table 3-9).
In 2016-2017, average total salary for full-time public school teachers was 4.6 percent higher than average regular salary (Table 3-10). The average total salary of full-time public school teachers increased by 2.7 percent between 2015-2016 and 2016-2017. Average total salary was lowest in the smallest enrollment category and highest in the largest enrollment category (Table 3-11). When averaged by AEA, the average total salary was highest for teachers in Grant Wood AEA 10. The National Education Association reports average salaries of teachers in the United States in the Rankings of the States and Estimates of School Statistics report. In 2015-2016, Iowa ranked 22nd in the nation and 5th among Midwest States for average salary (Table 3-13).
In 2016-2017, the average number of assignments held by grades 9-12 teachers was 2.6. Over half (59.43 percent) of grades 9-12 teachers had one or two assignments (Tables 3-16 and 3-17). Pupil-teacher ratios from 2004-2005 to the present include special education teachers and students. Prior to this year, special education teachers and students were excluded. The pupil-teacher ratio in 2016-2017 was 13.9. The pupil-teacher ratio by enrollment category ranged from 10.6 in the smallest enrollment category to 14.7 in the 2,500-7,499 enrollment category (Table 3-18). The number of instructional aides (non-licensed staff who provide assistance to teachers in the classroom) increased by 5.8 percent between 2015-2016 and 2016-2017 (Table 3-19).
The Annual Condition of Education Report 201726
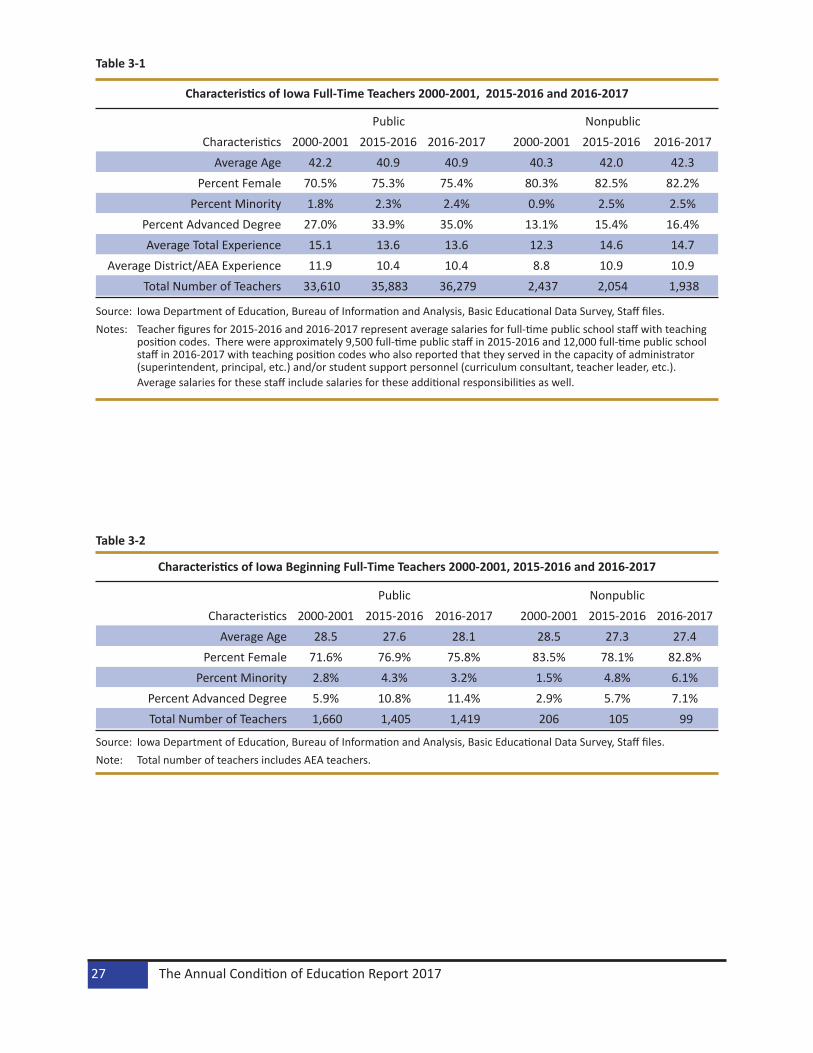
Table 3-1
Characteristics of Iowa Full-Time Teachers 2000-2001, 2015-2016 and 2016-2017
Source: Iowa Department of Education, Bureau of Information and Analysis, Basic Educational Data Survey, Staff files.Notes: Teacher figures for 2015-2016 and 2016-2017 represent average salaries for full-time public school staff with teaching
position codes. There were approximately 9,500 full-time public staff in 2015-2016 and 12,000 full-time public school staff in 2016-2017 with teaching position codes who also reported that they served in the capacity of administrator (superintendent, principal, etc.) and/or student support personnel (curriculum consultant, teacher leader, etc.).
Average salaries for these staff include salaries for these additional responsibilities as well.
Table 3-2
Characteristics of Iowa Beginning Full-Time Teachers 2000-2001, 2015-2016 and 2016-2017
Source: Iowa Department of Education, Bureau of Information and Analysis, Basic Educational Data Survey, Staff files.Note: Total number of teachers includes AEA teachers.
Public NonpublicCharacteristics 2000-2001 2015-2016 2016-2017 2000-2001 2015-2016 2016-2017
Average Age 42.2 40.9 40.9 40.3 42.0 42.3Percent Female 70.5% 75.3% 75.4% 80.3% 82.5% 82.2%
Percent Minority 1.8% 2.3% 2.4% 0.9% 2.5% 2.5%Percent Advanced Degree 27.0% 33.9% 35.0% 13.1% 15.4% 16.4%Average Total Experience 15.1 13.6 13.6 12.3 14.6 14.7
Average District/AEA Experience 11.9 10.4 10.4 8.8 10.9 10.9 Total Number of Teachers 33,610 35,883 36,279 2,437 2,054 1,938
Public NonpublicCharacteristics 2000-2001 2015-2016 2016-2017 2000-2001 2015-2016 2016-2017
Average Age 28.5 27.6 28.1 28.5 27.3 27.4Percent Female 71.6% 76.9% 75.8% 83.5% 78.1% 82.8%
Percent Minority 2.8% 4.3% 3.2% 1.5% 4.8% 6.1%Percent Advanced Degree 5.9% 10.8% 11.4% 2.9% 5.7% 7.1%Total Number of Teachers 1,660 1,405 1,419 206 105 99
The Annual Condition of Education Report 201727

Table 3-3
Iowa Full-Time Beginning Teachers as a Percentage of Total Full-Time Public School Teachers 2000-2001, 2015-2016 and 2016-2017
Source: Iowa Department of Education, Bureau of Information and Analysis, Basic Educational Data Survey, Staff files.Note: F-T indicates full-time.
Table 3-4
Characteristics of Iowa Full-Time Public School Teachers by Enrollment Category, 2016-2017
Source: Iowa Department of Education, Bureau of Information and Analysis, Basic Educational Data Survey, Staff files.
Number of Beginning F-T Teachers
Number of F-T Teachers Beginning F-T Teachers as % of Total F-T Teachers
Enrollment Category
2000-2001
2015-2016
2016-2017
2000-2001
2015-2016
2016-2017
2000-2001
2015-2016
2016-2017
<300 42 36 30 642 704 682 6.5% 5.1% 4.4%300-599 281 136 184 3,970 3,834 3,978 7.1% 3.5% 4.6%600-999 270 172 189 5,553 4,877 4,808 4.9% 3.5% 3.9%
1,000-2,499 358 280 343 8,532 8,585 8,776 4.2% 3.3% 3.9%2,500-7,499 306 268 259 6,096 6,723 6,861 5.0% 4.0% 3.8%
7,500+ 382 509 412 8,393 10,865 10,915 4.6% 4.7% 3.8%AEA 21 4 2 424 295 259 5.0% 1.4% 0.8%
State 1,660 1,405 1,419 33,610 35,883 36,279 4.9% 3.9% 3.9%
Enrollment Category
Number of Full-Time Teachers
Average Age
Percent Female
Percent Minority
Percent Advanced
Degree
Average Total Experience
Average District/AEA Experience
<300 682 41.4 79.6% 2.1% 13.6% 13.2 10.0300-599 3,978 41.5 72.8% 1.2% 18.5% 14.1 10.9600-999 4,808 41.0 73.6% 1.3% 21.2% 14.1 10.7
1,000-2,499 8,776 41.2 74.7% 1.6% 32.4% 14.3 10.72,500-7,499 6,861 40.4 76.4% 2.2% 42.9% 13.1 9.9
7,500+ 10,915 40.5 76.5% 4.0% 45.0% 12.7 10.0AEA 259 46.3 91.1% 2.7% 54.1% 18.1 12.1
State 36,279 40.9 75.4% 2.4% 35.0% 13.5 10.3
The Annual Condition of Education Report 201728

Table 3-5
Characteristics of Iowa Full-Time Public School Teachers by AEA, 2016-2017
Source: Iowa Department of Education, Bureau of Information and Analysis, Basic Educational Data Survey, Staff files.Note: Includes AEA teachers.
Table 3-6
Gender Comparison of Iowa Full-Time Public School Teachers, 2016-2017
Source: Iowa Department of Education, Bureau of Information and Analysis, Basic Educational Data Survey, Staff files.Note: Includes AEA teachers.
AEA Number of Teachers
Percent of Total
Teachers
Average Age
Percent Female
Percent Minority
Percent Advanced
Degree
Average Total
Experience
Average District/AEA Experience
Keystone 2,231 6.1% 41.1 75.0% 1.1% 40.0% 14.1 12.0AEA 267 4,889 13.5% 40.9 74.7% 2.6% 27.5% 13.4 10.3
Prairie Lakes 2,331 6.4% 41.6 75.2% 1.3% 22.5% 14.5 10.7Mississippi Bend 3,591 9.9% 40.8 75.7% 4.0% 32.2% 13.2 10.3
Grant Wood 4,950 13.6% 40.5 74.5% 2.6% 45.1% 13.4 10.2Heartland 9,773 26.9% 39.9 75.8% 2.5% 39.5% 12.9 9.4
Northwest 2,902 8.0% 41.9 75.0% 2.5% 36.5% 14.7 11.6Green Hills 2,942 8.1% 41.7 75.9% 1.6% 27.4% 13.9 10.2
Great Prairie 2,670 7.4% 42.4 77.5% 1.5% 30.2% 14.0 11.3State 36,279 100.0% 40.9 75.4% 2.4% 33.0% 13.5 10.3
Characteristics Female MaleAverage Age 40.9 41.0
Percent Minority 2.3% 2.7%Percent Advanced Degree 35.4% 33.7%Average Total Experience 13.4 13.9
Average District/AEA Experience 10.3 10.4Average Total Salary $57,705 $60,073Number of Teachers 27,367 8,912
The Annual Condition of Education Report 201729

Table 3-7
Characteristics of Iowa Full-Time Public School Teachers by Minority and Non-Minority Groups, 2016-2017
Source: Iowa Department of Education, Bureau of Information and Analysis, Basic Educational Data Survey, Staff files.Note: Includes AEA teachers.
Table 3-8
Iowa Full-Time Public School Teacher Age Distributions, 2000-2001 and 2016-2017
Source: Iowa Department of Education, Bureau of Information and Analysis, Basic Educational Data Survey, Staff files.Note: Includes AEA teachers.
Characteristics Non-Minority MinorityAverage Age 40.9 40.6
Percent Female 75.5% 71.7%Percent Advanced Degree 35.0% 34.5%Average Total Experience 13.6 11.1
Average District/AEA Experience 10.4 8.5Average Total Salary $58,319 $56,981Number of Teachers 35,420 859
2000-2001 2016-2017Age Interval Number Cumulative
TotalPercent Cumulative
PercentNumber Cumulative
TotalPercent Cumulative
Percent25 and Under 2,369 2,369 7.0% 7.0% 2,890 2,890 8.0% 8.0%
26-30 4,123 6,492 12.3% 19.3% 5,136 8,026 14.2% 22.1%31-35 3,730 10,222 11.1% 30.4% 5,343 13,369 14.7% 36.9%36-40 3,745 13,967 11.1% 41.6% 5,134 18,503 14.2% 51.0%41-45 4,370 18,337 13.0% 54.6% 4,736 23,239 13.1% 64.1%46-50 6,497 24,834 19.3% 73.9% 4,581 27,820 12.6% 76.7%51-55 5,838 30,672 17.4% 91.3% 4,204 32,024 11.6% 88.3%56-60 2,373 33,045 7.1% 98.3% 2,959 34,983 8.2% 96.4%61-65 510 33,555 1.5% 99.8% 1,125 36,108 3.1% 99.5%
Over 65 55 33,610 0.2% 100.0% 171 36,279 0.5% 100.0%
The Annual Condition of Education Report 201730

Figure 3-1
Iowa Full-Time Public School Teacher Age Distributions, 2000-2001 and 2016-2017
-
1,000
2,000
3,000
4,000
5,000
6,000
7,000
25 andUnder
26-30 31-35 36-40 41-45 46-50 51-55 56-60 61-65 Over 65
Num
ber o
f Tea
cher
s
2000-2001
2016-2017
Age
Source: IowaDepartmentofEducation,BureauofInformationandAnalysis,BasicEducationalDataSurvey,Stafffiles.Note: IncludesAEAteachers.
Table 3-9
Combined Age and Experience Distribution of Iowa Full-Time Public School Teachers, 2000-2001 and 2016-2017
Source: IowaDepartmentofEducation,BureauofInformationandAnalysis,BasicEducationalDataSurvey,Stafffiles.Note: IncludesAEAteachers.
2000-2001 2016-2017CombinedAgeandExperienceInterval
Number CumulativeTotal
Percent CumulativePercent
Number CumulativeTotal
Percent CumulativePercent
30 and Under 3,936 3,936 11.7% 11.7% 4,620 4,620 12.7% 12.7%31-40 4,711 8,647 14.0% 25.7% 6,232 10,852 17.2% 29.9%41-50 4,512 13,159 13.4% 39.2% 6,103 16,955 16.8% 46.7%51-60 4,739 17,898 14.1% 53.3% 5,497 22,452 15.2% 61.9%61-70 5,274 23,172 15.7% 68.9% 5,230 27,682 14.4% 76.3%71-80 5,839 29,011 17.4% 86.3% 4,158 31,840 11.5% 87.8%81-87 2,958 31,969 8.8% 95.1% 2,315 34,155 6.4% 94.1%
88+ 1,641 33,610 4.9% 100.0% 2,124 36,279 5.9% 100.0%
The Annual Condition of Education Report 201731

Figure 3-2
Combined Age and Experience Distribution of Iowa Full-Time Public School Teachers, 2000-2001 and 2016-2017
-
1,000
2,000
3,000
4,000
5,000
6,000
7,000
30 and Under 31-40 41-50 51-60 61-70 71-80 81-87 88+
Num
ber o
f Tea
cher
s
2000-2001
2016-2017
Combined Age And Experience
Source: Iowa Department of Education, Bureau of Information and Analysis, Basic Educational Data Survey, Staff files.Note: Includes AEA teachers.
Table 3-10
Full-Time Teacher Average Regular Salary vs. Full-Time Teacher Average Total Salary 2000-2001, 2015-2016 and 2016-2017
Source: Iowa Department of Education, Bureau of Information and Analysis, Basic Educational Data Survey, Staff files.Notes: Includes AEA teachers. Teacher figures for 2015-2016 and 2016-2017 represent average salaries for full-time public school staff with teaching
position codes. There were approximately 9,500 full-time public staff in 2015-2016 and 12,000 full-time public school staff in 2016-2017 with teaching position codes who also reported that they served in the capacity of administrator (superintendent, principal, etc.) and/or student support personnel (curriculum consultant, teacher leader, etc.).
Average salaries for these staff include salaries for these additional responsibilities as well.
2000-2001 2015-2016 2016-2017Average Regular Salary N/A $54,446 $55,703
Average Total Salary $36,479 $56,766 $58,287Difference N/A $2,320 $2,584
Percent Total Salary Greater Than Regular Salary N/A 4.3% 4.6%
The Annual Condition of Education Report 201732

Table 3-11
Average Total Salaries of Iowa Full-Time Public School Teachers by Enrollment Category2000-2001, 2015-2016 and 2016-2017
Source: Iowa Department of Education, Bureau of Information and Analysis, Basic Educational Data Survey, Staff files.Notes: Includes AEA teachers. Teacher figures for 2015-2016 and 2016-2017 represent average salaries for full-time public school staff with teaching
position codes. There were approximately 9,500 full-time public staff in 2015-2016 and 12,000 full-time public school staff in 2016-2017 with teaching position codes who also reported that they served in the capacity of administrator (superintendent, principal, etc.) and/or student support personnel (curriculum consultant, teacher leader, etc.).
Average salaries for these staff include salaries for these additional responsibilities as well.
Table 3-12
Average Salaries of Iowa Full-Time Public School Teachers by AEA, 2016-2017
Source: Iowa Department of Education, Bureau of Information and Analysis, Basic Educational Data Survey, Staff files.Notes: Includes AEA teachers.
Teacher figures for 2016-2017 represent average salaries for full-time public school staff with teaching position codes. There were approximately 12,000 full-time public school staff in 2016-2017 with teaching position codes who also reported that they served in the capacity of administrator (superintendent, principal, etc.) and/or student support personnel (curriculum consultant, teacher leader, etc.).
Average total salaries for these staff include salaries for these additional responsibilities as well.
Average Total Salary Percent Salary ChangeEnrollment Category 2000-2001 2015-2016 2016-2017 2000-2001 to
2016-20172015-2016 to
2016-2017<300 $28,811 $45,342 $47,313 64.2% 4.3%
300-599 $31,557 $49,771 $51,272 62.5% 3.0%600-999 $33,809 $52,331 $53,953 59.6% 3.1%
1,000-2,499 $35,912 $55,895 $57,624 60.5% 3.1%2,500-7,499 $38,266 $60,113 $60,629 58.4% 0.9%
7,500+ $40,452 $60,395 $62,314 54.0% 3.2%AEA $36,196 $63,641 $66,128 82.7% 3.9%
State $36,479 $56,766 $58,287 59.8% 2.7%
AEA Regular Salary Total SalaryKeystone $52,648 $55,221AEA 267 $54,134 $56,431
Prairie Lakes $52,624 $55,010Mississippi Bend $54,517 $57,357
Grant Wood $59,545 $63,338Heartland $57,176 $59,366
Northwest $57,136 $59,704Green Hills $53,558 $56,087
Great Prairie $53,707 $55,931State $55,703 $58,287
The Annual Condition of Education Report 201733
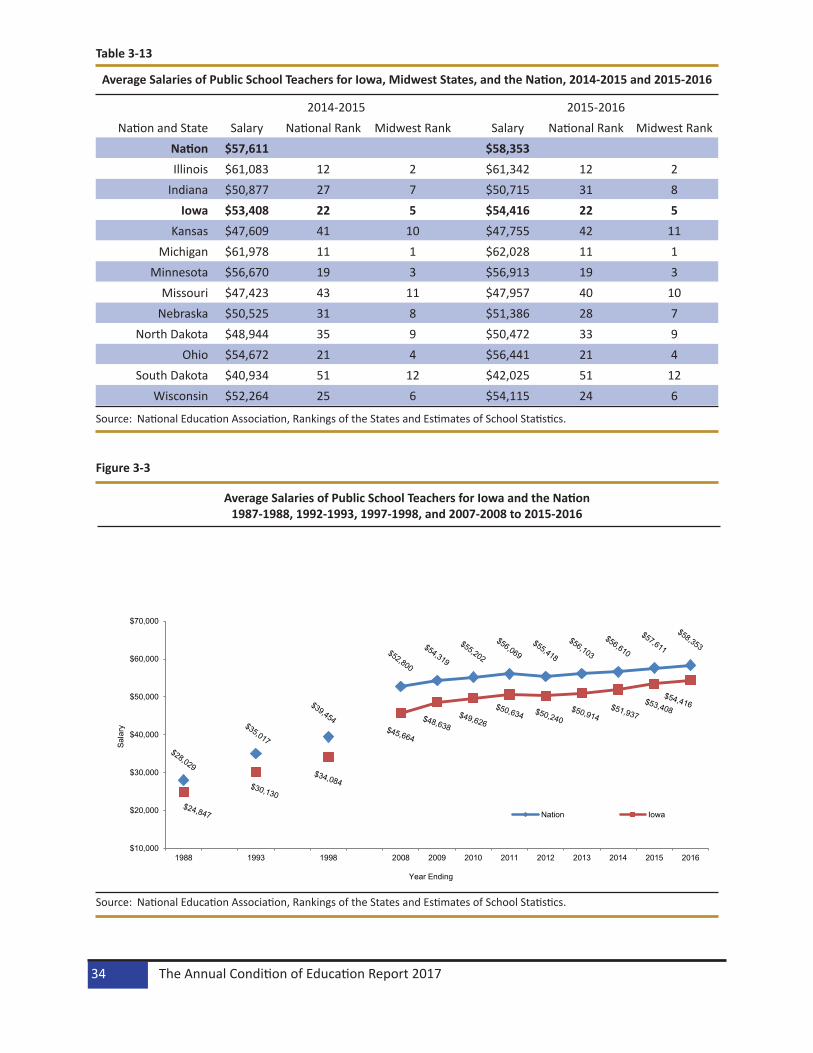
Table 3-13
Average Salaries of Public School Teachers for Iowa, Midwest States, and the Nation, 2014-2015 and 2015-2016
Source: National Education Association, Rankings of the States and Estimates of School Statistics.
Figure 3-3
Average Salaries of Public School Teachers for Iowa and the Nation 1987-1988, 1992-1993, 1997-1998, and 2007-2008 to 2015-2016
$10,000
$20,000
$30,000
$40,000
$50,000
$60,000
$70,000
1988 1993 1998 2008 2009 2010 2011 2012 2013 2014 2015 2016
Sala
ry
Year Ending
Nation Iowa
Source: National Education Association, Rankings of the States and Estimates of School Statistics.
2014-2015 2015-2016Nation and State Salary National Rank Midwest Rank Salary National Rank Midwest Rank
Nation $57,611 $58,353Illinois $61,083 12 2 $61,342 12 2
Indiana $50,877 27 7 $50,715 31 8Iowa $53,408 22 5 $54,416 22 5
Kansas $47,609 41 10 $47,755 42 11Michigan $61,978 11 1 $62,028 11 1
Minnesota $56,670 19 3 $56,913 19 3Missouri $47,423 43 11 $47,957 40 10
Nebraska $50,525 31 8 $51,386 28 7North Dakota $48,944 35 9 $50,472 33 9
Ohio $54,672 21 4 $56,441 21 4South Dakota $40,934 51 12 $42,025 51 12
Wisconsin $52,264 25 6 $54,115 24 6
The Annual Condition of Education Report 201734

Table 3-14
Iowa Salary Comparisons by Occupation, 2015 and 2016
Source: U.S. Bureau of Labor Statistics, State Occupational Employment and Wage Estimates, Iowa, May 2015 and May 2016.Note: Teacher average salaries are average regular salaries based on Iowa Department of Education, Basic Educational Data
Survey, Staff files.
Table 3-15
Distribution of Contract Days for Full-Time Public School Teachers, 2000-2001, 2015-2016 and 2016-2017
Source: Iowa Department of Education, Bureau of Information and Analysis, Basic Educational Data Survey, Staff files.Note: Includes AEA teachers.
Average SalaryOccupation 2015 2016 Percent Change 2015 to 2016
Electrical Engineer $82,880 $87,620 5.7%Civil Engineer $77,630 $79,370 2.2%
Software Developer, Applications $83,010 $85,950 3.5%Computer Programmer $70,560 $69,670 -1.3%
Accountant & Auditor $62,910 $65,470 4.1%Speech-Language Pathologist $72,180 $72,170 0.0%
Registered Nurse $55,040 $56,290 2.3%Teacher $53,408 $54,416 1.9%
Child,Family and School Social Worker $43,140 $41,980 -2.7%Interior Designer $39,860 $40,280 1.1%
Number Percent Cumulative PercentNumber of
Contract Days2000-2001
2015-2016
2016-2017
2000-2001
2015-2016
2016-2017
2000-2001
2015-2016
2016-2017
<=185 2,089 2,449 2,301 6.2% 6.8% 6.3% 6.2% 6.8% 6.3%186-190 16,449 12,573 11,655 49.0% 35.0% 32.1% 55.2% 41.9% 38.5%191-195 13,136 14,995 14,973 39.1% 41.8% 41.3% 94.3% 83.7% 79.7%
>=196 1,932 5,866 7,350 5.8% 16.3% 20.3% 100.0% 100.0% 100.0%
The Annual Condition of Education Report 201735

Table 3-16
Average Number of Assignments for Iowa Full-Time Public School Teachers in Grades 9-12 by Enrollment Category, 2000-2001, 2015-2016 and 2016-2017
Source: Iowa Department of Education, Bureau of Information and Analysis, Basic Educational Data Survey, Staff files.Note: Only includes grades 9-12 teaching assignments for 2015-2016 and 2016-2017 for a teacher that has at least one 9-12
assignment.
Table 3-17
Distribution of Assignments for Full-Time Public School Teachers in Grades 9-12, 2016-2017
Source: Iowa Department of Education, Bureau of Information and Analysis, Basic Educational Data Survey, Staff files.Note: Only includes grades 9-12 teaching assignments for a teacher that has at least one 9-12 assignment.
2000-2001 2015-2016 2016-2017Enrollment
CategoryNumber
of Districts
Number of Grade
9-12 Teachers
Average Number of
Assignments
Number of
Districts
Number of Grade
9-12 Teachers
Average Number of
Assignments
Number of
Districts
Number of Grade
9-12 Teachers
Average Number of
Assignments
<300 38 279 3.9 40 269 3.3 38 260 3.4300-599 116 2,084 3.4 101 1,714 3.1 103 1,819 3.1600-999 104 2,587 3.1 85 1,934 2.9 82 1,956 2.9
1,000-2,499 83 3,335 2.7 77 2,971 2.5 77 2,940 2.72,500-7,499 24 2,052 2.2 22 1,980 2.3 22 2,001 2.3
7,500+ 9 2,480 2.1 11 3,344 2.1 11 3,614 2.2State 374 12,817 2.7 336 12,212 2.5 333 12,590 2.6
Number of Unique Assignments
Number of Teachers Percent Cumulative Percent
1 4,769 37.88% 37.88%2 2,713 21.55% 59.43%3 1,882 14.95% 74.38%4 1,382 10.98% 85.35%5 857 6.81% 92.16%6 499 3.96% 96.12%7 261 2.07% 98.20%8 117 0.93% 99.13%9 83 0.66% 99.79%
10 18 0.14% 99.93%11 5 0.04% 99.97%12 2 0.02% 99.98%13 1 0.01% 99.99%14 1 0.01% 100.00%
The Annual Condition of Education Report 201736

Figure 3-4
Iowa Public School K-12 Pupil-Teacher Ratios, 2000-2001 to 2016-2017
15.814.9 15.3 15.2
13.5 13.8 13.8 13.7 13.7 13.7 14.2 14.1 14.1 14.1 14.0 14.1 13.9
0
2
4
6
8
10
12
14
16
18
20
2001 2002 2003 2004 2005 2006 2007 2008 2009 2010 2011 2012 2013 2014 2015 2016 2017
Pup
il -T
each
er R
atio
Year Ending
Source: Iowa Department of Education, Bureau of Information and Analysis, Basic Educational Data Survey, Staff files.Notes: Beginning in 2004-2005, all students were reported at a grade level. Students that may have been listed as ungraded in
the past are now included in a grade level. Pupil-teacher ratios include special education students and teachers from 2004-2005 forward.
Figure 3-5
K-12 Pupil-Teacher Ratios for Iowa Public Schools by Enrollment Category, 2015-2016 and 2016-2017
10.6
12.8 13
.5 14.1 14
.9
14.5
14.1
10.6
12.7 13
.3 14.1 14
.7
14.2
13.9
0
2
4
6
8
10
12
14
16
18
20
<300 300-599 600-999 1,000-2,499 2,500-7,499 7,500+ State
Pup
il -T
each
er R
atio
Enrollment Category
2015-2016 2016-2017
Source: Iowa Department of Education, Bureau of Information and Analysis, Basic Educational Data Survey, Staff files.
The Annual Condition of Education Report 201737

Table 3-18
K-12 Pupil-Teacher Ratios for Iowa Public Schools by Enrollment Category, 2016-2017
Source: Iowa Department of Education, Bureau of Information and Analysis, Basic Educational Data Survey, Staff files.Notes: Beginning in 2004-2005, all students were reported at a grade level. Students that may have been listed as ungraded in the past are now included in a grade level. Pupil-teacher ratios include special education students and teachers from
2004-2005 forward.
Table 3-19
Instructional Aides in Iowa Public Schools by Enrollment Category, 2000-2001, 2015-2016 and 2016-2017
Source: Iowa Department of Education, Bureau of Information and Analysis, Basic Educational Data Survey, Staff files.Note: Figures may not total due to rounding.
Enrollment Category Number of Students Number of FTE Teachers Ratio<300 7,208 681.8 10.6
300-599 49,071 3,868.2 12.7600-999 61,911 4,644.3 13.3
1,000-2,499 117,916 8,392.6 14.12,500-7,499 96,145 6,554.8 14.7
7,500+ 149,337 10,500.5 14.2State 481,588 34,642.0 13.9
Number of Full-Time Equivalent (FTE) Aides
Enrollment Category
2000-2001
2015-2016
2016-2017
% Change in FTE Aides 2000-2001 to 2016-2017
% Change in FTE Aides 2015-2016 to 2016-2017
<300 113.4 255.2 275.3 142.8% 7.9%300-599 685.9 1,334.6 1,434.7 109.2% 7.5%600-999 1,054.0 1,735.5 1,784.0 69.3% 2.8%
1,000-2,499 2,023.3 3,126.1 3,277.9 62.0% 4.9%2,500-7,499 1,681.6 1,928.2 2,230.7 32.7% 15.7%
7,500+ 2,204.5 3,232.2 3,283.6 48.9% 1.6%State 7,762.7 11,611.9 12,286.2 58.3% 5.8%
The Annual Condition of Education Report 201738
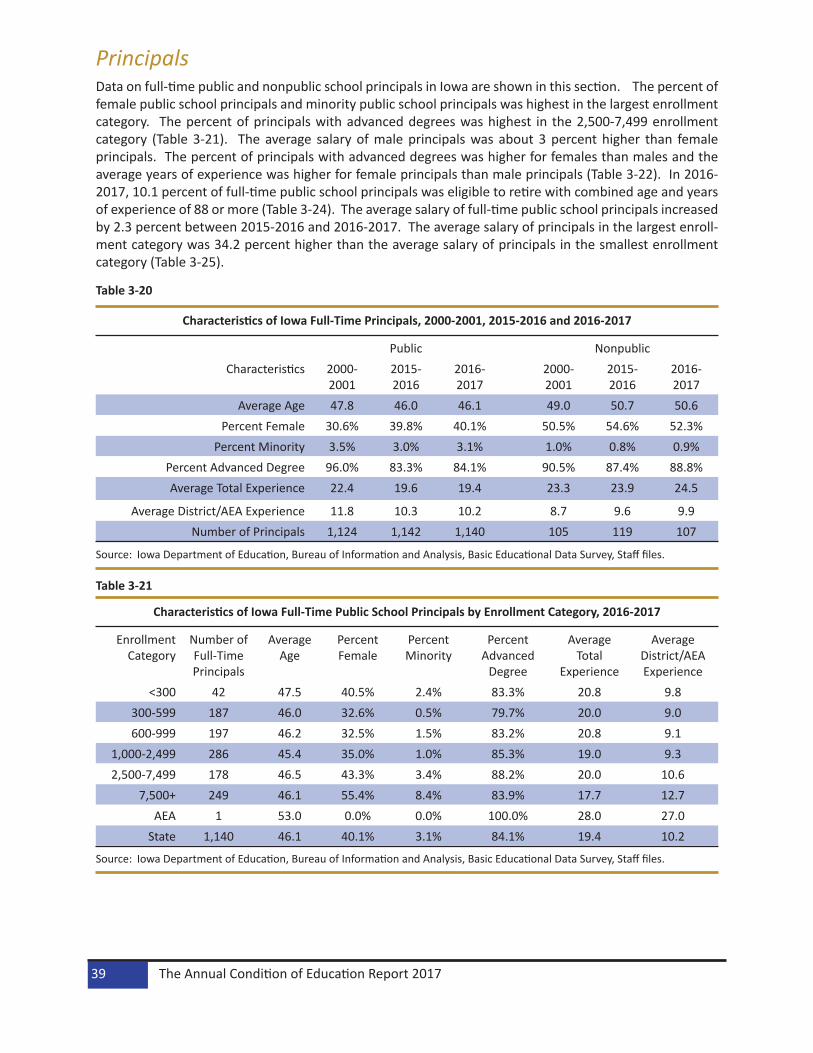
PrincipalsData on full-time public and nonpublic school principals in Iowa are shown in this section. The percent of female public school principals and minority public school principals was highest in the largest enrollment category. The percent of principals with advanced degrees was highest in the 2,500-7,499 enrollment category (Table 3-21). The average salary of male principals was about 3 percent higher than female principals. The percent of principals with advanced degrees was higher for females than males and the average years of experience was higher for female principals than male principals (Table 3-22). In 2016-2017, 10.1 percent of full-time public school principals was eligible to retire with combined age and years of experience of 88 or more (Table 3-24). The average salary of full-time public school principals increased by 2.3 percent between 2015-2016 and 2016-2017. The average salary of principals in the largest enroll-ment category was 34.2 percent higher than the average salary of principals in the smallest enrollment category (Table 3-25).
Table 3-20
Characteristics of Iowa Full-Time Principals, 2000-2001, 2015-2016 and 2016-2017
Source: Iowa Department of Education, Bureau of Information and Analysis, Basic Educational Data Survey, Staff files.
Table 3-21
Characteristics of Iowa Full-Time Public School Principals by Enrollment Category, 2016-2017
Source: Iowa Department of Education, Bureau of Information and Analysis, Basic Educational Data Survey, Staff files.
Public NonpublicCharacteristics 2000-
20012015-2016
2016-2017
2000-2001
2015-2016
2016-2017
Average Age 47.8 46.0 46.1 49.0 50.7 50.6Percent Female 30.6% 39.8% 40.1% 50.5% 54.6% 52.3%
Percent Minority 3.5% 3.0% 3.1% 1.0% 0.8% 0.9%Percent Advanced Degree 96.0% 83.3% 84.1% 90.5% 87.4% 88.8%Average Total Experience 22.4 19.6 19.4 23.3 23.9 24.5
Average District/AEA Experience 11.8 10.3 10.2 8.7 9.6 9.9Number of Principals 1,124 1,142 1,140 105 119 107
Enrollment Category
Number of Full-Time Principals
Average Age
Percent Female
Percent Minority
Percent Advanced
Degree
Average Total
Experience
Average District/AEA Experience
<300 42 47.5 40.5% 2.4% 83.3% 20.8 9.8300-599 187 46.0 32.6% 0.5% 79.7% 20.0 9.0600-999 197 46.2 32.5% 1.5% 83.2% 20.8 9.1
1,000-2,499 286 45.4 35.0% 1.0% 85.3% 19.0 9.32,500-7,499 178 46.5 43.3% 3.4% 88.2% 20.0 10.6
7,500+ 249 46.1 55.4% 8.4% 83.9% 17.7 12.7AEA 1 53.0 0.0% 0.0% 100.0% 28.0 27.0
State 1,140 46.1 40.1% 3.1% 84.1% 19.4 10.2
The Annual Condition of Education Report 201739

Table 3-22
Gender Comparison of Iowa Full-Time Public School Principals, 2016-2017
Source: Iowa Department of Education, Bureau of Information and Analysis, Basic Educational Data Survey, Staff files.
Table 3-23
Iowa Full-Time Public School Principal Age Distributions, 2000-2001 and 2016-2017
Source: Iowa Department of Education, Bureau of Information and Analysis, Basic Educational Data Survey, Staff files.Note: Includes AEA principals.
Characteristics Female MaleAverage Age 47.1 45.4
Percent Minority 4.2% 2.3%Percent Advanced Degree 86.0% 82.9%Average Total Experience 19.9 19.1
Average District/AEA Experience 11.9 9.0Average Total Salary $100,437 $103,478
Number of Principals 457 683
2000-2001 2016-2017Age
IntervalNumber Cumulative
TotalPercent Cumulative
PercentNumber Cumulative
TotalPercent Cumulative
Percent25 and Under
1 1 0.1% 0.1% 0 0 0.0% 0.0%
26-30 17 18 1.5% 1.6% 19 19 1.7% 1.7%31-35 77 95 6.9% 8.5% 111 130 9.7% 11.4%36-40 112 207 10.0% 18.4% 209 339 18.3% 29.7%41-45 176 383 15.7% 34.1% 209 548 18.3% 48.1%46-50 274 657 24.4% 58.5% 233 781 20.4% 68.5%51-55 298 955 26.5% 85.0% 192 973 16.8% 85.4%56-60 143 1,098 12.7% 97.7% 112 1,085 9.8% 95.2%61-65 24 1,122 2.1% 99.8% 45 1,130 3.9% 99.1%
Over 65 2 1,124 0.2% 100.0% 10 1,140 0.9% 100.0%
The Annual Condition of Education Report 201740

Figure 3-6
Iowa Full-Time Public School Principal Age Distributions, 2000-2001 and 2016-2017
0
50
100
150
200
250
300
350
25 andUnder
26-30 31-35 36-40 41-45 46-50 51-55 56-60 61-65 Over 65
Num
ber o
f Prin
cipa
ls
2000-2001
2016-2017
Age
Source: Iowa Department of Education, Bureau of Information and Analysis, Basic Educational Data Survey, Staff files.
Table 3-24
Combined Age and Experience Distribution of Iowa Full-Time Public School Principals, 2000-2001 and 2016-2017
Source: Iowa Department of Education, Bureau of Information and Analysis, Basic Educational Data Survey, Staff files.
2000-2001 2016-2017Combined Age and Experience Interval
Number Cumulative Total
Percent Cumulative Percent
Number Cumulative Total
Percent Cumulative Percent
30 and Under 3 3 0.3% 0.3% 1 1 0.1% 0.1%31-40 42 45 3.7% 4.0% 63 64 5.5% 5.6%41-50 100 145 8.9% 12.8% 172 236 15.1% 20.7%51-60 145 290 12.9% 25.6% 234 470 20.5% 41.2%61-70 237 527 21.1% 46.5% 224 694 19.6% 60.9%71-80 303 830 27.0% 73.2% 212 906 18.6% 79.5%81-87 158 988 14.1% 87.1% 119 1,025 10.4% 89.9%
88+ 136 1,124 12.1% 99.1% 115 1,140 10.1% 100.0%
The Annual Condition of Education Report 201741

Figure 3-7
Combined Age and Experience Distribution of Iowa Full-Time Public School Principals, 2000-2001 and 2016-2017
0
50
100
150
200
250
300
350
30 and Under 31-40 41-50 51-60 61-70 71-80 81-87 88+
Num
ber o
f Prin
cipa
ls
2000-2001
2016-2017
Combined Age and Experience
Source: Iowa Department of Education, Bureau of Information and Analysis, Basic Educational Data Survey, Staff files.Note: Includes AEA principals.
Table 3-25
Average Total Salary of Iowa Full-Time Public School Principals by Enrollment Category 2000-2001, 2015-2016 and 2016-2017
Source: Iowa Department of Education, Bureau of Information and Analysis, Basic Educational Data Survey, Staff files.Note: Includes AEA principals.
Average Total Salary Percent Salary ChangeEnrollment
Category2000-2001
2015-2016
2016-2017
Number of Principals 2016-2017
2000-2001 to 2016-2017
2015-2016 to 2016-2017
<300 $51,775 $84,153 $86,007 42 66.1% 2.2%300-599 $54,331 $90,224 $91,979 187 69.3% 1.9%600-999 $58,539 $92,812 $95,470 197 63.1% 2.9%
1,000-2,499 $64,381 $98,913 $100,729 286 56.5% 1.8%2,500-7,499 $69,145 $106,743 $108,309 178 56.6% 1.5%
7,500+ $71,935 $112,180 $115,420 249 60.5% 2.9%AEA $69,796 $123,667 $127,916 1 83.3% 3.4%
State $63,409 $99,924 $102,259 1,140 61.3% 2.3%
The Annual Condition of Education Report 201742

SuperintendentsThe tables in this section present data on full-time superintendents in Iowa public schools. The percent of superintendents with specialist/doctorate degrees decreased between 2015-2016 and 2016-2017. The percent of female superintendents decreased (Table 3-26). The percent of female superintendents was highest in the largest enrollment category in 2016-2017. The percent of superintendents with specialist/doctorate degrees was highest in the largest and smallest enrollment categories (Table 3-27). The aver-age salary of female superintendents was 1.8 percent higher than male superintendents. The percent of superintendents with specialist/doctorate degrees was higher for females than males (Table 3-28). The percent of superintendents with combined age and experience of 88 years or more and therefore eligible to retire in 2016-2017 was 22.3 percent (Table 3-30). The average salary of superintendents increased by 4.0 percent between 2015-2016 and 2016-2017 (Table 3-31).
Table 3-26
Characteristics of Iowa Full-Time Public School Superintendents, 2000-2001, 2015-2016 and 2016-2017
Source: Iowa Department of Education, Bureau of Information and Analysis, Basic Educational Data Survey, Staff files.Note: Every district is required to have a superintendent. There are a number of smaller districts that share superintendents.
Table 3-27
Characteristics of Iowa Full-Time Public School Superintendents by Enrollment Category, 2016-2017
Source: Iowa Department of Education, Bureau of Information and Analysis, Basic Educational Data Survey, Staff files.Note: The one superintendent at the AEA is AEA staff that is also serving as a superintendent in a public district.
Characteristics 2000-2001 2015-2016 2016-2017Average Age 52.1 51.4 51.0
Percent Female 5.8% 13.1% 12.1%Percent Minority 0.9% 1.1% 1.1%
Percent Specialist/Doctorate Degree 59.2% 58.7% 56.0%Average Total Experience 26.9 24.0 23.7
Average District Experience 8.0 7.5 7.6Number of Superintendents 326 283 273
Enrollment Category
Number of Full-Time
Superintendents
Average Age
Percent Female
Percent Minority
Percent Specialist/Doctorate Degree
Average Total
Experience
Average District
Experience<300 14 51.4 14.3% 0.0% 78.6% 23.3 10.6
300-599 77 49.7 6.5% 0.0% 50.6% 24.4 7.6600-999 71 50.9 9.9% 1.4% 53.5% 25.0 7.7
1,000-2,499 77 52.0 18.2% 2.6% 58.4% 23.7 6.82,500-7,499 22 50.4 9.1% 0.0% 45.5% 19.8 6.9
7,500+ 11 54.1 27.3% 0.0% 81.8% 19.8 9.4AEA 1 51.0 0.0% 0.0% 100.0% 27.0 6.0
State 273 51.4 12.1% 1.1% 56.0% 23.7 7.6
The Annual Condition of Education Report 201743

Table 3-28
Gender Comparison of Iowa Full-Time Public School Superintendents, 2016-2017
Source: Iowa Department of Education, Bureau of Information and Analysis, Basic Educational Data Survey, Staff files.Note: Includes AEA staff that also serve as superintendents in public districts.
Table 3-29
Iowa Full-Time Public School Superintendents Age Distribution, 2000-2001 and 2016-2017
Source: Iowa Department of Education, Bureau of Information and Analysis, Basic Educational Data Survey, Staff files.Note: Every district is required to have a superintendent. There are a number of smaller districts that share superintendents.
Characteristics Female MaleAverage Age 51.9 50.9
Percent Minority 0.0% 1.3%Percent Specialist/ Doctorate Degree
66.7% 54.6%
Average Total Experience 24.4 23.6Average District Experience 8.6 7.4
Average Total Salary $150,107 $147,512Number of Superintendents 33 240
2000-2001 2016-2017Age
IntervalNumber Cumulative
TotalPercent Cumulative
PercentNumber Cumulative
TotalPercent Cumulative
Percent31-35 0 0 0.0% 0.0% 5 5 1.8% 1.8%36-40 18 18 5.5% 5.5% 15 20 5.5% 7.3%41-45 31 49 9.5% 15.0% 43 63 15.8% 23.1%46-50 71 120 21.8% 36.8% 69 132 25.3% 48.4%51-55 105 225 32.2% 69.0% 69 201 25.3% 73.6%56-60 76 301 23.3% 92.3% 39 240 14.3% 87.9%61-65 20 321 6.1% 98.5% 27 267 9.9% 97.8%
Over 65 5 326 1.5% 100.0% 6 273 2.2% 100.0%
The Annual Condition of Education Report 201744

Figure 3-8
Iowa Full-Time Public School Superintendents Age Distribution, 2000-2001 and 2016-2017
0
20
40
60
80
100
120
31-35 36-40 41-45 46-50 51-55 56-60 61-65 Over 65
Num
ber o
f Sup
erin
tend
ents
2000-2001
2016-2017
Age
Source: Iowa Department of Education, Bureau of Information and Analysis, Basic Educational Data Survey, Staff files.Note: Every district is required to have a superintendent. There are a number of smaller districts that share superintendents.
Table 3-30
Combined Age and Experience Distribution of Iowa Full-Time Public School Superintendents 2000-2001 and 2016-2017
Source: Iowa Department of Education, Bureau of Information and Analysis, Basic Educational Data Survey, Staff files.Note: Every district is required to have a superintendent. There are a number of smaller districts that share superintendents.
2000-2001 2016-2017Combined Age and Experience Interval
Number Cumulative Total
Percent Cumulative Percent
Number Cumulative Total
Percent Cumulative Percent
<=50 4 4 1.2% 1.2% 14 14 5.1% 5.1%51-60 26 30 8.0% 9.2% 42 56 15.4% 20.5%61-70 53 83 16.3% 25.5% 61 117 22.3% 42.9%71-80 89 172 27.3% 52.8% 58 175 21.2% 64.1%81-87 67 239 20.6% 73.3% 37 212 13.6% 77.7%
88+ 87 326 26.7% 100.0% 61 273 22.3% 100.0%
The Annual Condition of Education Report 201745

Figure 3-9
Combined Age and Experience Distribution of Iowa Full-Time Public School Superintendents 2000-2001 and 2016-2017
0
10
20
30
40
50
60
70
80
90
100
<=50 51-60 61-70 71-80 81-87 88+
Num
ber o
f Sup
erin
tend
ents
2000-2001
2016-2017
Combined Age and Experience
Source: Iowa Department of Education, Bureau of Information and Analysis, Basic Educational Data Survey, Staff files.Note: Every district is required to have a superintendent. There are a number of smaller districts that share superintendents.
Table 3-31
Average Total Salary of Iowa Full-Time Public School Superintendents by Enrollment Category 2000-2001, 2015-2016 and 2016-2017
Source: Iowa Department of Education, Bureau of Information and Analysis, Basic Educational Data Survey, Staff files. Notes: Every district is required to have a superintendent. There are a number of smaller districts that share superintendents. The one superintendent at the AEA is AEA staff that is also serving as a superintendent in a public district.
Average Total Salary Number of Superintendents
2016-2017
Percent Salary ChangeEnrollment
Category2000-2001 2015-2016 2016-2017 2000-2001 to
2016-20172015-2016 to
2016-2017<300 $63,569 $104,896 $116,721 14 83.6% 11.3%
300-599 $71,049 $125,328 $129,142 77 81.8% 3.0%600-999 $76,935 $134,250 $138,247 71 79.7% 3.0%
1,000-2,499 $85,772 $150,836 $158,859 77 85.2% 5.3%2,500-7,499 $104,464 $186,303 $187,738 22 79.7% 0.8%
7,500+ $125,036 $219,037 $216,176 11 72.9% -1.3%AEA $168,209 $222,377 1 32.2%
State $79,836 $142,127 $147,825 273 85.2% 4.0%
The Annual Condition of Education Report 201746

Teacher, Principal, and Superintendent Salary ComparisonThe average salary of superintendents had a higher percentage increase than the average salary of teach-ers and principals from 2000-2001 to 2005-2006 and in 2009-2010 to 2016-2017. The average salary of teachers had a higher percentage increase than the average salary of principals and superintendents from 2006-2007 to 2008-2009. In 2016-2017, principals had the lowest percentage increase in average salary (Figure 3-10 and Table 3-32).
Figure 3-10
Annual Percentage Increases in Average Salaries for Iowa Full-Time Public School Teachers, Principals, and Superintendents 2000-2001 vs. 2001-2002 and 2004-2005 vs. 2005-2006 to 2015-2016 vs. 2016-2017
5.5%
4.2%
3.9% 4.
1%
5.1%
3.4%
2.9%
2.9%
3.4%
4.5%
5.0%
2.6%
4.0%
4.5%
3.8%
4.2%
3.7%
3.6%
2.8%
2.0%
1.8%
2.6%
2.6%
4.2%
2.1% 2.
3%
4.8%
4.1%
4.9%
5.8%
6.5%
2.1%
1.1%
0.9%
1.8%
2.4% 2.
7%
2.0%
2.9%
0%
1%
2%
3%
4%
5%
6%
7%
00-01 vs.01-02
04-05 vs.05-06
05-06 vs.06-07
06-07 vs.07-08
07-08 vs.08-09
08-09 vs.09-10
09-10 vs.10-11
10-11 vs.11-12
11-12 vs.12-13
12-13 vs.13-14
13-14 vs.14-15
14-15 vs.15-16
15-16 vs.16-17
Per
cent
Year
Superintendents Principals Teachers
Source: Iowa Department of Education, Bureau of Information and Analysis, Basic Educational Data Survey, Staff files.
The Annual Condition of Education Report 201747
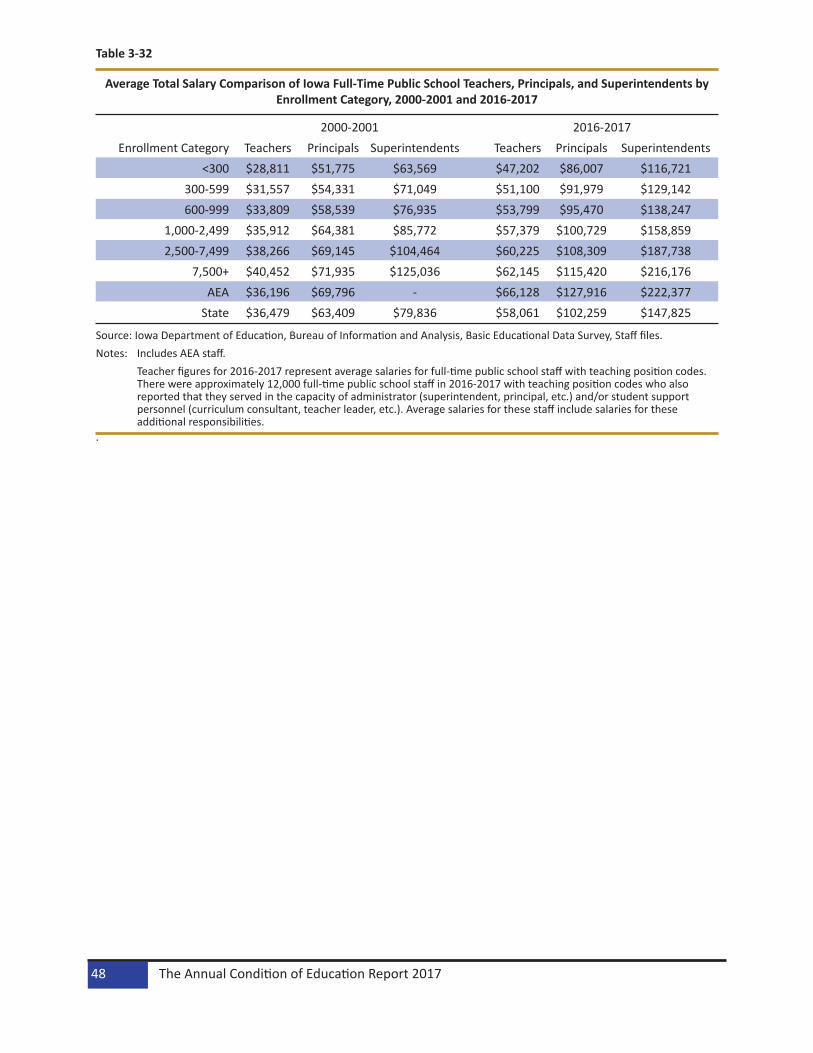
Table 3-32
Average Total Salary Comparison of Iowa Full-Time Public School Teachers, Principals, and Superintendents by Enrollment Category, 2000-2001 and 2016-2017
Source: Iowa Department of Education, Bureau of Information and Analysis, Basic Educational Data Survey, Staff files.Notes: Includes AEA staff. Teacher figures for 2016-2017 represent average salaries for full-time public school staff with teaching position codes.
There were approximately 12,000 full-time public school staff in 2016-2017 with teaching position codes who also reported that they served in the capacity of administrator (superintendent, principal, etc.) and/or student support personnel (curriculum consultant, teacher leader, etc.). Average salaries for these staff include salaries for these additional responsibilities.
.
2000-2001 2016-2017Enrollment Category Teachers Principals Superintendents Teachers Principals Superintendents
<300 $28,811 $51,775 $63,569 $47,202 $86,007 $116,721300-599 $31,557 $54,331 $71,049 $51,100 $91,979 $129,142600-999 $33,809 $58,539 $76,935 $53,799 $95,470 $138,247
1,000-2,499 $35,912 $64,381 $85,772 $57,379 $100,729 $158,8592,500-7,499 $38,266 $69,145 $104,464 $60,225 $108,309 $187,738
7,500+ $40,452 $71,935 $125,036 $62,145 $115,420 $216,176AEA $36,196 $69,796 - $66,128 $127,916 $222,377
State $36,479 $63,409 $79,836 $58,061 $102,259 $147,825
The Annual Condition of Education Report 201748

Public School Professional School CounselorsThe percent of female professional school counselors, the percent of minority professional school counselors, and the percent of professional school counselors with advanced degrees increased slightly between 2015-2016 and 2016-2017 (Table 3-33). All districts are required by Iowa Code (256.11) to have a professional school counselor who is licensed by the Board of Educational Examiners. Districts are able to share professional school counselors with another district. The percent of professional school counselors eligible to retire with combined age and years experience of 88 or more was 9.4 percent in 2016-2017 (Table 3-36). The average salary of professional school counselors increased by 1.4 percent between 2015-2016 and 2016-2017 (Table 3-37).
Table 3-33
Characteristics of Iowa Full-Time Public School Professional School Counselors 2000-2001, 2015-2016 and 2016-2017
Source: Iowa Department of Education, Bureau of Information and Analysis, Basic Educational Data Survey, Staff files.Notes: Does not include AEA staff. Guidance Counselor will be called Professional School Counselor from 2014-2015 and on.
Table 3-34
Full-Time and Part-Time Iowa Public School Professional School Counselors by Enrollment Category 2000-2001, 2015-2016 and 2016-2017
Source: Iowa Department of Education, Bureau of Information and Analysis, Basic Educational Data Survey, Staff files.Notes: Does not include AEA staff. Guidance Counselor will be called Professional School Counselor from 2014-2015 and on.
Characteristics 2000-2001 2015-2016 2016-2017Average Age 46.4 42.9 42.8
Percent Female 64.2% 79.3% 79.4%Percent Minority 1.6% 3.1% 3.6%
Percent Advanced Degree 86.9% 83.6% 84.3%Average Total Experience 18.8 15.0 14.8
Average District Experience 12.1 10.1 10.0Number of Guidance Counselors 1,194 1,221 1,240
Number of Districts Full-Time Part-TimeEnrollment
Category2000-2001
2015-2016
2016-2017
2000-2001
2015-2016
2016-2017
2000-2001
2015-2016
2016-2017
<300 38 40 38 13 17 16 5 13 14300-599 116 101 103 129 142 144 15 7 11600-999 104 85 82 189 162 164 14 6 7
1,000-2,499 83 77 77 310 291 292 8 11 92,500-7,499 24 22 22 247 242 245 8 6 7
7,500+ 9 11 11 306 367 379 15 8 8State 374 336 333 1,194 1,221 1,240 65 51 56
The Annual Condition of Education Report 201749

Table 3-35
Iowa Full-Time Public School Professional School Counselor Age Distributions, 2000-2001 and 2016-2017
Source: Iowa Department of Education, Bureau of Information and Analysis, Basic Educational Data Survey, Staff files. Notes: Does not include AEA staff. Guidance Counselor will be called Professional School Counselor from 2014-2015 and on.
Figure 3-11
Iowa Full-Time Public School Professional School Counselor Age Distributions, 2000-2001 and 2016-2017
0
50
100
150
200
250
300
25 andUnder
26-30 31-35 36-40 41-45 46-50 51-55 56-60 61-65 Over 65
Num
ber o
f Gui
danc
e C
ouns
elor
s
Age
2000-2001
2016-2017
Source: Iowa Department of Education, Bureau of Information and Analysis, Basic Educational Data Survey, Staff files.Notes: Does not include AEA staff. Guidance Counselor will be called Professional School Counselor from 2014-2015 and on.
2000-2001 2016-2017Age
IntervalNumber Cumulative
TotalPercent Cumulative
PercentNumber Cumulative
TotalPercent Cumulative
Percent25 and Under
4 4 0.3% 0.3% 25 25 2.0% 2.0%
26-30 80 84 6.7% 7.0% 143 168 11.5% 13.5%
31-35 96 180 8.0% 15.1% 199 367 16.0% 29.6%36-40 136 316 11.4% 26.5% 196 563 15.8% 45.4%41-45 145 461 12.1% 38.6% 180 743 14.5% 59.9%46-50 280 741 23.5% 62.1% 179 922 14.4% 74.4%51-55 283 1,024 23.7% 85.8% 136 1,058 11.0% 85.3%56-60 135 1,159 11.3% 97.1% 116 1,174 9.4% 94.7%61-65 29 1,188 2.4% 99.5% 53 1,227 4.3% 99.0%
Over 65 6 1,194 0.5% 100.0% 13 1,242 1.0% 100.0%
The Annual Condition of Education Report 201750

Table 3-36
Combined Age and Experience Distribution of Iowa Full-Time Public School Professional School Counselors 2000-2001 and 2016-2017
Source: Iowa Department of Education, Bureau of Information and Analysis, Basic Educational Data Survey, Staff files.Notes: Does not include AEA staff. Guidance Counselor will be called Professional School Counselor from 2014-2015 and on.
Figure 3-12
Combined Age and Experience Distribution of Iowa Full-Time Public School Professional School Counselors 2000-2001 and 2016-2017
0
50
100
150
200
250
300
30 andUnder
31-40 41-50 51-60 61-70 71-80 81-87 88+
Num
ber o
f Gui
danc
e C
ouns
elor
s
Combined Age and Experience
2000-2001
2016-2017
Source: Iowa Department of Education, Bureau of Information and Analysis, Basic Educational Data Survey, Staff files.Note: Does not include AEA staff. Guidance Counselor will be called Professional School Counselor from 2014-2015 and on.
2000-2001 2016-2017Combined Age and Experience Interval
Number Cumulative Total
Percent Cumulative Percent
Number Cumulative Total
Percent Cumulative Percent
30 and Under 25 25 2.1% 2.1% 91 91 7.3% 7.3%31-40 108 133 9.0% 11.1% 222 313 17.9% 25.2%41-50 135 268 11.3% 22.4% 206 519 16.6% 41.9%51-60 206 474 17.3% 39.7% 201 720 16.2% 58.1%61-70 209 683 17.5% 57.2% 169 889 13.6% 71.7%71-80 240 923 20.1% 77.3% 149 1,038 12.0% 83.7%81-87 159 1,082 13.3% 90.6% 86 1,124 6.9% 90.6%
88+ 112 1,194 9.4% 100.0% 116 1,240 9.4% 100.0%
The Annual Condition of Education Report 201751

Table 3-37
Average Total Salary of Iowa Full-Time Public School Professional School Counselors by Enrollment Category 2000-2001, 2015-2016 and 2016-2017
Source: Iowa Department of Education, Bureau of Information and Analysis, Basic Educational Data Survey, Staff files.Notes: Does not include AEA staff. Guidance Counselor will be called Professional School Counselor from 2014-2015 and on.
Average Total Salary Percent Salary ChangeEnrollment Category 2000-2001 2015-2016 2016-2017 2000-2001 to
2016-20172015-2016 to
2016-2017<300 $33,912 $51,832 $50,020 47.5% -3.5%
300-599 $35,907 $52,871 $53,809 49.9% 1.8%600-999 $37,702 $56,417 $57,616 52.8% 2.1%
1,000-2,499 $41,062 $61,672 $62,939 53.3% 2.1%2,500-7,499 $44,628 $65,449 $65,386 46.5% -0.1%
7,500+ $46,886 $65,571 $66,649 42.2% 1.6%State $42,126 $61,735 $62,625 48.7% 1.4%
The Annual Condition of Education Report 201752

Public School Library/Media StaffLibrary/media staff members who are licensed through the Board of Educational Examiners have the position title of teacher librarian/media specialists. Districts are required by Iowa Code (256.11) to have a licensed library/media specialist. Districts are able to share library/media specialists with another dis-trict. There was an increase in the percent of library/media specialists with advanced degrees between 2015-2016 and 2016-2017 (Table 3-38). The number of full-time library/media specialists decreased in 2016-2017 (Table 3-39). The average salary of library/media specialists increased by 3.2 percent between 2015-2016 and 2016-2017 (Table 3-40). Library/media associates are staff members that support the library/media specialists in the library/media center. The number of library/media associates decreased by 1.5 percent between 2015-2016 and 2016-2017 (Table 3-41).
Table 3-38
Characteristics of Iowa Full-Time Public School Licensed Library/Media Specialists 2000-2001, 2015-2016 and 2016-2017
Source: Iowa Department of Education, Bureau of Information and Analysis, Basic Educational Data Survey, Staff files.Note: Does not include AEA staff.
Table 3-39
Full-Time and Part-Time Iowa Public School Licensed Library/Media Specialists by Enrollment Category 2000-2001, 2015-2016 and 2016-2017
Source: Iowa Department of Education, Bureau of Information and Analysis, Basic Educational Data Survey, Staff files.Note: Does not include AEA staff.
Characteristics 2000-2001 2015-2016 2016-2017Average Age 48.5 47.3 46.9
Percent Female 90.6% 95.3% 95.3%Percent Minority 0.8% 0.7% 1.0%
Percent Advanced Degree 59.6% 64.0% 67.5%Average Total Experience 19.6 17.8 17.5
Average District Experience 14.3 12.3 12.4Number of Library/Media Specialists 636 425 406
Number of Districts Full-Time Part-TimeEnrollment
Category2000-2001
2015-2016
2016-2017
2000-2001
2015-2016
2016-2017
2000-2001
2015-2016
2016-2017
<300 38 40 38 8 12 10 11 9 14300-599 116 101 103 82 46 45 20 35 35600-999 104 85 82 107 58 50 8 17 21
1,000-2,499 83 77 77 174 99 95 9 9 122,500-7,499 24 22 22 134 95 96 3 1 1
7,500+ 9 11 11 131 115 110 7 8 9State 374 336 333 636 425 406 58 79 92
The Annual Condition of Education Report 201753

Table 3-40
Average Total Salary of Iowa Full-Time Public School Licensed Library/Media Specialists by Enrollment Category 2000-2001, 2015-2016 and 2016-2017
Source: Iowa Department of Education, Bureau of Information and Analysis, Basic Educational Data Survey, Staff files.Note: Does not include AEA staff.
Table 3-41
Iowa Public School Library/Media Associates by Enrollment Category, 2000-2001, 2015-2016 and 2016-2017
Source: Iowa Department of Education, Bureau of Information and Analysis, Basic Educational Data Survey, Staff files.Notes: Does not include AEA staff.
Figures may not total due to rounding.
Average Total Salary Percent Salary ChangeEnrollment Category 2000-2001 2015-2016 2016-2017 2000-2001 to
2016-20172015-2016 to
2016-2017<300 $28,997 $47,030 $50,436 73.9% 7.2%
300-599 $33,415 $53,620 $54,596 63.4% 1.8%600-999 $35,926 $54,192 $57,008 58.7% 5.2%
1,000-2,499 $39,377 $61,195 $63,160 60.4% 3.2%2,500-7,499 $42,276 $66,496 $67,747 60.2% 1.9%
7,500+ $45,636 $70,452 $72,249 58.3% 2.6%State $39,797 $62,709 $64,687 62.5% 3.2%
Number of Full-Time Equivalent (FTE) Associates
Enrollment Category 2000-2001 2015-2016 2016-2017 % Change in FTE Associates 2000-2001 to
2016-2017
% Change in FTE Associates 2015-2016 to
2016-2017<300 26.3 8.6 6.8 -74.1% -20.9%
300-599 143.9 55.2 55.5 -61.5% 0.5%600-999 204.2 89.9 86.5 -57.6% -3.8%
1,000-2,499 284.1 134.2 134.9 -52.5% 0.5%2,500-7,499 246.8 44.6 47.4 -80.8% 6.4%
7,500+ 180.1 103.2 98.1 -45.5% -4.9%State 1,085.4 435.6 429.2 -60.5% -1.5%
The Annual Condition of Education Report 201754

Area Education Agency (AEA) Licensed StaffThere were nine area education agencies (AEAs) in Iowa in 2016-2017. The personnel in AEAs develop and provide programs, services, leadership in school improvement, professional development, emerg-ing educational practices, school-community planning, curriculum, special education, school technol-ogy, and media services to school districts in the state. As seen in Table 3-42, the percent of female AEA staff has increased slightly and the percent of minority AEA staff increased slightly between 2015-2016 and 2016-2017. The average salary of AEA staff increased by 2.6 percent between 2015-2016 and 2016-2017. Almost half of the AEA staff in 2016-2017 held a Special Education Support position (Table 3-43).
Table 3-42
Characteristics of Iowa Full-Time Licensed AEA Staff 2000-2001, 2015-2016 and 2016-2017
Characteristics 2000-2001 2015-2016 2016-2017Average Age 44.8 45.1 44.8
Percent Female 77.3% 90.3% 90.8%Percent Minority 1.0% 2.2% 2.6%
Percent Advanced Degree 79.4% 87.4% 88.8%Average Total Experience 17.2 17.9 17.8
Average Number of Contract Days 197.3 195.8 195.7Average Total Salary $44,351 $71,993 $73,860Number of AEA Staff 2,225 2,225 2,185
Source: Iowa Department of Education, Bureau of Information and Analysis, Basic Educational Data Survey, Staff files.
The Annual Condition of Education Report 201755

Table 3-43
Number of Full-Time AEA Licensed Staff by Position, 2016-2017
Source: Iowa Department of Education, Bureau of Information and Analysis, Basic Educational Data Survey, Staff files.Notes: This total may not match the total staff in Table 3-42 because that one person could have more than one position. The
superintendent at the AEA is AEA staff that is also serving as superintendent in a public district.
Position Number PercentAEA Chief Administrator 9 0.4%
AEA Zone/Regional Coordinator 74 3.4%Content/Curriculum Consultant 223 10.2%Coordinator/Department Head 35 1.6%
Counselor 2 0.1%Early Childhood Special Education 91 4.1%
Home Intervention Teacher 23 1.0%Hospital/Homebound Teacher - 0.0%
Itinerant Teacher 58 2.6%Non-Administrative SAM - 0.0%
Nurse (SPR on file with BOEE) 6 0.3%Other Administrator 13 0.6%
Principal 1 0.0%Regular Education Teacher 17 0.8%
School Business Official 8 0.4%Social Worker 114 5.2%
Special Education Support 1,090 49.7%Special Education Consultant 293 13.4%
Special Education Director 8 0.4%Special Education Teacher 71 3.2%
Specialist 38 1.7%Superintendent 1 0.0%
Supervisor 8 0.4%Teacher Librarian/Media Specialist 4 0.2%
Total 2,187 99.7%
The Annual Condition of Education Report 201756

Licensed Staff State TotalsTable 3-44 shows the distribution of public and nonpublic school licensed staff by AEA in 2016-2017. AEA 267 and Heartland AEA had the highest percent of districts. Heartland AEA had the highest percent of public school and nonpublic school licensed staff. Mississippi Bend AEA had the lowest percent of districts. Keystone AEA had the lowest percent of public school licensed staff and Green Hills AEA had the lowest percent of nonpublic school licensed staff.
Table 3-44
Distribution of Iowa Public and Nonpublic School Total Full-Time Licensed Staff by AEA, 2016-2017
Source: Iowa Department of Education, Bureau of Information and Analysis, Basic Educational Data Survey, Staff files.Notes: AEA full-time licensed staff are included.
Figures may not total due to rounding.
Districts Public School Licensed Staff Nonpublic School Licensed StaffAEA Number Percent Number Percent Number Percent
Keystone 23 6.9% 2,583 6.2% 359 16.7%
AEA 267 53 15.9% 5,653 13.5% 244 11.4%
Prairie Lakes 40 12.0% 2,687 6.4% 173 8.1%Mississippi Bend 21 6.3% 4,198 10.0% 210 9.8%
Grant Wood 32 9.6% 5,714 13.6% 270 12.6%Heartland 53 15.9% 11,428 27.2% 464 21.6%
Northwest 35 10.5% 3,299 7.9% 274 12.8%Green Hills 43 12.9% 3,355 8.0% 67 3.1%
Great Prairie 33 9.9% 3,078 7.3% 83 3.9%State 333 100.0% 41,995 100.0% 2,144 100.0%
The Annual Condition of Education Report 201757

Public School Nurses
Iowa Code (256.11) requires each school district to have a nurse that is licensed by the Board of Nursing. Some districts share a nurse with another district or contract out for nurses. Registered Nurses are licensed by the Board of Nursing, have a baccalaureate degree, have a statement of professional recognition (SPR) issued by the Board of Educational Examiners (BOEE), and are reported as licensed staff on the Fall BEDS staff collection. Registered Nurses that are licensed by the Board of Nursing have an associate degree or diploma, may practice in a school district, but they do not qualify for a school nurse SPR. These nurses are reported as non-licensed staff on the Fall BEDS staff collection. The nurse full-time equivalent (FTE) counts listed in Table 3-45 include nurses with a SPR and nurses without a SPR.
Table 3-45
Iowa Public School Nurse FTE by Enrollment Category, 2015-2016 and 2016-2017
Source: Iowa Department of Education, Bureau of Information and Analysis, Basic Educational Data Survey, Staff files.Notes: Does not include AEA staff. Every district is required to have a nurse. Some districts may share with another district.
Does not include nurses contracted with an outside agency such as a hospital, clinic or county health department. Figures may not total due to rounding.
Enrollment Category 2015-2016 2016-2017 % Change in FTE Nurses 2015-2016 to 2016-2017<300 10.8 12.8 18.5%
300-599 73.9 74.9 1.4%600-999 88.1 84.4 -4.2%
1,000-2,499 147.2 147.0 -0.1%2,500-7,499 119.2 126.4 6.1%
7,500+ 157.8 158.0 0.1%State 596.9 603.4 1.1%
The Annual Condition of Education Report 201758

ProgramThe program chapter provides information regarding the school district organizational structure, curricu-lum data regarding courses offered and taught, class size for kindergarten through third grade, technology expenditures, and availability of computers.
Districts and SchoolsThe number of public school districts in Iowa has declined over time. The percent of districts without a public high school has increased since 2002-2003 with the exception of 2005-2006 and 2014-2015 (Table 4-1). In 2000-2001, about two-thirds of Iowa districts had two or more elementary and middle/junior high schools. In 2015-2016 and 2016-2017, about two-thirds of the school districts had a single elementary, middle, and high school (Table 4-2).
Table 4-1
Number of Iowa Public School Districts and Number of Districts Without a Public High School 2000-2001 to 2016-2017
Source: Iowa Department of Education, Bureau of Information and Analysis, Basic Educational Data Survey, address files.
Year Number of Public School Districts
Number of Districts Without a Public High School
Percent of Districts Without a Public High School
2000-2001 374 23 6.1%2001-2002 371 21 5.7%2002-2003 371 24 6.5%2003-2004 370 24 6.5%2004-2005 367 26 7.1%2005-2006 365 25 6.8%2006-2007 365 25 6.8%2007-2008 364 29 8.0%2008-2009 362 30 8.3%2009-2010 361 31 8.6%2010-2011 359 31 8.6%2011-2012 351 31 8.8%2012-2013 348 32 9.2%2013-2014 346 32 9.2%2014-2015 338 26 7.7%2015-2016 336 26 7.7%2016-2017 333 27 8.1%
The Annual Condition of Education Report 201759

Table 4-2
Iowa Public School Districts, Public School Buildings, and Nonpublic School Information 2000-2001, 2015-2016 and 2016-2017
Source: Iowa Department of Education, Bureau of Information and Analysis, Basic Educational Data Survey, address files.
Carnegie Unit TaughtIowa Administrative Code 12.5 (14) defines a Carnegie unit as the equivalent of a course that meets a minimum of 200 minutes per week for 36 weeks or is taught for the equivalent of 120 hours of instruction. In other words, one Carnegie unit is represented by a course that is offered and taught daily for the entire school year.
The average number of Carnegie units offered and taught was directly correlated with enrollment catego-ries in all years listed (Table 4-3). With the exception of foreign language for districts with less than 300 students, all district sizes on average met or exceeded state minimum requirements in major curriculum areas. The districts with 7,500 students or more provided greatest average number of units in all subject areas listed.
2000-2001 2015-2016 2016-2017Total Number of Public School Districts 374 336 333
Total Number of Public School Buildings 1,531 1,350 1329Number of Districts with 1 to 3 Public School Buildings 137 214 217Percent of Districts with 1 to 3 Public School Buildings 36.6% 63.7% 65.2%
Number of Districts with 4 to 6 Public School Buildings 183 88 82Percent of Districts with 4 to 6 Public School Buildings 48.9% 26.2% 24.6%
Number of Districts with 7 to 9 Public School Buildings 32 20 20Percent of Districts with 7 to 9 Public School Buildings 8.6% 6.0% 6.0%
Number of Districts with 10 or more Public School Buildings 22 14 14Percent of Districts with 10 or more Public School Buildings 5.9% 4.2% 4.2%
Total Number of Nonpublic Schools 211 178 180
The Annual Condition of Education Report 201760

Table 4-3
Average Curriculum Units Offered and Taught by Accreditation Area and District Enrollment Category 2010-2011, 2015-2016 to 2016-2017
Source: Iowa Department of Education, Bureau of Information and Analysis. Student Reporting in Iowa (SRI), Archived Course Group, winter files. Enrollment categories are defined by Certified Enrollment.
Enrollment CategoryState
Standards Minimum
Units
<300 300-599 600-999 1,000-2,499
2,500-7,499
7,500+ State
2010-2011Number of
Districts32 106 80 77 22 10 327
English/Language Arts
6 6.52 6.92 7.15 8.64 12.64 18.32 8.07
Mathematics 6 7.08 7.52 7.98 8.80 10.81 13.91 8.31 Science 5 5.81 6.22 6.64 7.18 9.90 14.73 7.02
Social Studies 5 5.18 5.31 5.49 6.27 8.74 14.12 6.07 Foreign Language 4 3.48 4.08 4.26 5.41 10.05 15.31 5.12
Fine Arts 3 5.12 5.72 5.57 7.52 12.64 18.79 7.16
2015-2016Number of
Districts23 94 85 77 22 11 312
English/Language Arts
6 6.67 6.93 6.95 7.65 10.74 15.87 7.68
Mathematics 6 5.98 7.54 7.83 8.15 8.82 13.51 7.96 Science 5 5.67 6.40 6.69 7.15 10.05 13.38 7.12
Social Studies 5 5.10 5.47 5.42 5.82 8.32 11.86 5.94 Foreign Language 4 3.40 4.13 4.08 4.98 9.63 15.67 5.08
Fine Arts 3 5.74 5.87 6.64 7.85 12.50 20.13 7.54
2016-2017Number of
Districts20 94 82 77 22 11 306
English/Language Arts
6 6.68 6.86 7.00 7.80 9.41 14.76 7.59
Mathematics 6 6.27 7.39 7.93 8.10 8.54 12.52 7.90 Science 5 5.60 6.31 6.62 7.02 9.70 12.96 7.01
Social Studies 5 5.31 5.38 5.43 5.78 8.52 11.57 5.94 Foreign Language 4 3.58 3.98 4.15 4.87 9.59 15.67 5.05
Fine Arts 3 5.21 5.84 6.69 8.01 12.05 20.09 7.53
The Annual Condition of Education Report 201761

Enrollments in Foreign Language, Algebra II, Higher-Level Mathematics, and Higher-Level Science Courses
The Iowa Department of Education started to collect course-taken data at the student level through SRI (EASIER) in 2004-2005. Along with the Iowa Student State ID System, SRI can track a high school student’s course taken from 9th grade to 12th grade. A real four-year course-taken pattern has been available for the Annual Condition of Education Report since 2008. Tables 4-4 to 4-14 describe Iowa public high school four-year enrollment in foreign language, Algebra II, higher-level mathematics (pre-calculus, calculus, sta-tistics, trigonometry, advanced placement mathematics, and other specific courses identified as advanced mathematics), and higher-level science (chemistry and physics) courses for the graduating classes of 2016 and 2017. The course enrollments only include the students who enrolled in Iowa public high schools in each of the last four years. Each table shows non-duplicate enrollment at the state level and by district enrollment category. Gender comparisons are reported by subject areas.
Table 4-4 examines foreign language course enrollment in Iowa public high schools for the 2016 and 2017 graduating class. Overall, 85.2 percent of the students in these two graduating classes took at least one foreign language course between 2012-2013 and 2015-2016 and between 2013-2014 and 2016-2017. The female enrollment in foreign languages was higher than male enrollment. The percent of students enrolled in foreign language courses was higher for the districts with enrollment between 2,500 and 7,499.
More than 27,000 of the students in the graduating class of 2017 took at least one foreign language course, almost 24,000 of them took Spanish (Table 4-6). Six other major languages French, German, Japanese, Chinese, Italian, and Russian, along with other foreign languages were taken by 4,831 students in that class. The enrollment in Table 4-5 can be duplicated if a student took courses in more than one language. However, one student is only counted once if his or her course taken was in one language at different levels.
Table 4-8 shows the Algebra II courses taken for the graduating classes of 2016 and 2017 by enrollment category. The total percent of the students who took Algebra II was 70.5 in the class of 2016 and 72.7 percent in the class of 2017. The female enrollment in Algebra II was higher than males (Table 4-7).
A total of 14,569 students (45.3 percent) in the 2016 class took one or more higher-level mathematics courses. The number and percent enrollment was slightly higher in the class of 2017. The female enroll-ment in higher-level mathematics was higher than male enrollment. The percent of students enrolled in higher-level mathematics courses was higher for the districts with enrollment between 2,500 and 7,499 than the districts in other enrollment categories in both classes shown (Tables 4-9 and 4-10).
Generally speaking, female students had about 9 percent more in chemistry or advanced chemistry enroll-ment than male students (Table 4-11).
Table 4-12 shows the chemistry courses taken by enrollment category for the graduating classes of 2016 and 2017. The data indicate that the greatest percent of students enrolled in chemistry courses are from districts with enrollments between 2,500-7,499.
About 31 percent of the students took physics and advanced physics for the classes of 2016 and 2017 (Table 4-13). The highest percentages of physics enrollment were in the districts with enrollment more than 2,500 students. Female physics enrollment was 5.5 percent less than the male enrollment for the class of 2016 and was 4.3 percent less than the male enrollment for the 2017 class.
This report starts to report course taken patterns by race/ethnicity and other subgroups.
The Annual Condition of Education Report 201762

Table 4-4
Iowa Public High School Graduating Classes of 2016 and 2017 Non-Duplicate Enrollment in Foreign Language Courses by Subgroup
Source: Iowa Department of Education, Bureau of Information and Analysis. SRI, winter files. Notes: The analysis for the class of 2016 includes the students who were in the Iowa public school system from 2012-2013 to 2015-
2016 (including the students with BEDS entry codes in 2015-2016) and for the class of 2017 includes the students who were in the Iowa public school system from 2013-2014 to 2016-2017 (including the students with BEDS entry codes in 2016-2017).
* Disability status is determined by the presence of an individualized education program (IEP). ** Low SES is determined by the eligibility for free or reduced price meals.
Table 4-5
Iowa Public High School Graduating Classes of 2016 and 2017 Non-Duplicate Enrollment in Foreign Language Courses by Enrollment Category
Class of 2016
Enrollment Category
<300 300-599 600-999 1,000-2,499
2,500-7,499
7,500+ State
Enrollment in Foreign Language Courses 267 2,816 3,840 7,164 5,680 7,643 27,410
Enrollment in Iowa Public High Schools in Each of the Last Four Years
344 3,389 4,538 8,397 6,428 9,067 32,163
Percent of Students Who Enrolled in Foreign Language Courses
77.6% 83.1% 84.6% 85.3% 88.4% 84.3% 85.2%
Class of 2017
Enrollment in Foreign Language Courses 315 2,949 3,671 6,992 5,560 8,057 27,544
Enrollment in Iowa Public High Schools in Each of the Last Four Years
384 3,587 4,333 8,400 6,314 9,297 32,315
Percent of Students Who Enrolled in Foreign Language Courses
82.0% 82.2% 84.7% 83.2% 88.1% 86.7% 85.2%
Source: Iowa Department of Education, Bureau of Information and Analysis. SRI, winter files. Enrollment categories are defined by Certified Enrollment. Note: The analysis for the class of 2016 includes the students who were in the Iowa public school system from 2012-2013 to 2015-2016 (including the students with BEDS entry codes in 2015-2016) and for the class of 2017 includes the students who were in the Iowa public school system from 2013-2014 to 2016-2017 (including the students with BEDS entry codes in 2016-2017).
Class of 2016 Class of 2017
Group Number Enrolled in
Foreign Lang
Total Enrollment
Percent Enrolled in
Foreign Lang
Number Enrolled in
Foreign Lang
Total Enrollment
Percent Enrolled in
Foreign Lang
All Students 27,410 32,163 85.2% 27,544 32,315 85.2%
African American 1,021 1,405 72.7% 1,103 1,450 76.1%
American Indian 88 115 76.5% 79 109 72.5%
Asian 599 695 86.2% 587 682 86.1%
Hispanic 2,111 2,499 84.5% 2,254 2,633 85.6%
Hawaiian or Pacific Islander 24 30 80.0% 37 48 77.1%
Two or More Races 697 831 83.9% 762 899 84.8%
White 22,870 26,588 86.0% 22,722 26,494 85.8%
Disability* 1,511 4,131 36.6% 1,461 4,021 36.3%
English Language Learner 691 974 70.9% 718 1,001 71.7%
Low SES** 9,999 13,170 75.9% 10,229 13,344 76.7%
Female 14,044 15,641 89.8% 14,225 15,746 90.3%
Male 13,366 16,522 80.9% 13,319 16,569 80.4%
The Annual Condition of Education Report 201763

Table 4-6
Foreign Language Enrollment of Iowa Public High School Graduating Classes of 2016 and 2017 by Language
Source: Iowa Department of Education, Bureau of Information and Analysis. SRI, winter files. Note: The analysis for the class of 2016 includes the students who were in the Iowa public school system from 2012-2013 to
2015-2016 (including the students with BEDS entry codes in 2015-2016) and for the class of 2017 includes the students who were in the Iowa public school system from 2013-2014 to 2016-2017 (including the students with BEDS entry codes in 2016-2017).
Table 4-7
Iowa Public High School Graduating Classes of 2016 and 2017 Non-Duplicate Enrollment in Algebra II by Subgroup
Class of 2016 Class of 2017Group Number
Enrolled in Algebra II
Total Enrollment
Percent Enrolled in Algebra II
Number Enrolled in Algebra II
Total Enrollment
Percent Enrolled in Algebra II
All Students 22,665 32,163 70.5% 23,477 32,315 72.7%African American 720 1,405 51.2% 785 1,450 54.1%American Indian 63 115 54.8% 59 109 54.1%
Asian 511 695 73.5% 517 682 75.8%Hispanic 1,551 2,499 62.1% 1,707 2,633 64.8%
Hawaiian or Pacific Islander 16 30 53.3% 31 48 64.6%
Two or More Races 546 831 65.7% 594 899 66.1%White 19,258 26,588 72.4% 19,784 26,494 74.7%
Disability* 888 4,131 21.5% 979 4,021 24.3%ELL** 496 974 50.9% 530 1,001 52.9%
Low SES*** 7,559 13,170 57.4% 8,179 13,344 61.3%Female 11,636 15,641 74.4% 12,086 15,746 76.8%
Male 11,029 16,522 66.8% 11,391 16,569 68.7%
Source: Iowa Department of Education, Bureau of Information and Analysis. SRI, winter files.Notes: The analysis for the class of 2016 includes the students who were in the Iowa public school system from 2012-2013 to 2015-2016 (including the students with BEDS entry codes in 2015-2016) and for the class of 2017 includes the students who were in the Iowa public school system from 2013-2014 to 2016-2017 (including the students with BEDS entry codes in 2016-2017). * Disability status is determined by the presence of an individualized education program (IEP). ** ELL indicates English language learner. *** Low SES is determined by the eligibility for free or reduced price meals.
Class of 2016 Class of 2017Language Enrollment Percent Enrolled Enrollment Percent Enrolled
Spanish 23,789 82.7% 23,848 83.2%French 2,630 9.1% 2,647 9.2%
German 1,442 5.0% 1,446 5.0%Chinese 223 0.8% 228 0.8%
Japanese 199 0.7% 192 0.7%Italian 71 0.2% 76 0.3%
Russian 19 0.1% 12 0.0%Other Foreign Language 382 1.3% 230 0.8%
The Annual Condition of Education Report 201764

Table 4-8
Iowa Public High School Graduating Classes of 2016 and 2017 Non-Duplicate Enrollment in Algebra II by Enrollment Category
Source: Iowa Department of Education, Bureau of Information and Analysis. SRI, winter files. Enrollment categories are defined by Certified Enrollment.
Note: The analysis for the class of 2016 includes the students who were in the Iowa public school system from 2012-2013 to 2015-2016 (including the students with BEDS entry codes in 2015-2016) and for the class of 2017 includes the students who were in the Iowa public school system from 2013-2014 to 2016-2017 (including the students with BEDS entry codes in 2016-2017).
Class of 2016Enrollment Category
<300 300-599 600-999 1,000-2,499
2,500-7,499
7,500+ State
Enrollment in Algebra II 256 2,474 3,124 6,039 4,376 6,396 22,665Enrollment in Iowa Public High Schools
in Each of the Last Four Years344 3,389 4,538 8,397 6,428 9,067 32,163
Percent of Students Who Enrolled in Algebra II
74.4% 73.0% 68.8% 71.9% 68.1% 70.5% 70.5%
Class of 2017Enrollment in Algebra II 286 2,607 3,131 6,179 4,623 6,651 23,477
Enrollment in Iowa Public High Schools in Each of the Last Four Years
384 3,587 4,333 8,400 6,314 9,297 32,315
Percent of Students Who Enrolled in Algebra II
74.5% 72.7% 72.3% 73.6% 73.2% 71.5% 72.7%
The Annual Condition of Education Report 201765

Table 4-9
Iowa Public High School Graduating Classes of 2016 and 2017 Non-Duplicate Enrollment in Higher-Level Mathematics (HLM) by Subgroup
Source: Iowa Department of Education, Bureau of Information and Analysis. SRI, winter files. Notes: The analysis for the class of 2016 includes the students who were in the Iowa public school system from 2012-2013 to
2015-2016 (including the students with BEDS entry codes in 2015-2016) and for the class of 2017 includes the students who were in the Iowa public school system from 2013-2014 to 2016-2017 (including the students with BEDS entry codes in 2016-2017).
Higher-level mathematics include calculus, statistics and trigonometry. * Disability status is determined by the presence of an individualized education program (IEP). ** ELL indicates English language learner. *** Low SES is determined by the eligibility for free or reduced price meals.
Class of 2016 Class of 2017Group Number
Enrolled in HLM
Total Enrollment
Percent Enrolled in
HLM
Number Enrolled in
HLM
Total Enrollment
Percent Enrolled in HLM
All Students 14,569 32,163 45.3% 14,926 32,315 46.2%African American 314 1,405 22.3% 347 1,450 23.9%American Indian 33 115 28.7% 38 109 34.9%
Asian 452 695 65.0% 446 682 65.4%Hispanic 752 2,499 30.1% 862 2,633 32.7%
Hawaiian or Pacific Islander 12 30 40.0% 12 48 25.0%Two or More Races 309 831 37.2% 333 899 37.0%
White 12,697 26,588 47.8% 12,888 26,494 48.6%Disability* 264 4,131 6.4% 291 4,021 7.2%
ELL** 176 974 18.1% 197 1,001 19.7%Low SES*** 3,452 13,170 26.2% 3,721 13,344 27.9%
Female 7,364 15,641 47.1% 7,833 15,746 49.7%Male 7,205 16,522 43.6% 7,093 16,569 42.8%
The Annual Condition of Education Report 201766

Table 4-10
Iowa Public High School Graduating Classes of 2016 and 2017 Non-Duplicate Enrollment in Higher-Level Mathematics by Enrollment Category
Source: Iowa Department of Education, Bureau of Information and Analysis. SRI, winter files. Enrollment categories are defined by Certified Enrollment.
Notes: The analysis for the class of 2016 includes the students who were in the Iowa public school system from 2012-2013 to 2015-2016 (including the students with BEDS entry codes in 2015-2016) and for the class of 2017 includes the students who were in the Iowa public school system from 2013-2014 to 2016-2017 (including the students with BEDS entry codes in 2016-2017). Higher-level mathematics include calculus, statistics and trigonometry.
Class of 2016Enrollment Category
<300 300-599 600-999 1,000-2,499
2,500-7,499
7,500+ State
Enrollment in Higher-Level Mathematics
135 1,270 1,903 3,878 3,286 4,097 14,569
Enrollment in Iowa Public High Schools in Each of the Last Four Years
344 3,389 4,538 8,397 6,428 9,067 32,163
Percent of Students Who Enrolled in Higher-Level Mathematics
39.2% 37.5% 41.9% 46.2% 51.1% 45.2% 45.3%
Class of 2017Enrollment in Higher-Level
Mathematics126 1,343 1,876 3,839 3,401 4,341 14,926
Enrollment in Iowa Public High Schools in Each of the Last Four Years
384 3,587 4,333 8,400 6,314 9,297 32,315
Percent of Students Who Enrolled in Higher-Level Mathematics
32.8% 37.4% 43.3% 45.7% 53.9% 46.7% 46.2%
The Annual Condition of Education Report 201767

Table 4-11
Iowa Public High School Graduating Classes of 2016 and 2017 Non-Duplicate Enrollment in Chemistry by Subgroup
Source: Iowa Department of Education, Bureau of Information and Analysis. SRI, winter files. Notes: The analysis for the class of 2016 includes the students who were in the Iowa public school system from 2012-2013 to
2015-2016 (including the students with BEDS entry codes in 2015-2016) and for the class of 2017 includes the students who were in the Iowa public school system from 2013-2014 to 2016-2017 (including the students with BEDS entry codes in 2016-2017).
* Disability status is determined by the presence of an individualized education program (IEP). ** ELL indicates English language learner. *** Low SES is determined by the eligibility for free or reduced price meals.
Class of 2016 Class of 2017Group Number
Enrolled in Chemistry
Total Enrollment
Percent Enrolled in Chemistry
Number Enrolled in Chemistry
Total Enrollment
Percent Enrolled in Chemistry
All Students 22,851 32,163 71.0% 23,234 32,315 71.9%African American 695 1,405 49.5% 808 1,450 55.7%American Indian 68 115 59.1% 57 109 52.3%
Asian 565 695 81.3% 567 682 83.1%Hispanic 1,619 2,499 64.8% 1,712 2,633 65.0%
Hawaiian or Pacific Islander 15 30 50.0% 25 48 52.1%Two or More Races 541 831 65.1% 609 899 67.7%
White 19,348 26,588 72.8% 19,456 26,494 73.4%Disability* 1,066 4,131 25.8% 1,054 4,021 26.2%
ELL** 459 974 47.1% 519 1,001 51.8%Low SES*** 7,338 13,170 55.7% 7,678 13,344 57.5%
Female 11,848 15,641 75.7% 12,113 15,746 76.9%Male 11,003 16,522 66.6% 11,121 16,569 67.1%
The Annual Condition of Education Report 201768
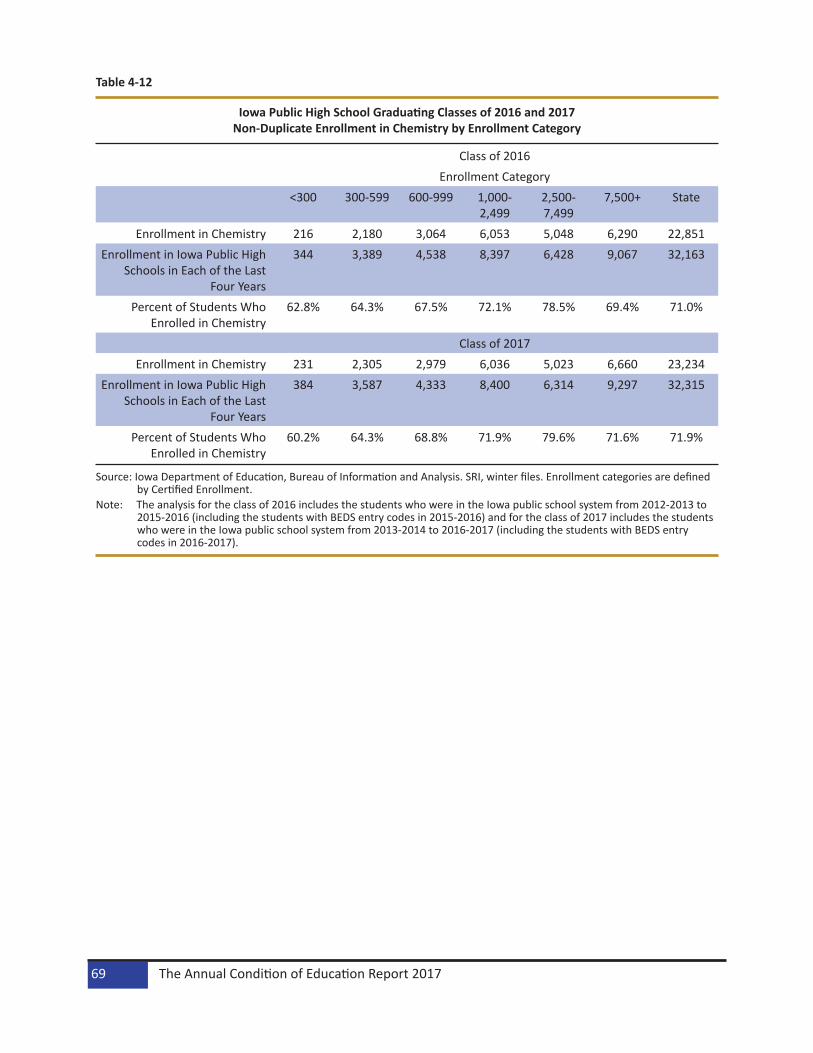
Table 4-12
Iowa Public High School Graduating Classes of 2016 and 2017 Non-Duplicate Enrollment in Chemistry by Enrollment Category
Source: Iowa Department of Education, Bureau of Information and Analysis. SRI, winter files. Enrollment categories are defined by Certified Enrollment.
Note: The analysis for the class of 2016 includes the students who were in the Iowa public school system from 2012-2013 to 2015-2016 (including the students with BEDS entry codes in 2015-2016) and for the class of 2017 includes the students who were in the Iowa public school system from 2013-2014 to 2016-2017 (including the students with BEDS entry codes in 2016-2017).
Class of 2016Enrollment Category
<300 300-599 600-999 1,000-2,499
2,500-7,499
7,500+ State
Enrollment in Chemistry 216 2,180 3,064 6,053 5,048 6,290 22,851Enrollment in Iowa Public High
Schools in Each of the Last Four Years
344 3,389 4,538 8,397 6,428 9,067 32,163
Percent of Students Who Enrolled in Chemistry
62.8% 64.3% 67.5% 72.1% 78.5% 69.4% 71.0%
Class of 2017Enrollment in Chemistry 231 2,305 2,979 6,036 5,023 6,660 23,234
Enrollment in Iowa Public High Schools in Each of the Last
Four Years
384 3,587 4,333 8,400 6,314 9,297 32,315
Percent of Students Who Enrolled in Chemistry
60.2% 64.3% 68.8% 71.9% 79.6% 71.6% 71.9%
The Annual Condition of Education Report 201769

Table 4-13
Iowa Public High School Graduating Classes of 2016 and 2017 Non-Duplicate Enrollment in Physics by Subgroup
Source: Iowa Department of Education, Bureau of Information and Analysis. SRI, winter files.Notes: The analysis for the class of 2016 includes the students who were in the Iowa public school system from 2012-2013 to
2015-2016 (including the students with BEDS entry codes in 2015-2016) and for the class of 2017 includes the students who were in the Iowa public school system from 2013-2014 to 2016-2017 (including the students with BEDS entry codes in 2016-2017).
* Disability status is determined by the presence of an individualized education program (IEP). ** ELL indicates English language learner. *** Low SES is determined by the eligibility for free or reduced price meals.
Class of 2016 Class of 2017
Group Number Enrolled in
Physics
Total Enrollment
Percent Enrolled in
Physics
Number Enrolled in
Physics
Total Enrollment
Percent Enrolled in
Physics All Students 9,871 32,163 30.7% 9,863 32,315 30.5%
African American 418 1,405 29.8% 475 1,450 32.8%American Indian 28 115 24.3% 30 109 27.5%
Asian 369 695 53.1% 351 682 51.5%Hispanic 682 2,499 27.3% 715 2,633 27.2%
Hawaiian or Pacific Islander 6 30 20.0% 10 48 20.8%Two or More Races 282 831 33.9% 300 899 33.4%
White 8,086 26,588 30.4% 7,982 26,494 30.1%Disability* 361 4,131 8.7% 344 4,021 8.6%
ELL** 220 974 22.6% 213 1,001 21.3%Low SES*** 2,972 13,170 22.6% 3,031 13,344 22.7%
Female 4,358 15,641 27.9% 4,460 15,746 28.3%Male 5,513 16,522 33.4% 5,403 16,569 32.6%
The Annual Condition of Education Report 201770

Table 4-14
Iowa Public High School Graduating Classes of 2016 and 2017 Non-Duplicate Enrollment in Physics by Enrollment Category
Source: Iowa Department of Education, Bureau of Information and Analysis. SRI, winter files. Enrollment categories are defined by Certified Enrollment.
Note: The analysis for the class of 2016 includes the students who were in the Iowa public school system from 2012-2013 to 2015-2016 (including the students with BEDS entry codes in 2015-2016) and for the class of 2017 includes the students who were in the Iowa public school system from 2013-2014 to 2016-2017 (including the students with BEDS entry codes in 2016-2017).
Class of 2016Enrollment Category
<300 300-599 600-999 1,000-2,499
2,500-7,499
7,500+ State
Enrollment in Physics 67 842 1,166 2,192 1,886 3,718 9,871Enrollment in Iowa Public High
Schools in Each of the Last Four Years344 3,389 4,538 8,397 6,428 9,067 32,163
Percent of Students Who Enrolled in Physics
19.5% 24.8% 25.7% 26.1% 29.3% 41.0% 30.7%
Class of 2017Enrollment in Physics 75 754 1,103 1,970 2,116 3,845 9,863
Enrollment in Iowa Public High Schools in Each of the Last Four Years
384 3,587 4,333 8,400 6,314 9,297 32,315
Percent of Students Who Enrolled in Physics
19.5% 21.0% 25.5% 23.5% 33.5% 41.4% 30.5%
The Annual Condition of Education Report 201771

Senior Year PlusBased on Iowa Code Chapter 261E, several existing programs are under the Senior Year Plus umbrella to provide college credit opportunities to high school students. These programs are Advanced Placement (AP), Concurrent Enrollment (under 28E agreement for concurrent credit offered by community colleges) and postsecondary enrollment options (PSEO). This section of the report presents the high school enroll-ment data in each program for three years or more.
Advanced Placement (AP) CoursesAP courses are college-level classes taught by highly qualified high school teachers who use the College Board course guidance. A school district can make AP courses available through on-site teaching, col-laborating with another district or using Iowa AP online academy. High school students can choose from nearly 40 AP courses to enroll in one or more courses. There is a section on AP exam and AP test scores in the Student Performance Chapter in this annual report.
Figure 4-1 shows an eight-year trend of AP courses taken by Iowa public high school students and AP enrollments from 2009-2010 to 2016-2017. In Iowa, AP enrollments and courses taken are higher in 2016-2017 than the figures in earlier years shown.
Each year, more than 50 percent of Iowa districts (only those districts that had a public high school) had AP enrollments. (Table 4-15).
AP enrollments by grade are displayed in Table 4-16. In the last eight years, about half of the AP enroll-ments were 12th graders.
Table 4-17 and Figure 4-2 show the AP courses taken by subject areas. The distributions are similar from 2015-2016 and 2016-2017, the top courses taken were in the social studies area, followed by English language arts and science. Mathematics was the fourth highest course taken.
Figure 4-1
Iowa Advanced Placement (AP) Enrollment and Courses Taken 2009-2010 to 2016-2017
17,638 17,857 19,812
21,909 22,520 23,788
24,756 25,286
11,316 11,666 13,095
14,090 14,707 15,516 16,369 16,762
-
5,000
10,000
15,000
20,000
25,000
30,000
2009-2010 2010-2011 2011-2012 2012-2013 2013-2014 2014-2015 2015-2016 2016-2017
Num
ber C
ours
es/N
umbe
r S
tude
nts
Year
Courses Enrollment
Source: Iowa Department of Education, Bureau of Information and Analysis, Student Reporting in Iowa, winter files.
The Annual Condition of Education Report 201772

Table 4-15
Iowa Districts with AP Enrollment 2009-2010 to 2016-2017
Source: Iowa Department of Education, Bureau of Information and Analysis, Student Reporting in Iowa, winter files.
Table 4-16
Number of Iowa School Students Taking AP Courses 2009-2010 to 2016-2017
Source: Iowa Department of Education, Bureau of Information and Analysis, Student Reporting in Iowa, winter files.
Year Total Number of Districts
Districts with High Schools
Districts with AP Enrollment
Percent of Districts w/High Schools that had AP Enrollment
2009-2010 361 330 177 53.6%2010-2011 359 328 179 54.6%2011-2012 351 320 171 53.4%2012-2013 348 316 176 55.7%2013-2014 346 314 175 55.7%2014-2015 338 312 162 51.9%2015-2016 336 310 159 51.3%2016-2017 333 306 163 53.3%
Year 9th Graders 10th Graders 11th Graders 12th Graders Total AP Enrollment2009-2010 267 1,689 3,786 5,574 11,316 2010-2011 390 1,719 3,857 5,700 11,666 2011-2012 290 2,699 4,202 5,904 13,095 2012-2013 442 2,794 4,889 5,965 14,090 2013-2014 582 3,027 4,971 6,127 14,707 2014-2015 777 3,258 5,299 6,182 15,516 2015-2016 771 3,432 5,550 6,616 16,369 2016-2017 856 3,566 5,776 6,564 16,762
The Annual Condition of Education Report 201773

Table 4-17
AP Courses Taken by Subject Area 2009-2010 to 2016-2017
Subject Area 2009-2010
2010-2011
2011-2012
2012-2013
2013-2014
2014-2015
2015-2016
2016-2017
English Language Arts 3,859 3,646 3,690 4,055 4,116 4,271 4,321 4,103 Fine and Performance Arts 344 374 335 414 362 485 508 570
Foreign Language 756 616 578 713 613 791 815 824 Mathematics 2,386 2,648 2,841 2,920 3,363 3,367 3,647 3,598
Computer (Other) 62 69 59 151 138 222 266 342 Science 2,866 2,912 3,109 3,405 3,443 3,951 4,078 4,151
Social Studies 7,365 7,592 9,200 10,251 10,485 10,701 11,121 11,698 Total Courses Taken 17,638 17,857 19,812 21,909 22,520 23,788 24,756 25,286
Source: Iowa Department of Education, Bureau of Information and Analysis, Student Reporting in Iowa, winter files.
Figure 4-2
Percent of Iowa AP Courses Taken by Subject Area 2009-2010, 2015-2016 and 2016-2017
21.9
%
4.3%
13.5
% 16.2
%
41.8
%
17.5
%
3.3%
14.7
%
16.5
%
44.9
%
16.2
%
3.3%
14.2
%
16.4
%
46.3
%
0%
5%
10%
15%
20%
25%
30%
35%
40%
45%
50%
English Foreign Language Mathematics Science Social Studies
Per
cent
Subject Area
2009-2010 2015-2016 2016-2017
Source: Iowa Department of Education, Bureau of Information and Analysis, Student Reporting in Iowa, winter files.Note: Each year, about 1 percent of the AP courses taken were in “other” subject areas. For details, see Table 4-17.
The Annual Condition of Education Report 201774

Concurrent EnrollmentConcurrent enrollment courses are offered by community colleges through 28E agreements between school districts and community colleges. The two slightly different designed courses are: one, the courses are designed for both college and high school students for concurrent credit offered by community colleges and two, the courses are designed for high school students offered by community colleges to bridge high school students to community college programs and typically provide coursework in science, technology, engineering, and mathematics (STEM) or other highly technical areas. The second kind of courses through 28E agreements between high school and community college are designed for career academy concurrent credit.
Figure 4-3 shows eight-year trends of concurrent enrollment courses taken by Iowa public high school students and concurrent enrollment from 2009-2010 to 2016-2017. Concurrent enrollment and courses taken are much higher in 2016-2017 than the figures in 2009-2010.
Each year, 80 to 99 percent of Iowa districts (only those districts that had a public high school) had concur-rent enrollments. In general, an upward trend of districts with concurrent enrollment is reported in Table 4-18.
Concurrent enrollments by grade are displayed in Table 4-19. In the last eight years, close to half of the concurrent enrollments were high school seniors.
Table 4-20 and Figure 4-4 show the concurrent enrollment courses taken by subject areas. The distribu-tions are similar from 2009-2010 to 2016-2017, the highest percentages of courses taken were in career technical/vocational education, followed by English language arts. Social studies and mathematics were the third and fourth highest courses taken respectively.
Figure 4-3
Iowa Concurrent Enrollment and Courses Taken 2009-2010 to 2016-2017
57,931
65,710 69,257
73,834
81,381 85,293
91,341 96,031
29,721 32,726 34,513 36,026
39,159 40,263 42,326 43,843
-
20,000
40,000
60,000
80,000
100,000
120,000
2009-2010 2010-2011 2011-2012 2012-2013 2013-2014 2014-2015 2015-2016 2016-2017
Num
ber C
ours
es/N
umbe
r S
tude
nts
Year
Courses Enrollment
Source: Iowa Department of Education, Bureau of Information and Analysis, Student Reporting in Iowa, winter files.
The Annual Condition of Education Report 201775

Table 4-18
Iowa Districts with Concurrent Enrollment 2009-2010 to 2016-2017
Source: Iowa Department of Education, Bureau of Information and Analysis, Student Reporting in Iowa, winter files.
Table 4-19
Number of Iowa School Students Taking Concurrent Enrollment Courses 2009-2010 to 2016-2017
Source: Iowa Department of Education, Bureau of Information and Analysis, Student Reporting in Iowa, winter files.
Year Total # of Districts
Districts with High Schools
Districts with Concurrent Enrollment
Percent of Districts with High
Schools that had Concurrent Enrollment
2009-2010 361 330 313 94.8%2010-2011 359 328 311 94.8%2011-2012 351 320 311 97.2%2012-2013 348 316 309 97.8%2013-2014 346 314 310 98.7%2014-2015 338 312 302 96.8%2015-2016 336 310 304 98.1%2016-2017 333 306 302 98.7%
Year 9th Graders 10th Graders 11th Graders 12th Graders Total Enrollment2009-2010 1,010 2,701 10,494 15,516 29,721 2010-2011 1,537 3,553 11,329 16,307 32,726 2011-2012 2,199 3,941 11,596 16,777 34,513 2012-2013 2,403 4,365 11,962 17,296 36,026 2013-2014 2,748 5,056 12,858 18,497 39,159 2014-2015 3,013 5,421 13,204 18,625 40,263 2015-2016 3,414 6,039 13,668 19,205 42,326 2016-2017 3,279 6,017 14,871 19,676 43,843
The Annual Condition of Education Report 201776

Table 4-20
Iowa Concurrent Enrollment Courses Taken by Subject Area 2009-2010 to 2016-2017
Source: Iowa Department of Education, Bureau of Information and Analysis, Student Reporting in Iowa, winter files.
Figure 4-4
Percent of Iowa Concurrent Enrollment Courses Taken by Subject Area 2009-2010, 2015-2016 and 2016-2017
18.1
%
6.5%
10.3
%
4.1%
12.7
%
41.2
%
18.3
%
3.4%
9.4%
4.0%
16.9
%
34.5
%
18.5
%
3.5%
9.3%
4.0%
16.7
%
38.1
%
0%
5%
10%
15%
20%
25%
30%
35%
40%
45%
English Foreign Language Mathematics Science Social Studies CareerTechnical/Vocational
Ed
Per
cent
Subject Area
2009-2010 2015-2016 2016-2017
Source: Iowa Department of Education, Bureau of Information and Analysis, Student Reporting in Iowa, winter files.Note: About 5 to 11 percent of the concurrent courses taken were in “other” subject areas. For details, see Table 4-20.
Subject Area 2009-2010
2010-2011
2011-2012
2012-2013
2013-2014
2014-2015
2015-2016
2016-2017
English Language Arts 10,507 11,226 11,636 13,459 13,732 15,533 16,674 17,793Fine and Performance Arts 1,190 1,447 1,761 2,029 2,397 2,609 2,743 2,912Foreign Language 3,775 3,887 3,364 3,093 3,262 3,011 3,139 3,328Mathematics 5,943 6,969 6,872 7,555 8,200 8,311 8,570 8,909Other 2,909 5,791 5,901 7,372 8,926 8,936 9,637 6,634Science 2,380 2,352 2,665 2,921 3,163 3,031 3,624 3,829Social Studies 7,346 9,164 10,238 11,495 12,797 14,061 15,401 16,009Career Technical/ Vocational Education
23,881 24,874 26,820 25,910 28,904 29,801 31,553 36,617
Total Courses Taken 57,931 65,710 69,257 73,834 81,381 85,293 91,341 96,031
The Annual Condition of Education Report 201777

Postsecondary Enrollment Options (PSEO) ActThe Postsecondary Enrollment Options (PSEO) Act was enacted in 1987. The purpose of the act was to promote rigorous academic pursuits and to provide a wider variety of options to high school students by enabling 11th and 12th grade students to enroll part-time in nonsectarian courses in eligible postsecond-ary institutions of higher learning in Iowa. Ninth and 10th grade students who are identified as talented and gifted students according to the school district’s criteria and procedures may also participate under the Act (See Iowa Code - 261C.2). The Department of Education began collecting data on PSEO in 1993.
Figure 4-5 shows eight-year trends of PSEO courses taken by Iowa public high school students and PSEO enrollments from 2009-2010 to 2016-2017. While the concurrent courses taken are much higher the last few years than the early years (see Figure 4-3) in contrast, the trend switches between PSEO and concur-rent enrollment due to recent year’s better data reporting from Iowa school districts.
Each year, 88 to 66 percent of Iowa districts (only those districts that had a public high school) had PSEO enrollments. However, a downward trend of PSEO enrollment districts is reported in Table 4-21.
PSEO enrollments by grade are displayed in Table 4-22. In the last eight years, about two-thirds of the PSEO enrollments were 12th graders.
Table 4-23 and Figure 4-6 show the PSEO courses taken by subject areas. The distributions are similar in 2015-2016 and 2016-2017, the majority of courses taken were in the social studies area.
Figure 4-5
Iowa PSEO Enrollments and Courses Taken 2009-2010 to 2016-2017
11,235
9,680 8,984 8,888 8,538
7,913 8,545
9,057 6,708 5,916
5,474 4,869 4,666 4,727 5,014 5,141
-
2,000
4,000
6,000
8,000
10,000
12,000
2009-2010 2010-2011 2011-2012 2012-2013 2013-2014 2014-2015 2015-2016 2016-2017
Num
ber C
ours
es/N
umbe
r S
tude
nts
Year
Courses Enrollment
Source: Iowa Department of Education, Bureau of Information and Analysis, Student Reporting in Iowa, spring files.
The Annual Condition of Education Report 201778

Table 4-21
Iowa Districts with PSEO Enrollments 2009-2010 to 2016-2017
Source: Iowa Department of Education, Bureau of Information and Analysis, Student Reporting in Iowa, spring files.
Table 4-22
Number of Iowa Students Taking PSEO Courses 2009-2010 to 2016-2017
Source: Iowa Department of Education, Bureau of Information and Analysis, Student Reporting in Iowa, spring files.
Year Total # of Districts
Districts with High Schools
Districts with PSEO Enrollment
Percent of Districts w/High Schools that had PSEO Enrollment
2009-2010 361 330 290 87.9%2010-2011 359 328 262 79.9%2011-2012 351 311 243 78.1%2012-2013 348 316 235 74.4%2013-2014 346 314 231 73.6%
2014-2015 338 312 212 67.9%
2015-2016 336 310 215 69.4%
2016-2017 333 306 202 66.0%
Year 9th and 10th Graders 11th Graders 12th Graders Total PSEO Enrollment2009-2010 295 1,886 4,526 6,707 2010-2011 295 1,624 3,997 5,916 2011-2012 303 1,510 3,661 5,474 2012-2013 330 1,343 3,196 4,869 2013-2014 335 1,232 3,099 4,666 2014-2015 365 1,328 3,034 4,727 2015-2016 412 1,432 3,170 5,014 2016-2017 450 1,482 3,209 5,141
The Annual Condition of Education Report 201779

Table 4-23
Iowa PSEO Courses Taken by Subject Areas 2009-2010 to 2016-2017
Source: Iowa Department of Education, Bureau of Information and Analysis, Student Reporting in Iowa, spring files.
Figure 4-6
Iowa PSEO Courses Taken by Subject Areas, 2009-2010, 2015-2016 and 2016-2017
15.4
%
5.0%
1.6%
8.2%
6.2%
37.4
%
21.9
%
20.3
%
3.6%
1.8%
8.3% 8.8%
37.7
%
10.8
%
21.2
%
4.6%
2.5%
9.2%
8.1%
37.7
%
11.9
%
0%
5%
10%
15%
20%
25%
30%
35%
40%
English Foreign Language Science Career Technical/VocationalEd
Per
cent
Subject Area
2009-2010 2015-2016 2016-2017
Source: Iowa Department of Education, Bureau of Information and Analysis, Student Reporting in Iowa, spring files.Note: Each year, about 4 to 9 percent of the PSEO courses taken were in “other” subject areas. For details, see Table 4-23.
Subject Areas 2009-2010 2010-2011 2011-2012 2012-2013 2013-2014 2014-2015 2015-2016 2016-2017English Language Arts 1,731 1,441 1,417 1,347 1,486 1,394 1,735 1,922
Fine & Performance Arts 556 482 419 357 287 315 307 415 Foreign Language 184 188 186 209 234 171 155 225
Mathematics 926 770 719 931 905 781 709 837 Other 486 356 318 890 708 731 748 428
Science 692 870 946 997 767 580 752 735 Social Studies 4,202 3,663 3,374 3,196 3,205 3,067 3,218 3,415
Career Technical/Vocational Education 2,458 1,910 1,605 961 946 874 921 1,080
Total Courses Taken 11,235 9,680 8,984 8,888 8,538 7,913 8,545 9,057
The Annual Condition of Education Report 201780

Class SizeOverviewThe results of 17 years of class size reduction efforts, initiated by the Iowa Early Intervention Block Grant Program, are provided in this section. The Iowa Early Intervention Block Grant Program focused attention on class size reduction in kindergarten through third grade and established the goal of reaching an average class size of 17 students or less.
Public school districts report the number of kindergarten, first, second and third grade classroom sections, students, teachers, and aides by building through the Fall Basic Educational Data Survey (BEDS). Special education teachers, aides and “specialty” teachers, such as physical education, art and music teachers are excluded from the teacher count.
Since the purpose was to calculate an average class size for each grade, kindergarten through grade three classrooms defined as multi-age or multi-grade classrooms were reported as grade level “other” and were not considered in the calculation of average class size. Special classrooms for special education students and other “pull-out” situations were also excluded. Average class size was calculated by dividing the number of students by the number of classrooms for each grade level.
Average Class Size = Number of Students / Number of Classrooms
Since average class size uses the number of classrooms as the denominator, adding additional teachers to a classroom does not lower the average class size for that grade level. The use of the classroom aides also does not reduce average class size at the district or state level.
TrendsFigures 4-7 to 4-10 provide a summary of average class size in grades kindergarten through third in Iowa public schools for the past 17 years. None of the grades reached the state goal of 17 students per class-room during the years reported.
Table 4-24 shows the change in BEDS enrollment compared to the change in class size. From 1998-1999 to present, enrollment increased more than that of average class size for all grades, with kindergarten experiencing an overall decrease in class size.
Table 4-25 shows the comparison between teachers, students and class size. The number of students used in this table were reported by districts for the purpose of calculating average class size. First and second grades had a modest increase, while kindergarten showed a modest average class size decrease and third grade remained the same as the previous year.
Summary statistics are presented in Table 4-26.
The Annual Condition of Education Report 201781

Figure 4-7
Iowa Public School District Average Class Size for Kindergarten 2000-2001 to 2016-2017
18.6 18.618.9 19.0
19.219.4
19.019.2 19.3
19.820.0 20.1
20.3 20.3
19.9 19.9
19.5
17.0
17.5
18.0
18.5
19.0
19.5
20.0
20.5
21.0
21.5
22.0
Cla
ss s
ize
School Year
Kindergarten
Source: Iowa Department of Education, Bureau of Information and Analysis, Basic Educational Data Survey, Class Size files.
Figure 4-8
Iowa Public School District Average Class Size for First Grade 2000-2001 to 2016-2017
18.8
18.5
18.8
19.1 19.219.4 19.5
19.1
19.4
19.7
20.2
20.5 20.520.7
20.5 20.4 20.3
17.0
17.5
18.0
18.5
19.0
19.5
20.0
20.5
21.0
21.5
22.0
Cla
ss S
ize
School Year
Source: Iowa Department of Education, Bureau of Information and Analysis, Basic Educational Data Survey, Class Size files.
The Annual Condition of Education Report 201782

Figure 4-9
Iowa Public School District Average Class Size for Second Grade 2000-2001 to 2016-2017
19.7
19.4
19.7 19.8 19.9 19.9
20.220.0 20.0
20.4
20.7 20.8 20.821.0 21.1
21.2
20.8
17.0
17.5
18.0
18.5
19.0
19.5
20.0
20.5
21.0
21.5
22.0C
lass
Siz
e
School Year
Source: Iowa Department of Education, Bureau of Information and Analysis, Basic Educational Data Survey, Class Size files.
Figure 4-10
Iowa Public School District Average Class Size for Third Grade 2000-2001 to 2016-2017
20.620.4 20.4
20.620.4 20.5
20.8 20.821.0 21.1
21.5 21.621.4 21.5 21.4
21.6 21.7
17.0
17.5
18.0
18.5
19.0
19.5
20.0
20.5
21.0
21.5
22.0
Cla
ss S
ize
School Year
Source: Iowa Department of Education, Bureau of Information and Analysis, Basic Educational Data Survey, Class Size files.
The Annual Condition of Education Report 201783

Table 4-24
Iowa Public School BEDS Enrollments for Kindergarten Through Third Grade 1998-1999 and 2016-2017
Source: Iowa Department of Education, Bureau of Information and Analysis, Basic Educational Data Survey, Enrollment files.
Grade 1998-1999 Enrollment
2016-2017 Enrollment
Absolute Difference in Enrollment
Percent Change in Enrollment
Percent Change in Class Size
Kindergarten 35,772 38,196 2,424 6.8% -1.0%1 35,699 36,017 318 0.9% 1.0%2 35,866 36,599 733 2.0% 0.5%3 36,500 36,599 99 0.3% 0%
The Annual Condition of Education Report 201784

Table 4-25
Iowa Public School Students, Teachers, and Average Class Size 1998-1999 and 2016-2017
Source: Iowa Department of Education, Bureau of Information and Analysis, Basic Educational Data Survey, Class Size files.
Table 4-26
Class Size Summary Statistics for Kindergarten Through Grade 3 in Iowa Public Schools2000-2001, 2015-2016 and 2016-2017
Source: Iowa Department of Education, Bureau of Information and Analysis, Basic Educational Data Survey, Class Size files.
Grade Students Teachers Average Class Size1998-1999 2016-2017 1998-1999 2016-2017 1998-1999 2016-2017
Kindergarten 33,618 36,236 1,613.7 1,854.0 19.7 19.51 33,053 35,508 1,644.6 1,749.1 20.1 20.32 33,151 36,041 1,592.1 1,733.8 20.7 20.83 34,153 37,259 1,578.3 1,720.9 21.7 21.7
TeacherSchool Year Students Classrooms FTEs Mean Min Max
Kindergarten 2000-2001 33,004 1,774 1,793.0 18.6 3 342015-2016 37,308 1,871 1,872.5 19.9 2 332016-2017 36,236 1,857 1,854.0 19.5 2 40
Grade 1 2000-2001 32,016 1,700 1,735.0 18.8 2 302015-2016 35,920 1,761 1,762.0 20.4 5 282016-2017 35,508 1,745 1,749.1 20.3 1 28
Grade 2 2000-2001 33,125 1,679 1,712.8 19.7 2 312015-2016 36,943 1,742 1,743.0 21.2 5 322016-2017 36,041 1,733 1,733.8 20.8 2 31
Grade 3 2000-2001 34,293 1,661 1,695.7 20.6 2 302015-2016 36,821 1,703 1,704.0 21.6 6 322016-2017 37,259 1,719 1,720.9 21.7 1 34
The Annual Condition of Education Report 201785

Class Size vs. District SizeTable 4-27 shows average class size comparison for kindergarten through grade three by enrollment category for 1998-1999 and 2016-2017. In general, average class size tended to increase as enrollment category increased. The less than 300 enrollment category showed an average of less than 17 students per classroom for all grade levels. In all cases for kindergarten through grade three, the average class size in enrollment categories greater than 300 exceeded the goal of 17 students per classroom.
Table 4-27
Average Class Size Comparison for Iowa Public Schools by Enrollment Category, Kindergarten to Third Grade 1998-1999 and 2016-2017
Source: Iowa Department of Education, Bureau of Information and Analysis, Basic Educational Data Survey, Class Size files.
Enrollment K 1st 2nd 3rdCategory 1998-1999 2016-2017 1998-1999 2016-2017 1998-1999 2016-2017 1998-1999 2016-2017
<300 13.9 15.5 14.3 15.1 15.0 15.4 16.9 15.6300-599 17.6 17.8 17.4 17.7 17.9 17.8 19.3 19.3600-999 18.2 18.3 19.0 18.8 19.6 19.5 20.3 20.4
1,000-2,499 19.8 19.0 20.3 20.5 21.3 20.7 21.9 22.12,500-7,499 21.5 20.2 21.6 21.5 22.0 21.9 23.0 22.5
7,500+ 20.7 21.0 21.1 21.6 21.7 22.2 23.0 22.7State 19.7 19.5 20.1 20.3 20.7 20.8 21.7 21.7
The Annual Condition of Education Report 201786

Class Size Funding and ExpendituresTable 4-28 shows the Iowa class size reduction allocations since 2010. In 1999, the Iowa General Assembly enacted, and Governor signed, HF 743, Iowa Early Intervention Block Grant Program to fund class size reduction. Appropriations for HF 743 began in fiscal year 2000.
Table 4-29 shows the fiscal year 2016 Iowa Early Intervention Block Grant Program expenditures. Staff salaries absorbed the largest amount of Iowa Early Intervention Block Grant funds in fiscal year 2016 at 75.85 percent.
Table 4-28
State Class Size Reduction Allocation for Iowa Public Schools FY 2010 to FY 2017
Source: Iowa Department of Education, Bureau of Information and Analysis; Department of Management Budget files.
Table 4-29
FY 2016 Iowa Early Intervention Block Grant Program Expenditures by Object
Source: Iowa Department of Education, Certified Annual Report.Notes: Total expenditures reported exceeded the amount of revenues. The differences are dollars spent from the General
Fund. Detail for expenditures and percent may not equal the total due to rounding.
Fiscal Year State Allocation2010 $29.3 Million2011 $29.8 Million2012 $29.9 Million2013 $30.3 Million2014 $31.1 Million2015 $32.4 Million2016 $33.0 Million2017 $33.9 Million
Object Category Expenditures PercentSalaries 24,845,018 75.85%Benefits 7,856,847 23.99%
Purchased Services 20,009 0.06%Supplies 33,439 0.10
Equipment - -Other - -Total 32,755,313 100%
The Annual Condition of Education Report 201787
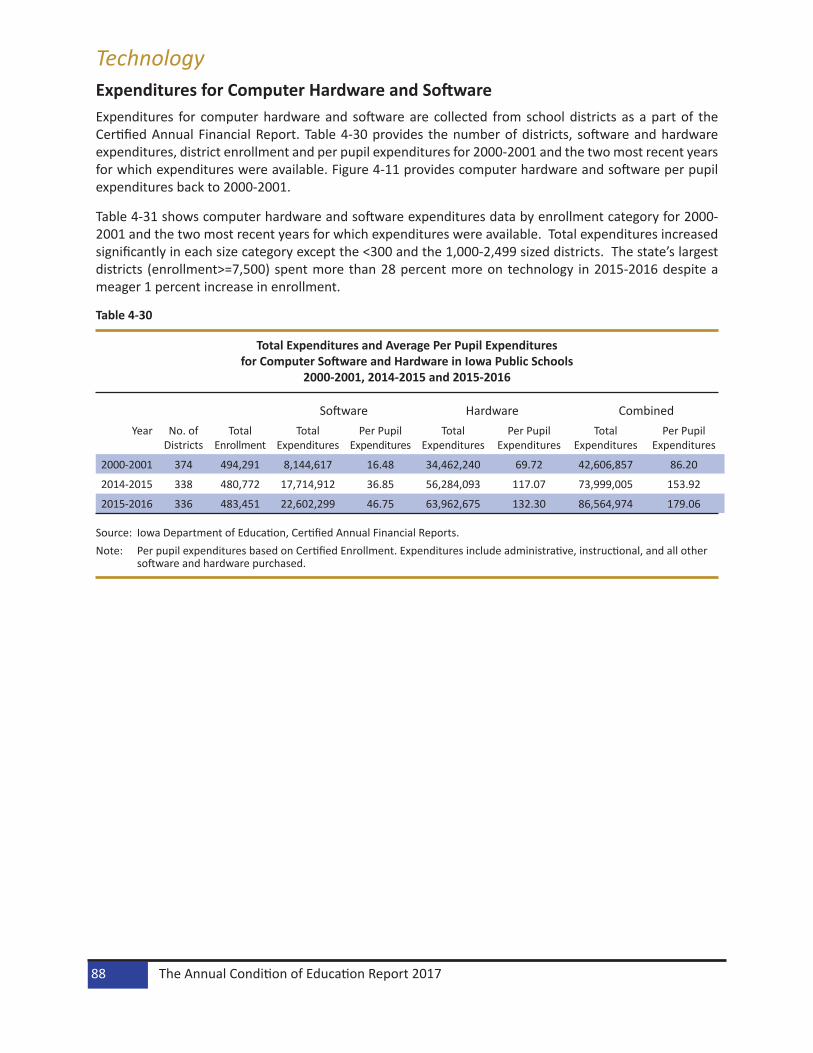
TechnologyExpenditures for Computer Hardware and SoftwareExpenditures for computer hardware and software are collected from school districts as a part of the Certified Annual Financial Report. Table 4-30 provides the number of districts, software and hardware expenditures, district enrollment and per pupil expenditures for 2000-2001 and the two most recent years for which expenditures were available. Figure 4-11 provides computer hardware and software per pupil expenditures back to 2000-2001.
Table 4-31 shows computer hardware and software expenditures data by enrollment category for 2000-2001 and the two most recent years for which expenditures were available. Total expenditures increased significantly in each size category except the <300 and the 1,000-2,499 sized districts. The state’s largest districts (enrollment>=7,500) spent more than 28 percent more on technology in 2015-2016 despite a meager 1 percent increase in enrollment.
Table 4-30
Total Expenditures and Average Per Pupil Expenditures for Computer Software and Hardware in Iowa Public Schools
2000-2001, 2014-2015 and 2015-2016
Source: Iowa Department of Education, Certified Annual Financial Reports.Note: Per pupil expenditures based on Certified Enrollment. Expenditures include administrative, instructional, and all other
software and hardware purchased.
Software Hardware CombinedYear No. of
DistrictsTotal
EnrollmentTotal
ExpendituresPer Pupil
ExpendituresTotal
ExpendituresPer Pupil
ExpendituresTotal
ExpendituresPer Pupil
Expenditures
2000-2001 374 494,291 8,144,617 16.48 34,462,240 69.72 42,606,857 86.20
2014-2015 338 480,772 17,714,912 36.85 56,284,093 117.07 73,999,005 153.92
2015-2016 336 483,451 22,602,299 46.75 63,962,675 132.30 86,564,974 179.06
The Annual Condition of Education Report 201788

Figure 4-11
Computer Software and Hardware Per Pupil Expenditures in Iowa Public Schools 2000-2001 to 2015-2016
86.20
58.72 56.5964.44 64.93
71.5177.24
92.01 88.45
120.46
166.91174.40 173.09
163.58153.92
179.06
69.72
45.53 41.7146.89 47.81
53.1358.30
70.6765.37
90.94
130.24
149.79143.09
129.07
117.07
132.30
16.48 13.19 14.88 17.55 17.12 18.38 18.94 21.34 23.0829.52
36.67
24.6130.01
34.51 36.8546.75
$0
$20
$40
$60
$80
$100
$120
$140
$160
$180
$200
Per P
upil
Expe
nditu
res
Year
Combined
Hardware
Software
Source: Iowa Department of Education, Certified Annual Financial Reports.Note: Per pupil expenditures based on certified enrollment. Expenditures include administrative, instructional, and all other
software and hardware purchased.
The Annual Condition of Education Report 201789

Table 4-31
Iowa Public School Total Per Pupil Expenditures by Enrollment for Computer Software and Hardware 2000-2001, 2014-2015, and 2015-2016
Source: Iowa Department of Education, Certified Annual Financial Reports.Note: Per pupil expenditures based on Certified Enrollment. Expenditures include administrative, instructional, and all other
software and hardware purchased. *Figures may not total due to rounding.
Enrollment Category <300 300-599 600-999 1,000-2,499 2,500-7,499 7,500+ State*
2000-2001Enrollment 8,176 52,162 78,916 126,118 96,410 132,509 494,291
Software 126,394 707,178 991,226 1,961,623 1,540,719 1,611,785 6,938,925Per Pupil 15.46 13.56 12.56 15.55 15.98 12.16 14.04
Hardware 532,065 2,940,795 5,179,906 9,196,344 7,024,183 9,588,947 34,462,240Per Pupil 65.08 56.38 65.64 72.92 72.86 72.36 69.72
Total Software& Hardware 658,459 3,647,973 6,171,132 11,157,967 8,564,902 11,200,732 41,401,165
Per Pupil 80.54 69.94 78.20 88.47 88.84 84.53 83.76
2014-2015Enrollment 8,493 46,746 65,111 113,777 94,788 151,857 480,772
Software 230,321 1,458,107 1,746,217 3,688,552 3,160,090 7,431,625 17,714,912Per Pupil 27.12 31.19 26.82 32.42 33.34 48.94 36.85
Hardware 1,092,331 6,858,458 8,587,555 17,608,601 8,458,284 13,678,865 56,284,093Per Pupil 128.62 146.72 131.89 154.76 89.23 90.08 117.07
Total Software& Hardware 1,322,652 8,316,565 10,333,772 21,297,153 11,618,374 21,110,489 73,999,005
Per Pupil 155.73 177.91 158.71 187.18 122.57 139.02 153.92
2015-2016Enrollment 8,873 46,037 63,362 116,020 95,647 153,512 483,451
Software 333,929 1,633,809 1,921,121 4,356,819 3,659,472 10,697,149 22,602,299Per Pupil 37.63 35.49 30.32 37.55 38.26 69.68 46.75
Hardware 948,183 8,305,238 10,815,268 17,066,368 10,393,087 16,434,531 63,962,675Per Pupil 106.86 180.40 170.69 147.10 108.66 107.06 132.30
Total Software& Hardware 1,282,112 9,939,047 12,736,390 21,423,187 14,052,558 27,131,680 86,564,974
Per Pupil 144.49 215.89 201.01 184.65 146.92 176.74 179.06
The Annual Condition of Education Report 201790

Availability of ComputersAs a part of the Basic Educational Data Survey (BEDS), Iowa public school districts report on the number of computers made available for student use. The Department of Education has collected this informa-tion since 1995-1996. However, in 2012-2013 the definition of student accessible computer was revised to include tablets. The ratio of students per computer is calculated by dividing the number of students reported on the Certified Enrollment by the number of computers available for student use.
Figures 4-12 and 4-13, and Table 4-32 provide the pupil to computer ratios. As of 2016-2017, the statewide pupils per computer has reached 1.0. Districts with enrollments of 7,500 or more are the furthest behind with 1.3 pupils per computer.
Table 4-33 provides the number of computers per pupil by school type within enrollment category. In gen-eral, students in higher grades have more access to a computer than students in lower grades. Statewide high schools remained at one pupil per computer and middle schools and junior high schools continued to exceed the one pupil per device goal. Districts with largest enrollments continue to lag behind their smaller sized peers.
Figure 4-12
Pupils Per Computer in Iowa Public Schools 2000-2001 to 2016-2017
4.13.9
3.7 3.7 3.6 3.53.3 3.2
3.0 2.9
2.6
2.3
1.7
1.41.2 1.1 1.0
0.0
0.5
1.0
1.5
2.0
2.5
3.0
3.5
4.0
4.5
Num
ber o
f Pup
ils p
er C
ompu
ter
Year
Source: Iowa Department of Education, Bureau of Information and Analysis, Basic Educational Data Survey.Note: Pupils per computer based on Certified Enrollment.
The Annual Condition of Education Report 201791

Figure 4-13
Pupils Per Computer in Iowa Public Schools by Enrollment Category
2000-2001, 2015-2016 and 2016-20176
3.4
3.3
3.8 4.
1 4.3 4.
7
4.1
1.1
0.9
1.0 1.0 1.1 1.2
1.1
1.1
0.9 1.0
0.9 1.0 1.
3
1.0
0
1
2
3
4
5
6
<300 300-599 600-999 1,000-2,499 2,500-7,499 7,500+ State
Num
ber o
f Pup
ils p
er C
ompu
ter
Enrollment Category
2000-2001 2015-2016 2016-2017
Source: Iowa Department of Education, Bureau of Information and Analysis, Basic Educational Data Survey.Note: Pupils per computer based on Certified Enrollment.
The Annual Condition of Education Report 201792

Table 4-32
Number of Computers in Iowa Public Schools by Enrollment Category
2000-2001, 2015-2016, 2016-2017
Source: Iowa Department of Education, Bureau of Information and Analysis, Basic Educational Data Survey.Notes: Enrollment categories and pupils per computer based on Certified Enrollment.
Figures may not total due to rounding.
Enrollment Category2000-2001 <300 300-599 600-999 1,000-2,499 2,500-7,499 7,500+ State
Total Number of Districts 38 116 104 83 24 9 374Number of Computers 2,386 15,728 21,044 30,944 22,274 28,292 120,668
Certified Enrollment 8,176 52,162 78,916 126,118 96,410 132,509 494,291Pupils per Computer 3.4 3.3 3.8 4.1 4.3 4.7 4.1
2015-2016 Total Number of Districts 39 101 85 77 22 11 335
Number of Computers 8,175 49,541 66,313 113,488 85,002 124,382 446,901Certified Enrollment 8,794 46,037 63,362 116,020 95,647 153,512 483,371Pupils per Computer 1.1 0.9 1.0 1.0 1.1 1.2 1.1
2016-2017Total Number of Districts 38 103 80 77 22 11 331
Number of Computers 7,818 53,815 62,618 122,976 92,551 122,519 462,297Certified Enrollment 8,663 47,325 59,628 116,271 96,535 154,884 483,306Pupils per Computer 1.1 0.9 1.0 0.9 1.0 1.3 1.0
The Annual Condition of Education Report 201793

Table 4-33
Number of Computers and Pupils-to-Computer Ratios in Iowa Public Schools by School Type Within District Enrollment Category, 2015-2016 and 2016-2017
Source: Iowa Department of Education, Bureau of Information and Analysis, Basic Educational Data Survey.Notes: Enrollment categories are based on Certified Enrollment, while pupils per computer are based on BEDS enrollment.
Other schools include alternative and special schools. HS - High school
EL - Elementary
Enrollment Category2015-2016 <300 300-599 600-999 1,000-2,499 2,500-7,499 7,500+ State
Number of Computers in HS
2,926 23,537 26,784 41,578 28,361 34,437 157,623
Pupils per Computer in HS
0.7 0.8 0.8 0.9 1.0 1.2 1.0
Number of Computers in Middle School/Jr High
School
796 5,526 12,812 31,500 20,917 32,945 104,496
Pupils per Computer in Middle School/Jr High
School
0.8 0.9 0.9 0.9 1.0 1.0 0.9
Number of Computers in EL School
4,351 19,974 26,370 39,967 35,319 54,686 180,667
Pupils per Computer in EL School
1.0 1.1 1.1 1.3 1.3 1.3 1.2
Number of Computers in Other School
102 504 347 443 405 2,314 4,115
Pupils Per Computer in Other Schools
0.9 1.1 1.8 1.1 1.0 1.1 1.1
2016-2017Number of Computers
in HS2,456 24,492 25,178 43,129 27,108 33,104 155,467
Pupils per Computer in HS
0.9 0.8 0.8 0.9 1.0 1.2 1.0
Number of Computers in Middle School/Jr High
School
906 6,447 12,226 34,032 23,263 30,864 107,738
Pupils per Computer in Middle School/Jr High
School
0.8 0.9 0.9 0.9 0.9 1.1 0.9
Number of Computers in EL School
4,346 22,492 24,912 45,483 41,753 56,113 195,099
Pupils per Computer in EL School
1.0 1.0 1.1 1.1 1.1 1.3 1.1
Number of Computers in Other Schools
110 384 302 332 427 2,438 3,993
Pupils Per Computer in Other Schools
0.7 1.5 2.1 1.0 0.6 1.0 1.1
The Annual Condition of Education Report 201794

BandwidthTable 4-34 shows bandwidth for public schools in Iowa by enrollment category. These ranges have changed from prior years, and now reach into the gigabit (1,000 megabits) realm. All but one of the largest districts have bandwidths greater than 100 megabits and 76 percent of the largest districts are in the gigabit range. Table 4-35 provides the number of buildings and bandwidth by school type within enrollment category. In contrast to computer accessibility, the percentage of schools with gigabit-level bandwidth decreases as the grade levels increase. Thirty percent of elementary schools reported bandwidth of gigabit or more while only 17 percent of high schools have such access.
Table 4-34
Bandwidth by Public School by District Enrollment Category
2016-2017
Source: Iowa Department of Education, Bureau of Information and Analysis, Basic Educational Data Survey.Note: Enrollment categories are based on Certified Enrollment.
Enrollment Category<300 300-599 600-999 1,000-2,499 2,500-7,499 7,500+ State
Total Number of Schools 69 243 251 313 173 254 1,303Internet not Available 0 3 7 0 0 0 10Bandwidth below 100
Megabits49 78 40 38 21 1 227
Bandwidth 100 to 200 Megabits
15 99 109 37 19 17 296
Bandwidth 200 to 1,000 Megabits
5 46 81 182 71 42 427
Bandwidth 1,000 to 10,000 Megabits
0 17 14 55 61 191 338
Bandwidth >10,000 Megabits
0 0 0 1 1 3 5
The Annual Condition of Education Report 201795

Table 4-35
Bandwidth for Public Schools by School Level Within Enrollment Category 2016-2017
Enrollment CategoryHigh Schools <300 300-599 600-999 1,000-2,499 2,500-7,499 7,500+ State
Total Number of Schools 20 93 80 77 23 27 320Internet not Available 0 1 0 0 0 0 1
Bandwidth below 100 Megabits 14 26 6 2 0 0 48Bandwidth 100 to 200 Megabits 4 40 41 12 2 2 101
Bandwidth 200 to 1,000 Megabits 2 20 28 49 12 5 116Bandwidth 1,000 to 10,000
Megabits0 6 5 14 8 17 50
Bandwidth >10,000 Megabits 0 0 0 0 1 3 4Middle/Jr High Schools
Total Number of Schools 10 37 54 76 28 46 251Internet not Available 0 1 0 0 0 0 1
Bandwidth below 100 Megabits 6 13 9 6 2 0 36Bandwidth 100 to 200 Megabits 3 12 21 10 1 4 51
Bandwidth 200 to 1,000 Megabits 1 7 21 45 15 7 96Bandwidth 1,000 to 10,000
Megabits0 4 3 14 10 35 66
Bandwidth >10,000 Megabits 0 0 0 1 0 0 1Elementary Schools
Total Number of Schools 38 111 110 150 118 170 697Internet not Available 0 1 7 0 0 0 8
Bandwidth below 100 Megabits 28 38 22 28 18 1 135Bandwidth 100 to 200 Megabits 8 46 45 15 16 11 141
Bandwidth 200 to 1,000 Megabits 2 19 30 83 42 29 205Bandwidth 1,000 to 10,000
Megabits0 7 6 24 42 129 208
Bandwidth >10,000 Megabits 0 0 0 0 0 0 0Other Schools
Total Number of Schools 1 2 7 10 4 11 35Internet not Available 0 0 0 0 0 0 0
Bandwidth below 100 Megabits 1 1 3 2 1 0 8Bandwidth 100 to 200 Megabits 0 1 2 0 0 0 3
Bandwidth 200 to 1,000 Megabits 0 0 2 5 2 1 10Bandwidth 1,000 to 10,000
Megabits0 0 0 3 1 10 14
Bandwidth >10,000 Megabits 0 0 0 0 0 0 0
Source: Iowa Department of Education, Bureau of Information and Analysis, Basic Educational Data Survey.Note: Enrollment categories are based on Certified Enrollment. Other schools include alternative and special schools.
The Annual Condition of Education Report 201796

Student PerformanceThe student performance chapter contains two major sections. The first section reports the State Indica-tors of Student Success data required by Iowa Administrative Code. Data from the Iowa Assessments are included. The second section provides achievement trends and student performance for all students by enrollment categories, gender, race/ethnicity, and other subgroups. Besides the Iowa Assessments results, results from the National Assessment of Educational Progress (NAEP), ACT, SAT, and Advanced Placement Assessments are included. In addition, Basic Educational Data Survey (BEDS) and the Student Reporting in Iowa (SRI) data provide information pertaining to dropouts for grades 7-12 and 9-12, high school gradua-tion rates, high school graduate intentions, postsecondary enrollment options for public school students, and suspension and expulsion data.
Since 2011-2012, Iowa Testing Programs introduced Forms E and F of the Iowa Assessments for Iowa schools. The Iowa Assessments were linked to the Iowa Tests of Basic Skills (ITBS) and Iowa Tests of Edu-cational Development (ITED), Forms A and B, through a national study. Proficiency cut scores for the Iowa Assessments are presented in Standard Score metric and are specific to grade, content, and time of year.
State Indicators of Student SuccessThe seven required state indicators for student success include:
1. The percentage of all fourth, eighth, and eleventh grade students achieving a proficient or higher reading status on the Iowa Assessments;
2. The percentage of all fourth, eighth, and eleventh grade students achieving a proficient or higher mathematics status on the Iowa Assessments;
3. The percentage of all eighth and eleventh grade students achieving a proficient or higher science status on the Iowa Assessments;
4. The percentage of students considered as dropouts for grades 7 through 12 and the percentage of high school students who graduate;
5. The percentage of high school seniors who intend to pursue postsecondary education/training;
6. The percentage of high school students achieving at the ACT national average score or above and the percentage of students achieving an ACT score of 20 or above; and
7. The percentage of high school graduates who complete a “core” high school program of four years of English-language arts and three or more years each of mathematics, science, and social studies (Iowa Administrative Code – 12.8(3))
Subgroup data are shown for gender, race/ethnicity, socioeconomic status (determined by eligibility for free or reduced price lunch), disability status (determined by the presence of an individualized education program – IEP), primary language status (determined by English language learner status), and migrant/non-migrant status (defined by Title I requirements). Separate tables show achievement level performance for students by gender, race/ethnicity, disability, socioeconomic, and primary language subgroups. These subgroups vary in size in a given biennium, and each varies in size from year to year. The subgroup data should not be averaged to obtain an overall value and will not match the data for the total grade group. Due to the data source change, the migrant student data are not available in the 2016 and 2017 annual reports.
The Annual Condition of Education Report 201797

Iowa Student Counts for Iowa Assessments Reading, Mathematics, and Science Test-Takers Including SubgroupsThree of the seven indicators requested by the State Board of Education are percent proficient for Iowa students in the selected grades in each subgroup on the Iowa Assessments in reading, mathematics, and science.
Since group size varies from one subgroup to another, it is important to consider the students tested by subgroup. The approximate number of students tested by grade (in grades 4, 8, and 11) and by subgroup for reading and mathematics for the biennium periods 2011-2013 through 2015-2017 are shown in Tables 5-1 and 5-2. Table 5-3 shows the approximate average number of grade 8 and 11 students tested by subgroup in science for the same three biennium periods. The number of students tested shown in Tables 5-1 to 5-3 include both public and nonpublic school participants. The students in the biennium analysis are those who enrolled for a full academic year (FAY), as well as those who were enrolled only part of the academic year in Iowa schools, plus some home-schooled students who took the Iowa Assessments in reading, mathematics, or science.
Table 5-1
Approximate Number of Iowa Students Tested on the Iowa Assessments Reading Tests by Subgroup Biennium Periods 2011-2013 to 2015-2017
Grade 4 2011-2013 2012-2014 2014-2016 2015-2017 Male 19,400 19,550 20,160 20,650
Female 18,620 18,790 19,310 19,710 African American 1,910 2,000 2,120 2,250 American Indian 170 170 150 150
Asian 880 900 900 910 Hispanic 3,500 3,640 4,150 4,380
White 30,430 30,330 30,540 30,920 ELL1 2,270 2,440 2,750 2,640
SES Eligible2 15,320 15,550 16,630 17,050 IEP3 4,590 4,580 4,660 4,870
The Annual Condition of Education Report 201798

Table 5-1 (…continued)
Source: Iowa Testing Programs, The University of Iowa. Notes: Number tested included both public and nonpublic students. 1English Language Learner (ELL) refers to a student who has a language other than English and the proficiency in English
is such that the probability of the student’s academic success in an English-only classroom is below that of an academi-cally successful peer with an English language background.
2SES refers to socioeconomic status as determined by eligibility for free or reduced price meals. 3IEP indicates special education status, students with IEPs are classified as special education students.
Grade 8 2011-2013 2012-2014 2014-2016 2015-2017 Male 19,370 19,580 19,460 19,620
Female 18,470 18,600 18,640 18,770 African American 1,850 1,910 1,950 2,030 American Indian 180 170 170 160
Asian 760 820 870 950 Hispanic 3,050 3,270 3,540 3,750
White 31,010 30,910 30,300 30,190 ELL1 1,150 1,280 1,410 1,540
SES Eligible2 13,880 14,220 14,360 14,530 IEP3 4,560 4,530 4,340 4,350
Grade 11 2011-2013 2012-2014 2014-2016 2015-2017 Male 18,380 18,490 18,470 18,630
Female 17,620 17,570 17,760 17,830 African American 1,500 1,600 1,720 1,780 American Indian 170 160 150 130
Asian 790 850 880 940 Hispanic 2,540 2,690 2,990 3,220
White 30,230 29,910 29,520 29,320 ELL1 830 860 890 1,060
SES Eligible2 10,960 11,270 11,580 11,840 IEP3 3,770 3,730 3,540 3,470
The Annual Condition of Education Report 201799

Table 5-2
Approximate Number of Iowa Students Tested on the Iowa Assessments Mathematics Tests by Subgroup
Biennium Periods 2011-2013 to 2015-2017
Grade 4 2011-2013 2012-2014 2014-2016 2015-2017 Male 19,410 19,570 20,190 20,690
Female 18,630 18,800 19,330 19,740 African American 1,910 2,000 2,130 2,280 American Indian 170 170 150 150
Asian 890 910 910 930 Hispanic 3,510 3,660 4,170 4,410
White 30,440 30,340 30,540 30,920 ELL1 2,280 2,470 2,800 2,710
SES Eligible2 15,340 15,580 16,670 17,110 IEP3 4,600 4,590 4,660 4,870
Grade 8 2011-2013 2012-2014 2014-2016 2015-2017 Male 19,380 19,590 19,470 19,620
Female 18,480 18,610 18,650 18,770 African American 1,850 1,910 1,960 2,040 American Indian 180 170 170 160
Asian 770 830 880 950 Hispanic 3,060 3,290 3,560 3,750
White 31,020 30,910 30,300 30,180 ELL1 1,180 1,300 1,440 1,570
SES Eligible2 13,910 14,230 14,390 14,540 IEP3 4,570 4,520 4,340 4,350
The Annual Condition of Education Report 2017100

Table 5-2 (…continued)
Source: Iowa Testing Programs, The University of Iowa. Notes: Number tested included both public and nonpublic students.
1English language learner (ELL) refers to a student who has a language other than English and the proficiency in English is such that the probability of the student’s academic success in an English-only classroom is below that of an academi-cally successful peer with an English language background. 2SES refers to socioeconomic status as determined by eligibility for free or reduced price meals. 3IEP indicates special education status, students with IEPs are classified as special education students.
Grade 11 2011-2013 2012-2014 2014-2016 2015-2017 Male 18,380 18,490 18,420 18,640
Female 17,620 17,560 17,690 17,830 African American 1,500 1,590 1,720 1,790 American Indian 170 160 150 130
Asian 790 860 890 950 Hispanic 2,540 2,700 3,000 3,220
White 30,230 29,900 29,400 29,310 ELL1 850 870 910 1,080
SES Eligible2 10,950 11,270 11,540 11,850 IEP3 3,770 3,730 3,510 3,460
The Annual Condition of Education Report 2017101

Table 5-3
Approximate Number of Iowa Students Tested on the Iowa Assessments Science Tests by Subgroup Biennium Periods 2011-2013 to 2015-2017
Source: Iowa Testing Programs, The University of Iowa. Notes: Number tested included both public and nonpublic students.
1English language learner (ELL) refers to a student who has a language other than English and the proficiency in English is such that the probability of the student’s academic success in an English-only classroom is below that of an academi-cally successful peer with an English language background. 2SES refers to socioeconomic status as determined by eligibility for free or reduced price meals. 3IEP indicates special education status, students with IEPs are classified as special education students.
Grade 8 2011-2013 2012-2014 2014-2016 2015-2017 Male 19,290 19,480 19,390 19,550
Female 18,400 18,500 18,570 18,690 African American 1,850 1,910 1,960 2,040 American Indian 180 170 170 160
Asian 770 830 880 960 Hispanic 3,060 3,280 3,560 3,770
White 30,850 30,710 30,120 30,010 ELL1 1,180 1,300 1,440 1,580
SES Eligible2 13,890 14,230 14,390 14,570 IEP3 4,560 4,530 4,350 4,360
Grade 11 2011-2013 2012-2014 2014-2016 2015-2017 Male 18,350 18,470 18,470 18,630
Female 17,600 17,550 17,740 17,810 African American 1,490 1,590 1,720 1,790 American Indian 170 160 150 130
Asian 790 860 890 950 Hispanic 2,540 2,700 3,000 3,220
White 30,200 29,880 29,490 29,290 ELL1 840 870 910 1,080
SES Eligible2 10,930 11,250 11,570 11,830 IEP3 3,760 3,730 3,520 3,460
The Annual Condition of Education Report 2017102

Reading
Indicator: Percentage of 4th, 8th, and 11th grade students achieving proficient or higher reading status on the Iowa Assessments Reading Tests (reported for all students and by gender, race/ethnicity, socioeconomic status, disability, and primary language status).
Figure 5-1
Percent of Iowa Fourth Grade Students Proficient on the Iowa Assessments Reading Tests Biennium Periods 2011-2013 to 2015-2017
74.6 75.4 76.0 76.0 75.3
0
20
40
60
80
100
2011-13 2012-14 2013-15 2014-16 2015-17
Per
cent
Biennium Periods
Source: Iowa Testing Programs, The University of Iowa.Notes: Percentages for each biennium period represent average percentages of proficient students for the two school years
represented, e.g., 2013-2015 represents the average for the 2013-2014 and the 2014-2015 school years. A student designated as proficient can, at a minimum, do the following: Usually understands factual information and new words in context. Usually is able to make inferences and interpret either nonliteral language or information in new contexts. Often can determine a selection’s main idea and analyze its style and structure.
The Annual Condition of Education Report 2017103
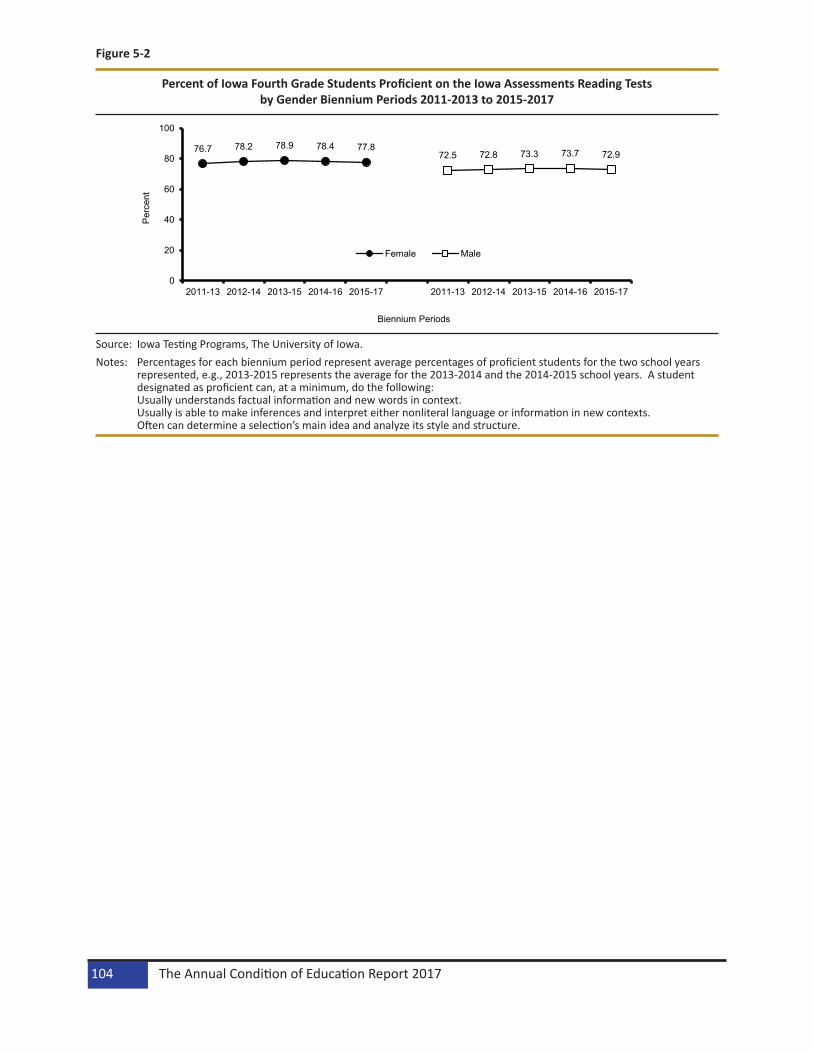
Figure 5-2
Percent of Iowa Fourth Grade Students Proficient on the Iowa Assessments Reading Tests by Gender Biennium Periods 2011-2013 to 2015-2017
76.7 78.2 78.9 78.4 77.872.5 72.8 73.3 73.7 72.9
0
20
40
60
80
100
2011-13 2012-14 2013-15 2014-16 2015-17 2011-13 2012-14 2013-15 2014-16 2015-17
Per
cent
Biennium Periods
Female Male
Source: Iowa Testing Programs, The University of Iowa.Notes: Percentages for each biennium period represent average percentages of proficient students for the two school years
represented, e.g., 2013-2015 represents the average for the 2013-2014 and the 2014-2015 school years. A student designated as proficient can, at a minimum, do the following: Usually understands factual information and new words in context. Usually is able to make inferences and interpret either nonliteral language or information in new contexts. Often can determine a selection’s main idea and analyze its style and structure.
The Annual Condition of Education Report 2017104

Figure 5-3
Percent of Iowa Fourth Grade Students Proficient on the Iowa Assessments Reading Tests by Race/Ethnicity Biennium Periods 2011-2013 to 2015-2017
46.5 48
.8
50.2
50.3
48.5
60.7
60.5
60.8 63
.1
59.0
73.9
74.3 76.2
77.5
77.4
57.3
57.7
57.3
56.8
57.6
78.7
79.5
80.5
80.6
80.1
0
20
40
60
80
100
2011
-13
2012
-14
2013
-15
2014
-16
2015
-17
2011
-13
2012
-14
2013
-15
2014
-16
2015
-17
2011
-13
2012
-14
2013
-15
2014
-16
2015
-17
2011
-13
2012
-14
2013
-15
2014
-16
2015
-17
2011
-13
2012
-14
2013
-15
2014
-16
2015
-17
Per
cent
Biennium Periods
African American American Indian Asian Hispanic White
Source: Iowa Testing Programs, The University of Iowa.Notes: Percentages for each biennium period represent average percentages of proficient students for the two school years
represented, e.g., 2013-2015 represents the average for the 2013-2014 and the 2014-2015 school years. A student designated as proficient can, at a minimum, do the following: Usually understands factual information and new words in context. Usually is able to make inferences and interpret either nonliteral language or information in new contexts. Often can determine a selection’s main idea and analyze its style and structure.
The Annual Condition of Education Report 2017105

Figure 5-4
Percent of Iowa Fourth Grade Students Proficient on the Iowa Assessments Reading Tests by Socioeconomic Status* Biennium Periods 2011-2013 to 2015-2017
83.5 84.2 84.8 85.1 84.8
61.4 62.5 63.5 63.5 62.3
0
20
40
60
80
100
2011-13 2012-14 2013-15 2014-16 2015-17
Per
cent
Biennium Periods
Not Eligible for Free or Reduced Price Meals
Eligible for Free or Reduced Price Meals
Source: Iowa Testing Programs, The University of Iowa.Notes: Percentages for each biennium period represent average percentages of proficient students for the two school years
represented, e.g., 2013-2015 represents the average for the 2013-2014 and the 2014-2015 school years. A student designated as proficient can, at a minimum, do the following: Usually understands factual information and new words in context. Usually is able to make inferences and interpret either nonliteral language or information in new contexts. Often can determine a selection’s main idea and analyze its style and structure. *Socioeconomic status is determined by eligibility for free or reduced price meals
The Annual Condition of Education Report 2017106

Figure 5-5
Percent of Iowa Fourth Grade Students Proficient on the Iowa Assessments Reading Tests by Disability Status* Biennium Periods 2011-2013 to 2015-2017
80.4 81.2 81.7 81.5 81.0
32.5 32.7 33.7 34.6 34.1
0
20
40
60
80
100
2011-13 2012-14 2013-15 2014-16 2015-17
Per
cent
Biennium Periods
No Disability
Disability
Source: Iowa Testing Programs, The University of Iowa.Notes: Percentages for each biennium period represent average percentages of proficient students for the two school years
represented, e.g., 2013-2015 represents the average for the 2013-2014 and the 2014-2015 school years. A student designated as proficient can, at a minimum, do the following: Usually understands factual information and new words in context. Usually is able to make inferences and interpret either nonliteral language or information in new contexts. Often can determine a selection’s main idea and analyze its style and structure. *Disability status is determined by the presence of an individualized education program (IEP).
The Annual Condition of Education Report 2017107

Figure 5-6
Percent of Iowa Fourth Grade Students Proficient on the Iowa Assessments Reading Tests by Primary Language Status* Biennium Periods 2011-2013 to 2015-2017
76.4 77.4 78.2 78.4 77.9
45.9 46.1 45.0 44.038.5
0
20
40
60
80
100
2011-13 2012-14 2013-15 2014-16 2015-17
Per
cent
Biennium Periods
Not ELL
ELL*
Source: Iowa Testing Programs, The University of Iowa.Notes: Percentages for each biennium period represent average percentages of proficient students for the two school years
represented, e.g., 2013-2015 represents the average for the 2013-2014 and the 2014-2015 school years. A student designated as proficient can, at a minimum, do the following: Usually understands factual information and new words in context. Usually is able to make inferences and interpret either nonliteral language or information in new contexts. Often can determine a selection’s main idea and analyze its style and structure. *Primary language status is classified by English and English language learner and determined according to the follow-ing definition: English language learner refers to a student who has a language other than English and the proficiency in English is such that the probability of the student’s academic success in an English-only classroom is below that of an academically successful peer with an English language background.
The Annual Condition of Education Report 2017108

Figure 5-7
Percent of Iowa Eighth Grade Students Proficient on the Iowa Assessments Reading Tests Biennium Periods 2011-2013 to 2015-2017
65.870.4
75.5 75.7 75.5
0
20
40
60
80
100
2011-13 2012-14 2013-15 2014-16 2015-17
Per
cent
Biennium Periods
Source: Iowa Testing Programs, The University of Iowa.Notes: Percentages for each biennium period represent average percentages of proficient students for the two school years
represented, e.g., 2013-2015 represents the average for the 2013-2014 and the 2014-2015 school years. A student designated as proficient can, at a minimum, do the following: Usually is able to make inferences and interpret either nonliteral language or information in new contexts. Often is able to determine a selection’s main idea, identify the author’s purpose or viewpoint, and analyze its style and structure.
The Annual Condition of Education Report 2017109

Figure 5-8
Percent of Iowa Eighth Grade Students Proficient on the Iowa Assessments Reading Tests by Gender Biennium Periods 2011-2013 to 2015-2017
68.273.1
78.1 78.4 78.8
63.567.9
72.9 73.0 72.4
0
20
40
60
80
100
2011-13 2012-14 2013-15 2014-16 2015-17 2011-13 2012-14 2013-15 2014-16 2015-17
Per
cent
Biennium Periods
Female Male
Source: Iowa Testing Programs, The University of Iowa.Notes: Percentages for each biennium period represent average percentages of proficient students for the two school years
represented, e.g., 2013-2015 represents the average for the 2013-2014 and the 2014-2015 school years. A student designated as proficient can, at a minimum, do the following: Usually is able to make inferences and interpret either nonliteral language or information in new contexts. Often is able to determine a selection’s main idea, identify the author’s purpose or viewpoint, and analyze its style and structure.
The Annual Condition of Education Report 2017110

Figure 5-9
Percent of Iowa Eighth Grade Students Proficient on the Iowa Assessments Reading Tests by Race/Ethnicity Biennium Periods 2011-2013 to 2015-2017
36.9 42
.0 46.7
46.7
46.9
45.6 50
.1 59.1
60.2
62.3 66
.3 70.9 74
.9
75.6
77.8
46.1 53
.3 61.9
62.8
62.9 69
.8 74.3 79
.0
79.4
79.3
0
20
40
60
80
10020
11-1
3
2012
-14
2013
-15
2014
-16
2015
-17
2011
-13
2012
-14
2013
-15
2014
-16
2015
-17
2011
-13
2012
-14
2013
-15
2014
-16
2015
-17
2011
-13
2012
-14
2013
-15
2014
-16
2015
-17
2011
-13
2012
-14
2013
-15
2014
-16
2015
-17
Per
cent
Biennium Periods
African American American Indian Asian Hispanic White
Source: Iowa Testing Programs, The University of Iowa.Notes: Percentages for each biennium period represent average percentages of proficient students for the two school years
represented, e.g., 2013-2015 represents the average for the 2013-2014 and the 2014-2015 school years. A student designated as proficient can, at a minimum, do the following: Usually is able to make inferences and interpret either nonliteral language or information in new contexts. Often is able to determine a selection’s main idea, identify the author’s purpose or viewpoint, and analyze its style and structure.
The Annual Condition of Education Report 2017111

Figure 5-10
Percent of Iowa Eighth Grade Students Proficient on the Iowa Assessments Reading Tests by Socioeconomic Status* Biennium Periods 2011-2013 to 2015-2017
75.579.7
83.9 84.3 84.3
49.254.8
61.3 61.6 61.0
0
20
40
60
80
100
2011-13 2012-14 2013-15 2014-16 2015-17
Per
cent
Biennium Periods
Not Eligible for Free or Reduced Price MealsEligible for Free or Reduced Price Meals
Source: Iowa Testing Programs, The University of Iowa.Notes: Percentages for each biennium period represent average percentages of proficient students for the two school years
represented, e.g., 2013-2015 represents the average for the 2013-2014 and the 2014-2015 school years. A student designated as proficient can, at a minimum, do the following: Usually is able to make inferences and interpret either nonliteral language or information in new contexts. Often is able to determine a selection’s main idea, identify the author’s purpose or viewpoint, and analyze its style and structure. *Socioeconomic status is determined by eligibility for free or reduced price meals.
The Annual Condition of Education Report 2017112

Figure 5-11
Percent of Iowa Eighth Grade Students Proficient on the Iowa Assessments Reading Tests by Disability Status* Biennium Periods 2011-2013 to 2015-2017
72.576.9
81.9 82.0 81.7
17.222.0
26.8 26.5 26.6
0
20
40
60
80
100
2011-13 2012-14 2013-15 2014-16 2015-17
Per
cent
Biennium Periods
No Disability
Disability
Source: Iowa Testing Programs, The University of Iowa.Notes: Percentages for each biennium period represent average percentages of proficient students for the two school years
represented, e.g., 2013-2015 represents the average for the 2013-2014 and the 2014-2015 school years. A student designated as proficient can, at a minimum, do the following: Usually is able to make inferences and interpret either nonliteral language or information in new contexts. Often is able to determine a selection’s main idea, identify the author’s purpose or viewpoint, and analyze its style and structure. *Disability status is determined by the presence of an individualized education program (IEP).
The Annual Condition of Education Report 2017113

Figure 5-12
Percent of Iowa Eighth Grade Students Proficient on the Iowa Assessments Reading Tests by Primary Language Status* Biennium Periods 2011-2013 to 2015-2017
67.372.0
77.0 77.4 77.4
17.824.6
33.0 32.1 30.1
0
20
40
60
80
100
2011-13 2012-14 2013-15 2014-16 2015-17
Per
cent
Biennium Periods
Not ELL ELL*
Source: Iowa Testing Programs, The University of Iowa.Notes: Percentages for each biennium period represent average percentages of proficient students for the two school years
represented, e.g., 2013-2015 represents the average for the 2013-2014 and the 2014-2015 school years. A student designated as proficient can, at a minimum, do the following: Usually is able to make inferences and interpret either nonliteral language or information in new contexts. Often is able to determine a selection’s main idea, identify the author’s purpose or viewpoint, and analyze its style and structure. *Primary language status is classified by English and English language learner and determined according to the follow-ing definition: English language learner refers to a student who has a language other than English and the proficiency in English is such that the probability of the student’s academic success in an English-only classroom is below that of an academically successful peer with an English language background.
The Annual Condition of Education Report 2017114

Figure 5-13
Percent of Iowa Eleventh Grade Students Proficient on the Iowa Assessments Reading Tests Biennium Periods 2011-2013 to 2015-2017
82.7 80.9 79.7 79.4 78.6
0
20
40
60
80
100
2011-13 2012-14 2013-15 2014-16 2015-17
Per
cent
Biennium Periods
Source: Iowa Testing Programs, The University of Iowa.Notes: Percentages for each biennium period represent average percentages of proficient students for the two school years
represented, e.g., 2013-2015 represents the average for the 2013-2014 and the 2014-2015 school years. A student designated as proficient can, at a minimum, do the following: Usually understands stated information and ideas; often is able to infer implied meaning, draw conclusions, and interpret nonliteral language; and usually is able to make generalizations from or about a text, identify its authors purpose or viewpoint, and evaluate aspects of its style or structure.
Figure 5-14
Percent of Iowa Eleventh Grade Students Proficient on Iowa Assessments Reading Tests by Gender Biennium Periods 2011-2013 to 2015-2017
86.6 84.2 82.2 82.2 81.7 79.0 77.8 77.3 76.6 75.6
0
20
40
60
80
100
2011-13 2012-14 2013-15 2014-16 2015-17 2011-13 2012-14 2013-15 2014-16 2015-17
Per
cent
Biennium Periods
Female Male
Source: Iowa Testing Programs, The University of Iowa.Notes: Percentages for each biennium period represent average percentages of proficient students for the two school years
represented, e.g., 2013-2015 represents the average for the 2013-2014 and the 2014-2015 school years. A student designated as proficient can, at a minimum, do the following: Usually understands stated information and ideas; often is able to infer implied meaning, draw conclusions, and interpret nonliteral language; and usually is able to make generalizations from or about a text, identify its authors purpose or viewpoint, and evaluate aspects of its style or structure.
The Annual Condition of Education Report 2017115

Figure 5-15
Percent of Iowa Eleventh Grade Students Proficient on the Iowa Assessments Reading Tests by Race/Ethnicity Biennium Periods 2011-2013 to 2015-2017
59.4
54.2
50.2
49.6
49.5
74.6
71.5
70.1
67.1
63.7
74.7
74.3
73.2
73.2
73.8
69.3
67.5
65.1
64.3
63.5
85.4
84.0
83.1
83.1
82.5
0
20
40
60
80
10020
11-1
3
2012
-14
2013
-15
2014
-16
2015
-17
2011
-13
2012
-14
2013
-15
2014
-16
2015
-17
2011
-13
2012
-14
2013
-15
2014
-16
2015
-17
2011
-13
2012
-14
2013
-15
2014
-16
2015
-17
2011
-13
2012
-14
2013
-15
2014
-16
2015
-17
Per
cent
Biennium Periods
African American American Indian Asian Hispanic White
Source: Iowa Testing Programs, The University of Iowa.Notes: Percentages for each biennium period represent average percentages of proficient students for the two school years
represented, e.g., 2013-2015 represents the average for the 2013-2014 and the 2014-2015 school years. A student designated as proficient can, at a minimum, do the following: Usually understands stated information and ideas; often is able to infer implied meaning, draw conclusions, and interpret nonliteral language; and usually is able to make generalizations from or about a text, identify its authors purpose or viewpoint, and evaluate aspects of its style or structure.
The Annual Condition of Education Report 2017116

Figure 5-16
Percent of Iowa Eleventh Grade Students Proficient on the Iowa Assessments Reading Tests by Socioeconomic Status* Biennium Periods 2011-2013 to 2015-2017
88.6 87.5 86.6 86.3 85.9
69.3 66.5 64.7 64.5 63.4
0
20
40
60
80
100
2011-13 2012-14 2013-15 2014-16 2015-17
Per
cent
Biennium Periods
Not Eligible for Free or Reduced Price Meals
Eligible for Free or Reduced Price Meals
Source: Iowa Testing Programs, The University of Iowa.Notes: Percentages for each biennium period represent average percentages of proficient students for the two school years
represented, e.g., 2013-2015 represents the average for the 2013-2014 and the 2014-2015 school years. A student designated as proficient can, at a minimum, do the following: Usually understands stated information and ideas; often is able to infer implied meaning, draw conclusions, and interpret nonliteral language; and usually is able to make generalizations from or about a text, identify its authors purpose or viewpoint, and evaluate aspects of its style or structure. *Socioeconomic status is determined by eligibility for free or reduced price meals.
The Annual Condition of Education Report 2017117

Figure 5-17
Percent of Iowa Eleventh Grade Students Proficient on the Iowa Assessments Reading Tests by Disability Status* Biennium Periods 2011-2013 to 2015-2017
88.2 86.5 85.3 84.7 83.9
35.832.5 30.4 29.7 28.6
0
20
40
60
80
100
2011-13 2012-14 2013-15 2014-16 2015-17
Per
cent
Biennium Periods
No Disability
Disability
Source: Iowa Testing Programs, The University of Iowa.Notes: Percentages for each biennium period represent average percentages of proficient students for the two school years
represented, e.g., 2013-2015 represents the average for the 2013-2014 and the 2014-2015 school years. A student designated as proficient can, at a minimum, do the following: Usually understands stated information and ideas; often is able to infer implied meaning, draw conclusions, and interpret nonliteral language; and usually is able to make generalizations from or about a text, identify its authors purpose or viewpoint, and evaluate aspects of its style or structure. *Disability status is determined by the presence of an individualized education program (IEP).
The Annual Condition of Education Report 2017118

Figure 5-18
Percent of Iowa Eleventh Grade Students Proficient on the Iowa Assessments Reading Tests by Primary Language Status* Biennium Periods 2011-2013 to 2015-2017
83.9 82.1 81.0 80.8 80.3
33.8 31.327.2
23.9 22.1
0
20
40
60
80
100
2011-13 2012-14 2013-15 2014-16 2015-17
Per
cent
Biennium Periods
Not ELL ELL*
Source: Iowa Testing Programs, The University of Iowa.Notes: Percentages for each biennium period represent average percentages of proficient students for the two school years
represented, e.g., 2013-2015 represents the average for the 2013-2014 and the 2014-2015 school years. A student designated as proficient can, at a minimum, do the following: Usually understands stated information and ideas; often is able to infer implied meaning, draw conclusions, and interpret nonliteral language; and usually is able to make generalizations from or about a text, identify its authors purpose or viewpoint, and evaluate aspects of its style or structure. *Primary language status is classified by English and English language learner and determined according to the follow-ing definition: English language learner refers to a student who has a language other than English and the proficiency in English is such that the probability of the student’s academic success in an English-only classroom is below that of an academically successful peer with an English language.
The Annual Condition of Education Report 2017119

Mathematics
Indicator: Percentage of 4th, 8th, and 11th grade students achieving proficient or higher mathematics status on the Iowa Assessments Mathematics Tests (reported for all students and by gender, race/ethnicity, socioeconomic status, disability, and primary language status).
Figure 5-19
Percent of Iowa Fourth Grade Students Proficient on the Iowa Assessments Mathematics Tests Biennium Periods 2011-2013 to 2015-2017
77.8 78.8 79.5 79.2 78.3
0
20
40
60
80
100
2011-13 2012-14 2013-15 2014-16 2015-17
Per
cent
Biennium Periods
Source: Iowa Testing Programs, The University of Iowa.Notes: Percentages for each biennium period represent average percentages of proficient students for the two school years
represented, e.g., 2013-2015 represents the average for the 2013-2014 and the 2014-2015 school years. A student designated as proficient can, at a minimum, do the following: Is developing an understanding of many math concepts; usually is able to solve simple and complex word problems and use estimation methods; and can interpret data from graphs and tables.
The Annual Condition of Education Report 2017120

Figure 5-20
Percent of Iowa Fourth Grade Students Proficient on the Iowa Assessments Mathematics Tests by Gender Biennium Periods 2011-2013 to 2015-2017
77.4 78.0 78.0 77.5 76.7 78.2 79.6 80.9 80.8 79.9
0
20
40
60
80
100
2011-13 2012-14 2013-15 2014-16 2015-17 2011-13 2012-14 2013-15 2014-16 2015-17
Per
cent
Biennium Periods
Female Male
Source: Iowa Testing Programs, The University of Iowa.Notes: Percentages for each biennium period represent average percentages of proficient students for the two school years
represented, e.g., 2013-2015 represents the average for the 2013-2014 and the 2014-2015 school years. A student designated as proficient can, at a minimum, do the following: Is developing an understanding of many math concepts; usually is able to solve simple and complex word problems and use estimation methods; and can interpret data from graphs and tables.
The Annual Condition of Education Report 2017121

Figure 5-21
Percent of Iowa Fourth Grade Students Proficient on the Iowa Assessments Mathematics Tests by Race/Ethnicity Biennium Periods 2011-2013 to 2015-2017
48.2
49.7
50.4
49.9
47.9
63.1 66
.2
66.2
64.7
63.8
81.7
82.7
83.2
82.3
81.9
65.1
65.7
64.7
63.2
63.0
81.4
82.6
83.7
83.8
83.1
0
20
40
60
80
100
2011
-13
2012
-14
2013
-15
2014
-16
2015
-17
2011
-13
2012
-14
2013
-15
2014
-16
2015
-17
2011
-13
2012
-14
2013
-15
2014
-16
2015
-17
2011
-13
2012
-14
2013
-15
2014
-16
2015
-17
2011
-13
2012
-14
2013
-15
2014
-16
2015
-17
Per
cent
Biennium Periods
African American American Indian Asian Hispanic White
Source: Iowa Testing Programs, The University of Iowa.Notes: Percentages for each biennium period represent average percentages of proficient students for the two school years
represented, e.g., 2013-2015 represents the average for the 2013-2014 and the 2014-2015 school years. A student designated as proficient can, at a minimum, do the following: Is developing an understanding of many math concepts; usually is able to solve simple and complex word problems and use estimation methods; and can interpret data from graphs and tables.
The Annual Condition of Education Report 2017122

Figure 5-22
Percent of Iowa Fourth Grade Students Proficient on the Iowa Assessments Mathematics Tests by Socioeconomic Status* Biennium Periods 2011-2013 to 2015-2017
6
85.5 86.7 87.8 88.1 87.5
66.4 67.3 67.7 67.0 65.8
0
20
40
60
80
100
2011-13 2012-14 2013-15 2014-16 2015-17
Per
cent
Biennium Periods
Not Eligible for Free or Reduced Price Meals
Eligible for Free or Reduced Price Meals
Source: Iowa Testing Programs, The University of Iowa.Notes: Percentages for each biennium period represent average percentages of proficient students for the two school years
represented, e.g., 2013-2015 represents the average for the 2013-2014 and the 2014-2015 school years. A student designated as proficient can, at a minimum, do the following: Is developing an understanding of many math concepts; usually is able to solve simple and complex word problems and use estimation methods; and can interpret data from graphs and tables. *Socioeconomic status is determined by eligibility for free or reduced price meals.
The Annual Condition of Education Report 2017123

Figure 5-23
Percent of Iowa Fourth Grade Students Proficient on the Iowa Assessments Mathematics Tests by Disability Status* Biennium Periods 2011-2013 to 2015-2017
82.4 83.5 84.1 83.7 82.9
44.5 44.1 45.0 45.7 45.0
0
20
40
60
80
100
2011-13 2012-14 2013-15 2014-16 2015-17
Per
cent
Biennium Periods
No Disability
Disability
Source: Iowa Testing Programs, The University of Iowa.Notes: Percentages for each biennium period represent average percentages of proficient students for the two school years
represented, e.g., 2013-2015 represents the average for the 2013-2014 and the 2014-2015 school years. A student designated as proficient can, at a minimum, do the following: Is developing an understanding of many math concepts; usually is able to solve simple and complex word problems and use estimation methods; and can interpret data from graphs and tables. *Disability status is determined by the presence of an individualized education program (IEP).
.
The Annual Condition of Education Report 2017124

Figure 5-24
Percent of Iowa Fourth Grade Students Proficient on the Iowa Assessments Mathematics Tests by Primary Language Status* Biennium Periods 2011-2013 to 2015-2017
79.0 80.2 81.2 81.0 80.4
59.1 58.6 56.3 54.949.8
0
20
40
60
80
100
2011-13 2012-14 2013-15 2014-16 2015-17
Per
cent
Biennium Periods
Not ELL ELL*
Source: Iowa Testing Programs, The University of Iowa.Notes: Percentages for each biennium period represent average percentages of proficient students for the two school years
represented, e.g., 2013-2015 represents the average for the 2013-2014 and the 2014-2015 school years. A student designated as proficient can, at a minimum, do the following: Is developing an understanding of many math concepts; usually is able to solve simple and complex word problems and use estimation methods; and can interpret data from graphs and tables. *Primary language status is classified by English and English language learner and determined according to the follow-ing definition: English language learner refers to a student who has a language other than English and the proficiency in English is such that the probability of the student’s academic success in an English-only classroom is below that of an academically successful peer with an English language background.
The Annual Condition of Education Report 2017125

Figure 5-25
Percent of Iowa Eighth Grade Students Proficient on the Iowa Assessments Mathematics Tests Biennium Periods 2011-2013 to 2015-2017
73.9 74.7 76.1 76.1 75.4
0
20
40
60
80
100
2011-13 2012-14 2013-15 2014-16 2015-17
Per
cent
Biennium Periods
Source: Iowa Testing Programs, The University of Iowa.Notes: Percentages for each biennium period represent average percentages of proficient students for the two school years
represented, e.g., 2013-2015 represents the average for the 2013-2014 and the 2014-2015 school years. A student designated as proficient can, at a minimum, do the following: Usually can understand math concepts and solve simple and complex word problems, sometimes can use estimation methods, and usually is able to interpret data from graphs and tables.
Figure 5-26
Percent of Iowa Eighth Grade Students Proficient on the Iowa Assessments Mathematics Tests by Gender Biennium Periods 2011-2013 and 2015-2017
74.2 75.3 76.8 76.9 76.2 73.7 74.1 75.3 75.2 74.7
0
20
40
60
80
100
2011-13 2012-14 2013-15 2014-16 2015-17 2011-13 2012-14 2013-15 2014-16 2015-17
Per
cent
Biennium Periods
Female Male
Source: Iowa Testing Programs, The University of Iowa.Notes: Percentages for each biennium period represent average percentages of proficient students for the two school years
represented, e.g., 2013-2015 represents the average for the 2013-2014 and the 2014-2015 school years. A student designated as proficient can, at a minimum, do the following: Usually can understand math concepts and solve simple and complex word problems, sometimes can use estimation methods, and usually is able to interpret data from graphs and tables.
The Annual Condition of Education Report 2017126

Figure 5-27
Percent of Iowa Eighth Grade Students Proficient on the Iowa Assessments Mathematics Tests by Race/Ethnicity Biennium Periods 2011-2013 to 2015-2017
41.4
42.1
42.3
40.6
39.0
50.9
52.6 57
.8
55.3
51.7
80.6
81.0
80.9
80.1
79.8
54.9
56.4 59
.2
60.4
59.3
78.0
78.9
80.4
80.6
80.3
0
20
40
60
80
10020
11-1
3
2012
-14
2013
-15
2014
-16
2015
-17
2011
-13
2012
-14
2013
-15
2014
-16
2015
-17
2011
-13
2012
-14
2013
-15
2014
-16
2015
-17
2011
-13
2012
-14
2013
-15
2014
-16
2015
-17
2011
-13
2012
-14
2013
-15
2014
-16
2015
-17
Per
cent
Biennium Periods
African American American Indian Asian Hispanic White
Source: Iowa Testing Programs, The University of Iowa.Notes: Percentages for each biennium period represent average percentages of proficient students for the two school years
represented, e.g., 2013-2015 represents the average for the 2013-2014 and the 2014-2015 school years. A student designated as proficient can, at a minimum, do the following: Usually can understand math concepts and solve simple and complex word problems, sometimes can use estimation methods, and usually is able to interpret data from graphs and tables.
The Annual Condition of Education Report 2017127

Figure 5-28
Percent of Iowa Eighth Grade Students Proficient on the Iowa Assessments Mathematics Tests by Socioeconomic Status* Biennium Periods 2011-2013 to 2015-2017
83.4 84.2 85.2 85.3 85.2
57.7 58.7 60.8 60.8 59.5
0
20
40
60
80
100
2011-13 2012-14 2013-15 2014-16 2015-17
Per
cent
Biennium Periods
Not Eligible for Free or Reduced Price Meals
Eligible for Free or Reduced Price Meals
Source: Iowa Testing Programs, The University of Iowa.Notes: Percentages for each biennium period represent average percentages of proficient students for the two school years
represented, e.g., 2013-2015 represents the average for the 2013-2014 and the 2014-2015 school years. A student designated as proficient can, at a minimum, do the following: Usually can understand math concepts and solve simple and complex word problems, sometimes can use estimation methods, and usually is able to interpret data from graphs and tables. *Socioeconomic status is determined by eligibility for free or reduced price meals.
The Annual Condition of Education Report 2017128

Figure 5-29
Percent of Iowa Eighth Grade Students Proficient on the Iowa Assessments Mathematics Tests by Disability Status* Biennium Periods 2011-2013 to 2015-2017
80.6 81.1 82.3 82.2 81.6
25.2 26.9 28.6 28.1 27.3
0
20
40
60
80
100
2011-13 2012-14 2013-15 2014-16 2015-17
Per
cent
Biennium Periods
No Disability
Disability
Source: Iowa Testing Programs, The University of Iowa.Notes: Percentages for each biennium period represent average percentages of proficient students for the two school years
represented, e.g., 2013-2015 represents the average for the 2013-2014 and the 2014-2015 school years. A student designated as proficient can, at a minimum, do the following: Usually can understand math concepts and solve simple and complex word problems, sometimes can use estimation methods, and usually is able to interpret data from graphs and tables. *Disability status is determined by the presence of an individualized education program (IEP).
The Annual Condition of Education Report 2017129

Figure 5-30
Percent of Iowa Eighth Grade Students Proficient on the Iowa Assessments Mathematics Tests by Primary Language Status* Biennium Periods 2011-2013 to 2015-2017
75.2 76.2 77.6 77.7 77.3
33.2 33.7 36.0 35.1 32.4
0
20
40
60
80
100
2011-13 2012-14 2013-15 2014-16 2015-17
Per
cent
Biennium Periods
Not ELL ELL*
Source: Iowa Testing Programs, The University of Iowa.Notes: Percentages for each biennium period represent average percentages of proficient students for the two school years
represented, e.g., 2013-2015 represents the average for the 2013-2014 and the 2014-2015 school years. A student designated as proficient can, at a minimum, do the following: Usually can understand math concepts and solve simple and complex word problems, sometimes can use estimation methods, and usually is able to interpret data from graphs and tables. *Primary language status is classified by English and English language learner and determined according to the follow-ing definition: English language learner refers to a student who has a language other than English and the proficiency in English is such that the probability of the student’s academic success in an English-only classroom is below that of an academically successful peer with an English language background.
The Annual Condition of Education Report 2017130

Figure 5-31
Percent of Iowa Eleventh Grade Students Proficient on the Iowa Assessments Mathematics Tests Biennium Periods 2011-2013 to 2015-2017
81.7 82.6 83.8 83.8 82.5
0
20
40
60
80
100
2011-13 2012-14 2013-15 2014-16 2015-17
Per
cent
Biennium Periods
Source: Iowa Testing Programs, The University of Iowa.Notes: Percentages for each biennium period represent average percentages of proficient students for the two school years
represented, e.g., 2013-2015 represents the average for the 2013-2014 and the 2014-2015 school years. A student designated as proficient can, at a minimum, do the following: Sometimes applies math concepts and procedures, makes inferences with quantitative information, and solves a variety of quantitative reasoning problems.
Figure 5-32
Percent of Iowa Eleventh Grade Students Proficient on the Iowa Assessments Mathematics Tests by Gender Biennium Periods 2011-2013 to 2015-2017
81.7 83.1 84.6 84.2 83.5 81.7 82.2 83.1 82.2 81.5
0
20
40
60
80
100
2011-13 2012-14 2013-15 2014-16 2015-17 2011-13 2012-14 2013-15 2014-16 2015-17
Per
cent
Biennium Periods
Female Male
Source: Iowa Testing Programs, The University of Iowa.Notes: Percentages for each biennium period represent average percentages of proficient students for the two school years
represented, e.g., 2013-2015 represents the average for the 2013-2014 and the 2014-2015 school years. A student designated as proficient can, at a minimum, do the following: Sometimes applies math concepts and procedures, makes inferences with quantitative information, and solves a variety of quantitative reasoning problems.
The Annual Condition of Education Report 2017131

Figure 5-33
Percent of Iowa Eleventh Grade Students Proficient on the Iowa Assessments Mathematics Tests by Race/Ethnicity Biennium Periods 2011-2013 to 2015-2017
53.4
53.2
54.7
54.4
52.8
66.4 69
.0 73.9
67.3
65.7
81.0 82.7 84.6
84.1
83.5
65.1 68
.5 70.7
69.6
68.9
84.8
85.9
87.0
86.5
86.1
0
20
40
60
80
100
2011
-13
2012
-14
2013
-15
2014
-16
2015
-17
2011
-13
2012
-14
2013
-15
2014
-16
2015
-17
2011
-13
2012
-14
2013
-15
2014
-16
2015
-17
2011
-13
2012
-14
2013
-15
2014
-16
2015
-17
2011
-13
2012
-14
2013
-15
2014
-16
2015
-17
Per
cent
Biennium Periods
African American American Indian Asian Hispanic White
Source: Iowa Testing Programs, The University of Iowa.Notes: Percentages for each biennium period represent average percentages of proficient students for the two school years
represented, e.g., 2013-2015 represents the average for the 2013-2014 and the 2014-2015 school years. A student designated as proficient can, at a minimum, do the following: Sometimes applies math concepts and procedures, makes inferences with quantitative information, and solves a variety of quantitative reasoning problems.
The Annual Condition of Education Report 2017132

Figure 5-34
Percent of Iowa Eleventh Grade Students Proficient on the Iowa Assessments Mathematics Tests by Socioeconomic Status* Biennium Periods 2011-2013 to 2015-2017
88.1 89.0 89.9 89.6 89.3
67.0 68.6 70.7 69.4 68.3
0
20
40
60
80
100
2011-13 2012-14 2013-15 2014-16 2015-17
Per
cent
Biennium Periods
Not Eligible for Free or Reduced Price Meals
Eligible for Free or Reduced Price Meals
Source: Iowa Testing Programs, The University of Iowa.Notes: Percentages for each biennium period represent average percentages of proficient students for the two school years
represented, e.g., 2013-2015 represents the average for the 2013-2014 and the 2014-2015 school years. A student designated as proficient can, at a minimum, do the following: Sometimes applies math concepts and procedures, makes inferences with quantitative information, and solves a variety of quantitative reasoning problems. *Socioeconomic status is determined by eligibility for free or reduced price meals.
Figure 5-35
Percent of Iowa Eleventh Grade Students Proficient on the Iowa Assessments Mathematics Tests by Disability Status* Biennium Periods 2011-2013 to 2015-2017
86.3 87.3 88.5 87.7 86.9
42.0 42.2 42.5 40.9 39.8
0
20
40
60
80
100
2011-13 2012-14 2013-15 2014-16 2015-17
Per
cent
Biennium Periods
No Disability
Disability
Source: Iowa Testing Programs, The University of Iowa.Notes: Percentages for each biennium period represent average percentages of proficient students for the two school years
represented, e.g., 2013-2015 represents the average for the 2013-2014 and the 2014-2015 school years. A student designated as proficient can, at a minimum, do the following: Sometimes applies math concepts and procedures, makes inferences with quantitative information, and solves a variety of quantitative reasoning problems. *Disability status is determined by the presence of an individualized education program (IEP).
The Annual Condition of Education Report 2017133

Figure 5-36
Percent of Iowa Eleventh Grade Students Proficient on the Iowa Assessments Mathematics Tests by Primary Language Status* Biennium Periods 2011-2013 to 2015-2017
82.6 83.6 84.8 84.2 83.8
42.8 44.1 46.141.9
37.7
0
20
40
60
80
100
2011-13 2012-14 2013-15 2014-16 2015-17
Per
cent
Biennium Periods
Not ELL ELL*
Source: Iowa Testing Programs, The University of Iowa.Notes: Percentages for each biennium period represent average percentages of proficient students for the two school years
represented, e.g., 2013-2015 represents the average for the 2013-2014 and the 2014-2015 school years. A student designated as proficient can, at a minimum, do the following: Sometimes applies math concepts and procedures, makes inferences with quantitative information, and solves a variety of quantitative reasoning problems. *Primary language status is classified by English and English language learner and determined according to the follow-ing definition: English language learner refers to a student who has a language other than English and the proficiency in English is such that the probability of the student’s academic success in an English-only classroom is below that of an academically successful peer with an English language background.
The Annual Condition of Education Report 2017134

Science
Indicator: Percentage of 8th and 11th grade students achieving proficient or higher science status on the Iowa Assessments Science Tests (reported for all students and by gender, race/ethnicity, socioeco-nomic status, disability, and primary language status).
Figure 5-37
Percent of Iowa Eighth Grade Students Proficient on the Iowa Assessments Science Tests by Gender Biennium Periods 2011-2013 to 2015-2017
74.179.1
83.9 83.9 84.077.3 80.3
83.9 83.7 83.075.7
79.783.9 83.8 83.5
0
20
40
60
80
100
2011
-13
2012
-14
2013
-15
2014
-16
2015
-17
2011
-13
2012
-14
2013
-15
2014
-16
2015
-17
2011
-13
2012
-14
2013
-15
2014
-16
2015
-17
Per
cent
Biennium Periods
Female Male Total
Source: Iowa Testing Programs, The University of Iowa.Notes: Percentages for each biennium period represent average percentages of proficient students for the two school years
represented, e.g., 2013-2015 represents the average for the 2013-2014 and the 2014-2015 school years. A student designated as proficient can, at a minimum, do the following: Sometimes understands ideas related to Earth, the universe, and the life science. Usually understands ideas related to the physical sciences and often can demonstrate the skills of scientific inquiry.
The Annual Condition of Education Report 2017135

Figure 5-38
Percent of Iowa Eighth Grade Students Proficient on Iowa Assessments Science Tests by Race/Ethnicity Biennium Periods 2011-2013 to 2015-2017
43.3 49
.5 54.8
54.3
54.1
54.5
63.7
72.7
69.9 73
.0 75.5 79
.0 83.0
84.3
85.4
58.3 64
.1 71.1
71.6
71.1 79
.8 83.5 87
.4
87.5
87.3
0
20
40
60
80
100
2011
-13
2012
-14
2013
-15
2014
-16
2015
-17
2011
-13
2012
-14
2013
-15
2014
-16
2015
-17
2011
-13
2012
-14
2013
-15
2014
-16
2015
-17
2011
-13
2012
-14
2013
-15
2014
-16
2015
-17
2011
-13
2012
-14
2013
-15
2014
-16
2015
-17
Per
cent
Biennium Periods
African American American Indian Asian Hispanic White
Source: Iowa Testing Programs, The University of Iowa.Notes: Percentages for each biennium period represent average percentages of proficient students for the two school years
represented, e.g., 2013-2015 represents the average for the 2013-2014 and the 2014-2015 school years. A student designated as proficient can, at a minimum, do the following: Sometimes understands ideas related to Earth, the universe, and the life science. Usually understands ideas related to the physical sciences and often can demonstrate the skills of scientific inquiry.
The Annual Condition of Education Report 2017136

Figure 5-39
Percent of Iowa Eighth Grade Students Proficient on Iowa Assessments Science Tests by Socioeconomic Status* Biennium Periods 2011-2013 to 2015-2017
84.0 87.3 90.6 90.7 90.7
61.667.1
72.8 72.6 71.8
0
20
40
60
80
100
2011-13 2012-14 2013-15 2014-16 2015-17
Per
cent
Biennium Periods
Not Eligible for Free or Reduced Price Meals
Eligible for Free or Reduced Price Meals
Source: Iowa Testing Programs, The University of Iowa.Notes: Percentages for each biennium period represent average percentages of proficient students for the two school years
represented, e.g., 2013-2015 represents the average for the 2013-2014 and the 2014-2015 school years. A student designated as proficient can, at a minimum, do the following: Sometimes understands ideas related to Earth, the universe, and the life science. Usually understands ideas related to the physical sciences and often can demonstrate the skills of scientific inquiry. *Socioeconomic status is determined by eligibility for free or reduced price meals.
The Annual Condition of Education Report 2017137

Figure 5-40
Percent of Iowa Eighth Grade Students Proficient on Iowa Assessments Science Tests by Disability Status* Biennium Periods 2011-2013 to 2015-2017
81.084.6
88.5 88.4 88.1
37.443.7
49.4 48.5 47.9
0
20
40
60
80
100
2011-13 2012-14 2013-15 2014-16 2015-17
Per
cent
Biennium Periods
No Disability
Disability
Source: Iowa Testing Programs, The University of Iowa.Notes: Percentages for each biennium period represent average percentages of proficient students for the two school years
represented, e.g., 2013-2015 represents the average for the 2013-2014 and the 2014-2015 school years. A student designated as proficient can, at a minimum, do the following: Sometimes understands ideas related to Earth, the universe, and the life science. Usually understands ideas related to the physical sciences and often can demonstrate the skills of scientific inquiry. *Disability status is determined by the presence of an individualized education program (IEP).
The Annual Condition of Education Report 2017138

Figure 5-41
Percent of Iowa Eighth Grade Students Proficient on Iowa Assessments Science Tests by Primary Language Status* Biennium Periods 2011-2013 to 2015-2017
77.081.0
85.3 85.2 85.1
34.841.8
49.1 47.6 45.2
0
20
40
60
80
100
2011-13 2012-14 2013-15 2014-16 2015-17
Per
cent
Biennium Periods
Not ELL ELL*
Source: Iowa Testing Programs, The University of Iowa.Notes: Percentages for each biennium period represent average percentages of proficient students for the two school years
represented, e.g., 2013-2015 represents the average for the 2013-2014 and the 2014-2015 school years. A student designated as proficient can, at a minimum, do the following: Sometimes understands ideas related to Earth, the universe, and the life science. Usually understands ideas related to the physical sciences and often can demonstrate the skills of scientific inquiry. *Primary language status is classified by English and English language learner and determined according to the follow-ing definition: English language learner refers to a student who has a language other than English and the proficiency in English is such that the probability of the student’s academic success in an English-only classroom is below that of an academically successful peer with an English language background.
The Annual Condition of Education Report 2017139

Figure 5-42
Percent of Iowa Eleventh Grade Students Proficient on Iowa Assessments Science Tests by Gender Biennium Periods 2011-2013 to 2015-2017
86.7 83.9 81.1 81.0 80.5 83.7 80.9 78.7 78.1 77.485.2 82.4 79.8 79.5 78.9
0
20
40
60
80
100
2011
-13
2012
-14
2013
-15
2014
-16
2015
-17
2011
-13
2012
-14
2013
-15
2014
-16
2015
-17
2011
-13
2012
-14
2013
-15
2014
-16
2015
-17
Per
cent
Biennium Periods
Female Male Total
Source: Iowa Testing Programs, The University of Iowa.Notes: Percentages for each biennium period represent average percentages of proficient students for the two school years
represented, e.g., 2013-2015 represents the average for the 2013-2014 and the 2014-2015 school years. A student designated as proficient can, at a minimum, do the following: Sometimes makes inferences or predictions from data, judges the relevance and adequacy of information, and recognizes the rationale for and limitations of scientific procedures.
The Annual Condition of Education Report 2017140

Figure 5-43
Percent of Iowa Eleventh Grade Students Proficient on Iowa Assessments Science Tests by Race/Ethnicity Biennium Periods 2011-2013 to 2015-2017
59.6
53.0
49.0
48.8
46.7
75.4
71.2
69.1
68.0
64.1
79.6
79.0
77.5
77.1
76.8
70.7
68.6
64.3
63.1
62.8
88.1
85.6
83.5
83.4
83.0
0
20
40
60
80
100
2011
-13
2012
-14
2013
-15
2014
-16
2015
-17
2011
-13
2012
-14
2013
-15
2014
-16
2015
-17
2011
-13
2012
-14
2013
-15
2014
-16
2015
-17
2011
-13
2012
-14
2013
-15
2014
-16
2015
-17
2011
-13
2012
-14
2013
-15
2014
-16
2015
-17
Per
cent
Biennium Periods
African American American Indian Asian Hispanic White
Source: Iowa Testing Programs, The University of Iowa.Notes: Percentages for each biennium period represent average percentages of proficient students for the two school years
represented, e.g., 2013-2015 represents the average for the 2013-2014 and the 2014-2015 school years. A student designated as proficient can, at a minimum, do the following: Sometimes makes inferences or predictions from data, judges the relevance and adequacy of information, and recognizes the rationale for and limitations of scientific procedures.
The Annual Condition of Education Report 2017141

Figure 5-44
Percent of Iowa Eleventh Grade Students Proficient on Iowa Assessments Science Tests by Socioeconomic Status* Biennium Periods 2011-2013 to 2015-2017
90.5 88.4 86.6 86.4 86.0
73.169.1
65.2 65.0 64.2
0
20
40
60
80
100
2011-13 2012-14 2013-15 2014-16 2015-17
Per
cent
Biennium Periods
Not Eligible for Free or Reduced Price Meals
Eligible for Free or Reduced Price Meals
Source: Iowa Testing Programs, The University of Iowa.Notes: Percentages for each biennium period represent average percentages of proficient students for the two school years
represented, e.g., 2013-2015 represents the average for the 2013-2014 and the 2014-2015 school years. A student designated as proficient can, at a minimum, do the following: Sometimes makes inferences or predictions from data, judges the relevance and adequacy of information, and recognizes the rationale for and limitations of scientific procedures. *Socioeconomic status is determined by eligibility for free or reduced price meals.
The Annual Condition of Education Report 2017142

Figure 5-45
Percent of Iowa Eleventh Grade Students Proficient on Iowa Assessments Science Tests by Disability Status* Biennium Periods 2011-2013 to 2015-2017
89.4 86.8 84.6 84.2 83.4
49.443.4
37.5 36.4 36.2
0
20
40
60
80
100
2011-13 2012-14 2013-15 2014-16 2015-17
Per
cent
Biennium Periods
No Disability
Disability
Source: Iowa Testing Programs, The University of Iowa.Notes: Percentages for each biennium period represent average percentages of proficient students for the two school years
represented, e.g., 2013-2015 represents the average for the 2013-2014 and the 2014-2015 school years. A student designated as proficient can, at a minimum, do the following: Sometimes makes inferences or predictions from data, judges the relevance and adequacy of information, and recognizes the rationale for and limitations of scientific procedures. *Disability status is determined by the presence of an individualized education program (IEP).
The Annual Condition of Education Report 2017143

Figure 5-46
Percent of Iowa Eleventh Grade Students Proficient on Iowa Assessments Science Tests by Primary Language Status* Biennium Periods 2011-2013 to 2015-2017
86.2 83.4 81.0 80.8 80.5
43.640.0
34.531.0 29.0
0
20
40
60
80
100
2011-13 2012-14 2013-15 2014-16 2015-17
Per
cent
Biennium Periods
Not ELL ELL*
Source: Iowa Testing Programs, The University of Iowa.Notes: Percentages for each biennium period represent average percentages of proficient students for the two school years
represented, e.g., 2013-2015 represents the average for the 2013-2014 and the 2014-2015 school years. A student designated as proficient can, at a minimum, do the following: Sometimes makes inferences or predictions from data, judges the relevance and adequacy of information, and recognizes the rationale for and limitations of scientific procedures. *Primary language status is classified by English and English language learner and determined according to the follow-ing definition: English language learner refers to a student who has a language other than English and the proficiency in English is such that the probability of the student’s academic success in an English-only classroom is below that of an academically successful peer with an English language background.
The Annual Condition of Education Report 2017144

Dropouts
Indicator: Percentage of students considered as dropouts for grades 7-12, reported for all students by gender and by race/ethnicity.
Figure 5-47
Iowa Public School Grades 7-12 Dropout Rates for 2005-2006 to 2015-2016
1.461.57
1.96
2.16
2.34 2.322.18
1.921.84
1.69
1.92
0.0
0.5
1.0
1.5
2.0
2.5
Per
cent
School Year
Source: Iowa Department of Education, Bureau of Information and Analysis, Student Reporting in Iowa and Dropout files.
The Annual Condition of Education Report 2017145

Figure 5-48
Iowa Public School Grades 7-12 Dropout Rates by Gender 2005-2006 to 2015-2016
1.611.79
2.222.43
2.64 2.732.56
2.22 2.181.95
2.23
1.291.35
1.691.88
2.031.88 1.79
1.591.48 1.41
1.59
0.0
0.5
1.0
1.5
2.0
2.5
3.0P
erce
nt
School Year
Male Female
Source: Iowa Department of Education, Bureau of Information and Analysis, Student Reporting in Iowa Enrollment and Dropout files.
Figure 5-49
Iowa Public School Grades 7-12 Dropouts Rates by Race/Ethnicity 2013-2014 to 2015-2016
4.93
4.41
1.09
2.87
1.79
3.05
1.50
3.79 4.
27
0.87
3.13
2.34 2.
82
1.36
4.55
4.46
1.02
3.46
1.85
2.87
1.53
0
1
2
3
4
5
6
AfricanAmerican
American Indian Asian Hispanic NativeHawaiian/Pacific
Islander
Two or MoreRaces
White
Per
cent
Race/Ethnicity
2013-2014 2014-2015 2015-2016
Source: Iowa Department of Education, Bureau of Information and Analysis, Student Reporting in Iowa Enrollment and Dropout files.
The Annual Condition of Education Report 2017146

High School Graduation Rates
Indicator: Percent of high school students who graduate, reported for all students by gender and by race/ethnicity.
Figure 5-50
Iowa Public High School Four-Year Cohort Graduation Rates by Race/Ethnicity and Gender Graduating Classes of 2014 to 2016
78.6
78.3
90.8
81.7
80.0
85.8
92.2
92.3
88.8 90
.5
79.2
85.6
92.7
82.8 86
.4
83.9
92.4
92.8
88.8 90
.8
79.7
80.6
91.5
84.5 88
.1
83.9
92.9
93.0
89.5 91
.3
0
10
20
30
40
50
60
70
80
90
100
AfricanAmerican
American Indian Asian Hispanic NativeHawaiian/Pacific
Islander
Two or MoreRaces
White Female Male All Students
Perc
ent
Subgroup
Class 2014 Class 2015 Class 2016
Source: Iowa Department of Education, Bureau of Information and Analysis, Student Reporting in Iowa files.
The Annual Condition of Education Report 2017147

Postsecondary Education/Training Intentions
Indicator: Percentage of high school graduates/seniors pursuing or intending to pursue postsecondary education/training reported for all students by gender and by race/ethnicity.
Figure 5-51
Percent of All Iowa Public School Graduates Intending to Pursue Postsecondary Education/Training Graduating Classes 2007 to 2017
82.5 81.5 81.2 82.1 80.5 80.7 80.5 80.6 80.1 79.8 79.2
0
10
20
30
40
50
60
70
80
90
100
2007 2008 2009 2010 2011 2012 2013 2014 2015 2016 2017
Per
cent
Graduating Class
Source: Iowa Department of Education, Bureau of Information and Analysis, BEDS and SRI files.Notes: Data for the 2010 to 2017 graduating classes include students who received a regular diploma. Other completers, such
as students who received a certified attendance, are not included.
Figure 5-52
Percent of Iowa Public School Graduates Intending to Pursue Postsecondary Education/Training by Gender Graduating Classes 2007 to 2017
87.1 86.1 85.6 86.5 85.6 86.4 86.7 86.6 86.1 85.7 85.6
78.0 77.1 76.8 77.5 75.3 75.0 74.5 74.6 74.3 73.9 73.0
0
10
20
30
40
50
60
70
80
90
100
2007 2008 2009 2010 2011 2012 2013 2014 2015 2016 2017
Per
cent
Graduating Class
Female Male
Source: Iowa Department of Education, Bureau of Information and Analysis, SRI files.
The Annual Condition of Education Report 2017148

Figure 5-53
Percent of Iowa Public School Graduates Intending to Pursue Postsecondary Education/Training by Race/Ethnicity Graduating Classes of 2016 and 2017
74.0
62.6
83.9
70.9
56.1
76.5 81
.1
74.7
61.6
85.7
70.9
81
76.7 80
.3
0.0
10.0
20.0
30.0
40.0
50.0
60.0
70.0
80.0
90.0
100.0
African American American Indian Asian Hispanic Native Hawaiian/PacificIslander
Two or More Races White
Perc
ent
Subgroup
Class 2016 Class 2017
Source: Iowa Department of Education, Bureau of Information and Analysis, SRI files.
Probable Postsecondary Success
Indicator: Percentage of students achieving an ACT score above the national average and the percent-age of students achieving an ACT score of 20 or above.
Figure 5-54
Percent of Iowa ACT Participants Achieving an ACT Score Above the National Average and an ACT Score of 20 or Above Graduating Classes of 2006 to 2017
Source: ACT, Inc., The Condition of College and Career Readiness.
71.2 71.9 72.7 72.2 70.8 71.4 70.3 69.7 68.4 69.0 67.2 66.0
61.4 62.1 63.1 62.9 62.5 63.0 61.4 61.7 60.3 61.0 60.6 57.9
0
10
20
30
40
50
60
70
80
90
100
2006 2007 2008 2009 2010 2011 2012 2013 2014 2015 2016 2017
Per
cent
Graduating Class
% Scoring 20 or Above
% Above National Average
The Annual Condition of Education Report 2017149

Figure 5-55
Percent of Iowa ACT Participants Completing Core High School Program Graduating Classes of 2006 to 2017
63.060.0
69.0
78.0 78.4 79.4 80.0 79.4 78.0 78.0 77.0 77.0
7.411.1
6.01.4 1.7 2.2 1.6 2.6 4.0 6.0 7.0 7.0
0
10
20
30
40
50
60
70
80
90
100
Per
cent
Graduating Class
% Taking Core % Not Reporting
Source: ACT, Inc., The Condition of College and Career Readiness.Notes: ACT classifies high school programs consisting of four years of English and three or more years each of mathematics,
natural science, and social studies as “core” programs. The lower line shows the percent of ACT test takers not reporting any information in their courses taken.
The Annual Condition of Education Report 2017150

Student Performance by Tests and Areas
Iowa AssessmentsThe standardized achievement tests, Iowa Assessments, are developed by Iowa Testing Programs (ITP) at The University of Iowa for use nationally in grades K-12. During the 2016-2017 school year, all Iowa public school districts and over 180 nonpublic schools participated in the ITP achievement assessments. The biennium trends of the percent of public and nonpublic school students proficient in grades 4, 8, and 11 in reading and mathematics, and the percent of students in grades 8 and 11 proficient in science are included in the state indicators.
Iowa Assessments Achievement Level DistributionsForm E of the Iowa Assessments with 2011 national norms was used for the first time during the 2011-2012 and 2012-2013 school years. For the 2013-2014 to 2016-2017 school years an equated form, Form F, was administered. The achievement level data on Iowa Assessments are shown for all students in grades 4, 8, and 11 in reading and mathematics and in grades 8 and 11 in science between 2011-2013 and 2015-2017. Proficiency cut scores for the three achievement levels of the Iowa Assessments are calculated using a Standard Score metric and are specific to grade, content, and time of year. The Standard Score metric allows teachers and parents to monitor growth across years and make connections between growth and proficiency.
The Annual Condition of Education Report 2017151

Achievement Levels for ReadingFigures 5-56 through 5-61 show the achievement level trends for reading for all students in grades 4, 8, and 11 for the biennium periods 2011-2013 through 2015-2017. Less students were categorized in the Intermediate achievement level and more students were categorized in the High achievement level during 2013-2015 to 2015-2017 in reading in grade 4 (Figure 5-56) and grade 8 (Figure 5-57). More students were categorized in the Low achievement level and less students were categorized in the High achievement level in grade 11 (Figure 5-58) in 2012-2014 to 2015-2017.
Figure 5-56
Iowa Assessments Reading - Grade 4 Percentages for Iowa Achievement Levels Biennium Periods 2011-2013 to 2015-2017
25.4
24.6
24.0
24.0
24.7
56.3
52.2
47.8
47.1
46.8
18.3 23
.2 28.2
28.8
28.5
0
20
40
60
80
100
2011
-13
2012
-14
2013
-15
2014
-16
2015
-17
2011
-13
2012
-14
2013
-15
2014
-16
2015
-17
2011
-13
2012
-14
2013
-15
2014
-16
2015
-17
Per
cent
Biennium Periods
Low
Intermediate
High
Source: Iowa Testing Programs, The University of Iowa.Notes: The descriptions below indicate how the typical grade 4 student at each achievement level performs with respect to the
Iowa Assessments Reading Tests: HIGH PERFORMANCE LEVEL Understands factual information; draws conclusions and makes inferences about the motives and feelings of characters; identifies the main idea; evaluates the style and structure of the text; and interprets nonliteral language. INTERMEDIATE PERFORMANCE LEVEL Understands some factual information; sometimes can draw conclusions and make inferences about the motives and feelings of characters; and is beginning to be able to identify the main idea, evaluates the style and structure of the text, and interpret nonliteral language. LOW PERFORMANCE LEVEL Understands little factual information; seldom draws conclusions or makes simple inferences about characters; rarely grasps the main idea, evaluates the style and structure of the text, or interprets nonliteral language. Percentages for each biennium period represent average percentages of proficient students for the two school years represented, e.g., 2013-2015 represents the average for the 2013-2014 and the 2014-2015 school years. Figures may not total 100 percent due to rounding.
The Annual Condition of Education Report 2017152

Figure 5-57
Iowa Assessments Reading - Grade 8 Percentages for Iowa Achievement Levels Biennium Periods 2011-2013 to 2015-2017
34.2
29.6
24.5
24.3
24.5
54.0
52.9
52.0
51.8
51.4
11.8 17
.5 23.4
23.9
24.1
0
20
40
60
80
100
2011
-13
2012
-14
2013
-15
2014
-16
2015
-17
2011
-13
2012
-14
2013
-15
2014
-16
2015
-17
2011
-13
2012
-14
2013
-15
2014
-16
2015
-17
Per
cent
Biennium Periods
Low
Intermediate
High
Source: Iowa Testing Programs, The University of Iowa.Notes: The descriptions below indicate how the typical grade 8 student at each achievement level performs with respect to the
Iowa Assessments Reading Tests: HIGH PERFORMANCE LEVEL Understands factual information; draws conclusions and makes inferences about the motives and feelings of characters; makes applications to new situations, identifies the main idea; evaluates the style and structure of the text; and interprets nonliteral language. INTERMEDIATE PERFORMANCE LEVEL Understands some factual information; sometimes can draw conclusions and make inferences about the motives and feelings of characters; and apply what has been read to new situations, and sometimes can identify the main idea, evaluate the style and structure of the text, and interpret nonliteral language. LOW PERFORMANCE LEVEL Understands little factual information; can seldom draw conclusions or makes simple inferences about characters; usually cannot apply what has been read to new situations; can rarely grasp the main idea, evaluates the style and structure of the text, and interprets nonliteral language. Percentages for each biennium period represent average percentages of proficient students for the two school years represented, e.g., 2013-2015 represents the average for the 2013-2014 and the 2014-2015 school years. Figures may not total 100 percent due to rounding.
The Annual Condition of Education Report 2017153

Figure 5-58
Iowa Assessments Reading - Grade 11 Percentages for Iowa Achievement Levels Biennium Periods 2011-2013 to 2015-2017
17.3
19.1
20.3
20.6
21.4
67.7
67.2
67.1
66.5
66.0
15.0
13.8
12.6
12.9
12.5
0
20
40
60
80
100
2011
-13
2012
-14
2013
-15
2014
-16
2015
-17
2011
-13
2012
-14
2013
-15
2014
-16
2015
-17
2011
-13
2012
-14
2013
-15
2014
-16
2015
-17
Per
cent
Biennium Periods
Low
Intermediate
High
Source: Iowa Testing Programs, The University of Iowa.Notes: The descriptions below indicate how the typical grade 11 student at each achievement level performs with respect to
the Iowa Assessments Reading Tests: HIGH PERFORMANCE LEVEL Understands factual information; infers the traits and feelings of characters, identifies the main idea; identifies author viewpoint and style, interprets nonliteral language; and judges the validity of conclusions. INTERMEDIATE PERFORMANCE LEVEL Understands some factual information; sometimes can make inferences about characters; identifies the main idea, and identifies author viewpoint and style; occasionally can interpret nonliteral language and judge the validity of conclu-sions. LOW PERFORMANCE LEVEL Understands little factual information; seldom makes simple inferences; rarely grasps the main idea; and usually cannot identify author viewpoint and style, interpret nonliteral language, or judge the validity of conclusions. Percentages for each biennium period represent average percentages of proficient students for the two school years represented, e.g., 2013-2015 represents the average for the 2013-2014 and the 2014-2015 school years. Figures may not total 100 percent due to rounding.
The Annual Condition of Education Report 2017154

Achievement Levels for MathematicsFigures 5-59 through 5-61 show the mathematics achievement level distributions for students in grades 4, 8, and 11 for the biennium periods 2011-2013 through 2015-2017. More students performed at the High achievement level during 2013-2015 to 2015-2017 in mathematics in grades 4 (Figure 5-59), 8 (Figure 5-60), and 11 (Figure 5-61).
Figure 5-59
Iowa Assessments Mathematics - Grade 4 Percentages for Iowa Achievement Levels Biennium Periods 2011-2013 to 2015-2017
22.2
21.2
20.5
20.8
21.7
55.7
53.0
50.7
50.5
50.0
22.1 25
.8 28.8
28.7
28.3
0
20
40
60
80
100
2011
-13
2012
-14
2013
-15
2014
-16
2015
-17
2011
-13
2012
-14
2013
-15
2014
-16
2015
-17
2011
-13
2012
-14
2013
-15
2014
-16
2015
-17
Per
cent
Biennium Periods
Intermediate
HighLow
Source: Iowa Testing Programs, The University of Iowa.Notes: The descriptions below indicate how the typical grade 4 student at each achievement level performs with respect to the
Iowa Assessments Mathematics Tests: HIGH PERFORMANCE LEVEL Understands math concepts, solves complex word problems, uses various estimation methods, and is learning to interpret data from graphs and tables. INTERMEDIATE PERFORMANCE LEVEL Is developing an understanding of most math concepts, is developing the ability to solve simple and complex word problems and to use estimation methods, and is beginning to develop the ability to interpret data from graphics and tables. LOW PERFORMANCE LEVEL Is beginning to develop an understanding of many math concepts and an ability to solve simple word problems. Is generally unable to use estimation methods, and is seldom able to interpret data from graphs and tables. Percentages for each biennium period represent average percentages of proficient students for the two school years represented, e.g., 2013-2015 represents the average for the 2013-2014 and the 2014-2015 school years. Figures may not total 100 percent due to rounding.
The Annual Condition of Education Report 2017155

Figure 5-60
Iowa Assessments Mathematics - Grade 8 Percentages for Iowa Achievement Levels Biennium Periods 2011-2013 to 2015-2017
26.1
25.3
23.9
23.9
24.6
54.8
53.6
52.8
52.0
51.1
19.1 21.2 23.3
24.1
24.3
0
20
40
60
80
100
2011
-13
2012
-14
2013
-15
2014
-16
2015
-17
2011
-13
2012
-14
2013
-15
2014
-16
2015
-17
2011
-13
2012
-14
2013
-15
2014
-16
2015
-17
Per
cent
Biennium Periods
Low
Intermediate
High
Source: Iowa Testing Programs, The University of Iowa.Notes: The descriptions below indicate how the typical grade 8 student at each achievement level performs with respect to the
ITBS test tasks that determine the Iowa Assessments Mathematics Tests: HIGH PERFORMANCE LEVEL Understands math concepts and is developing the ability to solve complex word problems, uses a variety of estimation methods and interpret data from graphs and tables. INTERMEDIATE PERFORMANCE LEVEL Is beginning to develop an understanding of most math concepts and to develop the ability to solve word problems, use a variety of estimation methods, and interpret data from graphs and tables. LOW PERFORMANCE LEVEL Understands little about math concepts, is unable to solve most simple word problems or use estimation methods, and seldom able to interpret data from graphs and tables. Percentages for each biennium period represent average percentages of proficient students for the two school years represented, e.g., 2013-2015 represents the average for the 2013-2014 and the 2014-2015 school years. Figures may not total 100 percent due to rounding.
The Annual Condition of Education Report 2017156

Figure 5-61
Iowa Assessments Mathematics - Grade 11 Percentages for Iowa Achievement Levels Biennium Periods 2011-2013 to 2015-2017
18.3
17.4
16.2
16.8
17.5
64.0
62.1
60.2
59.4
59.2
17.7 20
.5 23.7
23.7
23.3
0
20
40
60
80
100
2011
-13
2012
-14
2013
-15
2014
-16
2015
-17
2011
-13
2012
-14
2013
-15
2014
-16
2015
-17
2011
-13
2012
-14
2013
-15
2014
-16
2015
-17
Per
cent
Biennium Periods
Low
Intermediate
High
Source: Iowa Testing Programs, The University of Iowa.Notes: The descriptions below indicate how the typical grade 11 student at each level performs with respect to concepts and
problems in the Iowa Assessments Mathematics Tests: HIGH PERFORMANCE LEVEL Understands how to apply math concepts and procedures, makes inferences with quantitative information, and solves a variety of novel quantitative reasoning problems. INTERMEDIATE PERFORMANCE LEVEL Is beginning to develop the ability to apply a variety of math concepts and procedures, makes inferences about quantitative information, and solves a variety of novel quantitative reasoning problems. LOW PERFORMANCE LEVEL Demonstrates little understanding about how to apply math concepts and procedures, generally cannot make infer-ences with quantitative information, and cannot solve most novel quantitative reasoning problems. Percentages for each biennium period represent average percentages of proficient students for the two school years represented, e.g., 2013-2015 represents the average for the 2013-2014 and the 2014-2015 school years. Figures may not total 100 percent due to rounding.
The Annual Condition of Education Report 2017157

Achievement Levels for ScienceFigure 5-62 shows the Iowa Assessments science achievement level distributions for students in grade 8 and Figure 5-63 shows the science achievement level distributions for students in grade 11. Grade 8 students had a decrease in the percent of students performing at the Low achievement level and an increase in the percent of students performing at the High achievement level from 2011-2013 to 2014-2016. In 2013-2015 and 2015-2017, more grade 11 students performed in the Low level for science, while the percent of students at the Intermediate achievement level for grade 11 science decreased.
Figure 5-62
Iowa Assessments Science - Grade 8 Percentages for Iowa Achievement Levels Biennium Periods 2011-2013 to 2015-2017
24.3
20.3
16.1
16.2
16.5
65.1
66.9
68.7
68.2
67.9
10.6 12.9 15.2
15.6
15.6
0
20
40
60
80
100
2011
-13
2012
-14
2013
-15
2014
-16
2015
-17
2011
-13
2012
-14
2013
-15
2014
-16
2015
-17
2011
-13
2012
-14
2013
-15
2014
-16
2015
-17
Per
cent
Biennium Periods
Low
Intermediate
High
Source: Iowa Testing Programs, The University of Iowa.Notes: The descriptions below indicate how the typical grade 8 student at each achievement level performs with respect to the
Iowa Assessments Science Tests: HIGH PERFORMANCE LEVEL Usually understands ideas related to Earth and the universe and to the life sciences. Understands ideas related to the physical sciences and is able to demonstrate the skills of scientific inquiry. INTERMEDIATE PERFORMANCE LEVEL Sometimes understands ideas related to Earth and the universe, the life sciences, and the physical sciences. Often can demonstrate the skills of scientific inquiry. LOW PERFORMANCE LEVEL Sometimes understands ideas related to Earth and the universe, but seldom understands ideas about the life sciences or the physical sciences. Rarely demonstrates the skills of scientific inquiry. Percentages for each biennium period represent average percentages of proficient students for the two school years represented, e.g., 2013-2015 represents the average for the 2013-2014 and the 2014-2015 school years. Figures may not total 100 percent due to rounding.
The Annual Condition of Education Report 2017158

Figure 5-63
Iowa Assessments Science - Grade 11 Percentages for Iowa Achievement Levels Biennium Periods 2011-2013 to 2015-2017
14.8 17
.6 20.2
20.5
21.1
64.2
61.0
57.9
57.4
57.2
21.0
21.3
21.9
22.2
21.7
0
20
40
60
80
100
2011
-13
2012
-14
2013
-15
2014
-16
2015
-17
2011
-13
2012
-14
2013
-15
2014
-16
2015
-17
2011
-13
2012
-14
2013
-15
2014
-16
2015
-17
Per
cent
Biennium Periods
Low
Intermediate
High
Source: Iowa Testing Programs, The University of Iowa.Notes: The descriptions below indicate how the typical grade 11 student at each achievement level performs with respect to
the Iowa Assessments Science Tests: HIGH PERFORMANCE LEVEL Makes inferences and predictions from data, recognizes the rationale for and limitations of scientific procedures, and usually judges the relevance and adequacy of information. INTERMEDIATE PERFORMANCE LEVEL Sometimes makes inferences or predictions from data, judges the relevance and adequacy of information, and recognizes the rationale for and limitations of scientific procedures. LOW PERFORMANCE LEVEL Rarely makes inferences or predictions from data, judges the relevance and adequacy of information, or recognizes the rationale for and limitations of scientific procedures. Percentages for each biennium period represent average percentages of proficient students for the two school years represented, e.g., 2013-2015 represents the average for the 2013-2014 and the 2014-2015 school years. Figures may not total 100 percent due to rounding.
The Annual Condition of Education Report 2017159

National Assessment of Educational Progress (NAEP)The National Assessment of Educational Progress (NAEP), conducted by the U.S. Department of Education since 1969, is the only national assessment of student achievement. The NAEP state assessments have been administered periodically in grades 4 and 8 since 1990 in the areas of reading, mathematics, science, and writing. In 2009, Iowa participated in the first state NAEP assessment for grade 12 students.
NAEP began testing with the use of accommodations in reading in 1998 and in mathematics in 2000. The use of accommodations allows for the assessment of special needs students (e.g., students with disabili-ties, ELL students) in a small group setting, with extra time, or with more breaks to result in higher levels of inclusion. Tables and graphics in this section include the results for accommodations not permitted in the earlier years and for accommodations permitted in the most recent years.
Scores Reported
NAEP assessment scores in reading and mathematics are reported on a scale range of 0 to 500 while the science and writing assessments are reported on a 300 point scale. Iowa’s average assessment scale scores in 2015 exceed the national averages in grades 4 and 8 for reading and in grade 4 for mathematics (Table 5-4). The Iowa average score in grade 8 mathematics is not statistically different from the national average.
The National Assessment Governing Board uses three achievement levels for reporting student perfor-mance results: Basic, Proficient, and Advanced. Basic represents at least a partial mastery of prerequisite knowledge and skills that are fundamental for proficient work at each grade. Proficient represents solid academic performance, and Advanced represents superior performance. Students not achieving the Basic level are classified as Below Basic.
Table 5-4
Average NAEP Scale Scores for Public Schools Grades 4, 8, and 12
Scale Score Achievement Level Iowa Percent At or Above
Subject Grade Year State National Basic Proficient AdvancedMathematics 4 2015 243 240 84 44 9(scale: 0-500) 2013 246 241 87 48 9
2011 243 240 86 43 62009 243 239 87 41 52007 243 239 87 43 52005 240 237 85 37 42003 238 234 83 36 32000 231 224 75 26 2
2000* 233 226 78 28 21996* 229 222 74 22 11992* 230 219 72 26 2
The Annual Condition of Education Report 2017160

Table 5-4 (…continued)
Source: U.S. Department of Education, Institute of Education Sciences, National Center for Education Statistics, National Assessment of Educational Progress (NAEP).
Notes: *Accommodations not allowed. Observed differences are not necessarily statistically significant. Detail may not sum to totals because of rounding.
Scale Score Achievement Level
Iowa Percent At or Above
Subject Grade Year State National Basic Proficient Advanced
8 2015 286 281 76 37 9
2013 285 284 76 36 7
2011 285 283 77 34 8
2009 284 282 76 34 7
2007 285 280 77 35 7
2005 284 278 75 34 6
2003 284 276 76 33 5
1996* 284 271 78 31 4
1992* 283 267 76 31 4
1990* 278 262 70 25 3
(scale: 0-300) 12 2013 156 152 71 26 1
2009 156 152 71 25 1
Reading 4 2015 224 221 71 38 9
(scale: 0-500) 2013 224 221 72 38 9
2011 221 220 69 33 6
2009 221 220 69 34 7
2007 225 220 74 36 7
2005 221 217 67 33 7
2003 223 216 70 35 7
2002 223 217 69 35 7
1998 220 213 67 33 7
1998* 223 215 70 35 7
1994* 223 212 69 35 8
1992* 225 215 73 36 7
8 2015 268 264 81 36 3
2013 269 266 81 37 3
2011 265 264 77 33 2
2009 265 262 77 32 2
2007 267 261 80 36 2
2005 267 260 79 34 3
2003 268 261 79 36 3
12 2013 291 287 80 40 4
2009 291 287 79 39 4
Science 4 2009 157 149 80 41 1
(scale: 0-300) 8 2009 156 149 72 35 1
Writing 4 2002 155 153 89 27 1
(scale: 0-300) 8 2007 155 154 88 32 1
The Annual Condition of Education Report 2017161

The following figures show the scale score growth of Iowa students on the NAEP for 2003 and 2015. The eleven other states classified as Midwestern states are also included for comparison. Iowa has not shown the growth in grade 4 reading or in grade 8 mathematics found in other states across the Midwest or across the nation.
Figure 5-64
NAEP Mathematics Grade 4 Midwest States Change in Average Scale Score 2003 and 2015
MI
ILMO
SD
National Public
KS
WIIowa OH
NEND IN
MN
210
215
220
225
230
235
240
245
250
255
260
2015 Average Scale Score
2003 Average Scale Score
Source: U.S. Department of Education, Institute of Education Sciences, National Center for Education Statistics, National Assessment of Educational Progress (NAEP), 2015 Mathematics Assessment.
The Annual Condition of Education Report 2017162

Figure 5-65
NAEP Mathematics Grade 8 Midwest States Change in Average Scale Scores 2003 and 2015
MIMO
National Public IL
KS SD
OHIowa
NE IN
ND
WI
MN
250
255
260
265
270
275
280
285
290
295
300
2015 Average Scale Score
2003 Average Scale Score
Source: U.S. Department of Education, Institute of Education Sciences, National Center for Education Statistics, National Assess-ment of Educational Progress (NAEP), 2015 Mathematics Assessment.
The Annual Condition of Education Report 2017163

Figure 5-66
NAEP Reading Grade 4 Midwest States Change in Average Scale Score 2003 and 2015
KSIL
MO
MI
SD
National Public
MNWI
IowaND OH
NE IN
200
205
210
215
220
225
230
235
240
245
250
2015 Average Scale Score
2003 Average Scale Score
Source: U.S. Department of Education, Institute of Education Sciences, National Center for Education Statistics, National Assess-ment of Educational Progress (NAEP), 2015 Reading Assessment.
The Annual Condition of Education Report 2017164

Figure 5-67
NAEP Reading Grade 8 Midwest States Change in Average Scale Score 2003 and 2015
National Public
MIOH KS IL MO ND SD Iowa IN
NE WIMN
240
245
250
255
260
265
270
275
280
285
290
2015 Average Scale Score
2003 Average Scale Score
Source: U.S. Department of Education, Institute of Education Sciences, National Center for Education Statistics, National Assess-ment of Educational Progress (NAEP), 2015 Reading Assessment.
The Annual Condition of Education Report 2017165

ACTACT is a curriculum-based achievement exam designed to measure the academic skills that are taught in schools and deemed important for success in first-year college courses. A composite ACT score measures overall educational development and is based on assessments for English, mathematics, reading, and science reasoning. The ACT scores range from a low of 1 to a high of 36 and data are reported for various subgroups of students. Subgroups reported in this section include high school program type and gender.
High school program types are classified as “core” and “less than core.” ACT defines “core” as high school programs consisting of four years of English, and three or more years of mathematics, natural science, and social studies. Students not meeting the “core” program standard are considered as “less than core” completers.
In 2017, the Iowa participation rate was 67 percent. The rate for the nation has been lower than Iowa rates for all years displayed. However, the gap is getting smaller in the last few years (Figure 5-68).
In Iowa, almost 100 percent of the Des Moines school district’s graduating classes of 2010 to 2017 are included in the profile. Clinton is the second district in Iowa that had the most students in the classes of 2012 to 2017 tested.
Iowa’s ACT composite score averages have consistently been one point higher than the national averages (Figure 5-69). Among 31 states for which ACT is the primary college-entrance exam (more than 50 percent graduates tested), Iowa’s average composite score of 21.9 in 2017 ranked second among the 31 states in the nation and in the Midwest states (Table 5-5).
Figure 5-68
Percent of Iowa Graduates in Iowa and the Nation Taking the ACT Assessment 2007 to 2017
6660 59 60 61 63 66 68 67 68 67
42 4347 47 49 52 54 57 59
6460
0
10
20
30
40
50
60
70
80
90
100
2007 2008 2009 2010 2011 2012 2013 2014 2015 2016 2017
Per
cent
Graduating Class
Iowa Nation
Source: ACT, Inc., The Condition of College and Career Readiness.
The Annual Condition of Education Report 2017166

Figure 5-69
Average ACT Composite Scores for Iowa and the Nation 2007 to 2017
22.3 22.4 22.4 22.2 22.3 22.1 22.1 22.0 22.2 22.1 21.9
21.2 21.1 21.1 21.0 21.1 21.1 20.9 21.0 21.0 20.8 21.0
1
6
11
16
21
26
31
36
2007 2008 2009 2010 2011 2012 2013 2014 2015 2016 2017
AC
T S
core
Graduating Class
Iowa Nation
Source: ACT, Inc., The Condition of College and Career Readiness.
The Annual Condition of Education Report 2017167

Table 5-5
ACT Average Composite Scores for Iowa, the Nation, and Midwest States Classes of 2015 to 2017
Source: ACT, Inc., The Condition of College and Career Readiness.Note: National rank includes only those states where ACT is the primary college-entrance exam.
ACT Score Comparisons for English, Mathematics, Reading, and Science for Iowa and the NationIowa’s average ACT scores were higher than the national averages in English, mathematics, reading, and science (Table 5-6).
Class of 2015 Class of 2016 Class of 2017Nation and
StateACT
CompositePercent
Graduates Tested
ACT Composite
Percent Graduates
Tested
ACT Composite
Percent Graduates
Tested
2017 National
RankNation 21.0 59% 20.8 64% 21.0 60% -Illinois 20.7 100% 20.8 100% 21.4 93% 6
Indiana 22.1 38% 22.3 41% 22.6 35% -Iowa 22.2 66% 22.1 68% 21.9 67% 2
Kansas 21.9 75% 21.9 74% 21.7 73% 4Michigan 20.1 100% 20.3 100% 24.1 29% -
Minnesota 22.7 74% 20.3 100% 21.5 100% 5Missouri 21.7 74% 20.2 100% 20.4 100% 11
Nebraska 21.5 84% 21.4 88% 21.4 84% 6North Dakota 20.6 98% 20.3 100% 20.3 98% 13
Ohio 22.0 72% 22.0 73% 22.0 75% 1South Dakota 21.9 78% 21.9 76% 21.8 80% 3
Wisconsin 22.2 71% 20.5 100% 20.5 100% 10
The Annual Condition of Education Report 2017168

Table 5-6
Average ACT Scores for Iowa and the Nation Graduating Classes 2007 to 2017
Source: ACT, Inc., The Condition of College and Career Readiness.
ACT Scores for Core and Less-than-Core StudentsACT defines the college-preparatory core curriculum as at least four years of English and at least three years each of mathematics, natural science, and social studies (Table 5-7). Core mathematics and natural science courses are beyond the introductory level. For example, a typical minimal core mathematics course might include Algebra I, Algebra II, and geometry one year each. A typical minimal core natural science course might include one year each of general science, biology, and chemistry or physics.
About 77 percent of Iowa’s 2017 graduates taking the ACT indicated that they participated in the core high school programs (Figure 5-70). The enforcement from 2008, for reporting seniors taking core high school programs, shows higher Iowa and national percentages in the recent seven years.
Overall, average ACT composite scores for Iowa students taking core programs have been approximately three points higher than those not taking core programs (Table 5-8). This trend has been consistent at more than two points difference score for nationwide students.
Table 5-7
ACT Standards for Core High School Programs
Source: ACT, Inc., The Condition of College and Career Readiness.
Graduating Class English Mathematics Reading Science
Iowa Nation Iowa Nation Iowa Nation Iowa Nation
2007 21.6 20.7 21.9 21.0 22.6 21.5 22.3 21.0
2008 21.9 20.6 22.0 21.0 22.9 21.4 22.3 20.8
2009 21.9 20.6 21.9 21.0 22.9 21.4 22.4 20.9
2010 21.8 20.5 21.8 21.0 22.6 21.3 22.3 20.9
2011 21.7 20.6 21.9 21.1 22.6 21.3 22.4 20.9
2012 21.6 20.5 21.7 21.1 22.5 21.3 22.2 20.9
2013 21.5 20.2 21.6 20.9 22.5 21.1 22.2 20.7
2014 21.5 20.3 21.4 20.9 22.5 21.3 22.2 20.8
2015 21.6 20.4 21.5 20.8 22.7 21.4 22.3 20.9
2016 21.4 20.1 21.4 20.6 22.7 21.3 22.3 20.8
2017 21.2 20.3 21.3 20.7 22.6 21.4 22.1 21.0
Core Area Years Course CreditEnglish 4 or more English 9, 10, 11, 12 1 year each
Mathematics 3 or more Algebra I & II, Geometry 1 year eachTrigonometry & calculus (not precalculus), other math courses beyond Algebra II, computer math/computer
1/2 year each
Social Studies 3 or more American history, world history, American government 1 year eachEconomics, geography, psychology, other history 1/2 year each
Natural Science 3 or more General/physical/earth science, biology, chemistry, physics 1 year each
The Annual Condition of Education Report 2017169

Figure 5-70
Percent of ACT Participants Taking Core High School Programs 2007 to 2017
60.0
69.0
78.0 78.4 79.4 80.0 79.0 78.0 78.0 77.0 77.0
51.0
61.0
70.0 71.3 74.1 75.6 74.0 73.0 72.0 69.0 68.0
0
10
20
30
40
50
60
70
80
90
100
2007 2008 2009 2010 2011 2012 2013 2014 2015 2016 2017
Per
cent
Graduating Class
Iowa Nation
Source: ACT, Inc., The Condition of College and Career Readiness.Note: ACT classifies high school consisting of four years of English and three or more years of mathematics, natural science,
and social studies as “core” programs.
The Annual Condition of Education Report 2017170

Table 5-8
Average ACT Composite Scores for Core and Less-Than-Core Test Takers 2007 to 2017
Source: ACT, Inc., The Condition of College and Career Readiness.Notes: ACT classifies high school consisting of four years of English and three or more years of mathematics, natural science,
and social studies as “core” programs. The figures include all students tested, public as well as nonpublic.
Graduating Class Iowa NationCore Less-than-Core Difference Core Less-than-Core Difference
2007 23.1 20.6 2.5 22.0 19.8 2.22008 23.1 20.6 2.5 22.0 19.5 2.52009 23.1 20.1 3.0 22.0 19.1 2.92010 23.0 19.6 3.4 22.0 18.9 3.12011 23.0 19.8 3.2 21.9 19.0 2.92012 22.8 19.6 3.2 21.8 19.1 2.72013 22.9 19.6 3.3 21.7 18.7 3.02014 22.9 19.6 3.3 21.8 18.9 2.92015 23.0 20.1 2.9 21.9 18.9 3.02016 22.9 20.0 2.9 21.9 18.7 3.2
2017 22.8 19.9 2.9 22.1 18.9 3.2
The Annual Condition of Education Report 2017171

ACT Composite Score DistributionsTable 5-9 provides the Iowa ACT composite score distributions for the classes of 2013 to 2017 (also see Figure 5-79). About 70 percent of Iowa test takers had a composite score of 20 or greater, with approxi-mately 53 percent scoring 22 or higher in all three years. In 2017, more students scored 17 or less and less students scored between 22 and 28 than the other two years displayed in Figures 5-79.
Table 5-9
Iowa ACT Composite Score Distributions Classes of 2013 to 2017
Source: ACT, Inc., The Condition of College and Career Readiness.
ACT Score 2013 2014 2015 2016 2017<14 0.0 3.1% 2.6% 2.6% 2.5%14 2.0 2.3 2.3 2.3 2.715 2.8 3.1 2.9 2.9 3.416 3.9 4.0 4.1 4.1 4.717 4.9 5.2 5.2 5.2 5.718 6.4 6.7 6.7 6.7 7.219 7.3 7.1 7.2 7.2 7.320 8.0 8.1 8.1 8.1 8.021 8.2 8.1 8.2 8.2 8.222 8.5 8.1 7.8 7.8 7.823 8.2 7.3 7.6 7.6 7.324 7.1 7.0 6.6 6.6 6.425 6.3 6.4 6.4 6.4 5.726 5.2 4.8 5.2 5.2 4.627 4.4 4.3 4.5 4.5 4.328 3.6 3.7 3.8 3.8 3.629 2.8 2.7 2.9 2.9 2.330 2.4 2.6 2.6 2.6 2.731 1.8 1.9 1.9 1.9 2.032 1.3 1.4 1.5 1.5 1.533 0.9 0.9 0.9 0.9 1.1
34+ 0.8 1.1 1.0 1.0 1.1
The Annual Condition of Education Report 2017172

Figure 5-71
Distribution of Iowa ACT Composite Scores Classes of 2013, 2016 and 2017
0
1
2
3
4
5
6
7
8
9
Per
cent
ACT Scores
2013
2016
2017
Source: ACT, Inc., The Condition of College and Career Readiness.
The Annual Condition of Education Report 2017173

ACT Scores by Enrollment CategoryAverage ACT scores by enrollment category for the graduating classes of 2015 to 2017 are provided in Table 5-10, Table 5-11 and Figure 5-72.
Table 5-10
Iowa Public School Average ACT Scores by Enrollment Category for the Graduating Classes of 2015 to 2017
Sources: ACT, Inc., The Annual Testing files; Iowa Department of Education, Certified Enrollment files.Notes: The analyses include the records with the highest ACT Composite scores for the students who were in Iowa public high
schools from 2011-2012 to 2014-2015 for the class of 2015 and from 2012-2013 to 2015-2016 for the class of 2016, and from 2013-2014 to 2016-2017 for the class of 2017.
Graduating Class Enrollment Category English Mathematics Reading Science Composite2015 <300 20.5 20.2 22.3 21.6 21.3
300-599 21.1 20.9 22.2 22.0 21.7600-999 21.3 21.2 22.5 22.2 22.01,000-2,499 21.9 21.8 23.2 22.7 22.52,500-7,499 22.5 22.5 23.8 23.4 23.27,500+ 21.6 21.9 23.0 22.7 22.5State 21.7 21.8 23.1 22.7 22.5
2016 <300 20.2 20.4 21.8 21.7 21.2
300-599 21.1 20.7 22.4 21.9 21.7600-999 21.1 21.1 22.5 22.2 21.91,000-2,499 21.8 21.8 23.2 22.8 22.52,500-7,499 22.4 22.4 23.9 23.4 23.27,500+ 21.0 21.4 22.8 22.4 22.0State 21.5 21.6 23.0 22.6 22.3
2017 <300 20.8 20.2 22.7 22.1 21.6300-599 20.6 20.5 21.9 21.6 21.3600-999 20.9 21.0 22.4 22.1 21.71,000-2,499 21.2 21.2 22.7 22.3 22.02,500-7,499 22.2 22.5 23.8 23.4 23.17,500+ 20.9 21.2 22.6 22.2 21.9State 21.2 21.4 22.8 22.4 22.1
The Annual Condition of Education Report 2017174

Table 5-11
Iowa Public School Average ACT Scores by Subgroup, Graduating Classes 2015 to 2017
Class of 2015Group Number
TestedEnglish Mathematics Reading Science Composite
All Students 18,082 21.7 21.8 23.1 22.7 22.5African American 531 17.1 18.0 18.7 18.9 18.3American Indian 44 19.0 19.4 21.7 20.5 20.3
Asian 487 22.3 23.3 23.4 23.5 23.3Hispanic 950 18.5 19.0 20.4 20.2 19.6
Hawaiian or Pacific Islander
14 20.6 20.6 23.4 21.5 21.6
Two or More Races 337 21.2 21.2 22.7 22.1 21.9White 15,719 22.1 22.0 23.4 23.0 22.8
Disability* 637 15.5 17.2 17.5 18.2 17.2ELL** 275 14.3 16.6 16.2 17.2 16.2
Low SES*** 4,431 19.2 19.6 21 20.7 20.3Female 9,722 22.1 21.1 23.1 22.2 22.3
Male 8,360 21.3 22.5 23.0 23.2 22.7Class of 2016
All Students 18,985 21.5 21.6 23.0 22.6 22.3African American 626 16.4 17.7 18.6 18.6 17.9American Indian 41 20.5 20.3 21.6 21.4 21.1
Asian 535 22.0 23.0 23.3 23.1 23.0Hispanic 1,170 17.9 18.7 20.0 19.9 19.3
Hawaiian or Pacific Islander
12 17.7 18.5 20.3 19.8 19.3
Two or More Races 451 20.4 20.7 22.7 22.0 21.6White 16,143 22.0 21.9 23.4 23.0 22.7
Disability* 622 14.8 16.6 17.0 17.5 16.6ELL** 363 13.6 16.4 15.9 16.9 15.8
Low SES*** 5,120 18.7 19.3 20.6 20.5 19.9Female 10,211 21.7 20.9 23.1 22.1 22.1
Male 8,774 21.3 22.4 23.0 23.2 22.6
The Annual Condition of Education Report 2017175

Table 5-11 (....continued)Class of 2017
Group Number Tested
English Mathematics Reading Science Composite
All Students 18,250 21.2 21.4 22.8 22.4 22.1African American 636 16.4 17.4 18.5 18.3 17.8American Indian 40 17.8 18.3 19.6 19.6 19.0
Asian 527 21.8 22.9 22.7 23.5 22.9Hispanic 1,191 17.8 18.6 19.8 19.7 19.1
Hawaiian or Pacific Islander 16 18.6 20.1 20.7 19.3 19.8Two or More Races 449 20.9 20.7 22.7 21.9 21.7
White 15,391 21.7 21.7 23.2 22.8 22.5Disability* 539 14.7 16.6 16.7 17.3 16.5
ELL** 370 14.1 16.3 15.8 17.0 15.9Low SES*** 4,978 18.4 18.9 20.4 20.2 19.6
Female 9,898 21.5 20.8 22.8 22.0 21.9Male 8,352 20.8 22.1 22.7 22.9 22.3
Sources: ACT, Inc., The Annual Testing files; Iowa Department of Education, Certified Enrollment files. Notes: The analyses include the records with the highest ACT Composite scores for the students who were in Iowa public high schools from 2011-2012 to 2014-2015 for the class of 2015 and from 2012-2013 to 2015-2016 for the class of 2016, and from 2013-2014 to 2016-2017 for the class of 2017. *Disability status is determined by the presence of an individualized education program (IEP). **ELL indicates English language learner. ***Low SES is determined by the eligibility for free or reduced price meals.
Figure 5-72
Graduating Class of 2015 to 2017 Average ACT Composite Scores for Iowa Public School Students by Enrollment Category
Sources: ACT, Inc., The Annual Testing files; Iowa Department of Education, Certified Enrollment files.Notes: The analyses include the records with the highest ACT Composite scores for the students who were in Iowa public high
schools from 2011-2012 to 2014-2015 for the class of 2015 and from 2012-2013 to 2015-2016 for the class of 2016.
21.3
21.7
22.0
22.5 23.2
22.5
22.5
21.2
21.7
21.9 22.5 23.2
22.0
22.3
21.6
21.3
21.7
22.0 23
.1
21.9
22.1
1
6
11
16
21
26
31
36
<300 300-599 600-999 1,000-2,499 2,500-7,499 7,500+ State
AC
T C
ompo
site
Sco
re
Enrollment Category
2015 2016 2017
The Annual Condition of Education Report 2017176

ACT Scores by GenderFigure 5-81 shows the average composite scores by gender for Iowa and the nation students.
Table 5-12 shows the average scores by subject as well as gender for Iowa students. Females reported higher average scores in English and reading and lower in mathematics, science, and ACT composite in 2016 and 2017.
Figure 5-73
ACT Average Composite Scores by Gender 2007 to 2017
22.422.6
22.722.5 22.5
22.422.3
22.5 22.522.7
22.1
22.122.2
22.122.0
22.1
21.9 21.922.0
22.122.0
21.821.2 21.2
21.3 21.2 21.2 21.2
20.921.1 21.1
20.921.0
21.0 21.020.9 20.9
21.0 21.020.9 20.9
21.020.9
21.1
19
20
21
22
23
2007 2008 2009 2010 2011 2012 2013 2014 2015 2016 2017
AC
T S
core
Graduating Class
Iowa Male Iowa Female
U.S. Male U.S. Female
Source: ACT, Inc., The Condition of College and Career Readiness.
Table 5-12
Iowa Average ACT Scores by Gender 2016 and 2017
Source: ACT, Inc., The Condition of College and Career Readiness.Note: *ACT test-takers not reporting gender.
Number of Average ACT ScoresTest-takers English Mathematics Reading Science Composite
Gender 2016 2017 2016 2017 2016 2017 2016 2017 2016 2017 2016 2017Male 10,197 10,649 21.6 20.9 22.4 22.0 23.0 22.5 23.1 22.7 22.7 22.1
Female 11,899 12,552 21.8 21.6 20.9 20.7 23.0 22.7 22.0 21.7 22.0 21.8Unreported* 1,036 105
The Annual Condition of Education Report 2017177

ACT Composite Scores by Student Planned Educational MajorsThe most popular planned educational majors by students taking the ACT in 2017 were Health Sciences/Allied Health Fields (Table 5-13). The highest average composite ACT scores in Iowa were reported by students who plan to major in engineering (25.1), English and foreign language (24.7); sciences (24.3) and computer science and mathematics (24.1). The Iowa ACT test takers that indicated a planned major in education had an average ACT composite score above 21.
Table 5-13
ACT Average Composite Scores by Student Planned Educational Major Class of 2017
Source: ACT, Inc., The Condition of College and Career Readiness.
Planned Educational Major Nation Average Iowa Average Iowa Percent Planned
Agriculture & Natural Resources Conservation 19.7 20.8 4%Architecture 20.6 22.0 1
Area, Ethinic, & Multidisciplinary Studies 21.6 22.9 <1Arts: Visual & Performing 20.4 22.2 4
Business 21.4 21.8 9Communications 21.6 22.5 1
Community, Family, & Personal Services 17.7 19.5 2Computer Science & Mathematics 23.6 24.1 3
Education 20.3 21.1 7Engineering 23.7 25.1 7
Engineering Technology & Drafting 19.6 21.8 1English & Foreign Language 23.8 24.7 1
Health Administration & Assisting 18.1 19.4 2Health Sciences & Technologies 21.0 22.1 17
Philosophy, Religion, & Theology 21.5 22.5 <1Repair, Production, & Construction 17.0 19.0 1
Sciences: Biological & Physical 24.0 24.3 6Social Sciences & Law 21.6 22.1 6
Undecided 22.0 22.5 20No Response 17.6 17.5 8
The Annual Condition of Education Report 2017178

SATThe SAT is one of the national college entrance examinations developed by the College Board. The SAT scale scores are in the range of 200 and 800. The SAT was first administered in 1926 to 8,040 candidates nationwide. In 2017, the number of SAT takers in the Nation was more than 1.7 million and the number of Iowa SAT takers was about 700 (approximately 2 percent) of the high school graduates (Table 5-14).
In 2016-2017, the College Board first reported the Evidence-Based reading and writing (ERW) scores. Iowa’s ERW and math average scores are both higher than the nation (Tables 5-14 and 5-15).
Table 5-14
SAT Scores for Iowa and the Nation Graduating Class of 2017
Source: College Board, SAT Suite of Assessments Annual Report.Note: ERW indicates Evidence-Based Reading and Writing.
Table 5-15
\\
Source: College Board, SAT Suite of Assessments Annual Report. Note: ERW indicates Evidence-Based Reading and Writing.
Iowa Number of Students
Average ERW Average Math
Nation 1,715,481 533 527Iowa 693 647 644
SAT Scores by Gender for Iowa and the Nation Graduating Class of 2017
Number of Students
Average ERW Average Math
Nation Female 906,019 534 516
Nation Male 809,462 532 538
Iowa Female 367 641 623Iowa Male 326 654 667
The Annual Condition of Education Report 2017179

Advanced Placement (AP) The College Board sponsors the Advanced Placement (AP) Program in Iowa, which offered more than 35 courses in over 30 subject areas in 2016-2017. AP provides secondary school students the opportunity to take college-level courses in a high school setting. Courses are taught by highly qualified high school teachers who use the AP Course Descriptions to guide them.
In Iowa, over 19,000 AP exams were taken by more than 12,000 students in 2017 (Figure 5-74). English language and composition, English literature and composition, U.S. history and government, biology and chemistry, calculus, and psychology in aggregate, accounted for more than 65 percent of the exams taken in 2017. The number of students/candidates in 2017 was slightly less than the number in 2016. The num-ber of exams taken decreased 3.6 percent over that one-year period.
From 2007 to 2017, the percentage of Iowa’s students receiving a score of three or better has consistently been higher than the national percentage (Figure 5-75).
Nationally, and in Iowa, greater percentages of males are reported as receiving a score of three or higher than females. The achievement gap between Iowa males and females is displayed in Figure 5-76.
Table 5-16 shows the AP test results by Midwest states for the high school graduating classes of 2015 and 2016.
Figure 5-74
Advanced Placement Participation for Iowa Students 2007 to 2017
7,127 7,798 8,298 8,979 9,60910,443 11,084
12,029 11,64212,439 12,119
10,77611,786
12,51214,028
14,89616,413
17,62818,860 18,568
19,790 19,084
0
5,000
10,000
15,000
20,000
25,000
2007 2008 2009 2010 2011 2012 2013 2014 2015 2016 2017
Num
ber o
f Stu
dent
s/E
xam
s
Year
Test Takers Exams
Source: The College Board, Advanced Placement Program, Iowa National Summary Reports.
The Annual Condition of Education Report 2017180

Figure 5-75
Percent of AP Candidates with AP Scores of 3+, 2007 to 2017
70.266.9 65.6 64.5 65.4 64.1 62.8 62.7 62.8 60.4 62.1
59.3 57.8 58.5 57.9 56.159.3 59.0 59.1
55.8 56.0 56.0
0
10
20
30
40
50
60
70
80
2007 2008 2009 2010 2011 2012 2013 2014 2015 2016 2017
Per
cent
Year
Iowa Nation
Source: The College Board, Advanced Placement Program, Iowa National Summary Reports.
Figure 5-76
Percent of Iowa AP Exams with Scores of 3+ by Gender, 2007 to 2017
68.063.9 61.8 60.7 63.2 61.1 59.5 60.2 60.3 58.0 60.0
72.7 70.4 69.9 68.6 67.8 67.5 66.6 65.5 65.7 63.1 65.0
0
10
20
30
40
50
60
70
80
90
100
2007 2008 2009 2010 2011 2012 2013 2014 2015 2016 2017
Per
cent
Year
Iowa Females Iowa Males
Source: The College Board, Advanced Placement Program, Iowa National Summary Reports.
The Annual Condition of Education Report 2017181

Table 5-16
Number and Percent of Graduates Who Took Advanced Placement Exams and Percent of AP Exam Scored 3+ During High School by Midwest States, Graduating Classes of 2015 and 2016
Nation and State
2015 Number of Graduates
took AP
2015 Percent of Graduates
took AP
2015 Percent Score 3+
2016 Number of Graduates
took AP
2016 Percent of Graduates took AP
2016 Percent Score 3+
Nation 1,109,339 35.4% 60.1% 1,136,792 36.2% 60.6%Illinois 48,627 35.0% 66.2% 49,963 37.5% 66.9%
Indiana 23,702 36.0% 49.4% 24,140 36.8% 49.3%Iowa 6,343 19.6% 63.7% 6,680 20.6% 62.9%
Kansas 5,484 17.5% 60.1% 5,659 17.6% 60.6%Michigan 29,736 29.5% 65.5% 30,428 30.6% 65.0%
Minnesota 18,863 33.3% 65.7% 19,096 33.9% 65.6%Missouri 11,151 18.4% 59.2% 11,704 19.2% 59.3%
Nebraska 3,510 17.2% 61.7% 3,559 17.5% 60.9%North Dakota 1,038 14.8% 69.6% 1,094 15.4% 62.2%
Ohio 30,268 27.3% 62.4% 31,066 27.0% 62.5%South Dakota 1,601 20.5% 64.3% 1,473 19.1% 67.7%
Wisconsin 20,825 34.9% 69.9% 21,270 35.4% 70.0%
Source: The College Board, AP Cohort Data Reports.
The Annual Condition of Education Report 2017182

Pursuit of Postsecondary Education/TrainingThis section presents Information on Iowa public high school graduates pursuing or intending to pursue postsecondary education or training. Graduate intention data have been collected through Student Re-porting in Iowa (SRI, formerly EASIER).
The percent of graduates intending to pursue postsecondary education or training decreased slightly between 2015 to 2017 (Figure 5-77). Table 5-17 lists the percent of graduates intending to pursue postsecondary education/training. As seen in Table 5-18, the percent of female graduates intending to pursue postsecondary education/training was higher than the percent of male graduates intending to pursue postsecondary education/training in all years presented. As in previous years, the largest percent of graduates intended to pursue postsecondary education at a community college in 2017 (Table 5-19). Table 5-20 and Figure 5-78 show that the percent of graduates intending to pursue postsecondary educa-tion at a two-year college was higher than the percent of graduates intending to pursue postsecondary education at a four-year college in 2012. Beginning in 2013, the percent of students intending to pursue post-secondary education at a four-year college was higher than the percent of graduates intending to pursue postsecondary education at a two-year college.
Figure 5-77
Percent of Iowa Public School Graduates Intending to Pursue Postsecondary Education/Training Graduating Classes 2001 and 2006 to 2017
82.7 83.4 82.5 81.5 81.2 82.1 80.5 80.7 80.5 80.6 80.1 79.8 79.2
0
10
20
30
40
50
60
70
80
90
100
2001 2006 2007 2008 2009 2010 2011 2012 2013 2014 2015 2016 2017
Per
cent
Graduating Class
Source: Iowa Department of Education, Bureau of Information and Analysis, BEDS and SRI files.Note: Data for the 2010 to 2017 graduating classes include students who received a regular diploma. Other completers, such
as students who received a certified attendance, are not included.
The Annual Condition of Education Report 2017183

Table 5-17
Percent of Iowa Public High School Graduates/Seniors Intending to Pursue Postsecondary Education/Training by Enrollment Category Graduating Classes of 2001 and 2012 to 2017
Source: Iowa Department of Education, Bureau of Information and Analysis, BEDS and SRI files.Note: Data for the 2012 to 2017 graduating classes include students who received a regular diploma. Other completers, such
as students who received a certified attendance, are not included.
Table 5-18
Percent of Iowa Public High School Graduates/Seniors Intending to Pursue Postsecondary Education/Training by Gender, 2001 and 2012 to 2017
Source: Iowa Department of Education, Bureau of Information and Analysis, BEDS and SRI files.Note: Data for the 2012 to 2017 graduating classes include students who received a regular diploma. Other completers, such
as students who received a certified attendance, are not included.
Graduating ClassEnrollment Category 2001 2012 2013 2014 2015 2016 2017
<300 77.6 81.3 79.6 86.5 80.4 79.9 80.2300-599 81.2 84.0 83.0 82.3 82.6 81.8 80.0600-999 82.5 83.9 82.9 81.0 81.2 81.9 80.9
1,000-2,499 83.1 81.0 80.3 80.0 79.4 80.3 77.92,500-7,499 81.9 80.9 81.7 81.3 82.3 82.1 81.6
7,500+ 84.3 77.0 77.7 79.3 77.8 75.8 77.7State 82.7 80.7 80.5 80.6 80.1 79.8 79.2
Graduating ClassGender 2001 2012 2013 2014 2015 2016 2017
Male 77.8 75.0 74.5 74.6 74.3 73.9 73.0Female 87.5 86.4 86.7 86.6 86.1 85.7 85.6
Total 82.7 80.7 80.5 80.6 80.1 79.8 79.2
The Annual Condition of Education Report 2017184

Table 5-19
Percent of Iowa Public High School Graduates/Seniors Intending to Pursue Postsecondary Education/Training by Postsecondary Institution, 2001 and 2012 to 2017
Source: Iowa Department of Education, Bureau of Information and Analysis, BEDS and SRI files.Notes: Data for the 2012 to 2017 graduating classes include students who received a regular diploma. Other completers, such
as students who received a certified attendance, are not included.
Table 5-20
Percent of Iowa Public High School Graduates/Seniors Intending to Pursue Postsecondary Education/Training at Four-Year and Two-Year Colleges, 2001 and 2012 to 2017
Source: Iowa Department of Education, Bureau of Information and Analysis, BEDS and SRI files.Note: Data for the 2012 to 2017 graduating classes include students who received a regular diploma. Other completers, such
as students who received a certified attendance, are not included.
Graduating ClassPostsecondary Institution 2001 2012 2013 2014 2015 2016 2017
Private 4-Year College 14.9 13.3 12.9 12.7 12.4 11.1 11.5Public 4-Year College 27.3 25.5 26.7 26.9 27.5 28.9 28.1
Private 2-Year College 5.2 0.9 0.9 0.8 0.6 0.5 0.6Community College 31.0 38.4 37.7 37.8 37.3 36.8 36.4
Other Training 4.3 2.6 2.4 2.4 2.3 2.4 2.7Total 82.7 80.7 80.5 80.6 80.1 79.8 79.2
Graduating ClassPostsecondary Institution 2001 2012 2013 2014 2015 2016 2017
Four-Year College 42.2 38.7 39.6 39.7 39.9 40.0 39.5Two-Year College 36.2 39.3 38.6 38.5 37.9 37.4 37.0
The Annual Condition of Education Report 2017185

Figure 5-78
Percent of Iowa Public High School Graduates/Seniors Intending to Pursue Postsecondary Education/Training at Four-Year and Two-Year Colleges 2001 and 2006 to 2017
36.238.1
39.1
39.2 40.5 41.3 39.3 39.3
38.6 38.5 37.9 37.4 37.0
42.2
39.3 39.8
39.0 37.6 37.5 38.4 38.7
39.6 39.739.9 40.0
39.5
0
10
20
30
40
50
2001 2006 2007 2008 2009 2010 2011 2012 2013 2014 2015 2016 2017
Perc
ent
Graduating Class
Two-Year College Four-Year College
Source: Iowa Department of Education, Bureau of Information and Analysis, BEDS and SRI files.Note: Data for the 2010 to 2017 graduating classes include students who received a regular diploma. Other completers, such
as students who received a certified attendance, are not included.
The Annual Condition of Education Report 2017186

DropoutsThe National Center for Education Statistics (NCES) definitions used for dropouts include students who satisfy one or more of the following conditions:
• Was enrolled in school at some time during the previous school year and was not enrolled as of Count Day of the current year or
• Was enrolled in school at some time during the previous school year and left the school before the previous summer and
• Has not graduated from high school or completed a state or district-approved educational program; and
• Does not meet any of the following exclusionary conditions:
a) transfer to another public school district, private school, or state or district-approved educational program, b) temporary school-recognized absence for suspension or illness, c) death, or d) move out of the state or leave the country.
A student who has left the regular program to attend an adult program designed to earn a High School Equivalency Diploma (HSED) or an adult high school diploma administered by a community college is considered a dropout. However, a student who enrolls in an alternative school or alternative program administered by a public school district is NOT considered a dropout.
The numerator of the grades 7-12 dropout rate (or grades 9-12 dropout rate) is the total number of drop-outs for grades 7-12 (or the total number of dropouts for grades 9-12) and the denominator is the total enrollment of grades 7-12 (or total enrollment of grades 9-12).
Figure 5-79 shows the two statewide public school trends, the lower line is for grades 7-12 and the upper line is for grades 9-12 dropout rates. Both rates increased in 2015-2016.
The public school dropout distributions by grade and enrollment categories for 2015-2016 are available in Table 5-21. Grade 12 had the highest number and percent of dropouts. Districts with enrollments of 7,500 and above accounted for more than 41 percent of the total dropouts while comprised less than 30 percent of the total enrollment in grades 7 to 12.
Table 5-22 shows the dropout rates by gender. Males had a higher dropout rate than females in all years shown.
The public school grade 7-12 dropout and enrollment data by race/ethnicity are presented in Table 5-23 and Table 5-24.
Table 5-25 shows the distribution of the dropout rate by Iowa public school districts.
The Annual Condition of Education Report 2017187

Figure 5-79
Iowa Public School Grades 7-12 and Grades 9-12 Dropout Rates 2000-2001, and 2004-2005 and 2009-2010 to 2015-2016
2.70
2.14
3.41 3.383.20
2.822.70
2.48
2.81
1.85
1.44
2.34 2.322.18
1.92 1.841.69
1.92
0.0
0.5
1.0
1.5
2.0
2.5
3.0
3.5
4.0P
erce
nt
School Year
Grade 9-12 Grade 7-12
Source: Iowa Department of Education, Bureau of Information and Analysis, Basic Educational Data Survey and Student Report-ing in Iowa Enrollment and Dropout files.
The Annual Condition of Education Report 2017188

Table 5-21
Total Iowa Public School Grades 7-12 Dropouts and Enrollments by Enrollment Category 2015-2016
Source: Iowa Department of Education, Bureau of Information and Analysis, Student Reporting in Iowa files.Notes: Figures may not total 100 percent due to rounding. Up to state: The student is in foster care, has an IEP, and parental rights have been terminated or parents have moved
out-of-state and cannot be found. Also used for students residing on public university property in Ames, Iowa City, and Cedar Falls.
Table 5-22
Total Iowa Public School Grades 7-12 Dropouts by Gender 2000-2001, 2014-2015 and 2015-2016
Source: Iowa Department of Education, Bureau of Information and Analysis, Basic Educational Data Survey and Student Report-ing in Iowa Enrollment and Dropout files.
Grade LevelEnrollment
Category7 8 9 10 11 12 Total
Dropouts% of Total Dropouts
Total Enrollment
% of Total Enrollment
Dropout Rate
<300 1 1 4 5 13 12 36 0.85% 2,686 1.22% 1.34%300-599 5 2 11 26 93 160 297 7.03% 22,640 10.29% 1.31%600-999 3 1 17 30 78 174 303 7.17% 29,388 13.36% 1.03%
1,000-2,499 2 7 22 82 221 401 735 17.40% 55,585 25.27% 1.32%2,500-7,499 6 5 30 72 236 510 859 20.33% 43,960 19.98% 1.95%
7500+ 16 10 97 224 437 963 1,747 41.35% 65,595 29.82% 2.66%Up to state 6 6 21 51 84 80 248 5.87% 137 0.06%
State 39 32 202 490 1,162 2,300 4,225 100.00% 219,991 100.00% 1.92%
2000-2001 2014-2015 2015-2016Female Dropout Rate 1.60% 1.41% 1.59%
Male Dropout Rate 2.08% 1.95% 2.23%Female Dropouts as a Percent of Total Dropouts 42.39% 40.54% 40.28%
Female Enrollment as a Percent of Total Enrollment 48.91% 48.54% 48.56%
The Annual Condition of Education Report 2017189

Table 5-23
Iowa Public School Grades 7-12 Dropout Rates (Percent) by Race/Ethnicity 2013-2014 to 2015-2016
Source: Iowa Department of Education, Bureau of Information and Analysis, Student Reporting in Iowa 2015 Fall Enrollment and 2016 Spring Dropout files.
Note: Figures may not total 100 percent due to rounding.
.
Table 5-24
Percent of Dropouts and Enrollment for Iowa Public School Grades 7-12 by Race/Ethnicity 2000-2001, 2014-2015 and 2015-2016
Source: Iowa Department of Education, Bureau of Information and Analysis, Basic Educational Data Survey and Student Report-ing in Iowa Enrollment and Dropout files.
Note: Figures may not total 100 percent due to rounding.
Race/Ethnic Group 2013-2014 2014-2015 2015-2016African American 4.93 3.79 4.55American Indian 4.41 4.27 4.46
Asian 1.09 0.87 1.02Hispanic 2.87 3.13 3.46
Native Hawaiian/Pacific Islander 1.79 2.34 1.85Two or More Races 3.05 2.82 2.87
White 1.50 1.36 1.53State Total 1.84 1.69 1.92
Percent of Dropouts Percent of EnrollmentRace/Ethnic Group 2000-2001 2014-2015 2015-2016 2000-2001 2014-2015 2015-2016
African American 7.9% 11.98% 13.11% 3.1% 5.34% 5.53%American Indian 1.7% 1.08% 0.95% 0.5% 0.43% 0.41%
Asian 1.5% 1.19% 1.28% 1.8% 2.32% 2.40%Hispanic 8.8% 16.84% 17.11% 2.8% 9.10% 9.50%
Native Hawaiian/Pacific Islander 0.24% 0.19% 0.18% 0.20%Two or More Races 4.61% 4.40% 2.77% 2.95%
White 80.1% 64.05% 62.96% 91.8% 79.87% 79.01%
The Annual Condition of Education Report 2017190

Table 5-25
Distribution of Grades 7-12 Dropout Rates for Iowa Public School Districts 2015-2016
Source: Iowa Department of Education, Bureau of Information and Analysis, Student Reporting in Iowa 2015 Fall Enrollment and 2016 Spring Dropout files.
Note: Dropout rates are combined grades 7-12 dropouts divided by combined grades 7-12 enrollment and expressed as a percent.
Dropout Rate Number of Districts Percent of Districts Cumulative Percent0.00 44 13.21% 13.21%
.01-.50 43 12.91% 26.13%.51-1.00 76 22.82% 48.95%
1.01-1.50 63 18.92% 67.87%1.51-2.00 41 12.31% 80.18%2.01-2.50 31 9.31% 89.49%2.51-3.00 4 1.20% 90.69%3.01-3.50 6 1.80% 92.49%3.51-4.00 4 1.20% 93.69%
>4.00 21 6.31% 100.00%
The Annual Condition of Education Report 2017191

High School Graduates and Graduation RatesThis section reports 12 years of trend data on the number of high school graduates in Iowa public schools and displays a four-year cohort graduation rate trend for the graduating classes of 2009 to 2016. In addi-tion, a five-year cohort graduation rate is reported for the graduating classes of 2014 and 2015.
High School GraduatesA public high school completer can receive a high school diploma or a certificate. The No Child Left Behind (NCLB) Act defines the regular diploma recipients as high school graduates.
Other completers, students who have finished the high school program, but did not earn a diploma, are not high school graduates based on the Iowa Consolidated State Application Accountability Workbook.
Figure 5-80 shows the number of regular diploma recipients by school year from 2004-2005 to 2015-2016. The counts in this figure include the students who earn a regular diploma in four years and the students who receive regular diplomas in less or more than four years.
Figure 5-80
Number of Iowa Public School Graduates 2004-2005 to 2015-2016
33,547 33,693 34,140 34,573 33,926
34,462 33,853
33,231 32,547 32,920 32,748 33,003
20,000
22,000
24,000
26,000
28,000
30,000
32,000
34,000
36,000
Num
ber o
f Gra
duat
es
School Year
Source: Iowa Department of Education, Bureau of Information and Analysis, Student Reporting in Iowa files.
The Annual Condition of Education Report 2017192

High School Graduation Rates
With the statewide identification system and Student Reporting in Iowa (SRI) data, Iowa can follow the same group of students over several years and implement the first-time freshman cohort rates (students who repeated their 9th grade year were not included in the cohort). The four-year cohort graduation rate is calculated for the class of 2016 by dividing the number of students in the cohort (denominator) who graduate with a regular high school diploma in four years or less by the number of first-time 9th graders enrolled in the fall of 2012 minus the number of students who transferred out plus the total number of students who transferred in.
Iowa Four-Year Cohort Graduation Rate = (FG + TIG) / (F + TI - TO) For the graduating class of 2016 FG -- First-time 9th grade students in fall of 2012 and graduated in 2016 or earlier TIG-- Students who transferred in grades 9 to 12 and graduated in 2016 or sooner F -- First-time 9th grade students in fall of 2012 TI -- Transferred in the first-time 9th graders’ cohort in grades 9 to 12 TO -- Transfer out (including emigrates and deceased)
First-time freshmen and transferred-in students include: resident students attending a public school in the district; non-resident students open-enrolled in, whole-grade sharing in, or tuition in; and foreign students on Visa. Those excluded are: home-schooled and nonpublic schooled students; public school students en-rolled in another district, but taking courses on a part-time basis; and foreign exchange students. Students receiving regular diplomas are included as graduates in the numerator. Early graduates are included in the original cohort. All students who take longer to graduate (including students with IEPs) are included in the denominator, but not in the numerator for the four-year rate.
Figure 5-81
Iowa Public High School Four-Year Cohort Graduation Rate for the Graduating Classes of 2009 to 2016
87.3%88.8% 88.3% 89.3% 89.7% 90.5% 90.8% 91.3%
50%
55%
60%
65%
70%
75%
80%
85%
90%
95%
100%
2009 2010 2011 2012 2013 2014 2015 2016
Per
cent
Graduating Class
Source: Iowa Department of Education, Bureau of Information and Analysis, Student Reporting in Iowa file.
The Annual Condition of Education Report 2017193

The five-year cohort graduation rate is calculated using a similar methodology as the four-year cohort rate. The five-year cohort graduation rate for the class of 2015 is calculated by dividing the number of students in the cohort (denominator) who graduate with a regular high school diploma in five years or less (by the 2015-2016 school year) by the number of first-time 9th graders enrolled in the fall of 2011 minus the number of students who transferred out (between 2011 and 2015) plus the total number of students who transferred in (between 2011 and 2015). The five-year cohort rate will maintain the same denominator as the previous year’s four-year cohort rate, simply adding students who graduate in the fifth year to the numerator.
Table 5-26 displays the four-year cohort graduation rates for the graduating classes of 2015 and 2016. The rates listed are for all students and 13 subgroups. In gender comparison, females had higher graduation rates than males on average. Among the ethnic/race subgroups, white and Asian students had higher graduation rates than other race groups; the students who were eligible for free reduced price lunch and IEP, English language learners (ELL), migrant, and male students had graduation rates lower than all student groups on average.
Table 5-26
Iowa Public High School Four-Year Cohort Graduation Rate by Subgroup for the Graduation Classes of 2015 and 2016
Class of 2015 Class of 2016
Group Numerator DenominatorGraduation
Rate Numerator DenominatorGraduation
Rate
All Students 30,802 33,932 90.8% 31,511 34,528 91.3%African American 1,251 1,579 79.2% 1,343 1,685 79.7%
American Indian 131 153 85.6% 108 134 80.6%Asian 727 784 92.7% 745 814 91.5%
Hawaiian or Pacific Islander
38 44 86.4% 37 42 88.1%
Hispanic 2,250 2,719 82.8% 2,421 2,864 84.5%Two or More Races 668 796 83.9% 755 900 83.9%
White 25,737 27,857 92.4% 26,102 28,089 92.9%Disability* 3,377 4,384 77.0% 2,072 2,981 69.5%
ELL** 961 1,159 82.9% 1,001 1,239 80.8%Low SES*** 11,098 13,084 84.8% 11,860 14,141 83.9%
Migrant 79 95 83.2% 59 76 77.6%Female 15,399 16,596 92.8% 15,741 16,917 93.0%
Male 15,403 17,336 88.8% 15,770 17,611 89.5%Source: Iowa Department of Education, Bureau of Information and Analysis, Student Reporting in Iowa files.Notes: * Disability status is determined by the presence of an individualized education program (IEP). ** ELL indicates English language learner. *** Low SES is determined by the eligibility for free or reduced price meals. Numbers may be redacted due to small cell size; therefore, the numbers may not sum total.
The Annual Condition of Education Report 2017194

The five-year cohort graduation rates for the graduating classes of 2014 and 2015 are displayed in 5-27.
Table 5-27
Iowa Public High School Five-Year Cohort Graduation Rate by Subgroup for the Graduation Classes of 2014 and 2015
Source: Iowa Department of Education, Bureau of Information and Analysis, Student Reporting in Iowa files.Notes: * Disability status is determined by the presence of an individualized education program (IEP). ** ELL indicates English language learner. *** Low SES is determined by the eligibility for free or reduced price meals.
Based on the U.S. Department of Education data (Table 5-28), Iowa had the highest four-year cohort graduation rate for the class of 2015 in the nation.
Class of 2014 Class of 2015Enrollment Category Numerator Denominator Graduation
RateNumerator Denominator Graduation
Rate
All Students 31,631 33,969 93.1% 31,657 33,932 93.3%African American 1,266 1,514 83.6% 1,342 1,579 85.0%American Indian 126 152 82.9% 138 153 90.2%
Asian 699 738 94.7% 758 784 96.7%Hawaiian or Pacific
Islander 32 35 91.4% 41 44 93.2%
Hispanic 2,250 2,599 86.6% 2,386 2,719 87.8%
Two or More Races 703 789 89.1% 697 796 87.6%White 26,555 28,142 94.4% 26,295 27,857 94.4%
Disability* 3,800 4,474 84.9% 3,709 4,384 84.6%ELL** 992 1,126 88.1% 1,027 1,159 88.6%
Low SES*** 11,524 13,110 87.9% 11,582 13,084 88.5%Migrant 79 95 83.2% 82 95 86.3%Female 15,698 16,605 94.5% 15,726 16,596 94.8%
Male 15,933 17,364 91.8% 15,931 17,336 91.9%
The Annual Condition of Education Report 2017195

Table 5-28
Class of 2015 Public High School Four Year Adjusted Cohort Graduation Rates (ACGR) [in %]
Race/Ethnicity
State All Students
White Black Hispanic Asian/ Pacific Islander
American Indian/ Alaska Native
Students with Disabilities
Limited English Proficient
Economically Disadvantaged
United States 83 88 75 78 90 72 65 65 76
Alabama 89 91 87 90 93 90 72 75 85
Alaska 76 80 71 72 83 64 57 56 67
Arizona 77 83 73 73 87 67 64 34 73
Arkansas 85 87 78 85 86 80 82 86 82
California 82 88 71 79 92 73 65 69 78
Colorado 77 83 70 68 87 64 54 61 66
Connecticut 87 93 78 75 95 87 66 67 76
Delaware 86 88 83 81 94 69 66 69 76
District of Columbia
69 86 67 68 79 ‡ 46 62 68
Florida 78 83 68 77 91 76 57 60 70
Georgia 79 83 75 72 88 76 54 56 75
Hawaii 82 79 74 75 83 61 60 46 76
Idaho 79 81 75 71 84 66 58 72 72
Illinois 86 90 76 81 94 79 71 72 78
Indiana 87 90 75 83 88 86 71 75 84
Iowa 91 92 79 83 92 85 77 83 85
Kansas 86 88 79 78 91 81 77 77 77
Kentucky 88 89 80 83 91 81 66 67 85
Louisiana 78 83 71 75 90 76 44 50 71
Maine 88 88 80 80 93 82 74 77 76
Maryland 87 92 82 77 96 79 64 49 79
Massachu-setts
87 92 78 72 92 80 70 64 78
Michigan 80 84 67 72 90 71 57 72 68
Minnesota 82 87 62 66 83 52 61 63 67
Mississippi 81 85 77 81 94 82 34 68 77
Missouri 88 91 76 84 93 86 77 71 81Montana 86 89 82 83 95 67 75 62 77
The Annual Condition of Education Report 2017196

Table 5-28 (…continued)
Source: National Center for Education Statistics, Digest of Education Statistics, 2016 (Table 219.46).Notes: --- Not Available; <> Data were suppressed to protect the confidentiality of individual student data. The estimated for American Indian/Alaska Native students also includes imputed data for Virginia. The four-year ACGR is the number of students who graduate in four years with a regular high school diploma divided by
the number of students who form the adjusted cohort for the graduating class. From the beginning of 9th grade (or the earliest high school grade), students who are entering that grade for the first time form a cohort that is “adjusted” by adding any students who subsequently transfer into the cohort and subtracting any students who subsequently transfer out, emigrate to another country, or die. To protect the confidentiality of individual student data, ACGRs are shown at varying levels of precision depending on the size of the cohort population for each category cell. There are some differences in how states implemented the requirements for the ACGR, leading to the potential for differences across states in how the rates are calculated. This is particularly applicable to the population of children with disabilities. Black includes African American, Hispanic includes Latino, Asian/Pacific Islander includes Native Hawaiian or Other Pacific Islander, and American Indian includes Alaska Native. Race categories exclude Hispanic origin unless specified.
Race
State All Students
White Black Hispanic Asian/ Pacific
Islander
American Indian/ Alaska Native
Students with
Disabilities
Limited English
Proficient
Economically Disadvantaged
Nebraska 89 93 75 82 79 76 71 55 81
Nevada 71 78 56 67 82 58 29 32 64
New Hampshire 88 89 80 75 91 75 73 77 77
New Jersey 90 94 82 83 96 89 78 74 82
New Mexico 69 74 61 67 79 63 59 64 64
New York 79 89 67 66 85 65 53 36 71
North Carolina 86 88 82 80 92 82 67 58 80
North Dakota 87 91 76 75 78 60 68 62 71
Ohio 81 86 60 70 86 75 67 50 69
Oklahoma 83 84 77 79 89 82 76 60 78
Oregon 74 76 63 67 84 55 53 51 66
Pennsylvania 85 89 72 70 91 76 72 63 76
Rhode Island 83 87 77 76 87 65 68 77 76
South Carolina 80 83 77 77 91 80 49 76 74
South Dakota 84 90 72 70 81 49 60 56 67
Tennessee 88 91 81 84 93 85 70 75 84
Texas 89 93 85 87 95 86 78 73 86
Utah 85 87 70 74 86 70 68 66 77
Vermont 88 89 81 82 76 >=50 72 69 78
Virginia 86 90 79 76 92 --- 53 45 75
Washington 78 81 69 70 86 60 58 56 68
West Virginia 87 87 83 83 >=95 71 69 86 83
Wisconsin 88 93 64 78 91 78 68 62 77
Wyoming 79 82 68 72 88 45 59 64 66
The Annual Condition of Education Report 2017197

Table 5-31
K-12 Out-of-School Suspensions by Problem Behavior 2016-2017
Source: Iowa Department of Education, Bureau of Information and Analysis, SRI unilateral removal and student archive files.
Problem Behavior Removals Distinct Students
In-School Suspensions % Removals
Abusive/Inappropriate language 1,704 1,420 6.8%
Alcohol Related 264 260 1.1%
Arson 27 27 0.1%
Bomb Threat 22 21 0.1%
Bullying 277 261 1.1%
Combustible Related 176 172 0.7%
Defiance - Noncompliance 4,437 3,140 17.7%
Disrespect 715 638 2.9%
Disruption 1,541 1,288 6.1%
Dress Code Violation 15 15 0.1%
Drug Related 1,013 940 4.0%
Forgery - Plagiarism 3 3 0.0%
Gang Affiliation Display 18 16 0.1%
Harrassment 508 474 2.0%
Inappropriate Display of Affection 62 62 0.2%
Inappropriate Location 186 165 0.7%
Lying - Cheating 14 14 0.1%
Other 1,303 1,114 5.2%
Physical Aggression with Injury 1,815 1,522 7.2%
Physical Aggression with Serious Injury 30 29 0.1%
Physical Aggresssion without Injury 4,726 3,588 18.8%
Physical Fighting with Injury 620 586 2.5%
Physical Fighting with Serious Injury 27 27 0.1%
Physical Fighting without Injury 3,094 2,705 12.3%
Property Damage - Vandalism 266 252 1.1%
Skip Class 142 128 0.6%
Special Ed ALJ Decision 2 2 0.0%
Tardy 16 15 0.1%
Technology Violation 224 219 0.9%
Theft 417 391 1.7%
Tobacco Related 503 468 2.0%
Truancy 296 255 1.2%
Weapons Related 611 587 2.4%
Totals 25,074 20,804 100%
The Annual Condition of Education Report 2017198

Table 5-32
K-12 Expulsions by Problem Behavior 2016-2017
Source: Iowa Department of Education, Bureau of Information and Analysis, SRI unilateral removal and student archive files.
Problem Behavior Removals Expulsions % Removals
Abusive/Inappropriate language 0 0.0%
Alcohol Related 2 1.7%
Arson 1 0.8%
Bomb Threat 0 0.0%
Bullying 2 1.7%
Combustible Related 4 3.3%
Defiance - Noncompliance 6 5.0%
Disrespect 0 0.0%
Disruption 3 2.5%
Dress Code Violation 0 0.0%
Drug Related 52 43.3%
Forgery - Plagiarism 0 0.0%
Gang Affiliation Display 0 0.0%
Harassment 2 1.7%
Inappropriate Display of Affection 0 0.0%
Inappropriate Location 1 0.8%
Lying - Cheating 0 0.0%
Other 4 3.3%
Physical Aggression with Injury 4 3.3%
Physical Aggression with Serious Injury 0 0.0%
Physical Aggression without Injury 3 2.5%
Physical Fighting with Injury 6 5.0%
Physical Fighting with Serious Injury 1 0.8%
Physical Fighting without Injury 1 0.8%
Property Damage - Vandalism 2 1.7%
Skip Class 0 0.0%
Special Ed ALJ Decision 0 0.0%
Tardy 0 0.0%
Technology Violation 5 4.2%
Theft 2 1.7%
Tobacco Related 2 1.7%
Truancy 0 0.0%
Weapons Related 17 14.2%
Totals 120 100%
The Annual Condition of Education Report 2017199

Table 5-33
K-12 Removals to an Interim Setting - School Personnel by Problem Behavior 2016-2017
Source: Iowa Department of Education, Bureau of Information and Analysis, SRI unilateral removal and student archive files.Note: These values do not include five records for Interim Settings by an Administrative Law Judge.
Problem Behavior Removals Interim Settings
% Removals
Abusive/Inappropriate language 15 7.9%
Alcohol Related 0 0.0%
Arson 0 0.0%
Bomb Threat 0 0.0%
Bullying 1 0.5%
Combustible Related 0 0.0%
Defiance - Noncompliance 34 17.9%
Disrespect 7 3.7%
Disruption 29 15.3%
Dress Code Violation 0 0.0%
Drug Related 7 3.7%
Forgery - Plagiarism 0 0.0%
Gang Affiliation Display 0 0.0%
Harrassment 4 2.1%
Inappropriate Display of Affection 0 0.0%
Inappropriate Location 1 0.5%
Lying - Cheating 0 0.0%
Other 31 16.3%
Physical Aggression with Injury 4 2.1%
Physical Aggression with Serious Injury 0 0.0%
Physical Aggresssion without Injury 12 6.3%
Physical Fighting with Injury 6 3.2%
Physical Fighting with Serious Injury 1 0.5%
Physical Fighting without Injury 8 4.2%
Property Damage - Vandalism 3 1.6%
Skip Class 11 5.8%
Special Ed ALJ Decision 0 0.0%
Tardy 2 1.1%
Technology Violation 1 0.5%
Theft 2 1.1%
Tobacco Related 1 0.5%
Truancy 8 4.2%
Weapons Related 2 1.1%
Totals 190 100%
The Annual Condition of Education Report 2017200

Suspensions and ExpulsionsIn-school suspensions, out-of-school suspensions, expulsions, and removals to an interim setting can be given to students because of incidents that occur on school property. Table 5-29 shows public school re-movals by type. In-School Suspensions comprise 49.1 percent of all removals, Out-of-School Suspensions at 50.3 percent. Removals went down over 11 percent in 2016-2017 from 2014-2015, but increased 2.7 percent since 2015-2016. When multiple offenses are removed from the counts to reveal the number of unique students involved, about 5.3 percent of enrolled students statewide are affected.
An in-school suspension is defined as an:
Administrative removal of a student from regular classes or activities for disciplinary reasons, the student continues to be under the supervision of the school district.
School district personnel were instructed to report all in-school suspensions regardless of their length. Therefore, an in-school suspension lasting as little as one period of the day is included in this data, as long as the removal was initiated and/or approved by building or district administration. Detail distribution of reason for in-school removal is illustrated in Table 5-30.
An out-of-school suspension is defined as an:
Administrative removal of a student from regular classes or activities for disciplinary reasons.
Again, school district personnel were instructed to report all out-of-school suspensions regardless of their length. Detail distribution of reason for out-of-school suspension is illustrated in Table 5-31.
An expulsion is defined as:
School board action resulting in the removal of a student “from the rolls” of a district (unless the student has an IEP and requires continuing services) for disciplinary reasons.
If the length of a student expulsion is greater than the remaining number of days in the current school year and the student returns to the district the following school year, district personnel are instructed to report the expulsion in both school years. In each of the past three years, expulsions were most often given as a result of drug-related incidents (Table 5-32).
For removals to an interim setting initiated by school personnel given to special education students, the reason for removal must be drug related, weapons related, or due to serious bodily injury with a maximum length of 45 days. There are no similar restrictions for placement of regular education students.
Tables 5-34 to 5-36 show removal information by subgroups, grade span, and district enrollment size categories.
The Annual Condition of Education Report 2017201

Table 5-29
K-12 Removals by Removal Type 2014-2015 to 2016-2017
Source: Iowa Department of Education, Bureau of Information and Analysis, SRI unilateral removal and student archive files.Note: Figures may not total due to rounding. *These values include five records for Interim Settings by an Administrative Law Judge.
Removals (includes multiple offenses) % of Removals
2016-2017
% Change 2014-2015 to
2016-20172014-2015 2015-2016 2016-2017
In-School Suspensions
32,293 25,268 24,453 49.1% -24.3%
Out-of-School Suspensions
23,499 22,700 25,074 50.3% 6.7%
Expulsions 114 122 120 0.2% 5.3%Interim Setting by School Personnel
126 446* 190 0.4% 50.8%
Total 56,032 48,536 49,837 100% -11.1%
The Annual Condition of Education Report 2017202

Table 5-30
K-12 In-School Suspensions by Problem Behavior 2016-2017
Source: Iowa Department of Education, Bureau of Information and Analysis, SRI unilateral removal and student archive files.
Problem Behavior Removals Distinct Students
In-School Suspensions % Removals
Abusive/Inappropriate language 1,871 1,609 7.7%
Alcohol Related 78 76 0.3%
Arson 6 6 0.0%
Bomb Threat 7 7 0.0%
Bullying 361 336 1.5%
Combustible Related 70 70 0.3%
Defiance - Noncompliance 4,701 3,342 19.2%
Disrespect 1,221 1,083 5.0%
Disruption 1,935 1,594 7.9%
Dress Code Violation 29 28 0.1%
Drug Related 143 139 0.6%
Forgery - Plagiarism 35 34 0.1%
Gang Affiliation Display 2 2 0.0%
Harrassment 589 565 2.4%
Inappropriate Display of Affection 56 53 0.2%
Inappropriate Location 209 190 0.9%
Lying - Cheating 60 56 0.2%
Other 1,549 1,277 6.3%
Physical Aggression with Injury 718 673 2.9%
Physical Aggression with Serious Injury 27 26 0.1%
Physical Aggresssion without Injury 3,442 2,940 14.1%
Physical Fighting with Injury 306 273 1.3%
Physical Fighting with Serious Injury 6 6 0.0%
Physical Fighting without Injury 1,602 1,469 6.6%
Property Damage - Vandalism 277 270 1.1%
Skip Class 999 776 4.1%
Special Ed ALJ Decision 0 0.0%
Tardy 487 340 2.0%
Technology Violation 363 343 1.5%
Theft 590 537 2.4%
Tobacco Related 309 297 1.3%
Truancy 2,160 1,364 8.8%
Weapons Related 245 244 1.0%
Totals 24,453 20,025 100%
The Annual Condition of Education Report 2017203

Table 5-34
K-12 Removals by Race/Ethnicity for 2014-2015 to 2016-2017
Source: Iowa Department of Education, Bureau of Information and Analysis, SRI unilateral removal and student archive files.Note: Figures may not total due to rounding.
Table 5-35
K-12 Removals by Grade Span for 2014-2015 to 2016-2017
Source: Iowa Department of Education, Bureau of Information and Analysis, SRI unilateral removal and student archive files.Note: Figures may not total due to rounding.
Removals % of Removals 2016-2017
% of K-12 Enrollment 2016-2017
% Change in Removals
2014-2015 to 2016-2017
2014-2015 2015-2016 2016-2017
African American 11,580 10,162 10,621 21.3% 5.5% -8.3%American Indian 350 271 337 0.7% 0.4% -3.7%
Asian 404 297 320 0.6% 2.3% -20.8%Hispanic 7,720 5,802 5,711 11.5% 10.0% -26.0%
Hawaiian or Pacific Islander
119 125 127 0.3% 0.2% 6.7%
White 32,521 28,828 29,314 58.8% 78.3% -9.9%Multi-Racial 3,338 3,051 3,407 6.8% 3.4% 2.1%
Total 56,032 48,536 49,837 100.0% 100.0% -11.1%
Removals % of Removals 2016-2017
% of K-12 Enrollment 2016-2017
% Change in Removals
2014-2015 to 2016-2017
Grade Span 2014-2015 2015-2016 2016-2017
K-2 3,224 3,150 3,842 7.7% 23.6% 19.2%3-5 5,904 5,777 7,070 14.2% 23.1% 19.7%6-8 17,889 16,998 18,755 37.6% 22.6% 4.8%
9-12 29,015 22,611 20,170 40.5% 30.8% -30.5%
Total 56,032 48,536 49,837 100.0% 100.0% -11.1%
The Annual Condition of Education Report 2017204
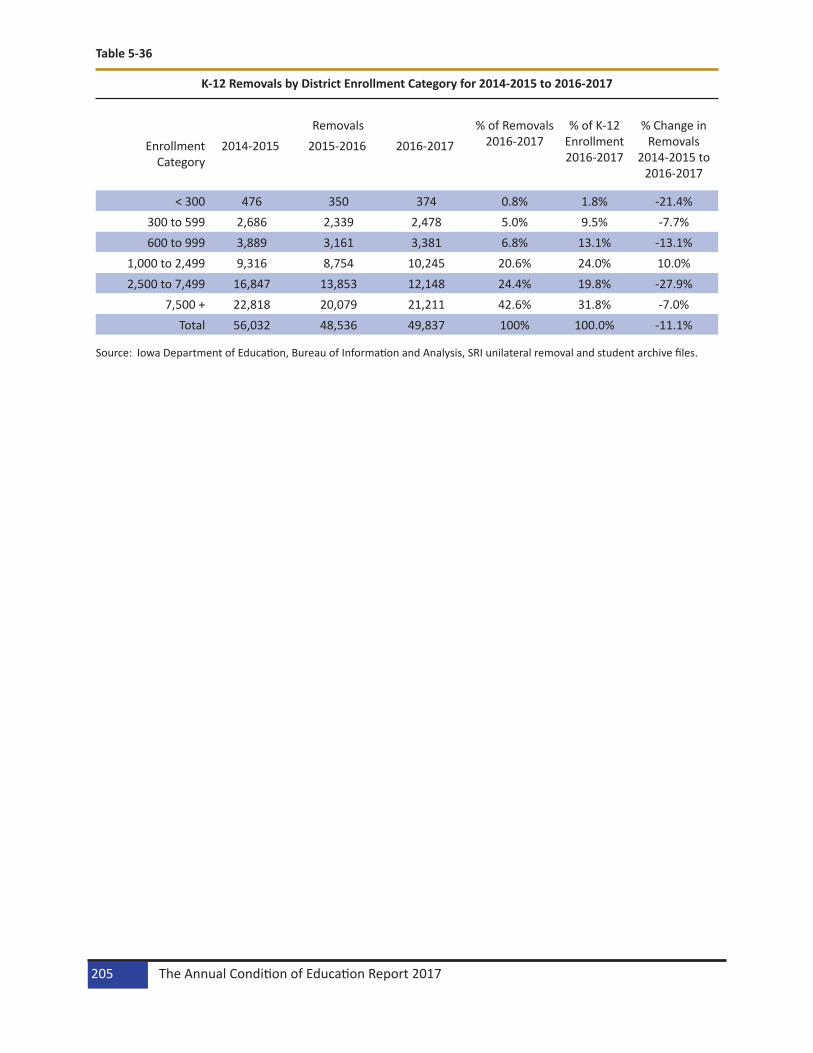
Table 5-36
K-12 Removals by District Enrollment Category for 2014-2015 to 2016-2017
Source: Iowa Department of Education, Bureau of Information and Analysis, SRI unilateral removal and student archive files.
Removals % of Removals 2016-2017
% of K-12 Enrollment 2016-2017
% Change in Removals
2014-2015 to 2016-2017
Enrollment Category
2014-2015 2015-2016 2016-2017
< 300 476 350 374 0.8% 1.8% -21.4%300 to 599 2,686 2,339 2,478 5.0% 9.5% -7.7%600 to 999 3,889 3,161 3,381 6.8% 13.1% -13.1%
1,000 to 2,499 9,316 8,754 10,245 20.6% 24.0% 10.0%2,500 to 7,499 16,847 13,853 12,148 24.4% 19.8% -27.9%
7,500 + 22,818 20,079 21,211 42.6% 31.8% -7.0%Total 56,032 48,536 49,837 100% 100.0% -11.1%
The Annual Condition of Education Report 2017205

The Annual Condition of Education Report 2017206

The Annual Condition of Education Report 2017207

Special EducationIowa reports annually on the conditions and performance of students with disabilities ages 3-21 in the An-nual Performance Report (APR) for Part B of the Individuals with Disabilities Education Act (IDEA) submitted to the Office of Special Education Programs on February 1 of each year. Performance is measured against state targets that are set in the State Performance Plan (SPP) every six years using baseline data along with input from various stakeholders. Measures of compliance with IDEA are also reported in the SPP and APR. Some of the measures of performance presented in this section are modified from Iowa’s Part B APR, which is accessible in its entirety at: https://www.educateiowa.gov/annual-progress-report-part-b.
Other measures in this section are included to address the four areas that special education stakeholders in the state have agreed are important to monitor and with which to compare students with and without disabilities.
• Students come to school ready to learn
• Students attend school in safe and caring environments
• Students achieve at high levels
• Students leave school ready for life
Context of Special Education in IowaIdentification RatesThe identification rate refers to the percentage of students who are identified as needing special education services. The following graph presents the special education identification rate for students ages 6-21 from 2011-2012 to 2015-2016. From the 2011-2012 school year to the 2015-2016 school year, the rate has decreased by 0.25 percent.
Figure 6-1
Special Education Identification Rate for Students Ages 6-21, 2011-2012 to 2015-2016
0
5
10
15
20
2011-2012 2012-2013 2013-2014 2014-2015 2015-2016ID Rate 12.79 12.29 12.02 12.61 12.54
Per
cent
Sources: Iowa Department of Education, Bureau of School Improvement, Information Management System, Count Files; Bureau of Information and Analysis, SRI, Fall Student Files.
The Annual Condition of Education Report 2017207

PlacementChildren and students receiving special education services may be served in a variety of educational set-tings. Data are collected on these settings based on the amount of time children and students spend with their nondisabled peers. Over time, the percent of children/students served in settings with typically developing peers has increased significantly in Iowa.
The following graphs show the percentage of students with disabilities ages 6-21 served (1) in the regular education classroom for the greatest percentage (80 percent or more) of the school day, (2) in the regu-lar education classroom for less than 40 percent of the school day, and (3) in private separate schools, residential placements, homebound or hospital placements. New targets were set for 2013-2018. In some cases, targets for the prior six year reporting period were deemed to be overly ambitious and were adjusted accordingly. This explains why some targets seem to be moving in the wrong direction between 2012 and 2013.
In 2015-2016, the percentage of students in the regular education classroom for 80 percent or more of the school day was 65.63, just over the state target of 65.00 percent. The percentage of students served in the regular education classroom for less than 40 percent of the school day was 8.90. This percentage was over the threshold, which was set at 8.50. The percentage of students served in other placements was below the state thresholds of 2.80 percent.
Figure 6-2
Percent of Students with Disabilities Ages 6-21 In the Regular Classroom 80 Percent or More of the Day 2011-2012 to 2015-2016
2011-2012 2012-2013 2013-2014 2014-2015 2015-2016State 64.18 64.03 64.51 64.92 65.63Target 75.00 80.00 65.00 65.00 65.00
0
20
40
60
80
100
Per
cent
Source: Iowa Department of Education, Bureau of School Improvement, Information Management System, Count Files.
The Annual Condition of Education Report 2017208
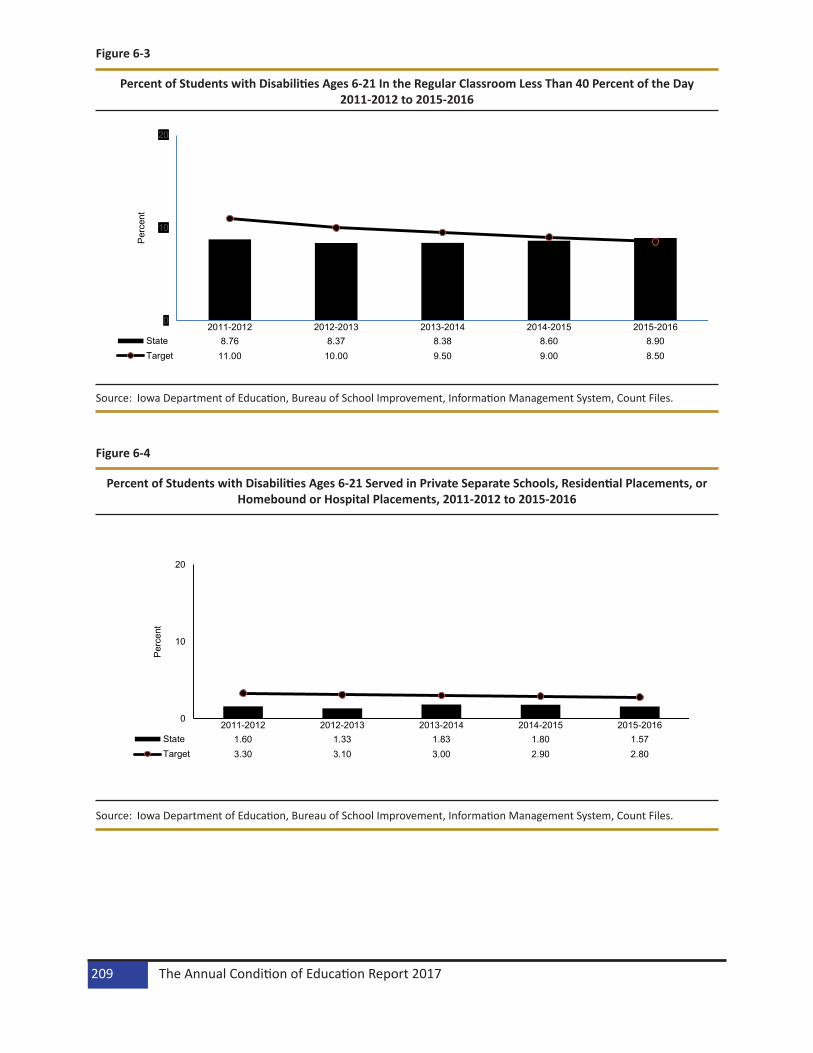
Figure 6-3
Percent of Students with Disabilities Ages 6-21 In the Regular Classroom Less Than 40 Percent of the Day 2011-2012 to 2015-2016
2011-2012 2012-2013 2013-2014 2014-2015 2015-2016State 8.76 8.37 8.38 8.60 8.90Target 11.00 10.00 9.50 9.00 8.50
0
10
20P
erce
nt
Source: Iowa Department of Education, Bureau of School Improvement, Information Management System, Count Files.
Figure 6-4
Percent of Students with Disabilities Ages 6-21 Served in Private Separate Schools, Residential Placements, or Homebound or Hospital Placements, 2011-2012 to 2015-2016
2011-2012 2012-2013 2013-2014 2014-2015 2015-2016State 1.60 1.33 1.83 1.80 1.57Target 3.30 3.10 3.00 2.90 2.80
0
10
20
Per
cent
Source: Iowa Department of Education, Bureau of School Improvement, Information Management System, Count Files.
The Annual Condition of Education Report 2017209

DisproportionalityDisproportionality refers to the percent probability, or likelihood, of disproportionate representation of racial and/or ethnic groups in special education and related services that is the result of inappropriate identification. The following graph shows the percent probability of overrepresentation (positive numbers) or underrepre-sentation (negative numbers) of each racial/ethnic group. In 2015, African American, and Native American students had the greatest disproportionality rates of overrepresentation at 71 percent and 62 percent respec-tively. Asian students had the greatest disproportionality rates of underrepresentation at -53 percent.
Figure 6-5
Percent Probability of Being Placed in Special Education Compared to All Students 2013-2014 to 2015-2016
74 72 71
10 10 11
-54 -53 -53
6053
62
-20 -20 -21
-10 -13 -10
14 17 19
-80
-60
-40
-20
0
20
40
60
80
2013-2014 2014-2015 2015-2016
African American
Hispanic
Asian
Native American
White
Pacific Islander
Multiracial
Source: Iowa Department of Education, Bureau of School Improvement, Information Management System, Count Files.
The Annual Condition of Education Report 2017210

Are Students Going to School in Safe and Caring Environments?Positive Behavioral Interventions and Supports (PBIS)PBIS are evidence-based interventions that are integrated into the classroom activities and environment to encourage positive behavioral and academic outcomes for all children. The following graph depicts the percentage of public school buildings using PBIS, which has increased by 19.02 percent since 2011.
Figure 6-6
Percent of Public School Buildings That Use Positive Behavioral Interventions and Supports 2011-2012 to 2015-2016
2011-2012 2012-2013 2013-2014 2014-2015 2015-2016% Bldgs 23.18 32.37 30.97 40.39 42.20
0
10
20
30
40
50
Per
cent
Source: Iowa Department of Education, Bureau of School Improvement, PBIS Files.
DisciplineData on disciplinary actions taken against students with IEPs are collected and reported for students ages 3-21 who are suspended and/or expelled for a total of more than ten days in a school year. A district is considered significantly discrepant for the discipline of students with IEPs if the percent of students with IEPs suspended/expelled for more than ten days in the school year for the district is at least 2 percent greater than the state-wide average percent of students with IEPs suspended/expelled for greater than ten days. The following graph presents the percent of districts with a significant discrepancy in the percentage of students with IEPs suspended/expelled for greater than ten days with respect to state targets from school year 2011-2012 to 2015-2016. Currently, 1.81 percent of districts have a significant discrepancy, which exceeds the state threshold of 1.40 percent. New targets were set for 2013-2018. In some cases, targets for the prior six year reporting period were deemed to be overly ambitious and were adjusted accordingly. This explains why some targets seem to be moving in the wrong direction between 2012 and 2013. Please note that per federal requirements, discipline data lag one year, which means that data reported for 2015-2016 were collected during the 2014-2015 school year.
The Annual Condition of Education Report 2017211

Figure 6-7
Percent of Districts Significantly Discrepant in Suspension/Expulsion of Students with Disabilities Greater Than Ten Days, 2011-2012 to 2015-2016
2011-2012 2012-2013 2013-2014 2014-2015 2015-2016State 1.39 1.99 1.45 1.73 1.81Threshold 1.00 1.00 1.50 1.40 1.40
0
1
2
3
Per
cent
Sources: Iowa Department of Education, Bureau of School Improvement, Information Management System, Count Files; Bureau of Information and Analysis, SRI, Fall Student Files.
The Annual Condition of Education Report 2017212

Are Students Achieving at High Levels?National Assessment of Educational Progress (NAEP) The NAEP, conducted by the U.S. Department of Education beginning in 1969, is the only national assess-ment of student achievement. The NAEP state assessments have been administered periodically in grades 4 and 8 since 1990 in the areas of reading, mathematics, science, and writing.
In 2014-2015 in reading, 21 percent of 4th grade students with IEPs and 78 percent of 4th grade students without IEPs scored at basic or above on the NAEP. During the same year, 30 percent of 8th graders with IEPs and 87 percent of 8th graders without IEPs scored at basic or above. The gap between students with and without disabilities was 56 percent for 4th graders and 56 percent for 8th graders in 2010-2011 and 57 percent for 4th graders and 57 percent for 8th graders in 2014-2015.
Figure 6-8
Percent of 4th Grade Students Scoring at Basic or Above on NAEP Reading, 2010-2011, 2012-2013 and 2014-2015
2010-2011 2012-2013 2014-2015IEP 20 19 21No IEP 76 79 78
0
20
40
60
80
100
Per
cent
Source: National Center for Education Statistics, NAEP Data Explorer.
Figure 6-9
Percent of 8th Grade Students Scoring at Basic or Above on NAEP Reading, 2010-2011, 2012-2013 and 2014-2015
2010-2011 2012-2013 2014-2015IEP 28 30 30No IEP 84 88 87
0
20
40
60
80
100
Per
cent
Source: National Center for Education Statistics, NAEP Data Explorer.
The Annual Condition of Education Report 2017213

In 2014-2015 in math, 46 percent of 4th grade students with IEPs and 89 percent of 4th grade students without IEPs scored at basic or above on the NAEP. During the same year, 26 percent of 8th graders with IEPs and 82 percent of 8th graders without IEPs scored at basic or above. The gap between students with and without disabilities was 41 percent for 4th graders and 55 percent for 8th graders in 2010-2011 and 43 percent for 4th graders and 56 percent for 8th graders in 2014-2015.
Figure 6-10
Percent of 4th Grade Students Scoring at Basic or Above on NAEP Mathematics2010-2011, 2012-2013 and 2014-2015
2010-2011 2012-2013 2014-2015IEP 51 54 46No IEP 92 91 89
0
20
40
60
80
100
Per
cent
Source: National Center for Education Statistics, NAEP Data Explorer.
Figure 6-11
Percent of 8th Grade Students Scoring at Basic or Above on NAEP Mathematics2010-2011, 2012-2013 and 2014-2015
2010-2011 2012-2013 2014-2015IEP 29 26 26No IEP 84 82 82
0
20
40
60
80
100
Per
cent
Source: National Center for Education Statistics, NAEP Data Explorer.
The Annual Condition of Education Report 2017214

Iowa AssessmentsThe standardized achievement tests, Iowa Assessments, are developed by Iowa Testing Programs (ITP) at The University of Iowa for use nationally in grades K-12. The following six graphs show the percentage of 4th, 8th, and 11th grade students proficient in reading and in math from 2011-2012 to 2015-2016. Distinctions are made between students with and without IEPs.
Figure 6-12
Percent of 4th Grade Students Proficient in Reading on Iowa Assessments2011-2012 to 2015-2016
2011-2012 2012-2013 2013-2014 2014-2015 2015-2016IEP 35.60 35.40 36.20 34.30 35.20No IEP 79.70 81.00 81.30 81.80 81.00
0
20
40
60
80
100
Per
cent
Source: Iowa Department of Education, Bureau of Information and Analysis, AYP files.
The Annual Condition of Education Report 2017215

Figure 6-13
Percent of 8th Grade Students Proficient in Reading on Iowa Assessments2011-2012 to 2015-2016
2011-2012 2012-2013 2013-2014 2014-2015 2015-2016IEP 20.30 19.80 30.00 26.10 26.30No IEP 72.20 73.10 81.30 85.10 81.70
0
20
40
60
80
100P
erce
nt
Source: Iowa Department of Education, Bureau of Information and Analysis, AYP files.
Figure 6-14
Percent of 11th Grade Students Proficient in Reading on Iowa Assessments2011-2012 to 2015-2016
2011-2012 2012-2013 2013-2014 2014-2015 2015-2016IEP 38.20 37.80 31.80 31.00 28.10No IEP 88.50 87.70 84.80 85.20 83.80
0
20
40
60
80
100
Per
cent
Source: Iowa Department of Education, Bureau of Information and Analysis, AYP files.
The Annual Condition of Education Report 2017216

Figure 6-15
Percent of 4th Grade Students Proficient in Mathematics on Iowa Assessments2011-2012 to 2015-2016
2011-2012 2012-2013 2013-2014 2014-2015 2015-2016IEP 47.50 46.10 46.60 45.50 44.00No IEP 82.10 83.20 84.10 84.10 83.20
0
20
40
60
80
100
Per
cent
Source: Iowa Department of Education, Bureau of Information and Analysis, AYP files.
Figure 6-16
Percent of 8th Grade Students Proficient in Mathematics on Iowa Assessments2011-2012 to 2015-2016
2011-2012 2012-2013 2013-2014 2014-2015 2015-2016IEP 27.80 27.80 31.70 28.50 26.50No IEP 80.70 80.30 81.60 82.60 81.60
0
20
40
60
80
100
Per
cent
Source: Iowa Department of Education, Bureau of Information and Analysis, AYP Files.
The Annual Condition of Education Report 2017217

Figure 6-17
Percent of 11th Grade Students Proficient in Mathematics on Iowa Assessments2011-2012 to 2015-2016
2011-2012 2012-2013 2013-2014 2014-2015 2015-2016IEP 44.10 43.70 44.10 41.90 38.10No IEP 86.40 85.50 88.40 87.90 86.80
0
20
40
60
80
100P
erce
nt
Source: Iowa Department of Education, Bureau of Information and Analysis, AYP Files.
Are Students Leaving School Ready for Life?Graduation RatesThis section reports the percentage of high school students with and without IEPs who graduate based on the four year cohort rate. In reporting year 2015-2016, the graduation rate for students with an IEP was 77.00 percent which is 15.82 percent below the graduate rate for students without IEPs at 92.82 percent. Between the 2011-2012 and 2015-2016 reporting years, the graduation rate increased by 7.12 percent for students with IEPs. Please note that per federal requirements, graduation data lag one year, which means that data reported for 2015-2016 were collected during the 2014-2015 school year.
Figure 6-18
Graduation Rate by Graduating Classes, 2012 to 2016
2011-2012 2012-2013 2013-2014 2014-2015 2015-2016IEP 69.96 72.74 72.74 76.35 77.00No IEP 91.54 91.89 92.33 92.70 92.82
0
20
40
60
80
100
Per
cent
Source: Iowa Department of Education, Bureau of Information and Analysis, SRI, Spring Student Files.
The Annual Condition of Education Report 2017218

FinanceInformation pertaining to revenues, property taxes, state aid, and income surtax at the state level and by enrollment category in certain cases is included in this chapter. This chapter contains the most current data available at the time of preparation. The sources of data for this chapter include the 2015-2016 Certi-fied Annual Financial Report from the Iowa Department of Education, the 2017-2018 Iowa Department of Management Aid and Levy worksheet database, and the Program and Budget Summary document from the Legislative Services Agency, Fiscal Services Division. Expenditure data are included and detailed by functions and objects. The 2000-2001 school year is used as the base year for comparison in most tables and figures.
Function Category ExpendituresThe function categories discussed in this section are broken out by instruction, student support services, staff support services, administration and central services, operations and maintenance, student trans-portation, other support services, and community services. There have been notable shifts in function category expenditures as a percent of general fund expenditures over the last three years. In particular, there has been an increase in the percentage used for staff support services and decreases for operations and maintenance and student transportation (Table 7-1). The smallest enrollment category has continued to show the largest percentage of expenditures in the functions of instruction and administration and central services when compared to the other enrollment categories, while the two largest enrollment categories had the highest percentage of expenditures for the function of student support services (Table 7-2).
Table 7-1
Function Category Expenditures as a Percent of Total General Fund Expenditures in Iowa Public Schools 2000-2001, 2013-2014 to 2015-2016
Source: Iowa Department of Education, Division of School Finance and Support Services, Certified Annual Financial Reports.Note: Figures may not total 100 percent due to rounding.
2000-2001 2013-2014 2014-2015 2015-2016Instruction 69.0% 70.0% 70.0% 69.8%
Student Support Services 3.8% 3.4% 3.4% 3.6%Staff Support Services 4.0% 3.6% 4.0% 4.5%
Administration & Central Services 9.9% 10.4% 10.5% 10.5%Operations and Maintenance 9.2% 8.5% 8.2% 7.9%
Student Transportation 3.8% 4.0% 3.8% 3.7%Other Support Services 0.1% 0.0% 0.0% 0.0%
Community Services 0.2% 0.0% 0.0% 0.1%
The Annual Condition of Education Report 2017219
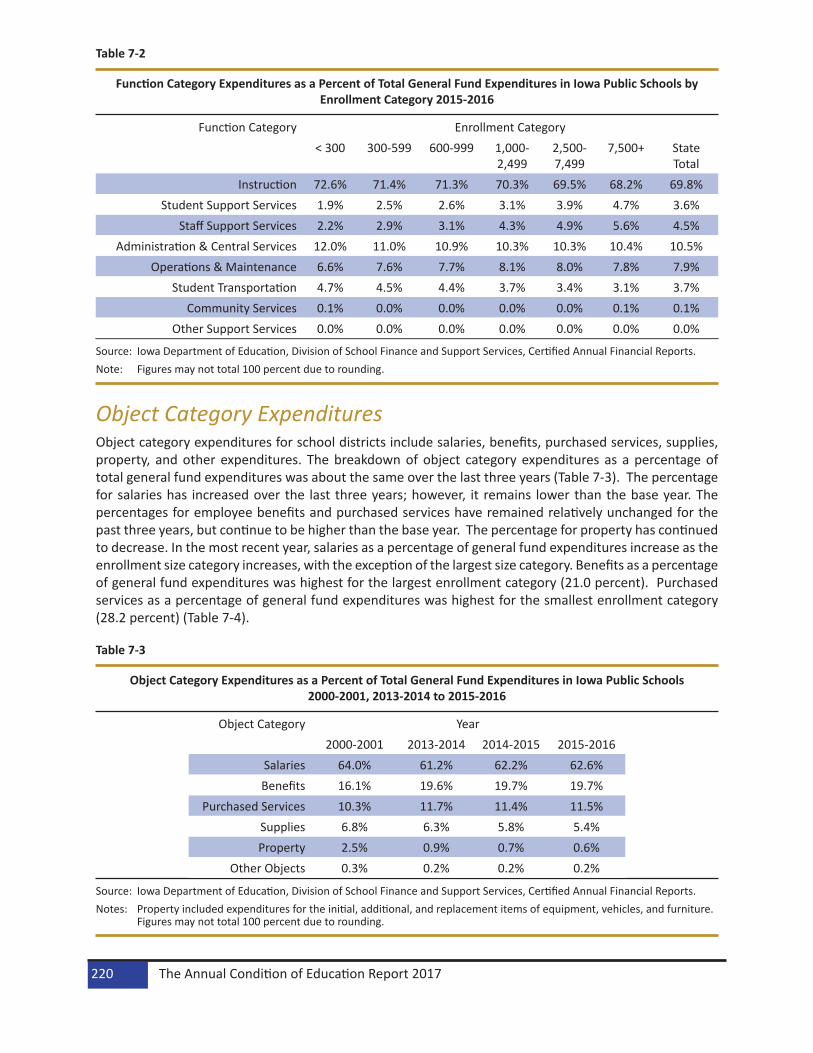
Table 7-2
Function Category Expenditures as a Percent of Total General Fund Expenditures in Iowa Public Schools by Enrollment Category 2015-2016
Source: Iowa Department of Education, Division of School Finance and Support Services, Certified Annual Financial Reports.Note: Figures may not total 100 percent due to rounding.
Object Category ExpendituresObject category expenditures for school districts include salaries, benefits, purchased services, supplies, property, and other expenditures. The breakdown of object category expenditures as a percentage of total general fund expenditures was about the same over the last three years (Table 7-3). The percentage for salaries has increased over the last three years; however, it remains lower than the base year. The percentages for employee benefits and purchased services have remained relatively unchanged for the past three years, but continue to be higher than the base year. The percentage for property has continued to decrease. In the most recent year, salaries as a percentage of general fund expenditures increase as the enrollment size category increases, with the exception of the largest size category. Benefits as a percentage of general fund expenditures was highest for the largest enrollment category (21.0 percent). Purchased services as a percentage of general fund expenditures was highest for the smallest enrollment category (28.2 percent) (Table 7-4).
Table 7-3
Object Category Expenditures as a Percent of Total General Fund Expenditures in Iowa Public Schools 2000-2001, 2013-2014 to 2015-2016
Source: Iowa Department of Education, Division of School Finance and Support Services, Certified Annual Financial Reports.Notes: Property included expenditures for the initial, additional, and replacement items of equipment, vehicles, and furniture.
Figures may not total 100 percent due to rounding.
Function Category Enrollment Category< 300 300-599 600-999 1,000-
2,4992,500-7,499
7,500+ State Total
Instruction 72.6% 71.4% 71.3% 70.3% 69.5% 68.2% 69.8%Student Support Services 1.9% 2.5% 2.6% 3.1% 3.9% 4.7% 3.6%
Staff Support Services 2.2% 2.9% 3.1% 4.3% 4.9% 5.6% 4.5%Administration & Central Services 12.0% 11.0% 10.9% 10.3% 10.3% 10.4% 10.5%
Operations & Maintenance 6.6% 7.6% 7.7% 8.1% 8.0% 7.8% 7.9%Student Transportation 4.7% 4.5% 4.4% 3.7% 3.4% 3.1% 3.7%
Community Services 0.1% 0.0% 0.0% 0.0% 0.0% 0.1% 0.1%Other Support Services 0.0% 0.0% 0.0% 0.0% 0.0% 0.0% 0.0%
Object Category Year2000-2001 2013-2014 2014-2015 2015-2016
Salaries 64.0% 61.2% 62.2% 62.6%Benefits 16.1% 19.6% 19.7% 19.7%
Purchased Services 10.3% 11.7% 11.4% 11.5%Supplies 6.8% 6.3% 5.8% 5.4%Property 2.5% 0.9% 0.7% 0.6%
Other Objects 0.3% 0.2% 0.2% 0.2%
The Annual Condition of Education Report 2017220

Table 7-4
Object Category Expenditures as a Percent of Total General Fund Expenditures in Iowa Public Schools by Enrollment Category 2015-2016
Source: Iowa Department of Education, Division of School Finance and Support Services, Certified Annual Financial Reports.Note: Figures may not total 100 percent due to rounding.
Object Category Enrollment Category< 300 300-599 600-999 1,000-
2,4992,500-7,499
7,500+ State Totals
Salaries 50.6% 59.3% 61.3% 63.6% 64.4% 63.2% 62.6%Benefits 14.8% 17.9% 19.2% 19.6% 19.5% 21.0% 19.7%
Purchased Services 28.2% 15.9% 12.7% 10.0% 10.2% 10.3% 11.5%Supplies 5.6% 6.1% 5.8% 5.9% 5.1% 4.8% 5.4%Property 0.4% 0.6% 0.6% 0.7% 0.7% 0.6% 0.6%
Other Objects 0.4% 0.3% 0.3% 0.2% 0.1% 0.1% 0.2%
The Annual Condition of Education Report 2017221

RevenuesIowa public school districts receive general fund revenues from a variety of sources, including local property taxes, local income surtaxes, other local sources, interagency, intermediate, state foundation aid (school aid), other state aid, federal aid, and other financing sources. The other state aid is comprised of state programs including class size reduction and the student achievement/educator quality program. Total local taxes include property tax and local income surtax.
The percent of revenue from state foundation aid dropped slightly in the past year, while the percent of revenue from other state sources has increased (Table 7-5, Figure 7-1). The largest enrollment category continued to have the highest percent of revenue from state foundation aid, other state sources, and federal sources. The lowest three enrollment categories had the highest percent of revenue from local taxes and interagency sources (Table 7-6). The smallest enrollment category was the only one for which the percentage of revenues received through local taxes and those received from total state sources (state foundation aid and other state sources) was nearly identical (Figure 7-2).
Table 7-5
Revenues by Source as a Percent of Total General Fund Revenues in Iowa Public Schools 2000-2001, 2013-2014 to 2015-2016
Source: Iowa Department of Education, Division of School Finance and Support Services, Certified Annual Financial Reports.Notes: Interagency includes revenues from services provided to other local education agencies (LEAs) such as tuition, transpor-
tation services, and other purchased services. Intermediate sources include grants-in-aid revenues in lieu of taxes received from area education agencies (AEAs), cities, and counties. Other local sources include interest, textbook sales, rents and fines, student fees, and community service fees. Other financing sources include the proceeds from long-term debt such as loans, capital leases and insurance settlements for loss of fixed assets. Totals may not equal 100 percent due to rounding.
Source of Revenue Year2000-2001 2013-2014 2014-2015 2015-2016
Local Taxes 32.0% 33.7% 32.7% 32.7%Interagency 3.9% 5.6% 5.4% 5.5%
Other Local Sources 2.6% 1.8% 1.8% 1.7%Intermediate Sources 0.3% 0.0% 0.0% 0.0%State Foundation Aid 52.3% 47.5% 47.5% 47.2%Other State Sources 5.3% 6.9% 8.1% 8.4%
Federal Sources 3.4% 4.3% 4.3% 4.2%Other Financing Sources 0.1% 0.3% 0.2% 0.2%
The Annual Condition of Education Report 2017222

Figure 7-1
Percent of Total General Fund Revenues from Local Taxes, State Foundation Aid and Total State Aid in Iowa Public Schools 2000-2001, 2006-2007 to 2015-2016
57.6 54.8 55.7 54.747.4 50.7 52.0 53.2 54.4
55.655.7
32.0 33.0 32.4 32.8 34.6 34.7 34.9 34.6 33.7 32.7 32.7
52.3 49.3 48.7 46.3 39.4 43.7 45.6 46.7 47.5 47.5 47.2
0.0
10.0
20.0
30.0
40.0
50.0
60.0
70.0
80.0
90.0
100.0
Perc
enta
ge
Year
Total State Aid Local Taxes State Foundation Aid
Source: Iowa Department of Education, Division of School Finance and Support Services, Certified Annual Financial Reports.
The Annual Condition of Education Report 2017223
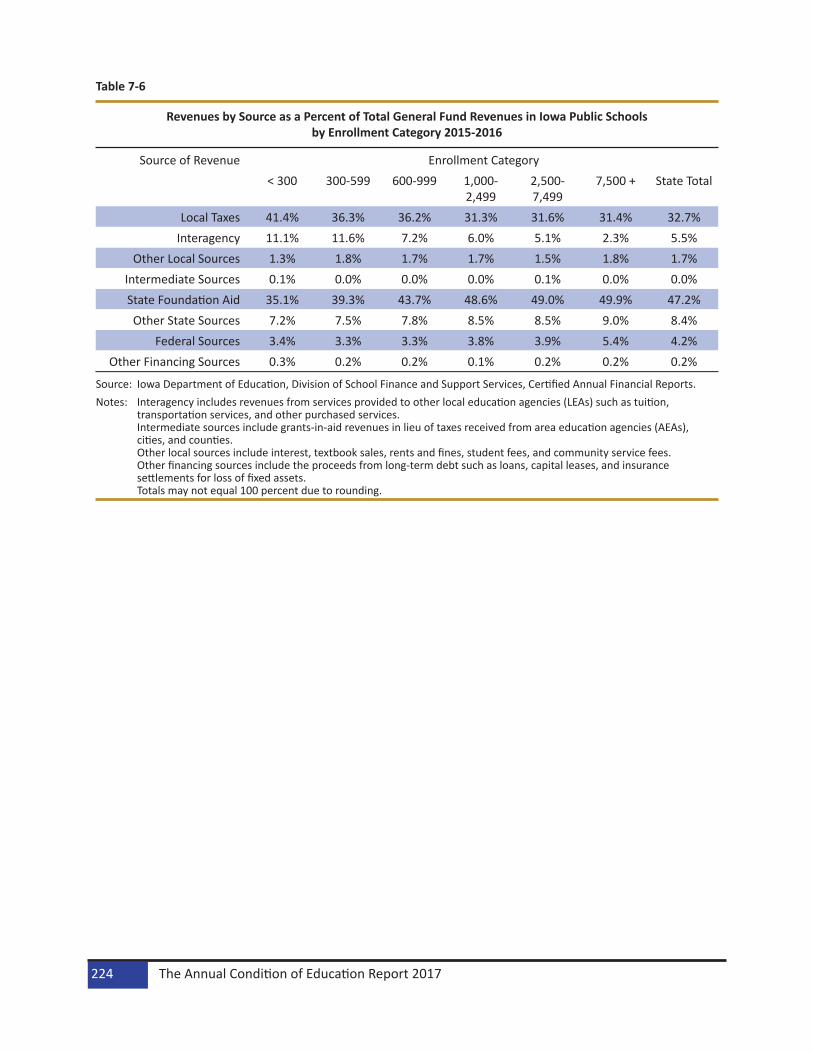
Table 7-6
Revenues by Source as a Percent of Total General Fund Revenues in Iowa Public Schools by Enrollment Category 2015-2016
Source: Iowa Department of Education, Division of School Finance and Support Services, Certified Annual Financial Reports.Notes: Interagency includes revenues from services provided to other local education agencies (LEAs) such as tuition,
transportation services, and other purchased services. Intermediate sources include grants-in-aid revenues in lieu of taxes received from area education agencies (AEAs), cities, and counties. Other local sources include interest, textbook sales, rents and fines, student fees, and community service fees. Other financing sources include the proceeds from long-term debt such as loans, capital leases, and insurance settlements for loss of fixed assets. Totals may not equal 100 percent due to rounding.
Source of Revenue Enrollment Category< 300 300-599 600-999 1,000-
2,4992,500-7,499
7,500 + State Total
Local Taxes 41.4% 36.3% 36.2% 31.3% 31.6% 31.4% 32.7%Interagency 11.1% 11.6% 7.2% 6.0% 5.1% 2.3% 5.5%
Other Local Sources 1.3% 1.8% 1.7% 1.7% 1.5% 1.8% 1.7%Intermediate Sources 0.1% 0.0% 0.0% 0.0% 0.1% 0.0% 0.0%State Foundation Aid 35.1% 39.3% 43.7% 48.6% 49.0% 49.9% 47.2%Other State Sources 7.2% 7.5% 7.8% 8.5% 8.5% 9.0% 8.4%
Federal Sources 3.4% 3.3% 3.3% 3.8% 3.9% 5.4% 4.2%Other Financing Sources 0.3% 0.2% 0.2% 0.1% 0.2% 0.2% 0.2%
The Annual Condition of Education Report 2017224

Figure 7-2
Percent of Total General Fund Revenues from Local Taxes and Total State Aid in Iowa Public Schools by Enrollment Category 2015-2016
41.43%
36.26% 36.18%
31.34% 31.65% 31.35% 32.74%
42.28%
46.85%
51.45%
57.05% 57.55% 58.91%55.68%
0.00%
10.00%
20.00%
30.00%
40.00%
50.00%
60.00%
70.00%
<300 300-599 600-999 1,000-2,499 2,500-7,499 7,500+ State
Per
cent
Enrollment Category
Local Taxes=32.7%Total State Aid=55.7%
Source: Iowa Department of Education, Division of School Finance and Support Services, Certified Annual Financial Reports.
Taxable ValuationThe adjusted-equalized value of real property is represented by taxable valuation. There are 112 assessing jurisdictions in the state of Iowa. The property in each jurisdiction is equalized by the state through the Department of Revenue every two years. Assessments are adjusted for classes of property to actual values, except for agriculture land values that are based on productivity. Adjustments are based on inves-tigations and appraisals done by the state and on assessments/sales ratio studies. The agriculture land use productivity formula is based on agriculture prices and expenses. An adjustment is ordered by the state if reported valuation is more than 5 percent above or below those determined by the state. Taxes are assessed against equalized property values and rates are expressed per $1,000 of valuation.
The amount of state aid a school district will receive is based on the taxable valuation in the school district. The Iowa school foundation formula requires all school districts to levy a uniform rate of $5.40 per $1,000 taxable valuation. State aid is provided to adjust for the different amounts of revenue raised in each school district. The relative property wealth in a school district is the primary factor in determining the property tax rates.
Iowa’s average taxable valuation per pupil has increased each year since 2005-2006 (Figure 7-3). The three largest enrollment categories have consistently had an average per pupil valuation below the state average (Table 7-7). The taxable valuation per pupil increases because of increases in valuation, as well as decreases in enrollment. The 600-999 enrollment category had the greatest range in taxable valuation per pupil in each of the last five years, followed closely by the <300 category (Table 7-8). The largest enrollment category had the lowest taxable valuation per pupil ($168,466) and the 600-999 enrollment category had the highest taxable valuation per pupil ($1,300,025) in 2017-2018, which was consistent with the previous year.
The Annual Condition of Education Report 2017225

Figure 7-3
Iowa Average Taxable Valuation Per Pupil 2000-2001, and 2008-2009 to 2017-2018
$185,750
$238,274$251,819
$264,419 $276,053 $286,167 $295,796 $300,284 $305,878 $317,587 $329,208
$0
$50,000
$100,000
$150,000
$200,000
$250,000
$300,000
$350,000
2000-2001 2008-2009 2009-2010 2010-2011 2011-2012 2012-2013 2013-2014 2014-2015 2015-2016 2016-2017 2017-2018
Taxa
ble
Valu
atio
n Pe
r Pup
il
School Year
Source: Iowa Department of Management, School Budget Master files.Note: Per pupil amounts are based on budget enrollments.
Table 7-7
Iowa Average Taxable Valuation Per Pupil by Enrollment Category 2000-2001 and 2013-2014 to 2017-2018
Source: Iowa Department of Management, School Budget Master files.Note: Per pupil amounts are based on budget enrollments.
2000-2001 2013-2014 2014-2015 2015-2016 2016-2017 2017-2018<300 266,463 499,721 521,348 534,536 535,326 564,717
300-599 223,708 372,560 395,454 414,524 433,515 451,648600-999 201,732 341,183 352,214 368,506 385,822 401,567
1,000-2,499 175,204 274,499 283,005 295,199 310,600 325,8312,500-7,499 175,250 277,003 274,268 284,813 292,891 294,847
7,500+ 174,108 266,057 264,585 280,377 290,455 298,990State 185,750 295,796 300,284 305,878 317,587 329,208
The Annual Condition of Education Report 2017226

Table 7-8
Net Taxable Valuations Per Budget Enrollment 2000-2001, 2013-2014 to 2017-2018
Source: Iowa Department of Management, School Budget Master files.Note: Enrollment categories determined by budget enrollment.
Enrollment
Year
Category 2000-2001 2013-2014 2014-2015 2015-2016 2016-2017 2017-2018<300 Min 152,131 214,107 215,683 233,340 242,623 246,919 <300 Max 549,020 1,119,423 1,189,526 1,097,341 1,108,726 1,292,072
300-599 Min 92,573 196,744 195,930 198,342 202,478 205,942 300-599 Max 451,583 691,226 698,665 744,154 769,455 819,846
600-999 Min 111,465 166,972 175,948 175,380 170,848 188,468 600-999 Max 409,970 1,119,481 1,183,748 1,227,824 1,260,406 1,300,025
1,000-2,499 Min 93,339 163,142 161,716 162,579 165,865 172,503 1,000-2,499 Max 370,462 784,478 805,816 804,376 880,628 915,594
2,500-7,499 Min 104,148 178,661 169,182 169,756 176,101 182,584 2,500-7,499 Max 313,393 515,925 518,582 543,500 576,105 595,820
7,500+ Min 114,143 160,944 156,490 156,727 162,804 168,466 7,500+ Max 327,747 451,945 455,230 446,277 476,882 492,143
State Min 92,573 160,944 156,490 156,727 162,804 168,466 State Max 549,020 1,119,481 1,189,526 1,227,824 1,260,406 1,300,025
The Annual Condition of Education Report 2017227

Expenditures Per PupilGeneral fund expenditures per pupil include expenditures for instruction, student support services, staff support services, administration and central services, operation and maintenance, student transporta-tion, and other support services. Expenditures per pupil are calculated by dividing total general fund expenditures by the certified enrollment. Expenditures related to community services, adult education, nonpublic education, and area education agency revenues for services sold to other school districts and area education agencies are not included in the per pupil calculation.
The smallest enrollment category had the highest average general fund per pupil expenditures in all years presented in Table 7-9. Table 7-10 and Figure 7-4 display the average per pupil expenditures for Iowa, the Midwest states, and the nation. The National Education Association (NEA) collected and estimated these data. In the most recent year, Iowa ranked 28th in the nation in average expenditures per pupil. Indiana, Kansas, Nebraska, North Dakota, Ohio, and South Dakota ranked lower than Iowa.
Table 7-9
Average General Fund Per Pupil Expenditures for Iowa Public Schools by Enrollment Category 2000-2001, 2013-2014 to 2015-2016
Source: Iowa Department of Education, Division of School Finance and Support Services, Certified Enrollment and Certified Annual Financial Reports.
Enrollment Category Year2000-2001 2013-2014 2014-2015 2015-2016
< 300 $5,605 $10,474 $10,745 $10,454300-599 $5,106 $9,497 $9,651 $9,727600-999 $4,988 $9,269 $9,348 $9,463
1,000-2,499 $4,881 $9,149 $9,382 $9,5712,500-7,499 $5,055 $9,104 $9,351 $9,633
7,500 + $5,461 $9,820 $10,142 $10,355State $5,119 $9,430 $9,662 $9,849
The Annual Condition of Education Report 2017228

Table 7-10
Iowa and Midwest States Public School Average Total Current Expenditures Per Pupil 2000-2001, 2014-2015 and 2015-2016
Source: National Education Association (NEA), Rankings and Estimates of School Statistics.Notes: 2014-2015 reflect adjusted numbers. 2015-2016 numbers are estimated by NEA.
State/Nation Year2000-2001 2014-2015 2015-2016
Per Pupil Expenditures
National Rank
Per Pupil Expenditures
National Rank
Per Pupil Expenditures
National Rank
Nation 7,296 11,542 11,787Iowa 6,434 34 10,622 27 10,676 28
Illinois 8,293 11 13,083 15 13,457 15Indiana 7,567 18 8,034 48 7,538 49Kansas 7,031 23 10,135 30 10,054 34
Michigan 8,127 13 14,873 11 15,426 11Minnesota 7,320 21 12,139 16 12,269 16
Missouri 6,323 38 10,593 28 10,689 27Nebraska 6,395 35 10,012 33 10,174 32
North Dakota 4,607 50 8,518 44 8,338 45Ohio 6,952 25 10,108 31 10,346 31
South Dakota 6,269 39 9,332 36 9,011 41Wisconsin 8,205 12 11,534 19 11,635 20
The Annual Condition of Education Report 2017229

Figure 7-4
Iowa and Midwest States Public School Average Per Pupil Expenditures 2000-2001, 2014-2015 and 2015-2016
7,29
6
6,43
4
8,29
3
7,56
7
7,03
1 8,12
7
7,32
0
6,32
3
6,39
5
4,60
7
6,95
2
6,26
9
8,20
5
11,5
42
10,6
22
13,0
83
8,03
4
10,1
35
14,8
73
12,1
39
10,5
93
10,0
12
8,51
8
10,1
08
9,33
2
11,5
34
11,7
87
10,6
76
13,4
57
7,53
8
10,0
54
15,4
26
12,2
69
10,6
89
10,1
74
8,33
8
10,3
46
9,01
1
11,6
35
0
2,000
4,000
6,000
8,000
10,000
12,000
14,000
16,000
18,000
Per
Pup
il E
xpen
ditu
res
State
2000-2001
2014-2015
2015-2016
Source: National Education Association (NEA), Rankings and Estimates of School Statistics.Notes: 2014-2015 numbers have been adjusted. 2015-2016 numbers are estimated by NEA.
The Annual Condition of Education Report 2017230

State AidThis section presents data on state aid, including School Foundation Aid, Instructional Support, Class Size Reduction, Early Intervention, and Student Achievement/Educator Quality. State aid is received by school districts through appropriations made from the state’s general fund each year. In 1996-1997 and 1999-2000, changes were made to school foundation aid laws that impacted state aid amounts. The state foundation level, currently at 87.5 percent, was last changed in 1996-1997. The special education foundation level was increased to its currently level, also 87.5 percent, in 1999-2000. The changes to the foundation level increased the amount of state aid and lowered the amount of property tax. Several programs have been added or removed since these changes were made. For example, in 2009-2010, Teacher Salary Supplement was added as well as Professional Development Supplement. 2015-2016 was the first year in which a portion of districts participating in the Teacher Leadership and Compensation (TLC) Program were funded through the school finance formula. As of 2017-2018, all districts participate in the TLC Program and are funded through the formula.
Table 7-11 shows the state’s general fund appropriations and initial state aid to school districts for multiple years. The Legislature initially appropriated $7.26 billion and initial state aid to school districts was about $3.18 billion or about 43.8 percent of the general fund appropriations for the 2017-2018 school year (fiscal year 2018). This was the second consecutive year-over-year increase in the initial percent spent on education, the first time this has occurred since the FY09 to FY11 time period. Initial state aid to school districts has steadily increased since 2012-2013. For 2017-2018, the initial general fund appropriation was lower than the previous year for the first time since 2010-2011.
Table 7-11
Total Iowa Government Appropriations (In Millions) 2000-2001 to 2017-2018
Source: Legislative Services Agency, Fiscal Bureau, Session Fiscal Report, and Fiscal Tracking Report.
Notes: Includes school foundation aid, educational excellence, instructional support, technology/school improvement, class size reduction/school improvement, and teacher quality/compensation appropriations.
Year Initial State Aid to Districts
Initial General Fund
Appropriations
Initial Percent Spent on Education
Final State Aid to Districts
Final General Fund Appropriation
Final Percent Spent on Education
2017-2018 3,183.7 7,268.6 43.8 Not currently available2016-2017 3,087.9 7,350.6 42.0 Not currently available2015-2016 2,950.3 7,175.2 41.1 2,952.0 7,254.8 40.72014-2015 2,858.5 6,958.9 41.1 2,865.0 7,063.4 40.62013-2014 2,714.8 6,485.1 41.9 2,716.1 6,482.6 41.92012-2013 2,653.7 6,222.6 42.6 2,709.8 6,431.6 42.12011-2012 2,629.3 6,010.1 43.7 2,623.8 6,012.5 43.62010-2011 2,668.5 5,279.2 50.5 2,451.0 5,351.9 45.82009-2010 2,595.1 5,768.3 45.0 2,150.8 5,303.3 40.62008-2009 2,584.0 6,133.1 42.1 2,499.7 5,959.0 41.92007-2008 2,417.2 5,856.3 41.3 2,415.1 5,898.4 40.92006-2007 2,252.8 5,296.5 42.5 2,251.5 5,392.9 41.72005-2006 2,131.5 4,938.6 43.2 2,131.9 5,031.7 42.42004-2005 2,025.6 4,464.2 45.4 2,025.7 4,606.2 44.02003-2004 1,963.5 4,513.6 43.5 1,919.4 4,500.5 42.62002-2003 1,935.7 4,509.9 42.9 1,935.7 4,534.4 42.72001-2002 1,978.3 4,873.7 40.6 1,899.1 4,607.1 41.22000-2001 1,893.1 4,880.1 38.8 1,897.4 4,886.9 38.8
The Annual Condition of Education Report 2017231

Property TaxesThe school aid formula for school districts is funded by a combination of state foundation aid and the uniform levy ($5.40/$1,000 of taxable valuation) and additional levies. School districts may levy other local taxes along with the uniform and additional levies. The uniform levy, additional levy, instructional support levy, and educational improvement levy are property taxes that are included in the school district’s general fund. The management levy, regular physical plant and equipment levy (PPEL), voter-approved physical plant and equipment levy (VPPEL), public education and recreation levy (PERL), and debt services levy are other school district property taxes for specified purposes that are not included in the general fund.
Data on general fund property tax rates, management fund property tax rates, regular and voter-approved physical plant and equipment levy (PPEL) tax rates, the public education and recreation levy (PERL) tax rates, and debt service levy tax rates for 2017-2018 are found in Table 7-12.
All school districts levy the general fund property tax. The two largest enrollment categories had an average general fund property tax rate greater than the state average. There are no restrictions for the management levy rate; however, the purpose for which the proceeds may be used is restricted to paying tort claims, insurance premiums (except health insurance), unemployment benefits, and the cost of retirement benefits. Beginning with FY16, allowable uses expanded to include the cost of mediation and arbitration. The majority of the school districts in 2017-2018 levy for the management fund. The regular physical plant and equipment levy (PPEL) is a levy the school board may approve up to $0.33 per $1,000 of taxable valuation. The school board may also request voter approval to increase the levy an additional $1.34 per $1,000 taxable valuation. The two largest school district enrollment categories have the highest average voter-approved PPEL rates.
The public education and recreation levy (PERL), or playground levy, must be approved by voters within the school districts. Funds from PERL must be used for the purchase of playgrounds and recreational facilities and for the costs of community education. The maximum rate for PERL is $0.135 per $1,000 of taxable valu-ation. In 2017-2018, 6.6 percent of the school districts levy for PERL, a slight increase over the previous year.
Usage of the debt service levy is tied to passage of a bond issue, which requires approval of at least 60 percent of the electorate within the school district. About half of the school districts use the debt services levy. The highest percentage of districts using this levy fall within the 1,000 - 2,499 and 2,500-7,499 enroll-ment categories, while use by the smallest (<300) and largest (7,500+) enrollment categories falls below the state average.
Table 7-13 lists the total taxes and property tax amounts for the general fund, management fund, regular PPEL, voter-approved PPEL, PERL, and debt services levies for 2017-2018. The smallest enrollment category had the highest average tax per pupil for all taxes listed.
The Annual Condition of Education Report 2017232

Table 7-12
Property Tax Rates and Number of School Districts with Levies by Enrollment Category 2017-2018
Source: Iowa Department of Management, Master Budget files.Notes: PERL means Public Education and Recreation Levy.
PPEL means Physical Plant and Equipment Levy. Average Tax Rate per $1,000 Valuation.
Enrollment Category<300 300-599 600-999 1,000-
2,4992,500-7,499 7,500+ State
Number of Districts 38 103 82 77 22 11 333
Number of Districts with General Fund Levy
38 103 82 77 22 11 333
Percent of Districts with General Fund Levy
100.0% 100.0% 100.0% 100.0% 100.0% 100.0% 100.0%
Average Tax Rate with General Fund Levy
9.4526691 9.8727885 10.0814209 11.0948083 12.2002534 13.2207416 11.5068
Number of Districts with Management Fund Levy
37 101 79 75 22 11 325
Percent of Districts with Management Fund Levy
97.4% 98.1% 96.3% 97.4% 100.0% 100.0% 97.6%
Average Management Levy Tax Rate
0.8744463 0.8857503 0.8625438 0.9718931 0.7415184 0.8637438 0.86987
Number of Districts with Regular PPEL
36 103 81 77 20 11 328
Percent of Districts with Regular PPEL
94.7% 100.0% 98.8% 100.0% 90.9% 100.0% 98.5%
Average Regular PPEL Tax Rate 0.33000 0.33000 0.33000 0.33000 0.33000 0.33000 0.33000
Number of Districts with Voter-Approved PPEL
27 79 64 62 21 10 263
Percent of Districts with Voter-Approved PPEL
71.1% 76.7% 78.0% 80.5% 95.5% 90.9% 79.0%
Average Voter-Approved PPEL Tax Rate
0.81916 0.90521 0.84589 0.78816 1.10145 1.08129 0.96500
Number of Districts with PERL 4 7 3 3 3 2 22
Percent of Districts with PERL 10.5% 6.8% 3.7% 3.9% 13.6% 18.2% 6.6%
Average PERL Tax Rate
Number of Districts with Debt Services Levy
8 53 44 45 14 4 168
Percent of Districts with Debt Services Levy
21.1% 51.5% 53.7% 58.4% 63.6% 36.4% 50.5%
Average Debt Services Tax Rate 2.10901 1.77604 1.79862 2.23633 2.62827 1.54552 2.05463
The Annual Condition of Education Report 2017233

Table 7-13
Total Property Taxes and Average Property Tax Per Pupil by Enrollment Category 2017-2018
Enrollment Category
<300 300-599 600-999 1,000-2,499 2,500-7,499 7,500+ State
Number of Districts
38 103 82 77 22 11 333
Percent of Districts with General Fund
Levy
100.0% 100.0% 100.0% 100.0% 100.0% 100.0% 100%
General Fund Property Tax
45,044,325 207,665,843 249,659,192 411,295,231 344,389,597 579,750,449 1,837,804,637
General Fund Income Surtax
3,023,712 13,151,390 16,591,358 30,655,375 11,720,246 16,215,853 91,357,934
Total General Fund Tax
48,068,037 220,817,233 266,250,550 441,950,606 356,109,843 595,966,302 1,929,162,571
Average Total General Fund Tax Per Pupil
5,549 4,666 4,331 3,801 3,689 3,848 3,976
Percent of Districts with Management
Fund Levy
97.4% 98.1% 96.3% 97.4% 100.0% 100.0% 97.6%
Management Fund Property
Tax
4,080,548 18,200,682 20,525,574 35,424,203 20,931,632 37,876,535 137,039,174
Average Management
Fund Property Tax Per Pupil
478 390 346 310 217 245 285
Percent of Districts with Regular PPEL
94.7% 100.0% 98.8% 100.0% 90.9% 100.0% 98.5%
Regular PPEL Property Tax
1,504,668 7,230,415 8,516,499 13,152,485 9,311,567 15,730,272 55,445,906
Average Regular PPEL Property
Tax Per Pupil
183 153 140 113 103 102 116
Percent of Districts with
Voter-Approved PPEL
71.1% 76.7% 78.0% 80.5% 95.5% 90.9% 79.0%
The Annual Condition of Education Report 2017234

Table 7-13 (…continued)
Source: Iowa Department of Management, Master Budget files.Notes: PERL means Public Education and Recreation Levy.
PPEL means Physical Plant and Equipment Levy. Average Tax Rate per $1,000 Valuation.
Enrollment Category
<300 300-599 600-999 1,000-2,499 2,500-7,499 7,500+ State
Voter-Approved PPEL
Property Tax
2,786,914 15,285,644 16,014,140 24,529,690 32,554,755 48,644,981 139,816,124
Voter-Approved PPEL Income Surtax
391,355 2,155,706 2,151,446 5,179,116 235,712 - 10,113,335
Total Voter-Approved PPEL
Tax
3,178,269 17,441,350 18,165,586 29,708,806 32,790,467 48,644,981 149,929,459
Average Total Voter-Approved
PPEL Tax Per Pupil
518 477 387 322 357 347 362
Percent of Districts with
PERL
10.5% 6.8% 3.7% 3.9% 13.6% 18.2% 6.6%
PERL Property Tax
73,952 223,378 101,867 206,766 562,951 1,526,866 2,695,780
Average PERL Property Tax
Per Pupil
79 65 47 48 35 36 39
Percent of Districts with Debt Services
Levy
21.1% 51.5% 53.7% 58.4% 63.6% 36.4% 50.5%
Debt Services Property Tax
2,217,914 18,206,152 23,914,164 50,121,130 54,697,340 29,775,027 178,931,727
Average Debt Services
Property Tax Per Pupil
1034 733 717 718 869 569 729
The Annual Condition of Education Report 2017235

Income SurtaxesData on income surtax usage by enrollment category for 2000-2001 and 2013-2014 to 2017-2018 are pre-sented in Table 7-14.
Table 7-14
Number and Percent of School Districts with Income Surtaxes, Surtax Per Budget Enrollment, and Average Income Surtax Rates by Enrollment Category 2000-2001 and 2013-2014 to 2017-2018
Source: Iowa Department of Management, Master Budget files.Notes: Enrollment categories determined by budget enrollments.
Surtaxes include Asbestos, Educational Improvement, Instructional Support, Voter-Approved Physical Plant, and Equipment Levy.
Enrollment Category<300 300-599 600-999 1,000-
2,4992,500-7,499
7,500+ State
2017-2018Number of Districts with Surtaxes 35 91 73 70 10 3 282Percent of Districts with Surtaxes 92.1% 88.3% 89.0% 90.9% 45.5% 27.3% 84.7%
Surtaxes Per Budget Enrollment 429 366 347 342 300 356 345Average Income Surtax Rate 9.00% 6.87% 6.49% 5.70% 4.35% 4.65% 5.66%
2016-2017Number of Districts with Surtaxes 36 92 75 68 11 3 285Percent of Districts with Surtaxes 97.3% 91.1% 88.2% 88.3% 50.0% 27.3% 85.6%
Surtaxes Per Budget Enrollment 442 373 361 338 278 347 343Average Income Surtax Rate 9.00% 6.87% 6.49% 5.70% 4.35% 4.65% 5.66%
2015-2016Number of Districts with Surtaxes 26 93 75 66 11 3 274Percent of Districts with Surtaxes 68.4% 90.3% 86.2% 88.0% 50.0% 27.3% 81.5%
Surtaxes Per Budget Enrollment 456 381 371 335 270 339 343Average Income Surtax Rate 8.63% 6.91% 6.76% 5.84% 4.39% 4.63% 5.77%
2014-2015Number of Districts with Surtaxes 37 91 75 64 11 3 281Percent of Districts with Surtaxes 92.5% 88.3% 86.2% 85.3% 50.0% 27.3% 83.1%
Surtaxes Per Budget Enrollment 451 365 324 280 126 115 215Average Income Surtax Rate 8.95 7.29 6.77 5.94 4.45 5.33 6.93
2013-2014Number of Districts with Surtaxes 45 103 85 71 20 11 335Percent of Districts with Surtaxes 93.8% 99.0% 97.7% 95.9% 90.9% 100.0% 96.8%
Surtaxes Per Budget Enrollment 509 377 364 328 246 359 377Average Income Surtax Rate 10.24 8.02 7.56 6.42 4.40 5.33 7.71
2000-2001Number of Districts with Surtaxes 31 87 73 54 6 3 254Percent of Districts with Surtaxes 86.1% 77.0% 67.0% 65.1% 25.0% 33.3% 67.9%
Surtaxes Per Budget Enrollment 225 180 175 160 136 173 168Average Income Surtax Rate 12.03 8.29 7.29 5.37 3.66 3.59 5.46
The Annual Condition of Education Report 2017236

Instructional SupportInstructional support is a program that must be approved through board action or referendum. It provides additional funding to a school district. It may be imposed for up to 10 years if approved through a refer-endum, or up to five years through board resolution. A school district’s budget may be increased up to 10 percent of the school district’s regular program cost through the instructional support program. In earlier years, state aid funded a portion of the program and the remaining portion was funded through a property tax and income surtax, if approved, once the program was enacted.
The revenue sources and amounts for the instructional support program for 2017-2018 and previous years are shown in Table 7-15 and Figure 7-5. Since 2011-2012, instructional support funding has come from a combination of property taxes and income surtax. The percent of the funding for instructional sup-port generated from property taxes has increased each year since 2014-2015 (Table 7-15). The number of school districts with an instructional support program in current and previous years by enrollment category is shown in Table 7-16. All school districts in the smallest and two highest enrollment categories had instructional support programs in the current and previous year. The percentage of districts utilizing the instructional support program has gradually increased each year since 2013-2014. 330 of 333 districts (99.1 percent) are participating in 2017-2018.
Table 7-15
Instructional Support Program by Revenue Source Property Tax, Income Surtax, and State Aid/ARRA 2000-2001 and 2010-2011 to 2017-2018
Source: Iowa Department of Management, Master Budget Files.
School Year Property Tax Percent Property
Tax
Income Surtax Percent Income Surtax
State Aid/ARRA
Percent State Aid/
ARRA
Total
2017-2018 138,084,562 60.2% 91,245,322 39.8% 0 0.0% 229,329,8842016-2017 133,869,972 59.7% 90,292,079 40.3% 0 0.0% 224,162,0512015-2016 128,016,622 59.0% 89,054,210 41.0% 0 0.0% 217,070,8322014-2015 119,468,024 56.5% 91,988,125 43.5% 0 0.0% 211,456,1492013-2014 114,476,664 57.2% 85,521,643 42.8% 0 0.0% 199,998,3072012-2013 104,229,555 54.9% 85,667,381 45.1% 0 0.0% 189,896,9362011-2012 100,385,847 54.1% 85,171,536 45.9% 0 0.0% 185,557,3832010-2011 98,265,550 51.7% 84,302,509 44.4% 7,499,936 3.9% 190,067,9952000-2001 58,678,106 53.5% 36,273,229 33.1% 14,798,227 13.5% 109,749,562
The Annual Condition of Education Report 2017237

Figure 7-5
Instructional Support Program Revenues, 2000-2001, and 2010-2011 to 2017-2018
0
20,000,000
40,000,000
60,000,000
80,000,000
100,000,000
120,000,000
140,000,000
160,000,000
180,000,000
200,000,000
220,000,000
240,000,000
260,000,000
2000-2001 2010-2011 2011-2012 2012-2013 2013-2014 2014-2015 2015-2016 2016-2017 2017-2018
Am
ount
School Year
Property Tax Income Surtax State Aid/ARRA Total
Source: Iowa Department of Management, Master Budget Files.
The Annual Condition of Education Report 2017238

Table 7-16
Instructional Support Program by Enrollment Category 2000-2001 and 2013-2014 to 2017-2018
Source: Iowa Department of Management, Master Budget files.Note: Enrollment categories determined by budget enrollments.
Enrollment Category<300 300-599 600-999 1,000-
2,4992,500-7,499
7,500+ State
2017-2018Number of Districts 38 103 82 77 22 11 333
Number of Districts with Instructional Support
38 102 81 76 22 11 330
Percent of Districts with Instructional Support
100.0% 99.0% 98.8% 98.7% 100.0% 100.0% 99.1%
2016-2017Number of Districts 37 101 85 77 22 11 333
Number of Districts with Instructional Support
37 100 84 73 22 11 327
Percent of Districts with Instructional Support
100.0% 99.0% 98.8% 94.8% 100.0% 100.0% 98.2%
2015-2016Number of Districts 38 103 87 75 22 11 336
Number of Districts with Instructional Support
37 102 86 71 22 11 329
Percent of Districts with Instructional Support
97.4% 99.0% 98.9% 94.7% 100.0% 100.0% 97.9%
2014-2015Number of Districts 40 103 87 75 22 11 338
Number of Districts with Instructional Support
39 101 85 70 22 11 328
Percent of Districts with Instructional Support
97.5% 98.1% 97.7% 93.3% 100.0% 100.0% 97.0%
2013-2014Number of Districts 45 106 87 76 21 11 346
Number of Districts with Instructional Support
45 103 85 71 20 11 335
Percent of Districts with Instructional Support
100.0% 97.2% 97.7% 93.4% 95.2% 100.0% 96.8%
2000-2001Number of Districts 36 113 109 83 24 9 374
Number of Districts with Instructional Support
33 95 79 54 16 8 285
Percent of Districts with Instructional Support
91.7% 84.1% 72.5% 65.1% 66.7% 88.9% 76.2%
The Annual Condition of Education Report 2017239

Budget AdjustmentThe budget adjustment, previously known as the budget guarantee, is part of the Iowa school aid formula. Each year, enrollment changes from the previous year and the supplemental state aid growth rate set by the Legislature is used to determine whether or not a school district qualifies to receive the budget adjustment. Through FY 2013, school districts could receive, as a budget adjustment, the greater of a scale-down adjustment or 101 percent adjustment. The scale-down adjustment compares regular program funding for the current year to the level of funding a school district received in FY 2004. The scale-down adjustment was completely eliminated in FY 2014. The 101 percent budget adjustment guarantees a school district’s regular program cost will equal at least 101 percent of the previous year’s regular program cost. The percent of school districts statewide receiving the budget adjustment decreased in 2013-2014 (Table 7-17 and Figure 7-6), while 2015-2016 experienced an increase. The percent receiving the budget adjustment for 2017-2018 significantly increased from the previous year. Consistent with the two previous years, the two largest enrollment categories had the lowest percent of school districts receiving the budget adjustment in 2017-2018, though both of these saw large increases for the most current year.Table 7-17
Number and Percent of School Districts Receiving a Budget Adjustment and Per Pupil Amount of the Adjustment by Enrollment Category 2000-2001 and 2013-2014 to 2017-2018
Enrollment Category<300 300-599 600-999 1,000-2,499 2,500-7,499 7,500+ State
2017-2018
Number of Districts 38 103 82 77 22 11 333
Number of Districts w/Adjustment 21 58 46 42 7 5 179
Percent of Districts w/Adjustment 55.3% 56.3% 56.1% 54.5% 31.8% 45.5% 53.8%
Average Per Pupil 296 206 134 110 69 59 110
2016-2017
Number of Districts 37 101 85 77 22 11 333
Number of Districts w/Adjustment 18 43 27 18 2 2 110
Percent of Districts w/Adjustment 48.6% 42.6% 31.8% 23.4% 9.1% 18.2% 33.0%
Average Per Pupil 203 139 130 90 119 28 102
2015-2016
Number of Districts 38 103 87 75 22 11 336
Number of Districts w/Adjustment 22 65 37 30 7 1 162
Percent of Districts w/Adjustment 57.9% 63.1% 42.5% 40.0% 31.8% 9.1% 48.2%
Average Per Pupil 278 167 142 94 44 48 109
2014-2015
Number of Districts 40 103 87 75 22 11 338
Number of Districts w/Adjustment 22 23 15 5 0 0 65
Percent of Districts w/Adjustment 55.0% 22.3% 17.2% 6.7% 0.0% 0.0% 19.2%
Average Per Pupil 264 117 66 31 0 0 148
2013-2014
Number of Districts 45 106 87 76 21 11 346
Number of Districts w/Guarantee 19 55 33 21 20 2 133
Percent of Districts w/Guarantee 42.2% 51.9% 37.9% 27.6% 95.2% 18.2% 38.4%
Average Per Pupil 238 190 132 82 65 7 159
2000-2001
Number of Districts 36 113 109 83 24 9 374
Number of Districts w/Guarantee 21 44 25 16 0 0 106
Percent of Districts w/Guarantee 58.3% 38.9% 22.9% 19.3% 0.0% 0.0% 28.3%
Average Per Pupil 288 143 90 35 0 0 101Source: Iowa Department of Management, Master Budget files.Note: Enrollment categories determined by budget enrollment.
The Annual Condition of Education Report 2017240

Figure 7-6
Percent of Iowa Public School Districts with Budget Adjustment 2000-2001, 2008-2009 to 2017-2018
28.3
42.839.3
61.8
76.9
57.5
38.4
19.2
48.2
33.0
53.8
0.0
10.0
20.0
30.0
40.0
50.0
60.0
70.0
80.0
90.0
2000-2001 2008-2009 2009-2010 2010-2011 2011-2012 2012-2013 2013-2014 2014-2015 2015-2016 2016-2017 2017-2018
Per
cent
of D
istri
cts
School Year
Source: Iowa Department of Management, Master Budget files.
The Annual Condition of Education Report 2017241

Bond ElectionsThe number of school districts that attempted bond referendums by enrollment category is listed in Table 7-18. A bond referendum may be passed with approval of at least 60 percent of the total votes cast. In 2015-2016, 52.2 percent passed as compared to 40.0 percent in 2014-2015.
Table 7-18
Number of School Districts Attempting Bond Referendums by Percentage of Yes Votes by Enrollment Category 2000-2001, 2014-2015 and 2015-2016
Source: Iowa Department of Education, Division of School Finance and Support Services, Facilities, Elections, Sales Tax.Note: A school district could be included more than once if it had more than one bond issue in a year, or more than one issue
on a ballot.
Physical Plant and Equipment ElectionsTable 7-19 lists the number of school districts that attempted voter-approved physical plant and equipment referendums in 2001-2002 and 2014-2015 to 2015-2016. Voter-approved physical plant and equipment referendums require 50 percent approval for passage. In 2015-2016, 96.7 percent of the voter-approved physical plant and equipment referendums were passed, as compared to 2014-2015 where 88.6 percent were approved (Table 7-19).
Enrollment Category<300 300-599 600-999 1,000-
2,4992,500-7,499
7,500 + State
2015-2016 Number Attempted 0 4 5 9 4 1 23
<50 Percent 0 0 2 5 0 1 8 50-59.9 Percent 0 1 0 2 0 0 3
60 Percent + 0 3 3 2 4 0 12
2014-2015 Number Attempted 1 6 5 6 2 0 20
<50 Percent 0 3 0 2 1 0 6 50-59.9 Percent 1 1 3 0 1 0 6
60 Percent + 0 2 2 4 0 0 8
2000-2001Number Attempted 0 11 6 6 4 1 28
<50 Percent 0 3 2 3 0 0 850-59.9 Percent 0 4 1 2 1 0 8
60 Percent + 0 4 3 1 3 1 12
The Annual Condition of Education Report 2017242

Table 7-19
Number of School Districts Attempting Voter-Approved Physical Plant and Equipment Referendums by Percent of Yes Votes by Enrollment Category 2001-2002, 2014-2015 and 2015-2016
Source: Iowa Department of Education, Division of School Finance and Support Services, Certified Annual Financial Reports.Notes: A school district could be included more than once if it had more than one Voter-Approved Physical Plant and Equip-
ment Levy referendum in a year. FY 2002 was the first year the information was collected.
Secure an Advanced Vision for Education Secure an Advanced Vision for Education (SAVE) is used by school districts for school infrastructure needs and property tax relief. Effective July 1, 2008, legislation changed the local option sales and services tax to a statewide sales and services tax. This legislation (Iowa Code 423F.1) increased the state sales, services, and use tax from 5 percent to 6 percent to continue providing revenues to local school districts solely for school infrastructure purposes or school district property tax relief. The statewide sales and services tax is set to sunset on December 31, 2029.
Use of revenues from SAVE depends on whether or not the school district has a revenue purpose state-ment (RPS). Current law specifies the usage of SAVE revenue as dictated by the RPS. RPS requires voter approval for designating specific use of SAVE. If there is no RPS, the revenue is to be used for reducing specified levies described in Iowa Code 423F.3 “Use of revenues.” A school board may adopt a resolution for using SAVE revenues solely for property tax relief by reducing indebtedness of PPEL and debt levies without voter approval. If the school board approves a change in the RPS not solely for reduction of property tax relief, voter approval is required. The school district-approved RPS is effective until amended or repealed on December 31, 2029.
Estimated sales and services tax revenues for 2017-2018 are approximately $442.1 million for 333 school districts in all 99 counties (Table 7-20).
Enrollment Category<300 300-599 600-999 1,000-
2,4992,500-7,499
7,500 + State
2015-2016Number Attempted 2 9 6 12 0 1 30
<50 Percent 0 0 1 0 0 0 150 Percent + 2 9 5 12 0 1 29
2014-2015Number Attempted 3 12 13 3 1 3 35
<50 Percent 0 2 2 0 0 0 450 Percent + 3 10 11 3 1 3 31
2001-2002Number Attempted 2 14 10 9 2 0 37
<50 Percent 0 3 2 2 1 0 850 Percent + 2 11 8 7 1 0 29
The Annual Condition of Education Report 2017243

Table 7-20
Local Option/Statewide Sales and Services Tax for School Infrastructure 2000-2001, 2012-2013 to 2017-2018
Source: Department of Revenue, Local Option Tax Information for Local Government.
2000-2001 2012-2013 2013-2014 2014-2015 2015-2016 2016-2017 2017-2018
Number of Counties with the Tax
15 99 99 99 99 99 99
Number of Districts Partly or Wholly Located in those
Counties
110 348 346 338 336 333 333
Resident Budget Enrollment in those
Counties
171,150.6 473,504.2 478,920.9 480,771.9 483,450.9 485,147.3 486,264.3
Estimated Revenues $122,683,313 $408,955,193 $386,260,230 $418,228,165 $435,270,155 $444,681,000
Percent of Counties Participating
15.2% 100.0% 100.0% 100.0% 100.0% 100.0% 100.0%
Percent of Districts Located Partly or
Wholly in Participat-ing Counties
29.4% 100.0% 100.0% 100.0% 100.0% 100.0% 100.0%
Percent of Budget Enrollment Residing
in Participating Counties
34.3% 100.0% 100.0% 100.0% 100.0% 100.0% 100.0%
The Annual Condition of Education Report 2017244

Total Elementary and Secondary Education BudgetsThe budget detail for 2000-2001, 2016-2017, and 2017-2018 is shown in Table 7-21. State categorical funding includes Instructional Support, Class Size Reduction/Early Intervention, Technology/School Improvement, and Student Achievement/Educator Quality. Beginning in 2009-2010, categorical roll-ins for Teacher Salary, Professional Development, Early Intervention, Area Education Agency (AEA) Teacher Salary, and AEA Professional Development were added to the school aid formula. Teacher Leadership was added beginning 2015-2016, as part of a three-year phase in.
Table 7-21
Iowa Elementary and Secondary Budget Detail 2000-2001, 2016-2017 and 2017-2018
Source: Iowa Department of Education Budget files.
2000-2001 2016-2017 2017-2018
Source of Funds Amount Percent Amount Percent Amount Percent
Regular Program 2,175,673,579 66.7 3,197,430,828 56.9 3,244,086,915 55.6
Guarantee Amount 6,629,840 0.2 10,432,414 0.2 23,643,888 0.4
Supplementary Weights 21,887,590 0.7 88,825,109 1.6 93,301,222 1.6
Special Education 278,121,047 8.5 414,551,927 7.4 430,281,590 7.4
Teacher Salary - 0.0 274,893,189 4.9 279,393,152 4.8
Professional Development - 0.0 31,153,506 0.6 31,662,400 0.5
Early Intervention - 0.0 33,907,659 0.6 34,465,342 0.6
Teacher Leadership - 0.0 103,422,815 1.8 157,409,825 2.7
AEA Special Education Support & Adj 107,245,598 3.3 159,619,609 2.8 162,470,503 2.8
AEA Media 19,184,863 0.6 27,912,155 0.5 28,330,605 0.5
AEA Ed Services 21,167,941 0.6 30,847,952 0.5 31,307,398 0.5
AEA Sharing - 0.0 29,999 0.0 30,001 0.0
AEA Teacher Salary - 0.0 15,469,406 0.3 15,749,280 0.3
AEA Professional Development - 0.0 1,811,430 0.0 1,845,691 0.0
Dropout SBRC 40,504,621 1.2 113,739,536 2.0 120,075,686 2.1
Other SBRC 664,690 <0.1 0 0.0 0 0.0
Enrollment Audit Adjustment (695,392) 0.0 -454,135 0.0 -633,432 0.0
AEA Prorated Budget Reduction - 0.0 -26,250,000 -0.5 -22,500,000 -0.4
Preschool - 0.0 76,380,493 1.4 78,150,966 1.3
Instructional Support 109,749,562 3.4 224,162,051 4.0 229,329,884 3.9
Educational Improvement 317,837 <0.1 889,416 0.0 881,331 0.0
Property Tax Replacement Payment - 0.0 455,882 0.0 46,764,210 0.8
Management 47,005,258 1.4 132,619,916 2.4 137,039,178 2.3
Physical Plant & Equipment 80,703,751 2.5 193,237,839 3.4 205,375,364 3.5
67.5 Cent Schoolhouse 668,203 <0.1 0 0.0 0 0.0
Playground and Library 1,592,530 <0.1 2,544,053 0.0 2,721,774 0.0
Debt Service 99,375,793 3.0 170,942,570 3.0 180,138,379 3.1
Est. Miscellaneous State Categorical 147,121,263 4.5 108,998,371 1.9 94,117,254 1.6
Estimated Misc. Federal 104,000,000 3.2 229,546,328 4.1 231,753,625 4.0
Total 3,260,918,574 100.0 5,617,120,318 100.0 5,837,192,031 100.0
The Annual Condition of Education Report 2017245

The Annual Condition of Education Report 2017246