condition of county 2015 - co.polk.wi.us
TRANSCRIPT

222000111555 AAANNNNNNUUUAAALLL RRREEEPPPOOORRRTTT OOONNN TTTHHHEEE
CCCOOONNNDDDIIITTTIIIOOONNN OOOFFF PPPOOOLLLKKK CCCOOOUUUNNNTTTYYY
AAANNNDDD CCCOOOUUUNNNTTTYYY DDDEEEPPPAAARRRTTTMMMEEENNNTTTSSS
DANA FREY, COUNTY ADMINISTRATOR
AUGUST 2015

CONTENTS
Letter of Transmittal ..................................................................................................................................... ii
Executive Summary ........................................................................................................................................ i
Introduction .................................................................................................................................................. 1
The Condition of the County ......................................................................................................................... 3
Economic Conditions ................................................................................................................................ 4
Employment .......................................................................................................................................... 4
Business ................................................................................................................................................ 7
Income and poverty ............................................................................................................................ 11
Housing ............................................................................................................................................... 12
Demographic Conditions ......................................................................................................................... 14
Fiscal Condition ....................................................................................................................................... 16
Property tax capacity and tax effort ................................................................................................... 17
Intergovernmental aid and finances ................................................................................................... 18
Other revenues ................................................................................................................................... 19
Expenditures ....................................................................................................................................... 19
Fund balance ....................................................................................................................................... 21
Debt service and borrowing ................................................................................................................ 22
Capital improvements and infrastructure .......................................................................................... 23
Management Conditions ............................................................................................................................ 23
Policies ................................................................................................................................................ 24
Management and service delivery ...................................................................................................... 24
Staffing and succession planning ........................................................................................................ 25
Structure and organization ................................................................................................................. 26
Policy Direction ................................................................................................................................... 27
Conclusion ................................................................................................................................................... 28
LETTER OF TRANSMITTAL

ii 2015 Report on the Condition of Polk County
July 31, 2015
Polk County Board of Supervisors
100 Polk County Plaza
Balsam Lake, Wisconsin, 54810
Honorable Chair Johnson and Supervisors:
Pursuant to Wisconsin Statutes Section 59.18, I have the honor of presenting you my fifth annual report
on the condition of Polk County as follows in this document.
In this report, as in the past, I measured the condition of the County using three dimensions: external
economic and demographic conditions, internal fiscal conditions, and management conditions. I am
pleased to report that all three are continuing in a positive direction and once again show improvement
over the prior year.
With respect to the economy, the County is beginning to fully recover from the 2007‐09 recession.
Employment is now well above the pre‐recession peak (quantitatively, if not qualitatively). In part as a
consequence, it is likely that overall population growth is resuming and returning to the pre‐recession
trend, i.e. one to two percent per year. The County’s fiscal position has greatly improved, with an
excellent fund balance and debt service approaching the lowest level in over a decade.
The management conditions of the County continue to improve as well. Succession planning remains a
priority due to pending retirements, and a strategy has been developed to accelerate internal leadership
development through training and support. A first draft of all of the core sections of a comprehensive
General Code has been completed, and it is anticipated it will be ready for adoption later this year.
Finally, initial work has been completed on service redesign that may be incorporated in the 2016
budget recommendation.
Respectfully submitted,
Dana W. Frey
County Administrator
About the cover: The horses pictured are owned by Polk County Land and Water Department’s Patty Jo Andersen, who
provides riding‐based therapy for children at her farm, Quarter Moon Acres. The picture is by Brett Hart Imagery, used with
permission.

EXECUTIVE SUMMARY
Wisconsin Statutes section 59.18 requires a county administrator to annually communicate to the
county board the condition of the county. As the administrator is the chief administrative officer of the
county and the county board the policy setting body, this would imply that the administrator
communicate matters of relevance in policy making, specifically in setting the annual budget and
responding to strategic issues such as workforce development and succession, infrastructure
improvements, and changing service needs and issues.
The condition of Polk County (“the County”) is measured on three dimensions: the economic and
demographic condition, or the context within which the Polk County Board of Supervisors (“the County
Board”) must make its decisions and the administrator his recommendations; the fiscal condition, or the
current financial status and financial trends affecting the County; and the management condition, or the
ability of the administration to effectively implement policy as set by the County Board.
The last recession hit Polk County very hard and may have reshaped the County’s economy
permanently. Although unemployment has improved greatly and the number of people employed have
passed the pre‐recession peak, signs of a weak economy such as number of food share recipients
remains quite high. County employers have not recovered as fully as well: place‐of‐employment data
show that employers located in Polk County employed about 2,000 fewer people in 2013 than in 2007,
before the recession, with the bulk of those losses coming in manufacturing, retail trade and
construction. Sales tax collections continue at record levels, indicating the rebound of the retail
industry, and it does appear that the real estate market recovery is sustained and the County’s equalized
value has begun to increase once again.
As noted in past reports, the demographics of the County have also been affected by the recession.
Both the U.S. Bureau of the Census and the Wisconsin Department of Administration estimate that the
County has lost population since the 2010 census due to
outmigration, although the latter believes that is largely offset by
natural population growth. The newest data, however, show that
outmigration has been reversed and people again are moving to Polk
County. This help confirm the long‐term projections from the
Wisconsin Department of Administration that show an annual
increase in the County’s population of between one and one‐half and
two percent per year. If true, this means that overall population
could reach 50,000 by the end of this decade.
The financial condition of the County continues to improve as past
debt is repaid and fund balances increased. The undesignated General Fund balance remains at about
38 percent of expenditures and the General Fund ended 2014 $1.2 million below budget. Every major
The unassigned fund balance
remains excellent at about
37 percent of expenditures,
increasing by $1.2 million in
2014.

ii 2015 Report on the Condition of Polk County
fund except Human Services ended with a positive balance: Golden Age Manor, Highway, and Lime
Quarry.1
The management condition of the County continues to progress, but issues of organizational
fragmentation, succession planning, and policy direction are becoming increasingly important. This year
is the second year of a management training program designed to improve capacity and customer
service, and succession planning is ongoing. The County’s organizational structure is fragmented,
however, with 23 separate departments. This is neither efficient nor conducive to customer service and
will need to be addressed.
On balance, it is again fair to say that the condition of Polk County continues to improving in every
aspect, but serious challenges loom: severely limited revenues, demands on social services for
placements, a rapidly aging population, a coming wave of employee retirements, a fragmented
organizational structure and a yet uncertain future role for local government. The local economy
continues to slowly get better and population growth has resumed, the County’s financial status has
improved again, and the County’s management condition is also continuing to improve. Once again, as
was written in all previous reports, Polk County is in a position most would envy: solid reserves, a
foundation of good fiscal practices, an outstanding work force, and a great place to live.
1 The Lime Quarry audit showed a deficit only because of the purchase of a front‐end loader.

2015 Report on the Condition of Polk County 1
INTRODUCTION
Wisconsin Statutes section 59.18 governs the position of county administrator and assigns him or her
the responsibility of being the chief administrative officer of the county as well as other duties including
preparation, submission, and execution of the annual budget, hiring and supervision of department
heads, appointment of committee members, and implementation of federal, state and county laws or
policies. That same statute provides that “The county administrator shall annually… communicate to
the board the condition of the county.” Through this, the statute also assigns every county
administrator the responsibility of advising the board on issues of import to them from the perspective
of the administrator’s duties and responsibilities. As the county board is the policy setting body, this
would imply that the administrator communicate matters of relevance in policy making. This report is
written in fulfillment of that requirement and constitutes this annual communication on the condition of
Polk County as required by statute.
From the perspective of the
county administrator, a condition
of a county is measured on three
dimensions: the economic and
demographic condition, or the
context within which the County
Board must make its decisions
and the administrator his or her
budget recommendations; the
fiscal condition, or the current
finances and financial trends
affecting the County; and the management condition, or the ability of the administration to effectively
implement policy as set by the County Board.
Reports are of little value without applicability. This report is therefore written in the main to provide
background information on the context within which the County Board will need to operate in
developing and approving the annual budget, or as the macro‐fiscal framework used in determination of
the resource envelope and running expenditure costs in other systems. In addition, this report is also
intended to help identify some of the more significant strategic issues in management that the County
Board will need to face in the coming year and beyond: succession planning and workforce turnover,
changing service demand, an aging population, severely constrained resources and other external
factors. Finally, as the County now may, and certainly must, focus on a longer‐term horizon for financial
and operational planning, this report also considers longer‐term opportunities and threats, some of
which will be addressed in the forthcoming budget. This report is therefore intended to complement
the strategic planning activities in individual departments.
Condition of the County
Economic and Demographic
FinancialManagement

2 2015 Report on the Condition of Polk County
Please note that this report is not intended to be a substitute for
annual reports submitted by individual departments, and care has
been taken to not repeat information included therein. This year, for
the first time, this report and these annual reports have been
combined so as to improve their applicability and value to the County
Board and make them a resource for the public. In addition, as the
descriptive section that follows this report indicates, the annual
department reports have been developed using a consistent format
and information, to complement the budget process.As noted in the
past, this report is instead intended to provide a view of the County
at a more macro, 10,000 foot level; department reports are more
detailed – a view from 500 feet.
Who and what is Polk
County?
Scattered throughout this
report are text boxes like this
containing facts and figures
intended to shed light on the
condition of Polk County –
who we are as residents, as
visitors, as businesses, as
government – in a way that
helps inform the role and
challenges of county
government.
2015 Report on the Condition of Polk County 3
THE CONDITION OF THE COUNTY
The most striking feature of the condition of Polk County is the ongoing steady improvement in the
economy. Employment has now exceeded pre‐recession levels and sales tax collections (and of course
underlying retail sales) continue to set records. The County’s population quite likely has stabilized: both
the US Census Bureau and the Wisconsin Department of Administration report a slight increase in
population over the period 2013 to 2014 (although the Census Bureau estimates that the County had
lost population overall since 20102). As noted in last year’s report, population forecasts now call for
reasonable growth through the next two decades, including growth in younger population groups. The
two other dimensions – the County’s internal fiscal condition and
the County’s management or operational condition – also show
improvement. Financially, the County remains stable, with
reasonable budget reserves at about 37% of General Fund
expenditures, debt service costs returning to a more sustainable
level and no substantial fiscal issues on the near horizon. Finally, the
last pieces of major management reform in budgeting, reporting,
succession planning and policy codification are also being
implemented.
Challenges do remain. The current economic expansion is now over
six years old, and even though there are now no storm clouds on the
horizon another recession is inevitable. Although employment is
growing, income issues from the past recession remain putting
pressure on County services. The proportion of County residents receiving FoodShare benefits remains
at a historically high level. There has been no change in state policy towards local government, meaning
a frozen property tax levy for the fifth year in a row and limited state aid. The County’s organizational
structure remains fragmented and not well aligned to an administrator form of government. Lines of
accountability are also unclear with the role of the committee structure still evolving, and there are
challenges in policy direction and in planning. Finally, although the County’s infrastructure is in generally
good to excellent condition, the Highway Department facility is functionally obsolete and requires, at a
minimum, a complete and total remodel.3
2 The relative unreliability of population estimates is illustrated by the difference between the two estimates, both in level and composition of change. 3 That option requires further study, as it likely not cost‐effective to rebuild/remodel on the current site.
Polk County has now passed
its pre‐recession
employment peak:
according to data from the
state, Polk County
employment exceeded its
pre‐recession peak late in
2014

4 2015 Report on the Condition of Polk County
ECONOMIC CONDITIONS
As recovery from the Great Recession continues nationwide, Polk County’s economy continues to
strengthen, with employment well past the pre‐recession peak and sales tax collections at record levels.
Although troubling signs do remain, the overall picture is one of improvement and reversion to overall
trends apparent before that recession.
EMPLOYMENT
As noted in past reports, measuring employment and unemployment is problematic even at a national
level; problems increase exponentially in attempting such measurements at a local level. Nonetheless,
and all methodological issues aside, the employment picture continues to improve in Polk County, with
the number of people employed now well above the pre‐recession peak. However, the last recession
may well have permanently cost the County as many as 1,000 jobs: as Figure 1 shows, the current level
of employment is about 1,000 people fewer than what it would have been had the last recession not
occurred, although the post‐recession trend would seem to indicate some of this might be recoverable.
(Note that these are employment data for County residents; other data discussed below are for County
employers.) Part of this drop can probably be accounted for by the same factors reducing labor force
participation nationally, and part is likely due to a net out‐migration of working age adults.4
In May 2015, the County’s unemployment rate was 4.7%, down from 5.7% in May 2014 and at the above
the State average of 4.7% (not seasonally adjusted). This is in keeping with unemployment in the region:
the U.S. Bureau of Labor Statistics estimates that the unemployment rate for the Minneapolis‐St. Paul
Metropolitan Area was 3.4% in May 2015, the third‐lowest in the nation. Continued growth in
employment in this metropolitan area will therefore require both in‐migration and tapping into labor
markets from a longer distance away, like Polk County.
As noted in past reports, employment and unemployment rates are quantitative, not qualitative
statistics. This so‐called “underemployment rate” measures those who indicate they would like a full
time job, but have ceased actively attempting to gain employment. This rate is much slower to recover
after a recession, and currently more than doubles the national unemployment rate, standing at 10.8
percent in May. That helps explain why poverty, although declining, is still high by historical standards.
4 The US Census Bureau estimates that Polk County lost 803 residents to outmigration during the period 2010 to 2014; the State of Wisconsin Department of Administration estimates a loss of only 272 people. See the section on Demographic Conditions following.

2015 Report on the Condition of Polk County 5
20,000
20,500
21,000
21,500
22,000
22,500
23,000
23,500
24,000
Jan‐00
Aug‐00
Mar‐01
Oct‐01
May‐02
Dec‐02
Jul‐03
Feb‐04
Sep‐04
Apr‐05
Nov‐05
Jun‐06
Jan‐07
Aug‐07
Mar‐08
Oct‐08
May‐09
Dec‐09
Jul‐10
Feb‐11
Sep‐11
Apr‐12
Nov‐12
Jun‐13
Jan‐14
Aug‐14
Mar‐15
Polk County Employment, 2000 ‐ 20014Seasonally Adjusted, Shaded Areas Are Recessions
Figure 1
Trend line is from the 2001 – 2007 economic recovery
Source: Department of Administration calculations from Wisconsin Department of Workforce Development data
Data are also available on where people work and the categories of employees. Figure 2 is a look at
these data for Polk County: the importance of manufacturing becomes readily apparent, with the single
largest category of employees in the County being production workers, accounting for 14.6% of the total
(note that this includes public sector employees); all told, prosecution‐related occupations including
transportation and materials handling account for almost 22% of total jobs in Polk County. Office
workers, which would include many public employees, are the next largest group, and healthcare‐
related employment also shows as significant, although spread across a number of occupational
categories.
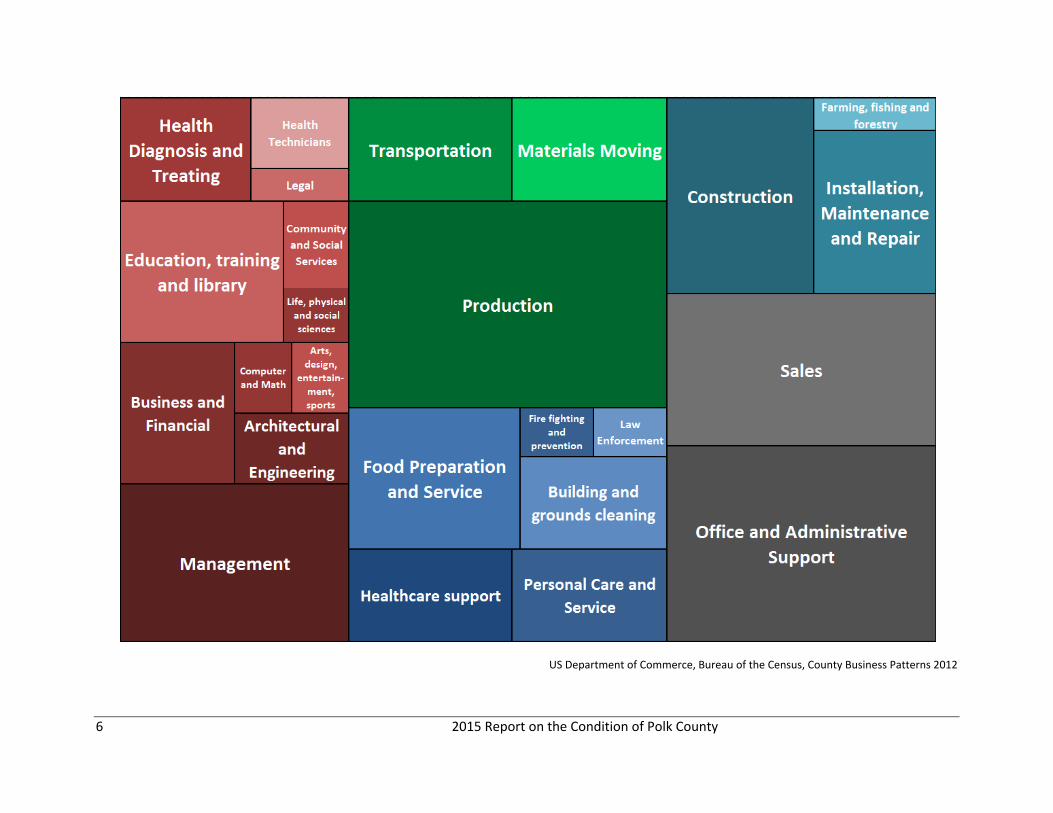
6 2015 Report on the Condition of Polk County
US Department of Commerce, Bureau of the Census, County Business Patterns 2012

2015 Report on the Condition of Polk County 7
BUSINESS
Like all but a few Wisconsin counties, Polk County imposes a one‐half cent sales tax piggybacked on the
State sales tax and collected by the State Department of Revenue. In addition to providing revenue to
reduce reliance on the property tax, these collection data also allow the County to track local economic
activity. Unfortunately, these data are a bit difficult to read for anything short of a year (and perhaps
longer) as they suffer both from seasonality, like employment data, and volatility due to payment timing
and processing. A delay of one day by a vendor or by the Department
of Revenue in processing a large sales tax remittance can have a
significant impact on that month’s collections.
Figure 4 shows sales tax collections by year, and the explosive growth
in these collections since the end of the recession is readily apparent.
2014, especially, was a banner year, with collections increasing. This
indicates a number of areas where economic improvement is
occurring: vehicle sales, which are at record levels nationally,
improved retail sales, and for Polk County especially, higher tourism
revenues. The Wisconsin Department of Tourism estimates that total
direct visitor spending in Polk County was $79.5 million in 2014, up
4.2% from 2013.
Figure 4
Source: Wisconsin Department of Revenue
1.5
1.7
1.9
2.1
2.3
2.5
2.7
2.9
2002 2003 2004 2005 2006 2007 2008 2009 2010 2011 2012 2013 2014
Polk County Sales Tax CollectionsDollars in Millions
Tourism: in 2014, visitors to
Polk County spent $79.5
million and the tourism
industry employed 1,061
people with a payroll of
$20.3 million

8 2015 Report on the Condition of Polk County
The above discussion on employment has focused on Polk County residents who are employed; data are
also available (albeit lagged one year) on Polk County employers, including self‐employed individuals.
Table 1, following, gives an overview of the County’s business patterns for 2013 including number of
establishments, employees, and payroll. Table 2 shows number of employees by sector for 2007, 2012
and 2013 to show the impact of the recession and recovery on employment, and Table 3 provides data
on self‐employed individuals in Polk County by sector. Figure 5, below, illustrates employment by sector
for that same period.
Figure 5
Polk County Employment by Sector
Source: U.S. Department of Commerce, Bureau of the Census, County Business Patterns 2013
Note the slow pace of recovery, overall, for County employers. The low point in employment was not
reached until 2012 (note that these data are for the first quarter of each year only), and the recovery
has overall been slight. This does conceal an underlying shift, however, away from retail employment
towards manufacturing and health care. This recent trend is confirmed by the data in Table 2.
The most striking feature of these tables is the recent rebound in manufacturing and its importance to
the County‘s economy. Manufacturing accounts for 36 percent of total payrolls, and employment was
reported to grow by seven percent between 2012 and 2013. Health care is the second‐largest sector,
‐
2,000
4,000
6,000
8,000
10,000
12,000
14,000
16,000
2007 2008 2009 2010 2011 2012 2013
Other
Other services (except public administration)
Accommodation and food services
Arts, entertainment, and recreation
Health care and social assistance
Administrative and support and waste management and remediation services
Professional, scientific, and technical services
Real estate and rental and leasing
Finance and insurance
Information
Transportation and warehousing
Retail trade
Wholesale trade
Manufacturing
Construction
Utilities

2015 Report on the Condition of Polk County 9
and this area does continue to grow as it did throughout the past recession. There is no reason to not
expect this growth to continue.
Table 1
Distribution of Polk County Businesses, 2013
Sector
Establishments Employees Annual Payroll
Number Percent of Total Number
Percent of Total
Amount ($000)
Percent of Total
Agriculture, forestry, fishing and hunting 4 0.4% 8 0.1% 209 0.1%
Mining, quarrying, and oil and gas extraction
2 0.2% N/A N/A ‐ 0.0%
Utilities 9 0.8% 93 0.8% 6,453 1.8%
Construction 133 12.0% 310 2.7% 12,015 3.3%
Manufacturing 105 9.5% 3,091 27.1% 132,068 36.1%
Wholesale trade 39 3.5% 460 4.0% 20,006 5.5%
Retail trade 168 15.1% 1,914 16.8% 39,914 10.9%
Transportation and warehousing 28 2.5% 104 0.9% 3,952 1.1%
Information 21 1.9% N/A N/A 5,171 1.4%
Finance and insurance 52 4.7% N/A N/A 12,075 3.3%
Real estate and rental and leasing 36 3.2% 60 0.5% 1,132 0.3%
Professional, scientific, and technical services
83 7.5% 358 3.1% 12,442 3.4%
Management of companies and enterprises
2 0.2% N/A N/A ‐ 0.0%
Administrative and support and waste management and remediation services
48 4.3% 240 2.1% 5,973 1.6%
Educational services 5 0.5% 9 0.1% 118 0.0%
Health care and social assistance 97 8.7% 2,458 21.6% 89,524 24.5%
Arts, entertainment, and recreation 25 2.3% 263 2.3% 2,208 0.6%
Accommodation and food services 118 10.6% 1,070 9.4% 11,173 3.1%
Other services (except public administration)
135 12.2% 457 4.0% 8,597 2.3%
Industries not classified 4 0.4% 8 0.1% 209 0.1%
Total for all sectors 1,110 11,386 366,142
N/A means that data were not released to avoid disclosing confidential information. For those businesses for which an employment range was given, the percentage of total employees was estimated based on range midpoint(s)
Source: U.S. Department of Commerce, Bureau of the Census, County Business Patterns 2013

10 2015 Report on the Condition of Polk County
Table 2
Number of Employees by Sector: 2007, 2012, and 2013, Polk County
Sector
NumberofEmployees
2007 2012 2013
Agriculture,forestry,fishingandhunting N/A N/A N/A
Mining,quarrying,andoilandgasextraction
N/A N/A N/A
Utilities 99 93 89
Construction 556 310 324
Manufacturing 4,155 3,091 3,311
Wholesaletrade 354 460 423
Retailtrade 2,200 1,914 1,820
Transportationandwarehousing 159 104 119
Information 261 N/A N/A
Financeandinsurance 349 N/A 263
Realestateandrentalandleasing 86 60 73
Professional,scientific,andtechnicalservices
316 358 349
Managementofcompaniesandenterprises 22 N/A N/A
Administrativeandsupportandwastemanagementandremediationservices
419 240 216
Educationalservices N/A 9 b
Healthcareandsocialassistance 2,175 2,458 2,506
Arts,entertainment,andrecreation 257 263 196
Accommodationandfoodservices 1,376 1,070 1,103
Otherservices(exceptpublicadministration)
527 457 462
Industriesnotclassified N/A N/A N/A
Totalforallsectors 13,369 11,386 11,464
Source: U.S. Department of Commerce, Bureau of the Census, County Business Patterns 2013, 2012 and 2007
Finally, and as noted in the past, it is readily apparent that a large part of the County’s economy consists
of self‐employed individuals. The latest data are for 2013 are contained in Table 3.

2015 Report on the Condition of Polk County 11
Table 3
Self‐employed Individuals by Sector, 2013, Polk County
Sector Firms Gross Receipts
Number Percent of Total
Amount ($1,000)
Percent of Total
Agriculture, forestry, fishing and hunting 83 2.52% 2,455 1.94%
Construction 601 18.22% 29,836 23.64%
Manufacturing 95 2.88% 2,493 1.98%
Wholesale trade 49 1.49% 2,463 1.95%
Retail trade 399 12.09% 12,591 9.98%
Transportation and warehousing 193 5.85% 21,284 16.86%
Information 36 1.09% 789 0.63%
Finance and insurance 76 2.30% 3,697 2.93%
Real estate and rental and leasing 284 8.61% 16,120 12.77%
Professional, scientific, and technical services 272 8.24% 8,820 6.99%
Administrative and support and waste management
and remediation services 214 6.49% 4,476 3.55%
Educational services 61 1.85% 567 0.45%
Health care and social assistance 251 7.61% 4,076 3.23%
Arts, entertainment, and recreation 168 5.09% 2,741 2.17%
Accommodation and food services 49 1.49% 1,885 1.49%
Other services (except public administration) 468 14.19% 11,931 9.45%
Total for all sectors 3,299 126,224
Source: U.S. Department of Commerce, Bureau of the Census, Non‐employer Statistics, 2013
INCOME AND POVERTY
The severity of the past recession continues to be seen in measures of income and poverty. Although
Polk County employment has largely recovered from the past recession, the median household income
in 2013 is still slightly below that in 2008, at $49,138 and $50,520, respectively. The poverty rate
remains at 10.5 percent, down from a peak of over 12 percent at the bottom of the recession in 2010
but still well above the pre‐recession level of about eight percent. The poverty level for 2013 is defined
as $11,490 for one person and $23,550 for a family of four.
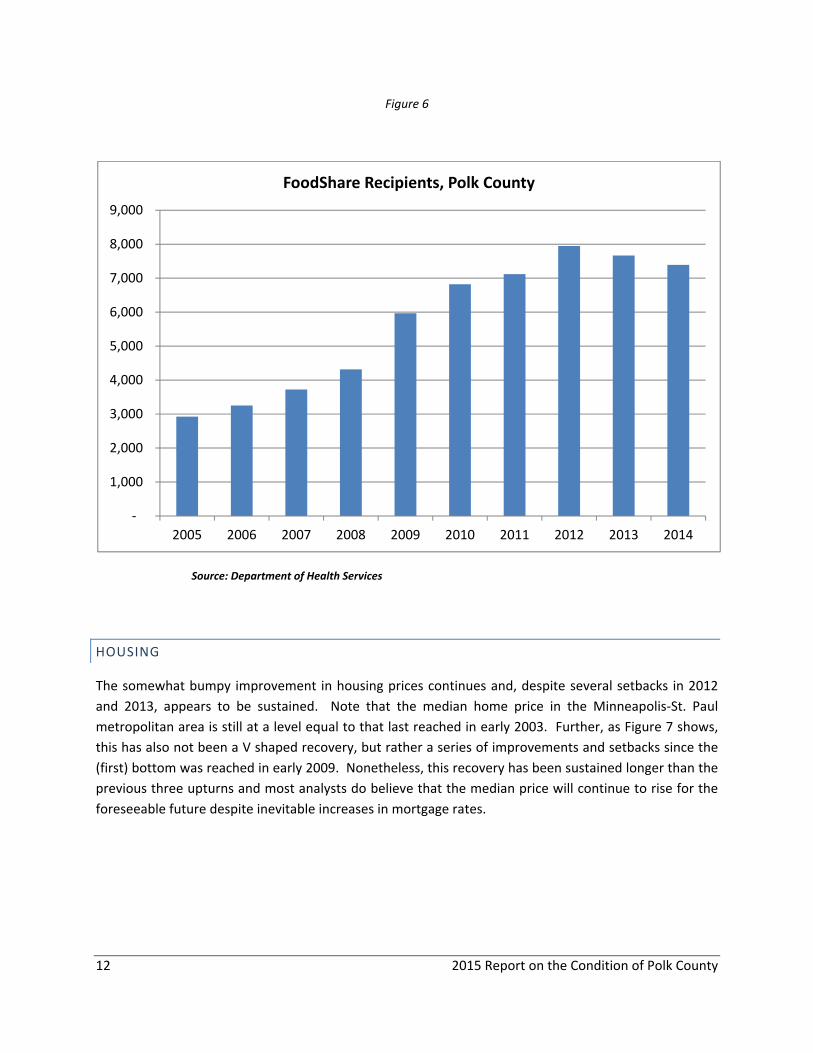
Another, more current, method of looking at poverty is the number of people receiving food assistance
– FoodShare – in a county. Figure 6 shows this total for Polk County from 2009 through 2014 based on
State of Wisconsin data.
12 2015 Report on the Condition of Polk County
Figure 6
Source: Department of Health Services
HOUSING
The somewhat bumpy improvement in housing prices continues and, despite several setbacks in 2012
and 2013, appears to be sustained. Note that the median home price in the Minneapolis‐St. Paul
metropolitan area is still at a level equal to that last reached in early 2003. Further, as Figure 7 shows,
this has also not been a V shaped recovery, but rather a series of improvements and setbacks since the
(first) bottom was reached in early 2009. Nonetheless, this recovery has been sustained longer than the
previous three upturns and most analysts do believe that the median price will continue to rise for the
foreseeable future despite inevitable increases in mortgage rates.
‐
1,000
2,000
3,000
4,000
5,000
6,000
7,000
8,000
9,000
2005 2006 2007 2008 2009 2010 2011 2012 2013 2014
FoodShare Recipients, Polk County

2015 Report on the Condition of Polk County 13
Figure 7
Source: Standard and Poor Case‐Shiller Home Price Index, seasonally adjusted
It appears that new construction coupled with flat values on other property has finally reversed the
long‐term decline in the County’s equalized value (property value for tax purposes). Figure 8 shows
equalized value for Polk County for the period 1990 – 1994. Note that the drop in value during the past
recession was $1 billion, or nearly 20 percent of the total pre‐recession value.
0
20
40
60
80
100
120
140
160
180
Jan‐2000
Jul‐2000
Jan‐2001
Jul‐2001
Jan‐2002
Jul‐2002
Jan‐2003
Jul‐2003
Jan‐2004
Jul‐2004
Jan‐2005
Jul‐2005
Jan‐2006
Jul‐2006
Jan‐2007
Jul‐2007
Jan‐2008
Jul‐2008
Jan‐2009
Jul‐2009
Jan‐2010
Jul‐2010
Jan‐2011
Jul‐2011
Jan‐2012
Jul‐2012
Jan‐2013
Jul‐2013
Jan‐2014
Jul‐2014
Jan‐2015
Case Shiller Home Price Index, Minneapolis

14 2015 Report on the Condition of Polk County
Figure 8
DEMOGRAPHIC CONDITIONS
As with values, the U.S. Census Bureau now estimates that population growth has also resumed. The
overall positive outlook for the economy is also reflected in the projections of the County’s demographic
conditions. Although it is very likely that the County lost population during the past recession (the
Wisconsin Department of Administration estimates that the County gained a net of only 22 people since
the 2010 Census and the U. S. Census Bureau estimates that the
County lost 768 people over that same period), the most recent
projections from both sources are for net in‐migration to resume;
the DoA projects that the County will continue to grow over the next
two decades. Figure 9 shows change in the County’s population from
1970 through 2010, projections by the Department of Administration
for 2020 through 2040, and a projection using a trendline calculated
from actual growth from 1970 to 2010. Note how close the
projections are to that trendline, and the effect of past recessions on
population growth. It appears that every national recession has been
followed by a five year (or so) pause in County population growth.
0
1,000,000,000
2,000,000,000
3,000,000,000
4,000,000,000
5,000,000,000
6,000,000,000
1989/90
1990/91
1991/92
1992/93
1993/94
1994/95
1995/96
1996/97
1997/98
1998/99
1999/00
2000/01
2001/02
2002/03
2003/04
2004/05
2005/06
2006/07
2007/08
2008/09
2009/10
2010/11
2011/12
2012/13
2013/14
2014/15
Polk County Equalized Value by Year
A return to growth trends:
Recent estimates are that
the County’s population has
resumed its historical rate of
population growth of about
1.5‐2 percent per year due to
an improved economy and
natural population growth
(births exceeding deaths).

2015 Report on the Condition of Polk County 15
Figure 9
Source:
Wisconsin Department of Administration
This projection of growth also helps shape the demographic profile of the County. Previously, the most
striking features of the County’s demographic profile – like that of most rural counties – was its rapidly
aging population and its loss of working‐age adults. The former is inevitable, and over the next 20+ years
the fastest growing age group in absolute terms will be residents in their 70s, adding another 3,000
people. However, with economic growth comes growth in working age adults and families; it is now
projected that the County will gain in every age group except 45‐55; Figure 10 shows the change in
population by age group from 2010 to 2035; note the dramatic increases in the older groupings.
As noted in past reports, this rapid shift will place strains on government services, especially in rural
areas. Many of these individuals will live around the lakes or in the countryside, with vacation properties
becoming permanent residences. These properties are not easily accessed, many on narrow, private,
dead end gravel roads by a lake. Transportation, public safety, highway maintenance, social services,
public health, aging programs – all will require increased resources due to the County’s older,
geographically scattered population. However, this economic resurgence will assist in increasing values
and revenues, providing some assistance in coping with these increased demands (although of course
only within reason). All told, this economic growth and accompanying increase in working age
population puts Polk County in a far better position than most truly rural counties in coping with this
growth in older population.
10,000
15,000
20,000
25,000
30,000
35,000
40,000
45,000
50,000
55,000
60,000
1970 1980 1990 2000 2010 2020 2030 2040
Projected Polk County Population2010‐2040

16 2015 Report on the Condition of Polk County
Figure 10
Source: Prepared from estimates developed by the Wisconsin Department of Administration
Finally, the character of population growth will also change in the coming years. Much of Polk County’s
growth is projected to come from net migration, not natural increase (births minus deaths). This
migration will likely increase the diversity of the County’s population: the (Twin Cities) Metropolitan
Council estimates that all of the net population growth in the metropolitan area will be in groups
traditionally defined as minorities, i.e. no natural increase or net in‐migration in populations defined as
Caucasian; that same trend will likely occur in Polk County.
At present, Polk County has a limited but diverse minority population. According to the U.S. Department
of Justice, in 2012 398 residents had limited English proficiency, of which 252 spoke Spanish or Spanish
Creole, 39 Chinese, 22 German, 15 French, 13 Scandinavian languages, 10 Serbo‐Croatian, 10 Native
American and the balance other European, Indic or Asian languages.
FISCAL CONDITION
The economic analysis and outlook is one part of the financial picture for purposes of policy making
through the annual budget; the fiscal status or condition of the county is another. Economic data help
provide guidance as to demand for services and growth in resources; fiscal conditions provide
information on resource availability and internal influences on the County’s budget as well as those
externally imposed by other levels of government in the form of financial aid, programs or mandates.
In general, the fiscal condition of the County continues to improve. The County the cumulative gap
between revenues and expenditures – an indicator analogous to a deficit at a higher level of
‐ 500
0
500
1,000
1,500
2,000
Change in Population by Age Group, 2010 – 2040Polk County

2015 Report on the Condition of Polk County 17
government – was reduced again in 2014 and will fall substantially this year, through early repayment of
a 2007 bond. (Counties of course must have balanced budgets; however, borrowing for capital and,
especially, indirectly for current expenditures has a similar effect in that these funds that must be paid
back in the future.) County finances as a whole are now sustainable, albeit challenges are coming in the
form of severe revenue restrictions combined with increased costs of operations. At the same time, the
County’s fund balances continue to improve and it appears that the County’s equalized value has begun
to increase once again.
PROPERTY TAX CAPACITY AND TAX EFFORT
Despite the huge drop in value due to the past recession, Polk County remains a wealthy county in
property terms, with $ 4,080,686,600 in equalized value or over $90,000 per capita. The fall in value is
equally impressive: a loss of nearly $1 billion from 2008 to 2013. Table 6 shows change in equalized
value by class of property from 20113 to 2014. Note that nearly all of the growth in value is in new
construction but, unlike in past years, the value of existing property did increase.
Table 6
Change in Equalized Value by Class, 2013 – 2014, Polk County
Class of Property 2013 Value New
Construction 2014 Value
Change in Value
Dollar Pct.
Residential 3,143,570,000 16,032,500 3,170,059,200 26,489,200 0.8%
Commercial 337,778,500 15,700,100 354,837,500 17,059,000 5.1%
Manufacturing 88,500,500 11,230,500 101,938,300 13,437,800 15.2%
Agricultural 34,138,900 0 33,919,200 ‐219,700 ‐0.6%
Undeveloped 39,576,800 0 37,749,700 ‐1,827,100 ‐4.6%
AgForest 54,466,400 0 53,637,100 ‐829,300 ‐1.5%
Forest 207,270,800 0 209,214,400 1,943,600 0.9%
Other 122,458,400 885,100 119,331,200 ‐3,127,200 ‐2.6%
Total 4,027,760,300 43,848,200 4,080,686,600 52,926,300 1.3%
Source: Wisconsin Department of Revenue
Despite these falling values and in large part because of fiscal constraint, Polk County’s property tax rate
– an indicator of tax effort – remains near the middle for Wisconsin counties. For 2014, the County’s tax
rate was $5.42 per $1,000 of equalized value (including Act 15 and Town Bridge Aid); this places the
County exactly at the median, ranking 36th highest among the 72 counties, dropping from 35th in 2014.
On a dollar basis, the County levy about the same as it has been for the past five years. (Excluding the
State‐mandated levies for Act 150 (libraries) and Town Bridge Aid. Although included in some reports of
county levies, neither of these levy amounts are controllable by a county government nor do the
proceeds go to county government, meaning they are indirect city/village/town levies.)

18 2015 Report on the Condition of Polk County
As noted in past years’ condition of the county reports, much as a relatively low tax rate is not prima
facie evidence of low tax effort or burden, as higher average values can result in higher average taxes
holding rate constant, a relatively high per capita levy is not proof of a high tax effort. Tax shifting and
incidence result in a redistribution of taxes to non‐residents; this is especially pronounced in those areas
with a great deal of seasonal property as per capita measures do not take into account the cost of
providing services to seasonal residents or tourists. In an annex to the 2011 report, we calculated that
about $60 of levy per capita can be directly ascribed to the cost of providing services to seasonal
residents (of course the added tax base more than compensates for this cost).
INTERGOVERNMENTAL AID AND FINANCES
The long‐term decline in State aid does appear to have stabilized and even increased, although only in
two areas and at a level far below historical averages. As recently as 2008, state aid exceeded $14
million annually; we expect it to be just over $10 million this year (Figure 7). We do not expect any
increase in state aid next year.
Beyond next year, the prospects for increased state or federal aid are slight. The Affordable Care Act
will absorb much of any new federal revenue and the State of Wisconsin, while improving financially,
must still deal with an ongoing structural imbalance. As Polk County is not substantially reliant on state
aid, however, this should prove manageable (much of what is described as state aid below is in fact
pass‐through federal aid such as Medicaid).
Figure 11
Source: Department of Administration
$‐
$2,000,000
$4,000,000
$6,000,000
$8,000,000
$10,000,000
$12,000,000
$14,000,000
$16,000,000
2007 2008 2009 2010 2011 2012 2013 2014 (budget)
2015 (budget)
State Aid to Polk County by Year
2015 Report on the Condition of Polk County 19
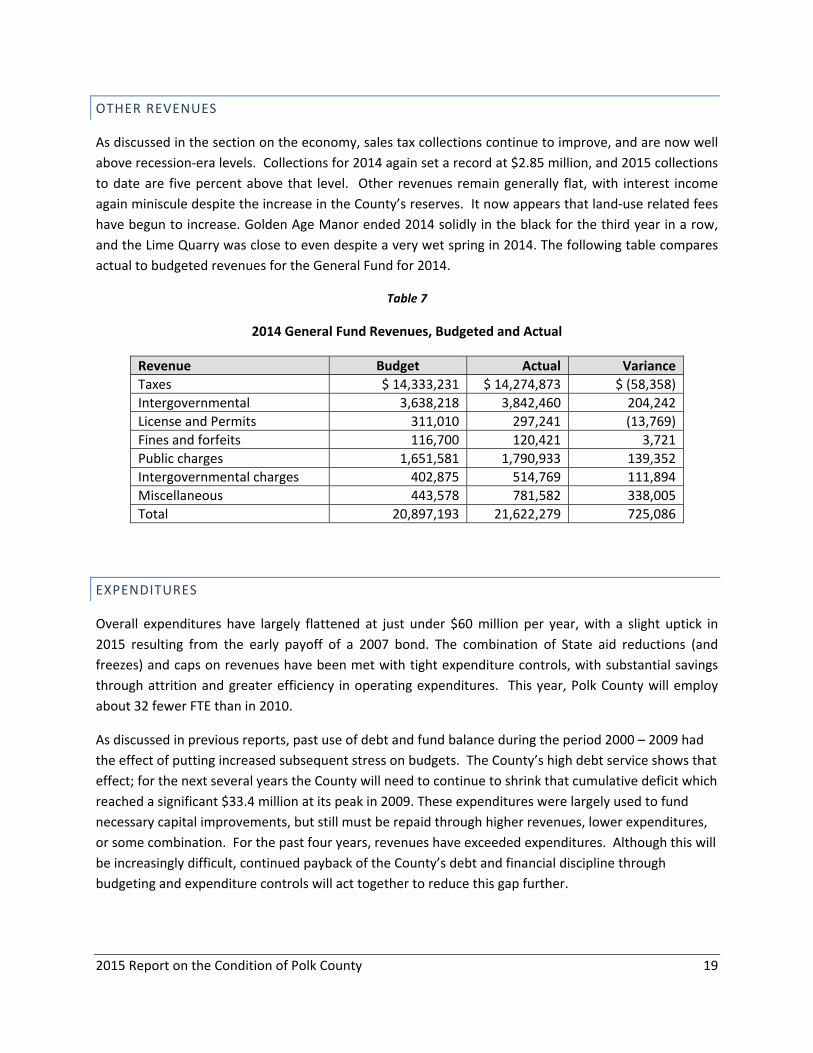
OTHER REVENUES
As discussed in the section on the economy, sales tax collections continue to improve, and are now well
above recession‐era levels. Collections for 2014 again set a record at $2.85 million, and 2015 collections
to date are five percent above that level. Other revenues remain generally flat, with interest income
again miniscule despite the increase in the County’s reserves. It now appears that land‐use related fees
have begun to increase. Golden Age Manor ended 2014 solidly in the black for the third year in a row,
and the Lime Quarry was close to even despite a very wet spring in 2014. The following table compares
actual to budgeted revenues for the General Fund for 2014.
Table 7
2014 General Fund Revenues, Budgeted and Actual
Revenue Budget Actual Variance
Taxes $ 14,333,231 $ 14,274,873 $ (58,358)
Intergovernmental 3,638,218 3,842,460 204,242
License and Permits 311,010 297,241 (13,769)
Fines and forfeits 116,700 120,421 3,721
Public charges 1,651,581 1,790,933 139,352
Intergovernmental charges 402,875 514,769 111,894
Miscellaneous 443,578 781,582 338,005
Total 20,897,193 21,622,279 725,086
EXPENDITURES
Overall expenditures have largely flattened at just under $60 million per year, with a slight uptick in
2015 resulting from the early payoff of a 2007 bond. The combination of State aid reductions (and
freezes) and caps on revenues have been met with tight expenditure controls, with substantial savings
through attrition and greater efficiency in operating expenditures. This year, Polk County will employ
about 32 fewer FTE than in 2010.
As discussed in previous reports, past use of debt and fund balance during the period 2000 – 2009 had
the effect of putting increased subsequent stress on budgets. The County’s high debt service shows that
effect; for the next several years the County will need to continue to shrink that cumulative deficit which
reached a significant $33.4 million at its peak in 2009. These expenditures were largely used to fund
necessary capital improvements, but still must be repaid through higher revenues, lower expenditures,
or some combination. For the past four years, revenues have exceeded expenditures. Although this will
be increasingly difficult, continued payback of the County’s debt and financial discipline through
budgeting and expenditure controls will act together to reduce this gap further.

20 2015 Report on the Condition of Polk County
Table 8
Changes in Fund Balances of Governmental Funds, Polk County
(Modified Accrual Basis of Accounting); Dollars in Millions
Year Revenues Expenditures Difference
2000 $25.629 $26.211 ($0.582)
2001 30.689 39.231 (8.550)
2002 32.179 44.841 (12.663)
2003 34.691 43.753 (9.062)
2004 38.386 38.387 (0.001)
2005 41.053 40.523 0.529
2006 41.748 43.781 (2.034)
2007 41.766 42.214 (0.448)
2008 45.479 45.925 (0.445)
2009 41.820 41.963 (0.143)
2010 42.063 40.335 1.729
2011 40.834 40.244 0.591
2012 40.243 39.632 0.611
2013 40.885 40.788 0.097
2014 41.146 40.055 1.091
Detail may not add to total due to rounding; 2012 adjusted for debt refinancing.
Source: 2009 and 2014 Comprehensive Annual Financial Report, Polk County
General Fund expenditures for 2014 were a total of $23,124,252 as compared to a budget of
$24,366,725, a savings of $1,242,473 or about five percent. Table 9 compares actual and budgeted
expenditures for 2013.

2015 Report on the Condition of Polk County 21
Table 9
Comparison of Budgeted and Actual General Fund Expenditures, 2014
Expenditure Category Budget Actual Difference
General Government 6,971,963 6,095,060 876,903
Public Safety 7,770,968 7,503,077 267,891
Highway 4,726,090 4,726,090 ‐
Sanitation 625,301 606,452 18,849
Health and Human Services (General Fund Share Only) 1,592,458 1,569,915 22,543
Culture, Recreation and Education 1,010,994 962,319 48,675
Conservation and Development 1,668,951 1,661,339 7,612
Total Expenditures 24,366,725 23,124,252 1,242,473
Please note that it would be extremely risky to assume that future expenditures will always exceed
budgeted amounts. Much of these savings have come from attrition, holding positions open for a
portion of the year. However, staffing levels are approaching minimum in most areas, meaning that it
will be increasingly difficult to delay filling positions for any length of time. As a consequence, the need
for budgetary discipline becomes even greater, as if a department exceeds its budget there may not be
savings elsewhere to offset this deficit.
Outside of the General Fund, the condition of other funds has improved as well. The health insurance
fund had an actual increase in for the last four years after several years of declines. The Highway
Department fund balance also increased, as did Golden Age Manor.
FUND BALANCE
Overall, Polk County’s unassigned fund balance increased significantly, by $1,138,531 and from 30.3% of
total General Fund expenditures to 36.5% (Table 10). Note that the 2014 budget set a minimum fund
balance of 33 percent of General Fund expenditures; the end‐of‐2014 unassigned balance exceeded that
amount by $$740,000.

22 2015 Report on the Condition of Polk County
Table 10
Polk County Unassigned Fund Balance by Year
2009 Audited
2010 Audited
2011 Audited
2012 Audited
2013 Audited
2014 Audited
Beginning Fund
Balance $2,987,002 $2,878,036 $6,635,325 $7,254,080 $6,739,432 $7,304,853
Additions
(Subtractions) (108,966) 3,757, 289 618,755 (514,648) 565,421 1,138,531
Ending Fund
Balance 2,878,036 6,635,325 7,254,080 6,739,432 7,304,853 8,443,384
Percent of
General Fund
Expenditures
12.3% 29.4% 31.1% 29.3% 30.3% 36.5%
Again, a fund balance of over 30 percent is considered to be a prudent amount at this time due to a high
level of uncertainty in State and Federal funding as well as limited growth in revenues. Should a major
funding loss or large unanticipated cost occur, a reserve provides the time needed to phase out
programs and avoid disruptions and extra costs. In addition, much of this fund balance was comprised
of one‐time resources such as cancellation of non‐lapsing accounts, project funds, and so forth as well as
one‐time expenditure reductions or savings. The 2015 budget is sustainable, and in fact goes further in
reducing future costs; the 2016 budget will need be sustainable as well. For now the safest assumption
is that these funds are all one‐time resources.
DEBT SERVICE AND BORROWING
As of today, Polk County owes $16.2 million in principal and, under current schedules (absent
refinancing) will pay $2.5 million in interest between now and 2021, when all debt is paid. Funding has
been appropriated to pay off a 2007 bond two years early at a cost of $1.65 million as well as make
scheduled debt service payments; as a consequence, debt service for 2015 is a record $5.7 million and,
in one year, the County will retire nearly 30 percent of its long‐term debt. In 2016, the County’s debt
service will be approximately $3.1 million, or 15 percent of tax levy, a sustainable level for a growing
county.
Starting in 2017 debt service will fall off very rapidly, with all of the County’s debt repaid by 2021. This
provides opportunity to consider new infrastructure investments without a levy increase by simply
sustaining debt service at about 15 percent of levy, with of course restraint on other expenditures.
Table 11 shows debt service by year from 2015 through 2021 by principal and interest payments for all
County obligations. Note that all of the County’s debt is retired and there are no scheduled debt service
payments after 2021.

2015 Report on the Condition of Polk County 23
Table 11
Polk County Debt Service Payments
2014 – 2021
Year Principal Interest Total Change from prior year
2015 4,842,777 850,210 5,692,987 1,831,682
2016 2,620,000 527,055 3,147,055 ‐2,545,932
2017 1,860,000 396,055 2,256,055 ‐891,000
2018 2,010,000 325,375 2,335,375 79,320
2019 2,140,000 229,000 2,369,000 33,625
2020 2,200,000 128,250 2,328,250 ‐40,750
2021 500,000 23,750 523,750 ‐1,804,500
CAPITAL IMPROVEMENTS AND INFRASTRUCTURE
With a few notable exceptions, the County’s infrastructure continues to be in excellent condition. As
noted in the past, the opposite side of the debt service cost issue is that the County does enjoy the
benefits of relatively new, energy efficient, low maintenance facilities. The quality of the highway
system is also quite high despite recent funding challenges discussed above; please refer to the excellent
reports by the Highway Department for more detail.
A longer‐term concern has emerged with respect to specific facilities. The Highway Department
facilities are in relatively poor condition, with issues of accessibility, efficiency, and structural and
functional obsolescence. These issues must be addressed in the next several years, either through a
major remodeling or construction of new facilities or perhaps both. Golden Age Manor has developed a
capital improvement plan for the first time that calls for investments in facilities and equipment
adequate to improve the overall facility and has recently demonstrated the ability to fund such
investments. Finally, the government center itself is perhaps only a decade or less away from requiring
a major upgrade.
MANAGEMENT CONDITIONS
The final relevant aspect of the condition of Polk County is administrative. Specifically, this dimension
considers implementation of policy as set by the County Board, the “how” Board directives are carried
out. State law assigns this responsibility to the county administrator and department heads and by so

24 2015 Report on the Condition of Polk County
doing requiring that the county administrator and department heads be accountable to a county board
for their implementation. A recent Wisconsin Attorney General’s opinion has reinforced this
responsibility and consequent accountability, noting that “In a county with a county administrator …
[committees and boards are] purely advisory bodies to the county administrator and county board and a
policy‐making body for the … department as a whole … [and] cannot exercise supervisory or
management authority”
POLICIES
An administrator is responsible for implementing policies set by a county board, a significant part of his
or her management assignment. To do so, these policies must be clear, comprehensive, easily
referenced, current, and not contradictory or ambiguous. Over the past two years, a number of policies
have been redrafted to fit the administrator form of government, to ensure comprehensive coverage or
to eliminate inconsistent or obsolete provisions. This activity has been of benefit in improving the
quality of policies and assisting in their implementation. Redrafted policies include budget preparation
and execution, purchasing, personnel policies, financial policies, debt management, property
management, accounts receivable, governing committee roles and responsibilities, investment policy,
and the general rules of order.
The massive changes required by the adoption of Acts 10 and 32 in 2011 required a significant redesign
of many policies to incorporate factors formerly contained in collective bargaining agreements. The
County has been operating under interim personnel policies since January 2012; the first permanent
policies have been drafted as part of the General Code and circulated internally for comment. A second
full draft of all fiscal policies has also been prepared, and it is anticipated that both drafts will be sent to
the County Board for consideration yet this year.
MANAGEMENT AND SERVICE DELIVERY
Polk County staff continue to work on developing and refining performance measures as ongoing
components of the development of a system of performance management. Performance management
requires the alignment and clarification of goals and then support towards their achievement and
measurement of results; performance budgeting is one component of this general approach, albeit
arguably the most important. The general concept is to continually evaluate progress towards
objectives set by the County Board through meaningful, timely measures of effectiveness; as the old
saying goes, as there is not enough money to do everything, the Board has to somehow decide what to
do. The optimal approach is to shift funding from ineffective, low priority programs to more effective,
high priority programs.
The 2016 budget is the first to be prepared in a complete, multi‐year program format linked to overall
priorities as set by the County Board capping a multi‐year effort to introduce these concepts. The
overall goals of this process are increased transparency, better information for decision making, and
improvements to long‐term financial stability.
2015 Report on the Condition of Polk County 25
STAFFING AND SUCCESSION PLANNING
The ongoing economic recovery has resulted in a tightening of labor markets and that has in turn has
increased issues with recruitment and retention, especially for night and weekend shifts where the
County provides 24/7 services. Turnover has been both advantageous and disadvantageous for Polk
County, in that many who have left a position have taken another within county government.
Recruitment and retention issues will continue to be problematic for the county for some time,
especially with an aging workforce as discussed below.
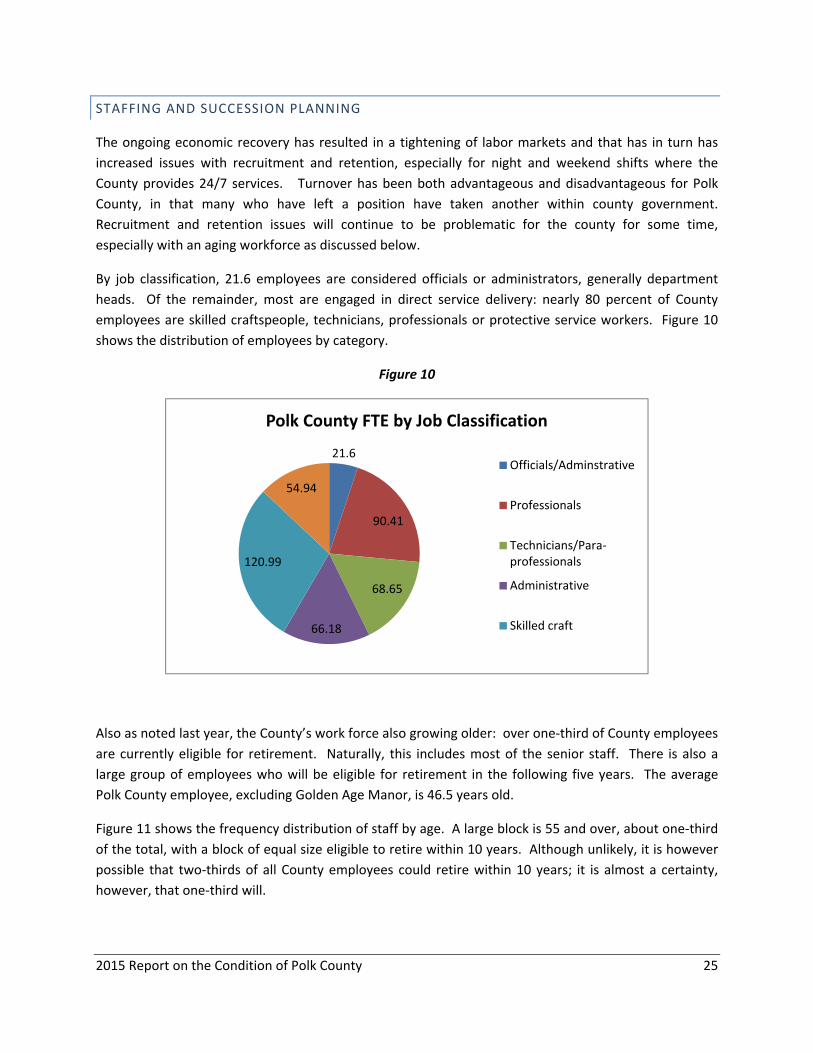
By job classification, 21.6 employees are considered officials or administrators, generally department
heads. Of the remainder, most are engaged in direct service delivery: nearly 80 percent of County
employees are skilled craftspeople, technicians, professionals or protective service workers. Figure 10
shows the distribution of employees by category.
Figure 10
Also as noted last year, the County’s work force also growing older: over one‐third of County employees
are currently eligible for retirement. Naturally, this includes most of the senior staff. There is also a
large group of employees who will be eligible for retirement in the following five years. The average
Polk County employee, excluding Golden Age Manor, is 46.5 years old.
Figure 11 shows the frequency distribution of staff by age. A large block is 55 and over, about one‐third
of the total, with a block of equal size eligible to retire within 10 years. Although unlikely, it is however
possible that two‐thirds of all County employees could retire within 10 years; it is almost a certainty,
however, that one‐third will.
21.6
90.41
68.65
66.18
120.99
54.94
Polk County FTE by Job Classification
Officials/Adminstrative
Professionals
Technicians/Para‐professionals
Administrative
Skilled craft

26 2015 Report on the Condition of Polk County
Figure 11
Age of Polk County Employees
Excludes Golden Age Manor
STRUCTURE AND ORGANIZATION
Government structure is a balance between two conflicting sets of forces: specialization/division of
labor and efficiency/customer service. Division of labor leads to a hierarchical organization, efficiency
means optimal distribution of workload and minimization of overhead costs, and customer service
means simple access to services, not bouncing from one agency to another. Even within specialized
departments there is often further segregation of duties and responsibilities for a number of reasons
including specific skill needs, a natural desire to limit the scope of assignment, and to increase
responsibility – at least on paper – for promotional purposes. This further specialization causes further
complexity for the customer/citizen due to “it’s not my job” type of issues. Finally, a separate
organizational unit imposes additional costs by limiting resource sharing and reducing overall
productivity: each unit must staff for peak demand (or nearly so) meaning there will often be unused
capacity.
Like many Wisconsin counties, Polk County has a very fragmented, specialized organizational structure.
This basic structure developed decades ago, with only modest changes since. Polk County has 23
departments, of which nine have five or fewer employees and another five have between five and ten
employees. Some of this of course results from state law which assigns certain positions to elected
officials, but the remainder evolved along with the county’s responsibility. Departments were created
to implement new programs and assigned to a County Board committee for oversight; this structure has
never been reviewed in the context of a county administrator form of government. A related issue
18‐25
25‐35
35‐45
45‐55
55‐65
65‐over

2015 Report on the Condition of Polk County 27
concerns the lack of clarity in the relationship between standing committees and department heads.
Under the old system of government, departments took direction from and were accountable to
standing committees; under an administrator form of government departments are directly accountable
to the administrator who is directly accountable to the full County Board. However, consequent issues
of authority, responsibility and accountability have yet to be sorted out.
It is becoming increasingly clear that the County cannot long afford to have 23 separate departments for
reasons of accountability, citizen/customer service, and for efficiency. First, it is a challenge for an
administrator to work with this many direct reports – the usual recommendation for span of control is
six to eight subordinates. This, along with the historical semi‐independence of departments and unclear
relationship to committees has served to blur accountability in some cases. Second, as noted such
fragmentation results in inefficiency: although comparisons are difficult, as many as one in five county
employees (outside of Golden Age Manor) is considered administrative support staff. Each department
that interacts with the public must staff for full coverage, limiting the opportunities for resource sharing
and for cross training. Finally, again as noted this fragmentation does not make for seamless
citizen/customer service.
A related problem is fragmentation in financial systems and operations. Each department has its own
budget, financial management and reporting systems and sometimes its own financial information
system. Most departments also handle cash payments, which elsewhere has proven problematic.
Proper financial management requires uniformity in processes, procedures, controls, reporting and
software, and the fewer individuals that are responsible for cash handling and the more the controls the
better.
POLICY DIRECTION
The second major issue relating to Polk County government, and one currently being addressed, is the
need to improve policy direction to help the government evolve to meet an uncertain future. The
fundamental policy challenge is that, as there is not enough money to do everything, you have to decide
what to do. The new challenges facing the County – the ones mentioned above such as an aging
population, increased diversity, population growth as well as those not yet identifies – will require
shifting resources, and doing so requires a plan. Five years ago, I made the distinction between a
government in transition – one knowing where it needs to go and taking active steps to get there – and
one in transformation – uncertain of path, and letting others set that for them, reactive instead of
proactive.
The current strategic planning exercise will provide an opportunity for setting overall priorities from
which departments may derive their own strategic plans. A robust methodology has been developed
that allows for such derivation and linkage to the annual budget, so that the flow of funds can better
follow priorities as set by the County Board.

28 2015 Report on the Condition of Polk County
CONCLUSION
Overall, the condition of the County continues to improve in all three dimensions. The local economy
has recovered substantially from the past recession, although there are still challenges, with
employment surpassing pre‐recession levels. Sales tax collections are at record levels, and the housing
market is improving. Newer data are needed to ascertain the impact of the recovery on the County’s
employers, but given the general economic improvement (and unofficial indicators such as help wanted
ads) it is likely that these sectors are improving as well. Finally, the County’s equalized value has resume
growth this past year.
The County’s financial status is also improved, with final expenditures less than the original budget
amount for the past five years in a row. This, combined with better than expected revenues and a
cancellation of dedicated funds resulted in a substantial increase in the unassigned fund balance and a
greatly improved fiscal picture. Note that much of these resources resulted from one‐time savings or
revenues; to avoid a structural deficit these should not be used to fund ongoing expenditures unless
absolutely essential. However, these funds do provide the County the opportunity to manage its way
through the coming fiscal challenges, a luxury few other local governments have. Attrition can be used
instead of layoffs as needed; a layoff often represents a costly failure to plan.
Financial challenges are substantial as well. Polk County has seen a dramatic drop in equalized value,
although it is likely that the bottom has been reached. Even though levies were not increased, the
County’s tax rate remains high by historical standards and 36th highest among the State’s 72 counties.
The State has effectively capped levies at zero, meaning that there is likely to be little increase in
resources for the near future and therefore increased costs must be covered internally. This will
become more and more difficult to do.
The County’s management condition is also improving. Progress continues in the draft of the General
Code, and County employment has been reduced significantly without major service disruption or loss,
although most redundancies have been eliminated. Succession planning continues, and There are still
three very large challenges, however: the coming wave of retirements, to maintain morale in difficult
financial times, and to gradually replace a Byzantine position classification system with one that is more
fair and linked to the labor market, supporting and reinforcing the County’s excellent public employees.
As has been said in the past, all told Polk County is in a position many other local governments would
envy: an improving economy, solid financial reserves and a foundation of good fiscal practices, an
outstanding work force – and a great place to live.