concurrent rapid identification of bulking and foaming ...ebl.eng.uci.edu/papers/concurrent rapid...
TRANSCRIPT

Concurrent Rapid Identification of Bulking and Foaming Bacteria Pitiporn Asvapathanagul1, Hyeeun Bang2, Hyeyoung Lee2, and Betty H. Olson1* 1Henry Samueli School of Engineering, Department of Civil and Environmental Engineering, University of California, Irvine, Irvine, CA 92697
2College of Health Science, Biomedical Laboratory Science Department, Yonsei University, Wonju-si, Kangwon-do, Korea 220710 *Email: [email protected] ABSTRACT Nocardioforms were genetically identified using PCR-REBA. PCR-REBA was able to identify many bacterial genera in one assay. PCR-REBA was able to determine that foams from different WWTPs contain various types of bacteria such as Gordonia spp., Millisia spp., Skermania spp., Tsukamurella spp., and Microthrix parvicella, while light microscopy cannot differentiate amongst them (except M. parvicella). The G. amarae population was detected before foaming event using PCR-REBA, which gives warning sign of the problematic bacteria. The study G. amarae population using qPCR indicated G. amarae were favorable to temperature at 23-26C and during fall and spring (R2=0.6011). SRT and F/M were not associated with G. amarae population (R2 = 0.008 and 0.085 for SRT and F/M, respectively). NH3 in the influent had inverse relationship to numbers of G. amarae, however R2 was 0.0738. cBOD to nBOD ratio had high R2 = 0.433. G. amarae were able to uptake high carbon to nitrogen ratio substrate, but G. amarae could not utilize these unbalance nutrients completely. As a result, high biosurfactants were produced, and foams were created during optimum temperature. HRT also had strong relationship to G. amarae population (R2= 0.43), which supports this hypothesis that the longer time G. amarae contacted to food, higher G. amarae concentrations were observed. KEYWORDS: Nocardioforms, Bulking, Foaming, Reverse Blot Dot Hybridization Assay, Activated Sludge. INTRODUCTION Viscous brown foam over the surface of aeration tanks and a thick scum layer over the surface of secondary clarifiers observed during foaming event have been explained as consequences of excessive growth of filamentous bacteria in activated sludge process (Pitt and Jenkins 1990; Jenkins et al 2004). Nocardioforms and Microthrix parvicella are commonly observed and claimed as the cause of the foaming incident (Pitt and Jenkins 1990; Kragelund et al 2007; Seviour et al 1994). Both organisms are gram positive and strongly hydrophobic, which support the foam initiating and its stability (Heard et al 2008; Jenkins et al 2004, Nielsen et al 2002). A study found that only filamentous bacteria were not able to create foams, and biosurfactants produced by these organisms were also another key component, which promoted this mechanism (Heard et al 2008). Although, Gordonia amarae, filamentous bacteria, was removed from
WEFTEC 2010
Copyright ©2010 Water Environment Federation. All Rights Reserved.587

foaming sample, the remaining solution still generated foams, but to a lesser degree compared to media with G. amarae suspended (Heard et al 2008). Since the understanding of bulking and foaming bacteria in wastewater treatment plants is still unclear, these upset incidents are difficult to prevent (Soddell and Seviour 1990; Soddell et al 1998). The study of filamentous bacteria began in 1975 when Eikelboom categorized filamentous bacteria observed in wastewater treatment plant based upon their staining characteristics and morphology under light microscopy (Eikelboom, 1975). To quantitate numbers of filamentous bacteria, the numerical filament index, total extended filament length and filament counting were applied (Sezgin et al 1978; Pitt and Jenkins 1990, Eikleboom and Geurkink 2002). All quantifying methods rely on light microscopy, which is time-consuming and inaccuracte. 107µm·L-1 filamentous length was set as a threshold for bulking incident using light microscopy (Palm et al 1980, Jenkin et al 2004, Liao et al 2004). As soon as molecular biology was applied to identify bulking and foaming bacteria, the insufficiency of microscopy was revealed because one morphology type might include different organisms (Kragelund et al 2009). Fluorescence in situ hybridization (FISH) with oligonucleotide rRNA probes was developed to identify filamentous bacteria generically (De Los Reyes et al 2002). Many studies using FISH proposed the threshold values of filamentous bacteria generating the foaming incident. For instance, the threshold for Gordonia spp. is 2×108 μm· mL−1for foam formation and 1×109 μm· mL−1 for foam stability (De Los Reyes et al., 2002) and 2x10⁶ mycolata cell·mL-1 (Davenport et al., 2008). SyberGreen, another molecular method, was also used to quantify Type 021N and M. parvicella in sewage treatment plant samples (Vervaeren et al., 2005; Kaetzke et al 2005; Kumari et al 2009). Although, FISH is the most popular molecular method for bulking and foaming study, Mycolata and Chloroflexi groups need more specific probes to identify bacteria classified in these groups (Kragelund et al 2009). The high specificity and floc visualization are advantages of FISH, but labor intensity (Davenport et al, 2000), high FISH microscope cost limist bulking and foaming studies. Hydrophobicity measurements, surface tension and fatty acid methyl ester (FAME) are parameters used for evaluating consequences of foaming bacteria in the biological treatment processes (Lee et al 2008; Heard et al 2008; Heard et al 2009). PCR-Reverse Blot Dot Hybridization Assay (REBA) is a molecular technique widely applied in medical field and public health study (Wang et al 2008; Zeng et al 2007, Choi et al 2010). The high specificity and capability to analyze several samples against multiple probes in the same assay simultaneously are the outstanding advantages of this technique (Gold, B. 2003). It is cheap, practical and simple method (Choi et al 2010). PCR-Reverse blot dot hybridization is suitable for monitoring bulking and foaming bacteria in WWTPs because these organisms are unpredictable and this technique can identify numerous types of microorganisms at once. The goals of this study are 1) to develop the PCR-REBA nucleic acid primer and probe sets for all foaming bacteria, which includes Nocardia spp., Gordonia spp., Tsukamurella spp., Millisia spp., Skermania spp., Mycobacterium spp., Thiothrix spp. and Microthrix spp. 2) to use PCR-REBA investigating the abundance of these foaming bacteria in mixed liquor and foam samples from domestic and industrial wastewater treatment plants and 3) to monitoring the dynamic of
WEFTEC 2010
Copyright ©2010 Water Environment Federation. All Rights Reserved.588

these microorganisms before, during and after foaming incident at Chiquita wastewater treatment plant. METHODOLOGY Bacterial Strains, Culture Media and Growth Condition Twenty bacterial strains were provided by NRRL Agricultural Research Service (USDA, IL), including Corynebacterium glutamicum (B-2784), Enterobacter cloacae (B-23267), Gordonia amarae (B-8176), Gordonia amarae (B-16281), Gordonia lacunae (B-24551), Gordonia sihwensis (B-24155), Gordonia sputa (B-16936), Gordonia terrae (B-16283), Millisia brevis (B-24424), Microbacterium barkeri (B-24231), Mycobacterium pyrenivorans (B-24349), Nocardia carnea (B-1336), Nocardia flavorosea (B-16176), Nocardia jejuensis (B-24430), Nocardia salmonicolor subsp. aurantiaca (B-16249), Rhodococcus corynebacteroides (former Nocardia corynebacteroides, B-24037), Rhodococcus erythropolis (B-16431), Steptomyces gardneri (B-5616), Tsukamurella sunchonensis (B-24668), Tsukamurella paurometabola (B-16960), All cultures were grown in 0.5% tryptone, 0.5% yeast extract, 0.1% glucose and 0.1% K2HPO4 at pH 7.0 broth and 2% agar at 28oC for 24 h. DNA extracts of Enterococcus faecalis, E. coli O157:H7, Listeria innoca, Mycobacterium marinum, Mycobacterium gordonea, Mycobacterium trivial, Mycobacterium nonchromogenicum, Mycobacterium terrae, Shigella boydii and Yersinis enterocoli were provided by department of biomedical laboratory science, Yonsei University, Korea. Sample Collection All samples were taken using grab sampling method. Samples were collected from twelve treatment plants in US, including Chiquita wastewater treatment plant (CA), Oso wastewater treatment Plant (CA), Irvine Ranch Water District (CA), Corona Wastewater treatment Plant (CA), three plants in Inland Empire Utility (CA), Allens Foods (NC), Norwalk Wastewater Treatment Plant (CT), Prescott Wastewater Treatment Plant (AZ), Mesa Water Reclamation plant (AZ) and South Bayside System Authority (CA). Samples from CA were kept on ice, transported to laboratory and analyzed within 24 h. Samples from other states were kept on ice, over-night shipped to laboratory and DNA extraction was begun immediately after samples were delivered. DNA Extraction of Pure Cultures and Environmental Samples DNA was extracted from pure cultures and environmental samples using the modified bead beating protocol (Yu and Mohn 1999 and Wang et al 2007). The DNA extraction was followed Gedalanga et al 2009. Cell lysis was achieved using cell disruption by FastPrep®-24 (MP BiomedicalsTM, Ohio) with 1.5 g of 0.1 mm glass disruption beads in 1 mL volume of DNA extraction buffer (50 mM Tris–HCl pH 8.0, 5 mM EDTA, and 3% sodium dodecyl sulfate) added to sludge pellet . After first bead-beating, a 600 μL volume of supernatant was transferred to a new 2 mL tube, another 600 μL of DNA extraction buffer was added to the original bead beating tube and the above process repeated. The second 600 μL volume of supernatant was then transferred to another 2 mL tube. The DNA extracts were each washed with a 500 μL volume of phenol/chloroform/isoamyl alcohol (25:24:1) followed by a 500 μL volume of chloroform. After DNA purification, a 600 μL volume of isopropanol was added for DNA precipitation. A 50 µL volume of HPLC grade sterile water was added to dilute DNA. DNA concentration and purity
WEFTEC 2010
Copyright ©2010 Water Environment Federation. All Rights Reserved.589
were measured using DU®7400 spectrophotometer (BECKMAN, USA), HPLC grade sterile water used for dilutions. The samples were stored at -80C until use. Polymerase Chain Reaction (PCR) for DNA Extracts from Pure Culture and Wastewater Samples. Primers used in this study were provided by B&F Diagnostics (Irvine, CA). DNA extracts from each sample were diluted to obtain approximately 10 and 25 ng DNA per PCR reaction for pure culture and environmental samples, respectively. The PCR were used in PCR with a GeneAmp® PCR System 2700 (Applied Biosystems, CA). The PCR program was 5 min holding at 94C, 20s denaturing at 94C and 40s annealing at 53C for each cycle for 35 cycles followed by a 7 min final extension at 72C. Then, samples were cooled to 4C and then stored at -50C. The master mixture for PCR was composed of, 1X Buffer with 20mM Mg2Cl, 200mM dNTP, 2.5U AmpliTaq DNA polymerase, 10 pmole of each primer, and brought to a final volume of 20 µL with HPLC water, to which 5 µL of each sample was added. The qPCR primer set, G-amarae16s-F and R, was run on a Mastercycler® ep realplex (Eppendorf, Hamburg, Germany) using the primer and probe set listing on table 1. The qPCR protocol was 2 min holding at 94oC, 20s denature at 94oC, 40s annealing at 71.7C each cycle for a total 40 cycles. The master mixture for qPCR of G-amarae16s-F and R primers was composed of 4.5mM MgCl2, 1X Buffer, 200mM dNTP, 0.75U AmpliTaq DNA polymerase, 200nM of each forward primer and reverse primer (Sigma-Genosys, Woodlands,TX), 100nM probe (Biosearch Technologies, Novato, CA), 100 ng·uL-1 of BSA and brought to a final volume of 20 µL with HPLC water, to which 5 µL of each sample was added. Table 1 G. amarae primer and probe set for qPCR
Primer Sequence Target gene
Nucleotide position
Tm (C) Reference Remark
G-amarae16s-F 5’-AAAGGCCCCTTCGGGGGTAC-3’ 16s rDNA 53-72* 70.8 Present study qPCR G-amarae16s-R 5’-GGCCCATCCCTGACCGCAAA-3’ 16s rDNA 211-192* 75.3 Present study qPCR
G-amarae-Probe 5’FAM-ACCTGCTCCTGCATGGGGGTGGG-BHQ1 3’ 16s rDNA 160-182* 71.9 Present study qPCR
* AF020331 GenBank accession number referred
Reverse Blot Dot Hybridization Assay 10 µL of PCR product was mixed with 10 µL of denaturation solution. 125 µL of 2X Saline-sodium phosphate-EDTA buffer (SSPE) with 0.1% sodium dodecyl sulfate (SDS) was added into the same tube. The membrane hybridization was done at 50C for 30 min with Hybridization Solution in the heating bath (BS-11, Lab Companion, Korea). Then, the membrane was washed twice in Washing Solution at 62C for 10 min (BS-11, Lab Companion, Korea) before transferred to the roller-blot hybridiser HB-3B (TECHNE, UK). The membrane was incubated with 1:2000 of diluted streptavidin-conjugated alkaline phosphatase at room temperature for 30 min in the roller-blot hybridizer (TECHNE, UK). Then, the membrane was again washed twice with washing solution at room temperature for 5 min each and additional wash with 2X SSPE at room temperature for 1 min twice. In order to develop the result, the membrane was incubated with CDP-star (Amersharm, Uppsala, Sweden) for 4 min and exposed to Hyperfilm (Amersharm, Uppsala, Sweden) film for 15 and 60 min for pure culture and environmental DNA extract, respectively. Probes and membranes were provided by B&FTM Diagnostics (Irvine, CA).
WEFTEC 2010
Copyright ©2010 Water Environment Federation. All Rights Reserved.590

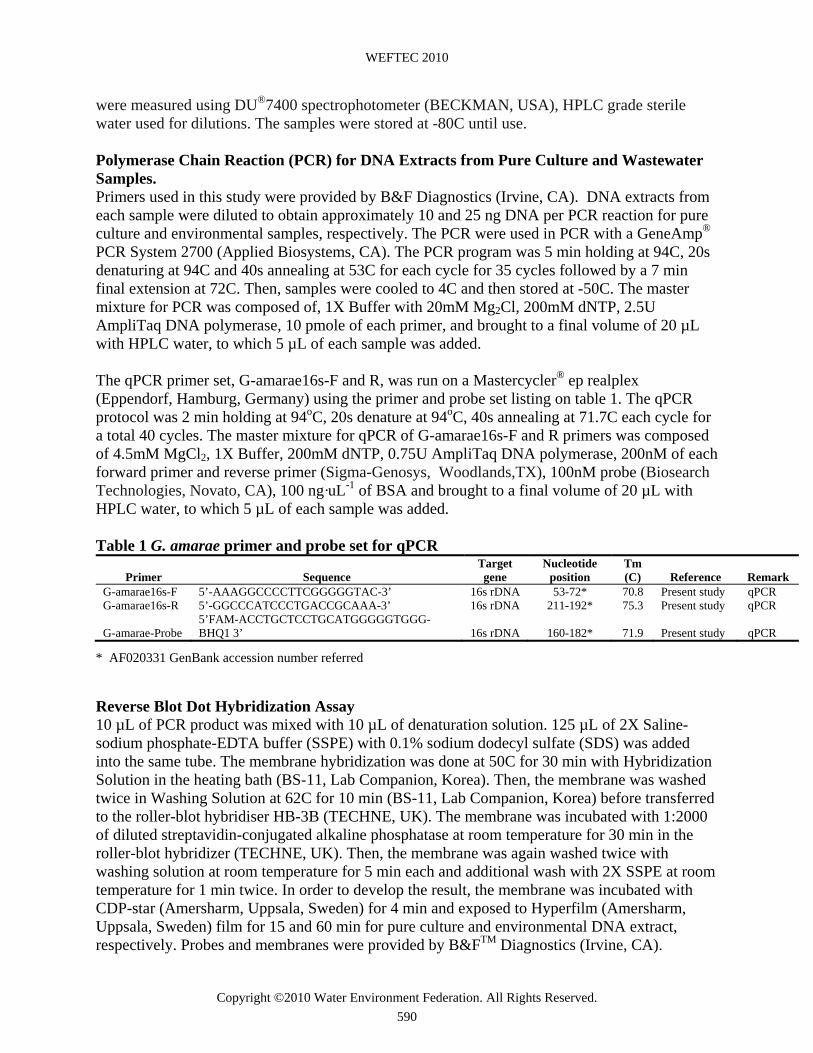
Physical and Chemical Analysis Temperature, DO, and pH data were obtained from Gedalanga et al 2009. The same samples of Gedalanga et al 2009 were used for this study. Temperature, DO and pH were obtained at the using a portable water-sampling device (HACH, Loveland, Colorado). Samples were filtered using Glass Microfiber Filters (Whatman, Piscataway, New Jersey) prior to ammonia, nitrite, and nitrate measurements because particulates inhibited colorimetric measurement. Ammonia concentrations were determined using an ISOTemp ammonia probe (Thermo Fisher Scientific, Waltham, Massachusetts) according to the manufacturer’s instructions. Nitrite and nitrate concentrations were obtained using the HACH NitriVer/NitraVer reagents and methods based on colorimetric measurement. Mixed liquor suspended solids (MLSS), total suspended solids (TSS), solids retention time (SRT), flow, total Biochemical oxygen demand (BOD) nitrogenous BOD (nBOD), and cBOD were obtained from Chiquita laboratory personnel and plant operators. RESULTS Reverse blot dot hybridization assay of Nocardia spp. in wastewater treatment plant samples Nocardioforms identified microscopically in mixed liquor and foam from Chiquita and Oso wastewater treatment plants in Southern California, and viewed to be the cause of solid separation problems have been studied using two PCR primer sets, one, Nocardia genus specific and the other acid-fast bacteria specific, and REBA (B&F DiagnosticsTM, Irvine, CA). Only Nocardia spp. probes were tested on these samples. Validation used pure cultures. All target Nocardia tested developed positive signals (Data not shown). Nocardia spp. in wastewater samples identified by microscopy at the treatment plants appeared below the minimum detection limit or negative using both qPCR (data not shown) or REBA (figure 1). The same environmental samples spiked with Nocardia flavorosea copy numbers determined the sensitivity of the qPCR assay to be 1000 copies per reaction (data not shown), while Figure 1 demonstrates the sensitivity of REBA to be approximately 10-100 copies of Nocardia spp. per reaction using Nocardia genus specific primers. The different intensity of florescence observed in REBA is related to the different primers sets used (Nocardia specific genus primers and acid-fast bacteria primers) which indicated that the general acid fast primers produce weaker signals than Nocardia genus specific primers. Competition amongst organisms sharing the same primer sequence decreased the efficiency of target –primer matches. PCR products that proved to be Nocardia spp. negative from foams samples and mixed liquor samples were sequenced in order to genetically identify Nocardioforms present in the samples. The PCR products show the highest similarity to Gordonia amarae (96% and 99% similarity at Oso and Chiquita WWTP, respectively), and not Nocardia spp. However, Nocardia spp. might present in low concentration < 100 copies/ per reaction, but certainly in very low concentrations compared to other acid-fast bacteria, such as Gordonia or Mycobacterium spp.
WEFTEC 2010
Copyright ©2010 Water Environment Federation. All Rights Reserved.591
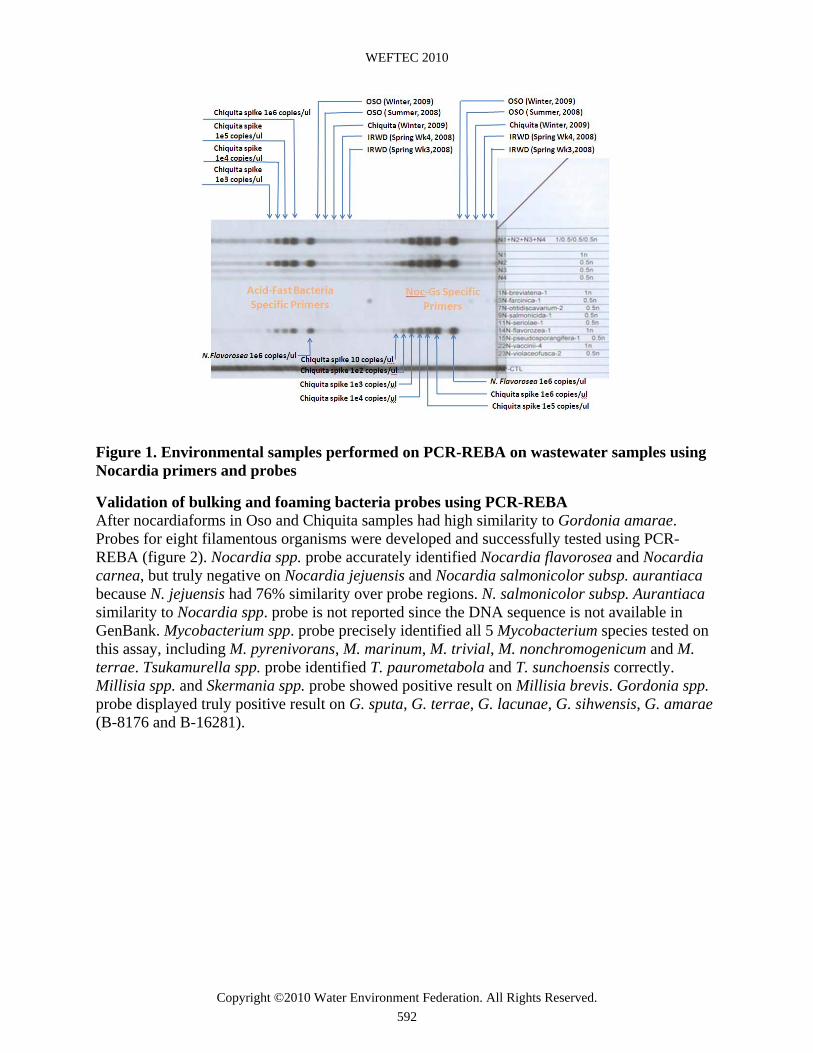
Figure 1. Environmental samples performed on PCR-REBA on wastewater samples using Nocardia primers and probes
Validation of bulking and foaming bacteria probes using PCR-REBA After nocardiaforms in Oso and Chiquita samples had high similarity to Gordonia amarae. Probes for eight filamentous organisms were developed and successfully tested using PCR-REBA (figure 2). Nocardia spp. probe accurately identified Nocardia flavorosea and Nocardia carnea, but truly negative on Nocardia jejuensis and Nocardia salmonicolor subsp. aurantiaca because N. jejuensis had 76% similarity over probe regions. N. salmonicolor subsp. Aurantiaca similarity to Nocardia spp. probe is not reported since the DNA sequence is not available in GenBank. Mycobacterium spp. probe precisely identified all 5 Mycobacterium species tested on this assay, including M. pyrenivorans, M. marinum, M. trivial, M. nonchromogenicum and M. terrae. Tsukamurella spp. probe identified T. paurometabola and T. sunchoensis correctly. Millisia spp. and Skermania spp. probe showed positive result on Millisia brevis. Gordonia spp. probe displayed truly positive result on G. sputa, G. terrae, G. lacunae, G. sihwensis, G. amarae (B-8176 and B-16281).
WEFTEC 2010
Copyright ©2010 Water Environment Federation. All Rights Reserved.592
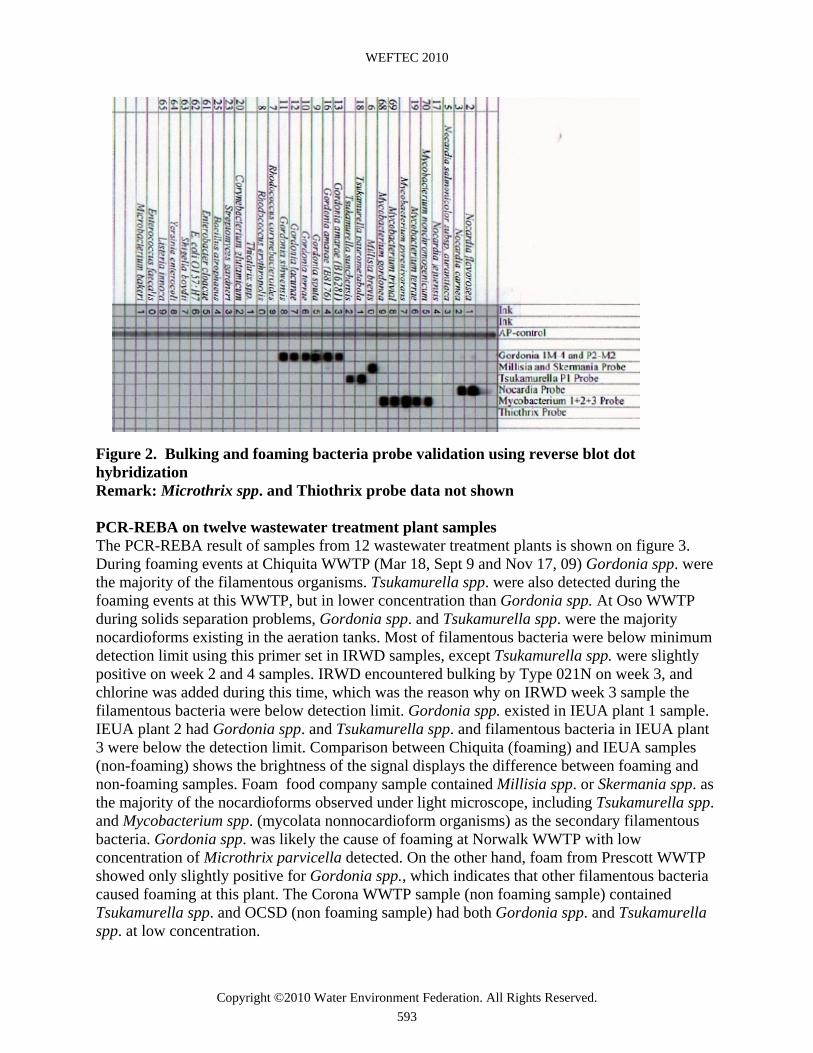
Figure 2. Bulking and foaming bacteria probe validation using reverse blot dot hybridization Remark: Microthrix spp. and Thiothrix probe data not shown PCR-REBA on twelve wastewater treatment plant samples The PCR-REBA result of samples from 12 wastewater treatment plants is shown on figure 3. During foaming events at Chiquita WWTP (Mar 18, Sept 9 and Nov 17, 09) Gordonia spp. were the majority of the filamentous organisms. Tsukamurella spp. were also detected during the foaming events at this WWTP, but in lower concentration than Gordonia spp. At Oso WWTP during solids separation problems, Gordonia spp. and Tsukamurella spp. were the majority nocardioforms existing in the aeration tanks. Most of filamentous bacteria were below minimum detection limit using this primer set in IRWD samples, except Tsukamurella spp. were slightly positive on week 2 and 4 samples. IRWD encountered bulking by Type 021N on week 3, and chlorine was added during this time, which was the reason why on IRWD week 3 sample the filamentous bacteria were below detection limit. Gordonia spp. existed in IEUA plant 1 sample. IEUA plant 2 had Gordonia spp. and Tsukamurella spp. and filamentous bacteria in IEUA plant 3 were below the detection limit. Comparison between Chiquita (foaming) and IEUA samples (non-foaming) shows the brightness of the signal displays the difference between foaming and non-foaming samples. Foam food company sample contained Millisia spp. or Skermania spp. as the majority of the nocardioforms observed under light microscope, including Tsukamurella spp. and Mycobacterium spp. (mycolata nonnocardioform organisms) as the secondary filamentous bacteria. Gordonia spp. was likely the cause of foaming at Norwalk WWTP with low concentration of Microthrix parvicella detected. On the other hand, foam from Prescott WWTP showed only slightly positive for Gordonia spp., which indicates that other filamentous bacteria caused foaming at this plant. The Corona WWTP sample (non foaming sample) contained Tsukamurella spp. and OCSD (non foaming sample) had both Gordonia spp. and Tsukamurella spp. at low concentration.
WEFTEC 2010
Copyright ©2010 Water Environment Federation. All Rights Reserved.593
PCR-REBA indicated there were more than one specific bacterium causing solids separation problems. In order to understand the real environmental factors that promote or suppress their growth, it is crucial to apply the capable detection procedure to access the filamentous bacteria population, which PCR-REBA was proofed to have many advantages compared to the existing technology such as multi organisms detection in one assay, high accuracy and easy training.
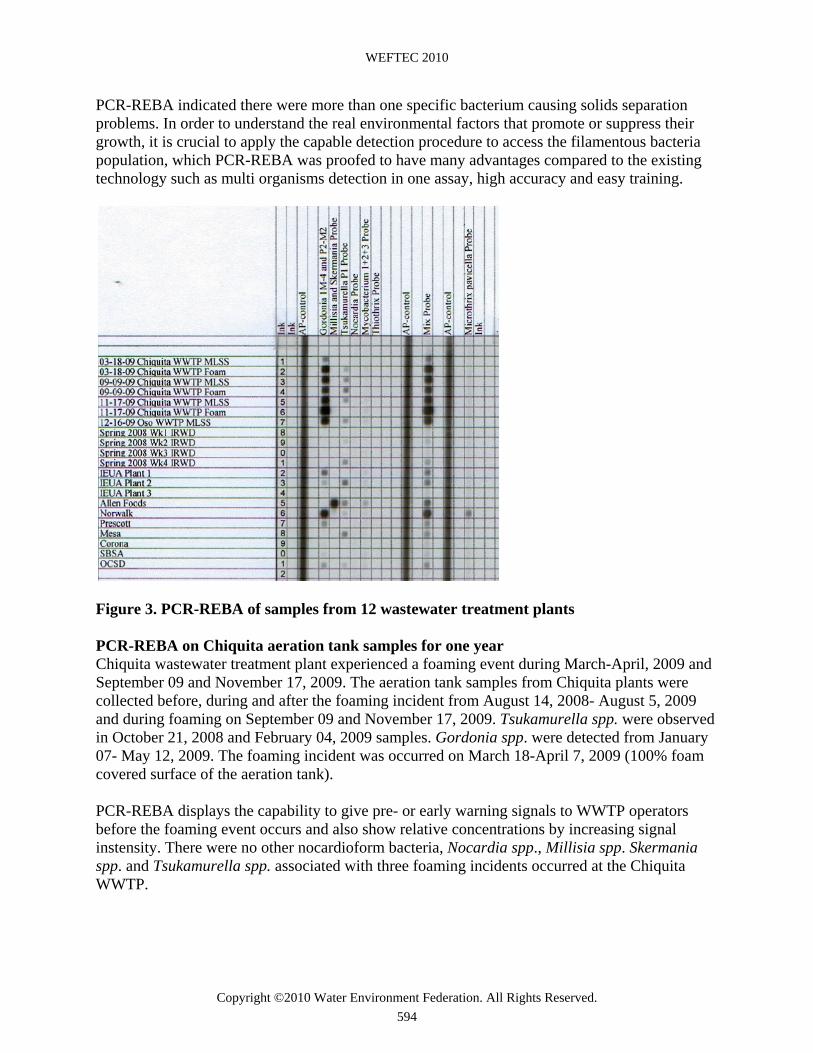
Figure 3. PCR-REBA of samples from 12 wastewater treatment plants PCR-REBA on Chiquita aeration tank samples for one year Chiquita wastewater treatment plant experienced a foaming event during March-April, 2009 and September 09 and November 17, 2009. The aeration tank samples from Chiquita plants were collected before, during and after the foaming incident from August 14, 2008- August 5, 2009 and during foaming on September 09 and November 17, 2009. Tsukamurella spp. were observed in October 21, 2008 and February 04, 2009 samples. Gordonia spp. were detected from January 07- May 12, 2009. The foaming incident was occurred on March 18-April 7, 2009 (100% foam covered surface of the aeration tank). PCR-REBA displays the capability to give pre- or early warning signals to WWTP operators before the foaming event occurs and also show relative concentrations by increasing signal instensity. There were no other nocardioform bacteria, Nocardia spp., Millisia spp. Skermania spp. and Tsukamurella spp. associated with three foaming incidents occurred at the Chiquita WWTP.
WEFTEC 2010
Copyright ©2010 Water Environment Federation. All Rights Reserved.594
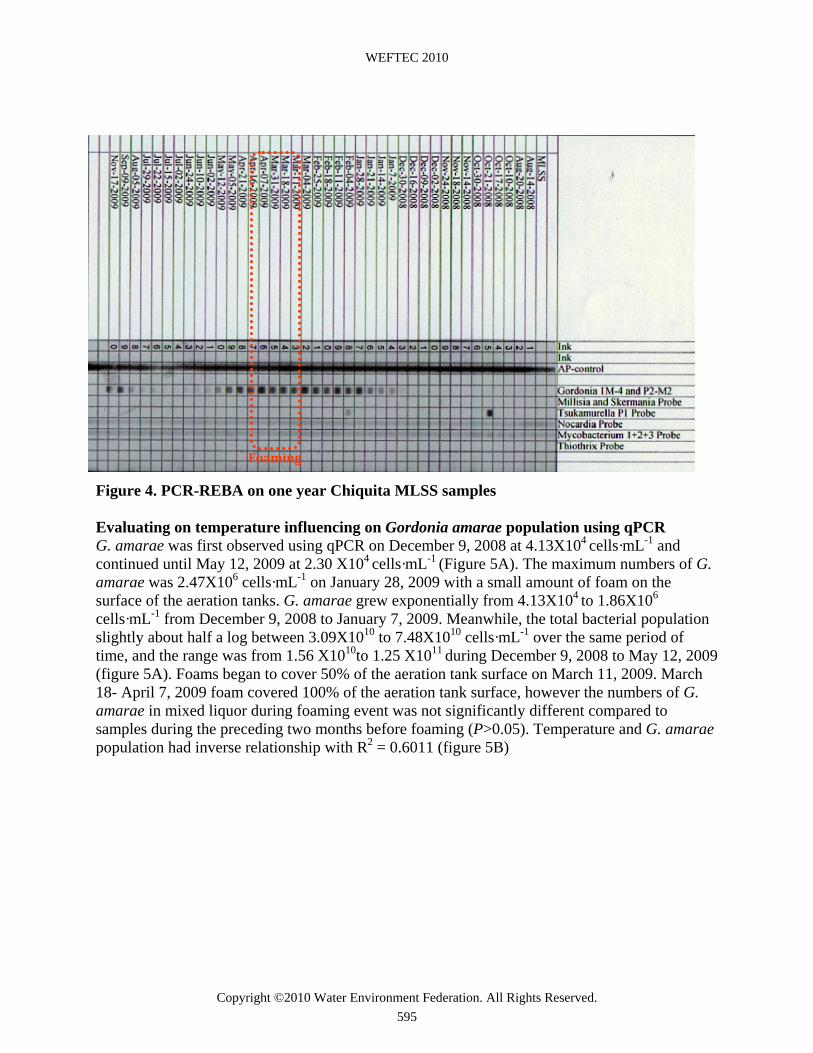
Figure 4. PCR-REBA on one year Chiquita MLSS samples Evaluating on temperature influencing on Gordonia amarae population using qPCR G. amarae was first observed using qPCR on December 9, 2008 at 4.13X10⁴ cells·mL-1 and continued until May 12, 2009 at 2.30 X10⁴ cells·mL-1 (Figure 5A). The maximum numbers of G. amarae was 2.47X10⁶ cells·mL-1 on January 28, 2009 with a small amount of foam on the surface of the aeration tanks. G. amarae grew exponentially from 4.13X10⁴ to 1.86X10⁶ cells·mL-1 from December 9, 2008 to January 7, 2009. Meanwhile, the total bacterial population slightly about half a log between 3.09X10¹⁰ to 7.48X10¹⁰ cells·mL-1 over the same period of time, and the range was from 1.56 X10¹⁰to 1.25 X10¹¹ during December 9, 2008 to May 12, 2009 (figure 5A). Foams began to cover 50% of the aeration tank surface on March 11, 2009. March 18- April 7, 2009 foam covered 100% of the aeration tank surface, however the numbers of G. amarae in mixed liquor during foaming event was not significantly different compared to samples during the preceding two months before foaming (P>0.05). Temperature and G. amarae population had inverse relationship with R2 = 0.6011 (figure 5B)
Foaming
WEFTEC 2010
Copyright ©2010 Water Environment Federation. All Rights Reserved.595

Figure 5 A) Relationship between numbers of G. amarae (cells·mL-1), total bacteria (cells·mL-1), and wastewater temperature in the aeration tank (C), 5B) Linear relationship between G. amarae population (cells·mL-1) and temperature (C) Evaluation of other physical and chemical parameters influencing to G. amarae population Solid retention time (SRT) was increased at the beginning of the exponential phase of G. amarae (figure 6A), which possibly promoted the growth of G. amarae. However, after January 7, 2009 SRT was maintained 4.0 ± 0.4 days, the number of G. amarae did not corresponded with the change of SRT. F/M was 0.53 at the beginning of the exponential phase of G. amarae however,
23.0
24.0
25.0
26.0
27.0
28.0
29.0
30.0
31.0
32.0
33.0
1.0E+00
1.0E+01
1.0E+02
1.0E+03
1.0E+04
1.0E+05
1.0E+06
1.0E+07
1.0E+08
1.0E+09
1.0E+10
1.0E+11
1.0E+12
7/21/08 9/9/08 10/29/08 12/18/08 2/6/09 3/28/09 5/17/09 7/6/09 8/25/09
G.amarae
Total Bacteria
Temperature
Wastew
ater temperature, C
Num
ber o
f bacteria (cells∙m
L‐1 )
FoamingA
y = ‐0.553ln(x) + 31.59R² = 0.6011
23.0
23.5
24.0
24.5
25.0
25.5
26.0
26.5
3.50E+04 3.50E+05 3.50E+06
Tempe
rature ,C
Number of Gordonia amarae ,cells∙mL‐1
B
below detection limit
WEFTEC 2010
Copyright ©2010 Water Environment Federation. All Rights Reserved.596
Dec 30, 2008-May 12, 2009. R2 of numbers of G. amarae and F/M was 0.085. The relationship between hydraulic retention time (HRT) and G. amarae population had R2 = 0.43. Ammonia influent was decreased during the increasing of G. amarae population, but did not have a significant relationship with organism concentration, but the ratio of cBOD to nBOD was had R2=0.433. DISCUSSION PCR-REBA displayed a useful result expressing filamentous bacteria population in the WWTPs, especially nocardioform group. Microorganisms in nocardioform group are difficult to identify genetically under light microscope. Nocardioforms observed by microscope might be Nocardia spp., Rhodococcus spp., Gordonia spp., Skermania spp., Millisia spp. or Tsukamurella spp., which have been named together as nocardioforms. High capability of PCR-REBA can be seen from nocardioform species identifying (figure 2). Different WWTP samples contained diverse kinds of nocardioforms (figure 3). In order to understand the factors that affect their growth, the specific types of the problematic organisms have to be identified. Normally, the nocardioform population in Chiquita WWTP was below the detection limit (before Jan 07, 2009, figure 4). Gordonia spp. were first detected on Jan 07, 2009, which was two months before foaming incident occurred. The PCR-REBA can give warning to WWTP operators before bulking or foaming event are occurred (figure 4). Temperature had the strongest relationship to the G. amarae population compared to other parameters, other studies showed that temperature also had a strong affect on other bacteria at Chiquita in activated sludge (Huang et al 2010). Additionally, temperatures between 23-26C were favorable for G. amarae. G. amarae were frequently detected during fall and spring season when the temperature changes rapidly, which suggests the importance of temperature as a key factor promoting its growth, but since this is a partially nitrifying plant oxygen is also limiting most of the year. So the impact could be a combination of the two variables. Numbers of G. amarae in the MLSS samples before and during foaming were not significantly different. The reason might be G. amarae can exist in the bulk liquid at a certain concentration and when numbers of G. amarae are higher than this threshold, G. amarae became associated with the foam and stayed at the interface between the air-liquid phase. G. amarae population was increased when NH3 in the influent was decreased however, R2 was low. The NH3 concentration might be varied with other parameters, so cBOD/nBOD. Numbers of G. amarae were increased when cBOD to nBOD ratio was increased. The relationship between these two aspects and surfactant production is also of interest. The strong relationship between HRT and G. amarae during optimum temperature and high cBOD to nBOD ratio was also the evidence that the longer time G. amarae contacted to these nutrients, the more G. amarae population increased. CONCLUSIONS Nocardioforms were genetically identified using PCR-REBA. PCR-REBA is able to identify many bacterial genera in one assay. PCR-REBA was able to express that foams from different WWTPs contained various types of bacteria such as Gordonia spp., Millisia spp., Skermania spp., Tsukamurella spp., and Microthrix parvicella, which light microscopy could not
WEFTEC 2010
Copyright ©2010 Water Environment Federation. All Rights Reserved.597

differentiate. G. amarae population was detected before foaming events using PCR-REBA, which gave a warning sign of the problematic bacteria. The study G. amarae population using qPCR indicated G. amarae were favorable to temperature at 23-26o C and during fall and spring (R2=0.6011). SRT and F/M were not associated with G. amarae population (R2 = 0.008 and 0.085 for SRT and F/M, respectively). NH3 in influent had inverse and nonsignificant relationship to numbers of G. amarae. cBOD to nBOD ratio had high R2 = 0.433. G. amarae were able to uptake high carbon to nitrogen ratio substrate, but G. amarae could not utilize these unbalanced nutrients completely. As a result, high biosurfactants could be produced, and foams did result during optimum temperature. HRT during G. amarae observed also had strong relationship to G. amarae population (R2= 0.43), which supports this hypothesis that the longer time G. amarae contacted to food, the higher G. amarae were observed. ACKNOWLEDGMENTS We would like to acknowledge the Santa Margarita Water District, Orange County Sanitation District, Inland Empire Utility, Irvine Ranch Water District, South Bayside System Authority, Mesa WWTP, Corona WWTP, and Dr. Michael Richards for providing wastewater and foam samples. REFERENCES Choi, Y.; Lee, G.; Bang, H.; Kim, J.B.; Lee, H. (2010) Detection of Waterborne Pathogens by
PCR-Reverse Blot Hybridization. J. of Experimental and Biomedical Sciences, 16 (1), 10-18.
Davenport, R.J.; Pickering, R.L.; Goodhead, A.K.; Curtis, T.P. (2008) A Universal Threshold Concept for Hydrophobic Mycolata in Activated Sludge Foaming. Water Res., 42 (13), 3446-3454.
Davenport, R. J.; Curtis, T. P.; Goodfellow, M.; Stainsby, F. M.; Bingley, M. (2000) Quantitative Use of Fluorescent In Situ Hybridization to Examine Relationships between Mycolic Acid-Containing Actinomycetes and Foaming in Activated Sludge Plants. Appl. Environ. Microbiol., 66 (3), 1158-1166.
De Los Reyes, F.L.; Raskin, L. (2002) Role of Filamentous Microorganisms in Activated Sludge Foaming: Relationship of Mycolata Levels to Foaming Initiation and Stability. Water Res., 36 (2), 445-459.
Eikelboom D.H. (1975) Filamentous Bacteria Observed in Activated Sludge. Water Res., 9 (4), 365-388.
Eikelboom, D.H.; Geurkink, B. (2002) Filamentous Micro-Organisms Observed in Industrial Activated Sludge Plants. Water Sci. Technol., 46 (1-2), 535-542.
Gedalanga, P.B.; Bae, H.K.; Asvapathanagul, P.; Boone, A.; Olson, B.H. (2009) Molecular Analysis of Ammonia Oxidizing Bacteria As an Indicator of Treatment Processes at a Municipal Wastewater Treatment Plant, WEFTEC, 4761-4773.
Gold, B (2003) Origin and Utility of the Reverse Dot-Blot. Expert Rev. Mol. Diagn., 3 (2):143–152.
WEFTEC 2010
Copyright ©2010 Water Environment Federation. All Rights Reserved.598

Heard, J.; Harvey, E.; Johnson B.B.; Wells, J.D.; Angove, M.J. (2008) The Effect of Filamentous Bacteria on Foam Production and Stability, Colloids and Surfaces, 63 (1), 21-26.
Heard, J.; Johnson, B.B.; Wells, J.D.; Angove, M.J. (2009) Measuring ‘Hydrophobicity’ of Filamentous Bacteria Found in Wastewater Treatment Plants. Colloids and Surfaces B: Biointerfaces, 72 (2), 289–294.
Huang, Z.; Gedalanga, P.B.; Asvapathanagul, P., Olson, B.H. (2010) Influence of Physicochemical and Operational Parameters on Nitrobacter and Nitrospira Communities in an Aerobic Activated Sludge Bioreactor. Water Res., IN PRESS. Jenkins, D.; Richard, M.G.; Daigger, G.T. (2004) Manual on the Causes and Control of
Activated Sludge Bulking, Foaming, and Other Solids Separation Problems. 3rd ed. Lewis Publishers; Boca Raton, Florida.
Kaetzke, A.;, Jentzsch, D.; Eschrich, K.; (2005) Quantification of Microthrix parvicella in Activated Sludge Bacterial Communities by Real-Time PCR. Appl. Microbiol., 40 (3), 207-211.
Kragelund, C.; Muller, E.; Schade, M.; Nguyen, H.T.T.; Lemmer, H.; Seviour, R.; Nielsen, P.H. (2009) for Biological Fish Handbook Wastewater Treatment: Identification and quantification of microorganisms in activated sludge and biofilms by FISH. Edited by Per Halkjaer Nielsen, Holger Daims and Hilde Lemmer. IWA Publishing, London.
Kragelund, C.; Remesova, Z.; Nielsen, J.L.; Thomsen, T.R.; Eales, K.; Seviour, R.; Wanner, J.; Nielsen, H. (2007) Ecophysiology of Mycolic Acid-Containing Actinobacteria (Mycolata) in Activated Sludge Foams. FEMS Microbiol. Ecol., 61 (1), 174-184.
Kumari, S.K.S.; Marrengane, Z.; Bux, F. (2009) Application of Quantitative RT-PCR to Determine the Distribution of Microthrix parvicella in Full-Scale Activated Sludge Treatment Systems. Appl. Microbiol. Biotechnol., 83 (6), 1135–1141.
Liao, J.Y.; Lou, I.C.; de los Reyes, F.L. (2004) Relationship of Species Specific Filament Levels to Filamentous Bulking in Activated Sludge. Appl. Environ. Microbiol., 70 (4), 2420–2428.
Lee, J. W.; Cha, D. K.; Kim, I.; Son, A.; Ahn, K. H. (2008) Fatty Acid Methyl Ester (FAME) Technology for Monitoring Biological Foaming in Activated Sludge: Full Scale Plant Verification, Environmental Technology, 29 (2), 199-206.
Nielsen, P.H.; Roslev, P.; Dueholm, T.E.; Nielsen, J.L. (2002) Microthrix parvicella, a Specialized Lipid Consumer in Anaerobic-Aerobic Activated Sludge Plants, Water Sci. Technol., 46 (1-2), 73-80.
Palm, J.C.; Jenkins, D.; Parker D.S. (1980) Relationship between Oraganic Loading, Dissolved Oxygen Concentration and Sludge Settleability in the Completely-Mixed Activated Sludge Process. J. Water Pollut. Control Fed., 52 (10), 2484-2506.
Pitt, P.; Jenkins, D. (1990) Causes and Control of Nocardia in activated sludge. Research Journal of the Water Pollution Control Federation, 62 (2), 143-150.
Seviour, E.M.; Williams, C.; DeGrey, B., Seviour, R.J., Lindrea, K.C. (1994) Studies on Filamentous Bacteria from Australian Activated Sludge Plants. Water Res., 28 (11), 2335-2342.
Sezgin, M.; Jenkins, D.; Parker, D.S. (1978) A Unified Theory of Activated Sludge Bulking. J. Water Pollut. Control Fed., 50 (2), 362-381.
Soddell, J.A.; Seviour, R.J. (1990) Microbiology of Foaming in Activated Sludge Plants. J. of Appl. Bacteriol., 69 (2), 145-176.
WEFTEC 2010
Copyright ©2010 Water Environment Federation. All Rights Reserved.599

Soddell, J.A.; Seviour, R.J.; Blackall, L.L.; Hugenholtz, P. (1998) New Foam-Forming Nocardioforms Found in Activated Sludge. Water Sci. Technol., 37 (4-5), 495-502.
Vervaeren, H.; Wilde, K.D.; Matthys, J.; Boon, N.; Raskin, L.; Verstraete, W. (2005) Quantification of an Eikelboom type 021N Bulking Event with Fluorescence In Situ Hybridization and Real-Time PCR. Appl. Microbiol. Biotechnol., 68 (5), 695-704.
Wang, M.Y.; Olson, B.H.; Chang, J.S. (2007) Improving PCR and qPCR Detection of Hydrogenase A (hydA) Associated with Clostridia in Pure Cultures and Environmental Sludges using Bovine Serum Albumin. Appl. Microbiol. Biotechnol., 77 (3), 645–656.
Wang, Y.; Kong, F.; Yang, Y.; Gilbert, G. L. (2008) A multiplex PCR-Based Reverse Line Blot Hybridization (mPCR/RLB) Assay for Detection of Bacterial Respiratory Pathogens in Children with Pneumonia. Pediatr. Pulmonol., 43 (2), 150–159.
Yu, Z.; Mohn, W.W. (1999) Killing Two Birds with One Stone: Simultaneous Extraction of DNA and RNA from Activated Sludge Biomass. Canadian J. of Microbiol., 45 (3), 269–272.
Zeng, X.; Kong, F.; Halliday, C.; Chen, S.; Lau, A.; Playford, G.; Sorrell, T.C. (2007) Reverse Line Blot Hybridization Assay for Identification of Medically Important Fungi from Culture and Clinical Specimens. J. Clin. Microbiol., 45, 2872–2880.
WEFTEC 2010
Copyright ©2010 Water Environment Federation. All Rights Reserved.600