concrete bridge technology camber variability...
TRANSCRIPT

38 | ASPIRE, Spring 2015
CONCRETE BRIDGE TECHNOLOGY
A negative camber (downward deflection or sag) while the bridge is in service may cause
concern for inspectors and the public and, if excessive, may have structural and functional
impacts as well. A number of state highway authorities (SHA) have specified that the final
long-term camber due to all loads, except live load, must be positive, that is, upward.
Precast, prestressed concrete girders
experience camber (upward deflection)
when the prestressing strands are
detensioned and the prestressing force is
transferred from the casting bed to the
concrete member. When the girder is stored
in the yard of the precast manufacturer,
its camber continues to change with time,
influenced by the ambient air conditions,
and even the orientation of the girder as it
is exposed to the sun. When the girder is
erected on its seats at the bridge site and
just before the deck is placed, its camber
at that time affects the haunch (build up)
concrete required to ensure that the top
of deck surface meets the roadway profile
requirements.
Initial camber after detensioning is used to
indirectly check the quality of the product,
for example, the level of prestress and other
production issues. Camber at the time of
girder shipping is sometimes required to be
checked for contractual purposes. Camber
just before deck placement and the elastic
deflection due to deck weight are used to
determine the elevation of the formwork
supports at the edges of the top flange.
Accurate measurements and calculations at
this stage result in minimizing grinding of
the deck to bring it to the required profile.
Camber Variability in Prestressed Concrete Bridge Beams by Dr. Maher Tadros, eConstruct
Beams cast with extra camber in storage yard at Concrete Technology Corporation; camber shown is exceptionally large for illustration purposes. Photo:
Concrete Technology Corporation.
ba c
ba c
L
Strand group debond length plus half transfer length
Profile of a group of strands (for one point harping, c=0)
L/2
Curvature diagram (for straight strand profile, curvature is constant)
φ1
φ2
Figure 1. Beam elevation showing general profile for a group of pretensioned strands. Figures:
eConstruct.
ASPIRE, Spring 2015 | 39
At best, camber prediction can have ±25% variability, but more realistically it can have
±50% variability. The prediction is impacted by things that are known within a narrow
band of variability such as the cross-section dimensions, amount of prestress, and span
length, which are considered here to be deterministic variables. It is also impacted by
random variables, outside of the control of the designer at time of design, such as source of
aggregates, relative humidity and temperature of the ambient air, method of curing, method
of detensioning, conditions of storage, and time elapsed between girder production and deck
placement.
Calculation of Initial CamberReference 1 gives a survey of the history of camber prediction and proposes a method
that can be programmed in a spreadsheet. Only two equations are required.
Equation 1 is used to calculate initial camber due to prestress using a general profile of
a group of pretensioned strands (Fig. 1). The equation is valid for straight and draped
strands and for cases where debonding at the ends is utilized. The equation may be
applied to the different “types” of strand groups, and then superposition used to combine
the individual results to determine the full effect.
)36623(6
)2)((2
2221 cbcacbabcbacbip ++++++++=φ φ
Eq. 1
The distances a, b, and c are defined in Fig. 1. The curvatures φ1 and φ
2 are equal to P/
EI for Sections 1 and 2 at the location at which prestress is effective at the end of the
girder (dimension a) and at midspan, respectively. The values of P, e, E, and I are the
prestress force, its eccentricity, the concrete modulus of elasticity, and the cross section
moment of inertia, respectively, at the section considered for the curvature calculation.
The starting section location (at dimension a from the end of the girder) is affected by
length of debonding plus an allowance for transfer length.
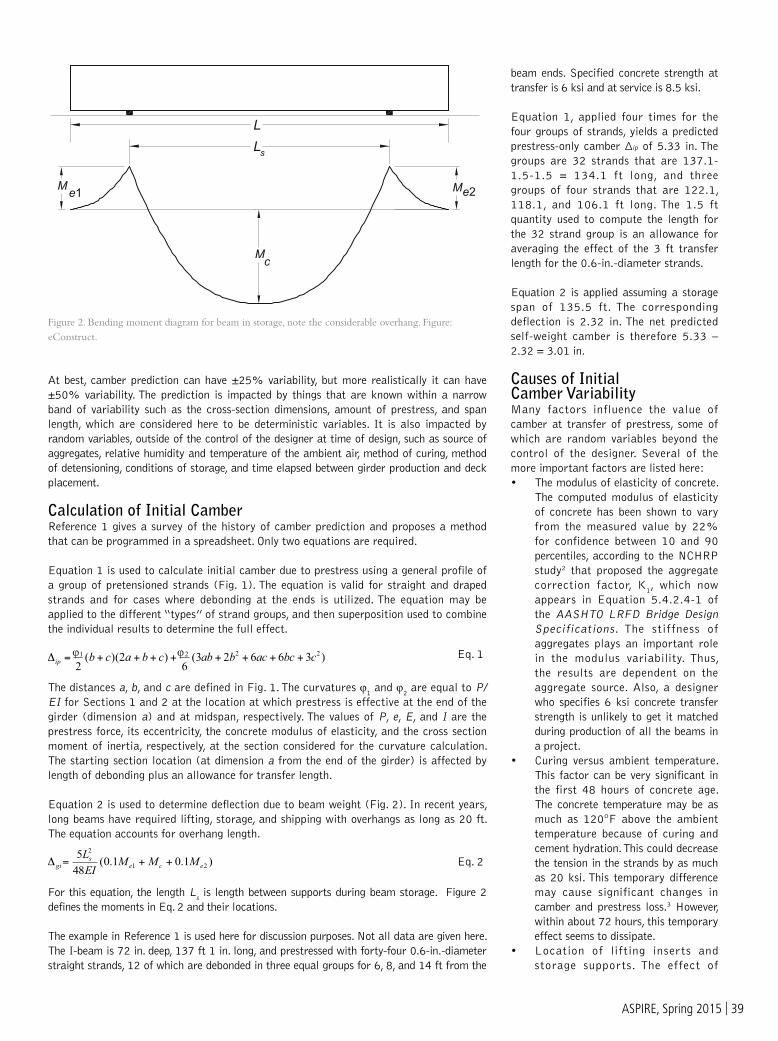
Equation 2 is used to determine deflection due to beam weight (Fig. 2). In recent years,
long beams have required lifting, storage, and shipping with overhangs as long as 20 ft.
The equation accounts for overhang length.
)1.01.0(48
521
2
eces
gi MMMEI
L++=
Eq. 2
For this equation, the length Ls is length between supports during beam storage. Figure 2
defines the moments in Eq. 2 and their locations.
The example in Reference 1 is used here for discussion purposes. Not all data are given here.
The I-beam is 72 in. deep, 137 ft 1 in. long, and prestressed with forty-four 0.6-in.-diameter
straight strands, 12 of which are debonded in three equal groups for 6, 8, and 14 ft from the
beam ends. Specified concrete strength at
transfer is 6 ksi and at service is 8.5 ksi.
Equation 1, applied four times for the
four groups of strands, yields a predicted
prestress-only camber Δip of 5.33 in. The
groups are 32 strands that are 137.1-
1.5-1.5 = 134.1 ft long, and three
groups of four strands that are 122.1,
118.1, and 106.1 ft long. The 1.5 ft
quantity used to compute the length for
the 32 strand group is an allowance for
averaging the effect of the 3 ft transfer
length for the 0.6-in.-diameter strands.
Equation 2 is applied assuming a storage
span of 135.5 ft. The corresponding
deflection is 2.32 in. The net predicted
self-weight camber is therefore 5.33 –
2.32 = 3.01 in.
Causes of Initial Camber VariabilityMany factors influence the value of
camber at transfer of prestress, some of
which are random variables beyond the
control of the designer. Several of the
more important factors are listed here:
• The modulus of elasticity of concrete.
The computed modulus of elasticity
of concrete has been shown to vary
from the measured value by 22%
for confidence between 10 and 90
percentiles, according to the NCHRP
study2 that proposed the aggregate
correction factor, K1, which now
appears in Equation 5.4.2.4-1 of
the AASHTO LRFD Bridge Design
Specifications. The stiffness of
aggregates plays an important role
in the modulus variability. Thus,
the results are dependent on the
aggregate source. Also, a designer
who specifies 6 ksi concrete transfer
strength is unlikely to get it matched
during production of all the beams in
a project.
• Curing versus ambient temperature.
This factor can be very significant in
the first 48 hours of concrete age.
The concrete temperature may be as
much as 120°F above the ambient
temperature because of curing and
cement hydration. This could decrease
the tension in the strands by as much
as 20 ksi. This temporary difference
may cause significant changes in
camber and prestress loss.3 However,
within about 72 hours, this temporary
effect seems to dissipate.
• Location of lifting inserts and
storage supports. The effect of
Figure 2. Bending moment diagram for beam in storage, note the considerable overhang. Figure:
eConstruct.
c
e2e1M
M
M
Ls
L

40 | ASPIRE, Spring 2015
variation in support locations is
illustrated using the example girder. If
it is lifted and stored on supports that
are 10 ft from the ends, the camber
in the example used in the previous
section changes by about 9%.
• If prestress is higher than the
theoretical value by 5% and self-
weight is lower by 5%, both of which
are quite plausible, the net camber in
the example in the previous section
would increase by 13%.
Initial Camber Tolerance LimitsBecause of the random variability
of the influencing parameters, it is
difficult to accurately predict initial
camber immediately af ter s trand
detensioning. If the girder concrete
is a l lowed to cool for 72 hours ,
predic t ion accuracy may be mos t
optimistically within ±25%. Accurate
formulas, such as Eq. 1 and 2, and
values of the modulus of elasticity
r e f l e c t i n g a gg r e ga t e t y p e a n d
concrete strength would be assumed
to be used. However, the designer is
not likely to know producer-specific
materials, environmental conditions,
and production practices in advance.
Figure 3. Initial-camber data collected by the PCI Fast Team from nine sites in eight states. The red lines show proposed ±50% ≥ ½ in. tolerance. Figure: PCI
Fast Team with modification by eConstruct.
The PCI Tolerance Committee has been debating in recent years how to update the
tolerance limits for camber in bridge beams that are given in PCI MNL-1164, in
order to accommodate recent changes in technology. Concrete strengths in the 8 to
12 ksi range, 0.6-in.-diameter strands, and more efficient I-girder shapes have been
in common use, resulting in pretensioned products as long as 200 ft.
A Fast Team was formed by the PCI Committee on Bridges and the Bridge Producers
Committee to recommend adjustments to the current MNL-116 tolerances to
account for the recent changes in practice. Their recommendation is shown in Fig. 3.
It essentially sets the tolerance limits on camber variance from the predicted value
at 0.1% of the product length with an upper limit of 1½ in. and no lower limit. Even
with this proposed removal of the current upper limit of 1 in., the Fast Team report
indicated that the percentage of out-of-tolerance girders longer than 80 ft was still
12%, compared to the current 37% level (using the 1 in. upper limit). Accordingly,
the Fast Team stated, “out of tolerance camber should not be a sole source for
rejection.” While this sentence is well intentioned and justified, it seems to be in
conflict with the concept of tolerance enforcement that is expected in a tolerance
manual.
Proposed Initial Camber ToleranceBecause camber is an important quantity that can be easily measured, camber
tolerance limits are expected to continue to be required by most owners. Based
on the author’s experience with this topic for nearly 40 years, and on recent
discussions by PCI committees, producer groups, and state highway agencies,
including Colorado, Washington, Iowa, and Pennsylvania, the following
recommendations are proposed for initial camber of prestressed beams, which differ
from the recommendations of the PCI Fast Team:
• Initial camber should be measured 72 to 96 hours after beam concrete
placement and after the beam has been set on storage supports. This would
allow for the internal concrete temperature to reach equilibrium with
the ambient air and for the storage span to be set. Measurements should
1⁄2
-1⁄2

ASPIRE, Spring 2015 | 41
placement. Camber does not always grow
between initial storage conditions and
deck placement.
This observation has recently been
reported for relatively long beams. The
creep multiplier for prestress effects
(camber) is not as large as the creep
multiplier for beam self-weight because
prestress continues to decrease with time.
For example, a 10 in. initial camber due
to prestress multiplied by a 1.7 creep
factor is 17 in. An 8 in. deflection due
to beam self-weight multiplied by a 2.0
creep factor is 16 in. The net predicted
camber at deck placement is 1 in. This is
compared to an initial camber of 10 – 8
= 2 in.
Methods of accurate prediction of
camber at time of deck placement are
summarized in the article by Tadros et
al.1 Several states, in collaboration with
designers and precast producers, have
developed their own “creep multipliers”
to account for camber growth between
prestress release and deck placement.
It would seem reasonable to show upper
and lower bound camber multipliers,
based on local prevailing construction and
environmental conditions.
For example, Washington State guidelines
show a lower bound of 50% of the
camber at 40 days, and an upper bound
of 100% of the camber at 120 days.
The author recommends a multiplier
to be determined by each precaster for
the region served by their company. For
example, Supplier X serving Western
State Y would provide the owner with a
lower bound and upper bound multipliers
of 0.9 and 2.6 applied to initial camber
to predict camber at time of deck
placement.
The data presented in Fig. 4, which
has been supplied by Troy Jenkins
of Northeast Prestressed Products,
illustrates camber variability at 120 days
for girders produced by his company in
several states in the Northeast. The figure
shows that only a few points fall outside
the proposed camber tolerances indicated
by the red lines.
It is suggested that the PCI Committee
on Bridges and Bridge Producers
Committee should consider setting up
uniform national guidelines for achieving
this important task.
Accommodating Differences There are two options for accommodating
differences between predicted and
measured camber at deck placement.
Measured camber larger than predicted camberAssume for thi s di scuss ion that
be made early in the morning when
the girders should have a neutral
thermal gradient.
• For predicted camber ≤ 1 in.,
tolerance is ± ½ in.
• For predicted camber > 1 in.,
tolerance is ±50% of the predicted
camber.
• Out-of-tolerance products should
be further investigated by qualified
personnel to identify the presence
of possible deficiencies. Camber
alone should not be the sole cause of
rejection.
Camber Variability at Deck Placement Camber prediction at time of deck
placement is needed to es tablish
elevations for beam seats and for
fo rmwork fo r t he d eck . Thi s i s
necessary so that the top of road
elevation and the overhead clearance
below the bridge are consistent with
design requirements.
Concrete creep and shrinkage cause
prestress to be lost. In addition, creep
causes the beam to continue to camber
with time. Creep and shrinkage are
functions of the concrete ingredients,
section dimensions, and environmental
conditions. Furthermore, it is not known
in advance how much time will elapse
between girder production and deck
Figure 4. Measured camber at 120 days. Red lines show proposed ±50% ≥ ½ in. tolerance. Data: Northeast Prestressed Products.
1⁄2
-1⁄2

42 | ASPIRE, Spring 2015
predicted camber for a 150-ft-span
beam is 3 in. while the measured
camber is 6 in. The designer had
allowed for a cast-in-place concrete
haunch of 1 in. above the top flange
of the beam at midspan. The simplest
solution is for the owner to allow
raising the roadway by 2 to 3 in.
Alternatively, the girder seats could be
set 2 to 3 in. lower than previously
specified. This option would require
appropriate preplanning.
Measured camber smaller than predicted camberAssume for thi s di scuss ion that
predicted camber is 3 in. while the
measured camber is 1.5 in. The seats
may be raised to avoid infringing on
overhead clearance below the bridge, if
this is a factor, and to avoid excessive
haunch concrete . Also, adequate
drainage needs to be checked to avoid
water ponding on the bridge.
References1. Tadros, Maher K., F. Fawzy, and K.
Hanna. 2011. ”Precast, Prestressed
Girder Camber Variability,” PCI
Journal, Vol. 56, No. 1: Precast,
Prestressed Concrete Institute
(PCI).
2. Tadros, M. K., N. Al-Omaishi, S.
J. Seguirant, and J. Gallt. 2003.
Prestress Losses in High-Strength
Concrete Bridge Girders. Report
496. National Cooperative Highway
Research Program (NCHRP).
Washington, DC: Transportation
Research Board.
3. Davison, Bill. 2013. “Prediction
of Time-Dependent Stresses and
Deflections in Prestressed Concrete
Girders from Start of Fabrication to
End of Service Life,” M.S. Degree
Thesis, University of Washington,
Seattle, WA, 2013, Advisors John
Stanton and Marc Eberhard, 158 pp.
4. PCI. 1999. Manual for Quality
Control for Plants and Production
of Structural Precast Concrete
Products. MNL-116, 4th edition:
PCI.
____________
Dr. Maher Tadros is principal with eConstruct
in Omaha, Neb. MOVE THEHEAVYWEIGHTS!
MOVE THEHEAVYWEIGHTS!
12 Timber Lane • Marlboro NJ 07746 • USA
tel: (732) 462-6277 • fax: (732) 462-6355 • e-mail: [email protected]