spotfire · conclusions: spotfire™ in drug discovery • key advantages – visualization...
TRANSCRIPT

Spotfire™ Across the Drug Discovery Enterprise:
The Cytokinetics Case Study
Spotfire™ Across the Drug Discovery Enterprise:
The Cytokinetics Case Study
Vadim Kutsyy, Ph.D.Wesley Zink
October 2003

Cytokinetics: Company SnapshotCytokinetics: Company Snapshot
• Cell biology driven; focus on cytoskeleton
• Oncology drug in Ph I; initiating broad Ph II in Q4 2003
• Major cancer alliance with GlaxoSmithKline
• Emerging clinical pipeline; 2 IND’s in next 6-9 months
• Raised >$130 million; strong cash position

Cytokinetics: Corporate MissionCytokinetics: Corporate Mission
• Leverage cell biology based discovery technologies to exploit cytoskeletal pharmacology for the discovery and development of novel pharmaceuticals
• Manage technical and financial risks through building redundancies and breadth in all programs
• Conduct broad development programs for next generation pharmaceuticals that are designed to address liabilities of first generation therapeutics
• Commercialize proprietary pharmaceuticals with focus on sizeable and tractable commercial markets

Drug Discovery ParadigmDrug Discovery ParadigmThe Cytokinetics ApproachThe Cytokinetics Approach
> 2 GB of image data, feature data and
informatic reports generated per
compound
Proprietary Targets
500,000 Compounds
PUMA™ HTS
Cytometrix™ Cytometrix™ Cytometrix™ Cytometrix™ TechnologiesTechnologiesTechnologiesTechnologies
Optimized Hit
Animal Study
Lead
Development Candidate
Preclinical Development
INDApplication
Biochemical Hits

Informatics Needs at CytokineticsInformatics Needs at Cytokinetics
• Rapid analysis and delivery of results
• Real time data analysis for quality control
• User friendly data access
• Rapid deployment of new developments
• Ability to present high level summary data with an option of “drilling down”
Large amount of data generated throughout the drug discovery process requires

Spotfire™ Development at CytokineticsSpotfire™ Development at Cytokinetics
• DecisionSite Application– GuidesGuidesGuidesGuides allow scientists to easily follow steps to access the data
of interest, automatically applying visualization templates tailored for viewing the data
– DecisionSite Information Interaction Designer and Information Builder allows developers to easily construct complex queries from multiple data sources hiding data complexity and location from the end user
– ToolsToolsToolsTools provide sophisticated software solutions to be completely embedded and distributed from the Spotfire™ server
• Stand-alone integrated applications– Provide rich functionality while maintaining a common data
visualization platform for end users
– Well designed and documented Spotfire™ DecisionSite API makes development easy

Client systems running Spotfire™ DecisionSite
Screening TopologyScreening TopologyHigh Throughput
Screening Systems
Analysis servers
Reader files(XML)
Analysis results
LIMS
Spotfiretemplates
Corporate Network
Image files(TIFF)
Imaging MicroscopySystems
Cytometrix™Technologies
Spotfire servers(Development and Production)
Java, MatLab, C++LabVIEW, Excel etc.

Why Integrate with Spotfire™?Why Integrate with Spotfire™?
• Spotfire™ has grown to be the common data visualization tool across the company, in Data Analysis, Screening Operations, Quality Control, Assay Development, Chemistry, Biology
– “Pilot License” – development/several users
– “Departmental License” – expanded users
– “Biotech Company License” – rolled-out to Research
• Support for our primary development environments
– Infrastructure platform implemented with J2EE and Oracle
– Automation platform developed using LabVIEW
– Utilities implemented with Visual Basic
– Familiarity with XML and Oracle™

Integrating Spotfire™ with LabVIEW™Integrating Spotfire™ with LabVIEW™

Spotfire™:Real Time Analysis EnvironmentSpotfire™:Real Time Analysis Environment

Implementation MethodologyImplementation Methodology
• Establish connection with Spotfire™ DecisionSite (Application and Visualization ActiveX objects)
• Determine columns in current data set
• Respond to events (i.e. MarkedRecords) by obtaining information about which data points (records) were manipulated in the body of the event
• Update existing plots
• Create new plots
• Apply visualization templates
• Present data related to the selected data points using unique identifiers (i.e. barcode and well reference)

Functional Overview forClient ApplicationsFunctional Overview forClient Applications
Spotfire™ DecisionSite
Custom built clientsapplications
COM enabled communication
Spotfire Server
Cytokinetics Crunchers
ActivityBase™Database
Cytometrix™Technologies
Automation
Raw data
Spotfire™ reports
Spotfire™templates

Cytometrix™ CellularPhenotyping TechnologiesCytometrix™ CellularPhenotyping Technologies
• Automated cell handling and microscopy
• Advanced informatics quantify phenotype
• Profiles on- and off-target effects
• Comprehensive systems biology
• Systematically measures responses of individual cells to compounds of interest
• Dose response data used for compound comparison or classification

CytometrixTM TechnologiesCytometrixTM Technologies
Example of the Data Size in a Single Experiment– 6 cell lines– 2 marker sets (1 and 3 markers per set)– 2 time point– 83 compounds– 8 concentration per compound– run in triplicates
• 6*2*2*83*8*3 = 47,808 wells are screened
• 6*(1+3)*2*83*8*3 = 95,616 images are collected
• Expected about 800 cells per image on average, with total of 38,246,400 cells per experiment
• >170 GB of data generated for this experiment

Data Exploration: Cytokinetics DecisionSiteData Exploration: Cytokinetics DecisionSite
• DecisionSite application was developed with tools specific for Cytokinetics
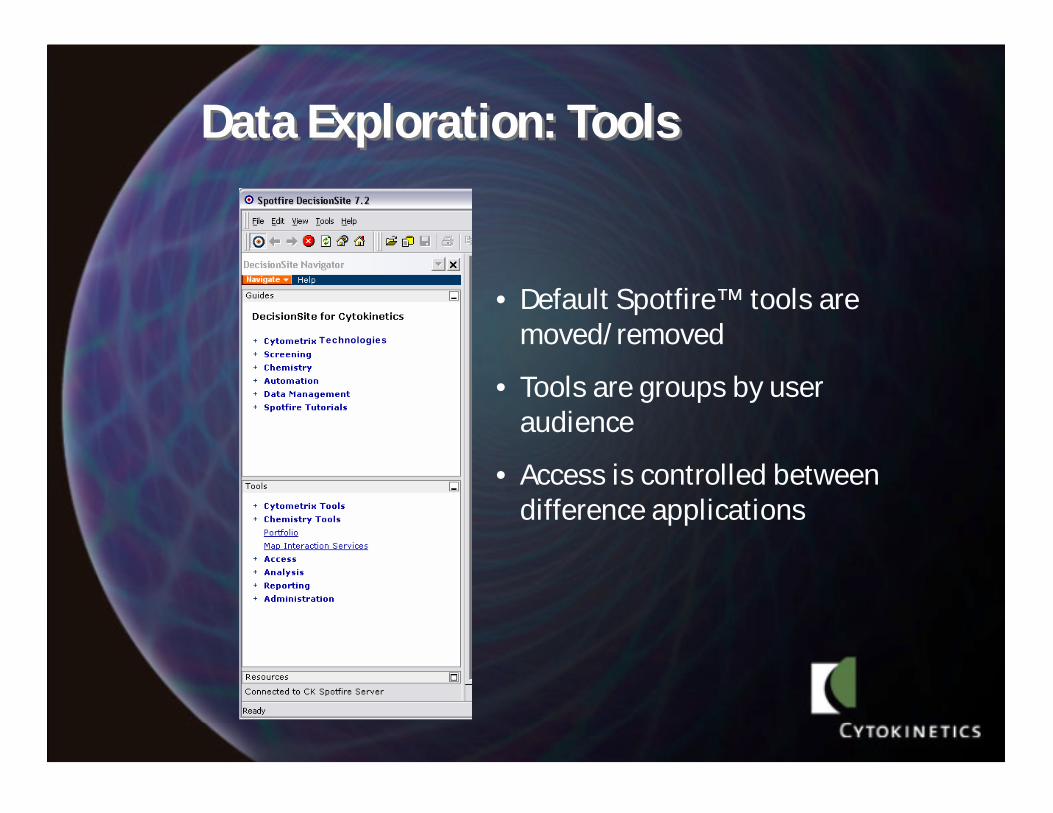
Data Exploration: ToolsData Exploration: Tools
• Default Spotfire™ tools are moved/removed
• Tools are groups by user audience
• Access is controlled between difference applications
Technologies

Data Exploration: ToolsData Exploration: Tools
• Different levels of data can be accessed
• Ease of navigationTechnologies

Data Exploration: ToolsData Exploration: Tools
• Multiple databases can be accessed
• Data can be queried by experiment, compound, etc.

Data Exploration: Data OverviewData Exploration: Data OverviewNUM_OBJECT SNUM_OBJECT SNUM_OBJECT SNUM_OBJECT S
CONCENTRATION
CELLLINENAME - A498
MARKERSETNAME - OneStep
CELLLINENAME - A549
MARKERSETNAME - OneStep
CELLLINENAME - DU145
MARKERSETNAME - OneStep
CELLLINENAME - HUVEC
MARKERSETNAME - OneStep
CELLLINENAME - SF268
MARKERSETNAME - OneStep
CELLLINENAME - SKOV3
MARKERSETNAME - OneStep
CELLLINENAME - A498
MARKERSETNAME - TriStain
CELLLINENAME - A549
MARKERSETNAME - TriStain
CELLLINENAME - DU145
MARKERSETNAME - TriStain
CELLLINENAME - HUVEC
MARKERSETNAME - TriStain
CELLLINENAME - SF268
MARKERSETNAME - TriStain
CELLLINENAME - SKOV3
MARKERSETNAME - TriStain
0 1.... 2.... 5.00... 7.00... 8.99... 0.00... 0.0... 0.00... 0.... 0.... 0 1.... 2.... 5.00... 7.00... 8.99... 0.00... 0.0... 0.00... 0.... 0....
0200400600800
10001200
0200400600800
10001200
0200400600800
10001200
0200400600800
10001200
0200400600800
10001200
0200400600800
10001200
Large data sets can be summarized
Interfaces can be easily customized

Data Exploration: Data OverviewData Exploration: Data OverviewNUM_OBJECT SNUM_OBJECT SNUM_OBJECT SNUM_OBJECT S
CONCENTRATION2.000000010049... 7.399999... 1.499999... 1.9999... 2.50000000... 3.50000000... 4.0000... 4.49999999... 5.49999999... 5.99999... 6.599...
0
200
400
600
800
1000
1200
Users can “drill down” to each compound for a cell line at a time point

Data Exploration: Chemical InformationData Exploration: Chemical Information
Chemical tools are located together
Easily accessible

Data Exploration:Chemical InformationData Exploration:Chemical Information
•Multiple structure display
•‘Mouse over’ dynamic structural display
•Requires SMILES strings

Data Exploration: Biological Image InformationData Exploration: Biological Image Information
•Image related tools are located together
•CytoPix™ Viewer is a Visual Basic application
•Cyto Explorer is a Java plug-in
•Cyto Annotator is a Javascript tool

CytoPix™ Viewer: SetupCytoPix™ Viewer: Setup
•Users can access a number of variables
•Plate ID and well ID are selectable

CytoPix™ Viewer : Data SelectionCytoPix™ Viewer : Data Selection
Marked records are dynamically displayed in CytoPix™ Viewer

CytoPix™ Viewer : ImagesCytoPix™ Viewer : Images

Data Exploration:Cell Level InformationData Exploration:Cell Level Information
• Cell level data is available
• User can plot cell level data over the actual cell on the image with Cyto Explorer
• Cyto Explorer is easily configurable
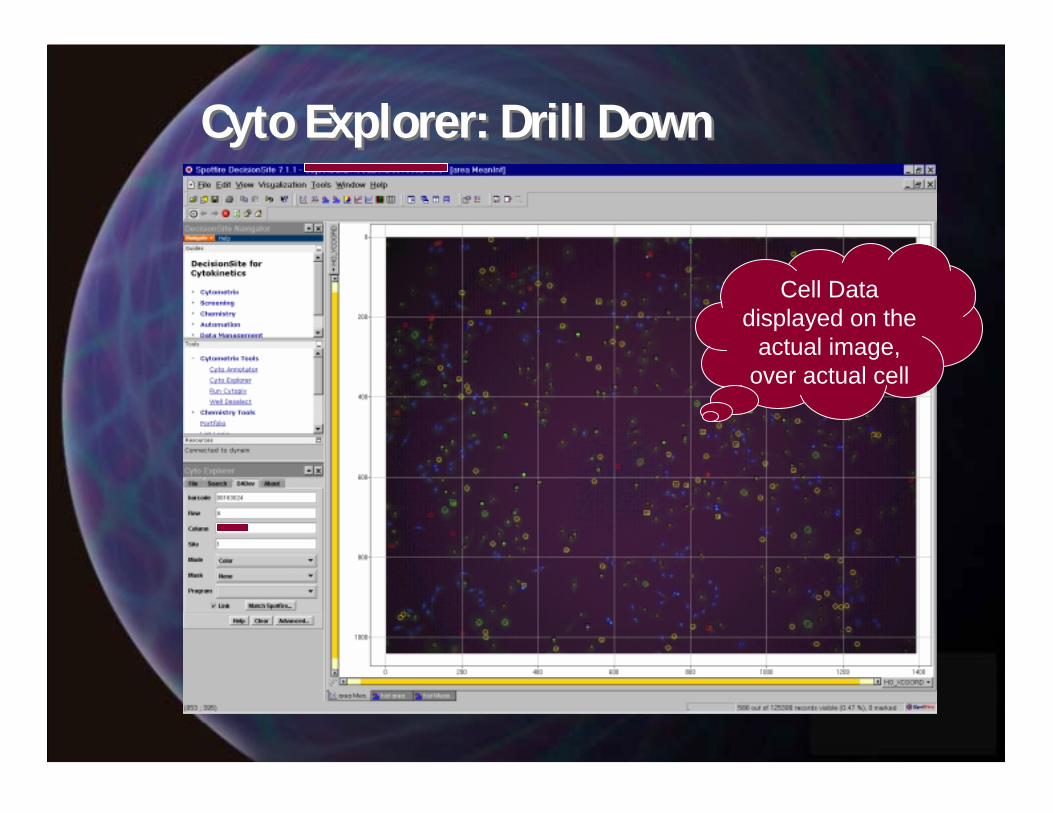
Cyto Explorer: Drill DownCyto Explorer: Drill Down
Cell Data displayed on the
actual image, over actual cell

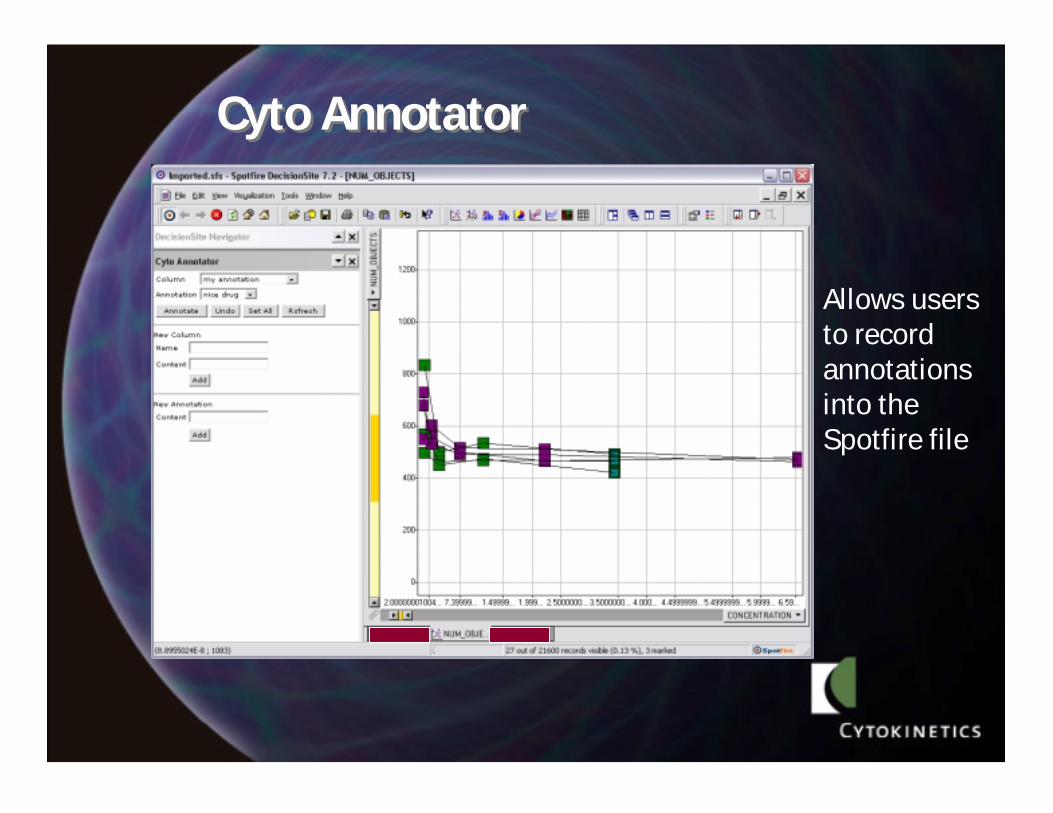
Cyto AnnotatorCyto Annotator
Allows users to record annotations into the Spotfire file

Conclusions: Spotfire™ inDrug DiscoveryConclusions: Spotfire™ inDrug Discovery
• KEY ADVANTAGES
– Visualization Framework
– Can be used across the drug discovery enterprise
– User Friendly
– Customizable
– Extendable
– Data Access Options
– Ease of Deployment
• POTENTIAL IMPROVEMENTS
– Large datasets
– Ability to integrate custom algorithms with Spotfire packages
– Dynamically append records