concern' of recent stratificatimi -re search. stus ... · to develop a scientific knowledge...
TRANSCRIPT
ED 142 809
AUTHORTITLE
INSTITUTION
SPONS AGENCY
PUB DATE
DOCUMENT-EESUeE
95 CE 012 067
Gott fredson, 'Lin.da S.A Multiple-Labor Market Model :elOccupationalAchievement. Report No. 225:-Johns Hopkins niv..,--BaltimOre, Md. Center br theStsdy of S6cial Organdiation of Schools. d'.
National Inst. of. Education (DREW), Washington,D. C.Mar 77
;CONTRACT NE-C700-3-0117rGRANT 5-T01-WH1:1997NOTE ----"
EDRS PRICEDESCRIPTORS
MF -$C.83 . 67 Plus Postage.Adole§c_ent:s; A 'tilts; Age Groups; Classification; . .
F-conomic Status; Educational Experience;, *EmploymentLevel; *Equal 'Oppo.ttun'ities (Jobs) ; ,*Income; LaborMarket; Males; -*MoTels; Occupations; PrOmotion(Occupational) Racial Differences; Salaries; SexDifferences; .Social Attitudes; *Social Differe.nces;Social Science Researc; Socioeconomic Background;Socioeconomic Influence-s; *Socice5onomic Status; Work,Experience
IDENTIFIERS.,, :H-olland (John L)
ABSTRACTA
Reseafch was conducted to re- empasize the importanceof functional_ differences among jobs by*.-showing howl they help to. -better explain, the income and status differences that are the mainconcern' of recent stratificatimi -re Search. Stus attainment, socialclass, and .vocational psychciogical7,4proacAes'fa occupational andsocial differences were integrated inta'a multifle-nia.r'kei model,which ,ug'geSts -that the value of. a determinant vari es....comsidTerabl,bycind ,of work. Also, the model's Simultaneous use of situs as well asstatus; of work- proVides a new perspective for developing-a morescomprehensive theory di SO-cial_differentiation,,for 'assesing sqpialinequality- mor.t- accur.ately, and for reducing inequality moreeffectively*. A subsample of white men, (black men, women, and men inartistic ''woric, were excluded) taken tiara 'a 1/1000 sample of the 19,70census was uzg'd to test the value of the multiple-market. model inpredicting income as opposed to the, traditional one-market model.Results showed that the ultiple-market model predicts ,statisticalinteractions--between situs and other. determinants of income. Incontrast, the one-market predicts nt -interactions, and no situs/differences- (Author/TA) .
-
,
Documents acquired by ERIC include many infoftnal unpublished materials not available from other sources.? ERIC makes everyeffort to Dbta in the best copy available. Nevertheless, item's of marginal reprotilicibility, are often encountsgd and this affects thequality` of the mictofyhe and hardcopy reproductions ERIC makes available via the ERIC DoctIment Reproduction Service (EDRS)..._EDRS is not iesponsible,for the quality of thgoriginaldocument Reproductions supplied by EDRS are the best that can be made fromthe original,
0
t._
0°...., ,- ..i.-'
... A MULTPLE-LABOR MARKET MODEL
°OF OCCUPATIONAL ACHIEVEMENT .
,k .,/
Contract No..NE-C-00-3-0114
NIMH Training Brant 5-T01-MH11997
,
U S DEPARTMENT CF lEALTTIEOUCATION 4, NEL IRE.
(NATIONAL INST TUTE OFEOUCATION
ril ,,S 00Ct.VENT HAS BEEN REPRO2.CE^ S' CT AS AS RE-'5,1iF0 FROM.4t- R sr[, OR ORGAN(; ',4 ORIGIN°
Linda . G6ttfredsoii..,, T A 5 0, ,/,..
...-, oRiNJONSi ST 'E.''' DO .40 NF 0° . s' ...TRE..4 OFF,C,.... .A T °NAL NSOFJC..' D POST TiON (:: POL 'CY
RepoA No. 225
March 1977' :
Published byethe Center for Social Organization of'Schools, supportedin part ag a researchand'developmentcenter by funds from the United
-° States-National-Institute of Education, Department of Health, Educationand Welfare. The opinions, expressed in this publication,do notnecessarily reflect the position tit.policy'ofthe National Institute ofEducation, and' no officia,1 endorsement by. the Institute should be inferred:
The'Sohns Hopkins, UniversityBaltimore, Maryland, .
g. .
2
P.4
A
r
r
rj

8
.
V
I
STAFF
..Edward L. Mc Dill, Co-director
James M. Maartland, Co-director
,*
la
.
Karl L. Alexander John H. Hollifield, ..'7',
. Henry J.' Becker .- 4, ; Lawrence F. Howe --:-....',%
: . . .Alta 'iou, Smith' -, '6 , e,..
. Nancy L. Karweit- ,
. _ ., , -. -, , ... ,.- ,i ; . (Martha A. Cook T. . Haieip. Kanned5r', ;
-.
.t... ,-.- .- - - .-, ,." " .- ,- ,
Denise .d. Daiget - , , ' trig '12... :Tyler. .
,
Will E. Rice ...,.. ... lrJames M. Richards, Jr.Robert Et - Sl4vin
Joyce- L. Epstein
James J: Fennessey,
Linda edspn
Larry J., Griffin
Edward J. Harsch
431.
,/
Gail E. Thomstf_
-14104
J0.11ri S. Weda-Eski
,
.
' A
-4
Af
r' ,
I
4-

Introductory Statement.
41 a
The Center for Social Organization,of Schools has two primary
objectives: to develop a scientific knowledge of'how schools affect
their students, and to use this knowledge to develop setter school
practices and organization.
The-Center works through three programs to achieve its objectives.o "
The Schools and Maturity program is studying the effects of school;
:family, -and peer group experiences on, the development, of attitudes.
....
....-,/..-consistent with psychosocial maturity. The objectives are to` formulate,
/.
Y..
as ess, and research important educational goals other..than ttaditional,. -
cademic achievement. The'program has developed the PsyChosocial Maturity:.:',a
(ASM) Inventory'fof the assessment of adolescent social, individual:,, and
/interpersonal adequacy. The SchlolOranitation program investigates
.
,
-.
the authority-control structures, task structures, reward systems, and
. 'peer group poocesses in schools-. It1has produced ajar& scale study o
the,effects of open'schools'on students, has developed the Teams-Games-
Tournament (TGT) 1:nsturctional process-for teachingyarious subjects
Velementary and secondary schools, and has produced a computerized sy tem
for school-wide attendance monitoring. ThAchool Process and Car --r
Development program is.studying transitions from hIgh-.school to st-
/secondary institutions and the role of schooling in thee developmentief
career plans and the actualization of labor market outcomes:
- -
This report, prepared by the School Organi'zatiom program, examinee
how education and other determinants of occupational achievement may. -
have different influences on income and status due to functional
differeiltes-:among,occbpat.ions.
de; .
r,
J.
. \
A Multiple2tab4 Market:14odel1, , .
, 4
of OccupationalliAcRievement4 .
Abstract
41P
o
FOr lack 9f a clear alternative, Much work on occupational inequality
',has assumed that the same proces4 o.f achievement'chiracterizes all
fields of work.i Analyses of income differencts among` -white men imply,
in contrast, that reward struptures vary considerably by type of work.c
-and that occupational achievement depends jointly on the characteristics'
. .,of workers (such as education)and of ocdupations (such as functions'
...,/
performed). In this paper, status attainment, social class, and
vocational.psychological approaches to occupational- d sociardiffer-
ences are integrated, and the Practical implications of. this broader
perspective for measuring and reducing racial inequa ity are discussed.,
a. ,
.
iii
r-

sz;
/
AcknoWl
The following reackrs_ga
various drafts of this repo
Robdi.t A. Gordon, James M.
° e
edgments.
ve use,fui advice and guidance on the
rt: John L. Holland, Gary D. GOEt.Xredson,
McPartland, and John H. Hollifield.
"-S,, 2
.
J.
iv ;" .
4+,4
-'ig
Air
,
4.
S
4
.
d
a
4
r, .
Table of Contents
4 et I
.... .
C
Page
1
4
5
'.9
/1
12
13
s20
23
23
.25
P.*29
4
3031
3132
34
. 35
4;
46
51
72
Introduction7-
.. .
Besearch'on Income. .,
I.- -.
- .1.
A Multiple-Market Model,....:
The Dita ,...
Testicng the One- and Multiple-Market Models..-Tests for Interactions ..
Differences Among(Bituses......Pattern of Situs D4fferences e....
Implications ,.-
, An Alternative Paradigm 4ASoctal Class ..,6-
-6
AsSessing,Inequality- and Discrimhhation,A
tReducing Inequality ' ..
*) -
. ,
Origins 'of' Situs Differences 6 C i40Criteria for Evaluating Jo Performance
,., :Source of Funds -
Abilities Requiredi 1
s. .t
Footnotes At/
,Tables° .
' FigureA
References
'., Appendix A -- Holland Codes and Prestige of Detailed Occupa-,.
tions. in the L970 Census
Appendix B Additional Results by Ages and Situs Of Work
I
0.
1
t
41(
.

A Multiple. -Labor Market,
Model .of Occupational' Achievement'
.
. A worker's occupation is important in,determining the quality of.'
,
.. e
life that both the worker and theworker's.fmmily:experience or can -
,,- ... .
hope to experience. For example., we know that social workers, engineers,...
,...
4
laborers, artists, real estate agents, arid farmers live in different
types-of homes, have different friends and possessions, have different
interests 'and values, and adhere to divergent .political and religious./ . . . (----/
. .
4 ° beliefs. And we hale strong preferences about which of these people.
we would, want to trade lives with--or haveas friends.
Sociologists have long been interested in the specialization and
dtherentiation pf work'and its consequences for social solidarity and
individual opportunity. The division oflabor has been particularly
important id stratification and mobility theory, the study 'of social
inequality. The major stratification theorie's agree that economic
and honorific differences among Markers depend.on the fUnction of the
jobs they perform within society, but...these theories disagree about whyd
the relation between job function and rewards exists. Functional theorists
.
(Davis and Moore 1945) ire assumed that some jobs' are more highly
411,
,
rewarded UecaUse their functiOns arse more important" to society. In
contrtst., conflict .theorists (Marx 1895V1967) have .assumed that the
functions-of,some occupations affOrd their incumbents gpeater power to'4 t
control and obtain'sopial d economic benefits. Some stratification:,
theorists haveoemphasize/d that the division of labor is intimately
. associated not only with honorific and economic differences but also
with many facets of social relations and styleof life (Weber 1946).
8

2
.
..
Over the last fewcdecaiies, stratification and mobilktY research
. . .
has come to-focus on measuring the desirability pf different occupations'.. .
. .
sand explaining why some people get good jobs whereas others do not.
Sociologists now gene -rally assume that there is a shared public standard
for determining what is a good job, and they cite the high correlations
. '
between occupational prestige rdtingemade at.dfferent times and by
different socifal groups as evidence of a shared_ standard (Hodge, Treiman,
and Rossi 1966; Hodge, Siegel, and Rossi 1966). All people are assumed
to compete to rise on'this occupational ladder, but only thos'e workers
with the best resources are likely to reach the highest rungs. Resedrch
on occupational .inequality has therefore.fbcused on-discovering which
, .
resources--such as. education', .intelligence,.and social background--are 0
most important and Jest how people convert their resources into occu-
. patonal Status and income (Duncan, Featherma4, and Duncan 1972; 'Sewell
. -
and .Hauser 1975).
This focus on the-income and status attainment of individuals has
been accompanied by increasingly sophisticated methods of analysii,
but it'has promoted a one-dimensional: viewofjobs and workers.
Functional differences amonk ,jobs no longer occupy the attention of
, .
'-stratiiication researchers, but-4aveAnstead become the province o, f
other disciplines such as vocational and indus'trial uychology Further-__
more, this 'stream of attainment research has become divorced from, the
More tradj.tional stratification work on social class formation, class
It
consciousness, and-'the behavioral and'attiudinal,correlateslof social....\ . ..,
' class.. _7S
,....,...,,__ _
The object of this paper is to reemphasize the importance of
_

0*
an
1
. *
r
3
6 A
.4
functional differences among jobs by. showing how they help to better
explain the (ncomy and status differenceS thatar the main concert)
of. recent stratification research The object is also 'to s.tt how-.
. disparate approaches to.social and occupational differences can,hg
integrated44Classifications-of occupations accordirig to situs1
or.
. L ,
functional.similarity"of work have receivL much attention froM'. . I N.
,
vocational psychologists (Roe 956; Strong 1943; Holland 1973). ,
-
They differentiate jobs not only by level skills required it also-by job activities, worker competencies; interests, and values required.
The literature of vocational psycbollogy implies that income is determined
Oifferently in'diffeient'situses.of work such as sales and management,
science, skilled tradesand.the arts.
y-.
In contrast, most current sociological research- on income differences
assumes that income is determined in the same way in all kinds of work,
. that alZ employers rank potential employees according to the, same
difEandarda of desirabFlity4 and that they reward iworkers according to,
the same criteria of competency and productivity: In other words,r 4
current sociological work imPlicitly assumes a one-labor-market,..Model
dr'
of. occupational achievgment7-all. Workers and employers compete for jobs
'and- employees within, a single labOr market. Fuc tional differences
smong jobs imply,that a fundamentall'i'different-approach--a multiple-
market model of occupational Achievement- -is more appppriate2 ,
Rejection Of the one-market model of attainment in favA of a
'multiple-market model has-itWortant consequences both spciai theory
'and social practice: For example, it quest;ions the usefulness of the
current quest for the be'st single estimate of the income- producing
10
A
4r,
r
value of determinants such gas. years of education and vocational trainidg,
because the multiple-markep model suggests that-the value of a determinant
varies considerably by kind of work. The simultaneous use of situs aso
well as status of work also provides Z'new perspecttve for developing
'a more comprehensive theory of social diffeientiation, for'assessing
social inequality more accurately, and for reducing inequality more
effectively.
Research On Income
0
Research on income.differences has shifted from measuring. the size
'of income differences and'finding the c.orrelates of those differences
:
to estimating the reratiVe importance of'varibUs income determinants,.'
. 1
.,:,
.
for example, years of education, social background, academic aptitude,..
I..
/Ind work experience. -Judgments about the relative importance of .
J
different income'determinants are generally made from -dip coefficients
of, regression equations used to model income processes. The variables.
4 . .,
included in those' models have varied by discipline-and over time--.
,
'sociologists have focused. primarily on pre-labor market experiences, and' s
.
economists have focused- on experiences aftee-entering the labor'market.
but the models have generSlly shared one important characteristic: they
are One-Market models(cf. Gordon 1972). This means .that the regression
equations are not estimated separately for different groups of occupations.
Using a single regres'sion equation for all occupations means that onry
a single esttmate of the valge of a particular determinant such' as years.
of education is'obtained for divergent fields of workskilled trades,I ' ,c
,sales work, arts, and science. Although_the value of different skills
' ^t . tand qualifications could be expected to di,ffer considerably by field,of
/
c
5
- ,..... %
..
work, models are routinely estimated separately only byrace and sex, .) .
. .I.
(e.g. Rout and Morg'pn 1975).,
.
...
- -,....... ,
The me-market model seems-to be used by researchers not bec1use it. ,
has been shown superior to others, but because researcherhave not.
perceived any clear alternati'Ve. Sotiological,theory proyides'no..4,,..ry . .
compelling way to*organatirfunciion-71 differences among jobs, and the-
0
situs classificationspropoted-,lby 'sociolbgists stt 1950; Morris and-
44 .4.4, 4, . 'S., . . , ' 4'4 '1
MyrphY-195,19, have'seldom...xeceivedoattention by.spyone but their authors.
.,
Instead, sodiologists have devoted their efforts to refining occupational,....,.....
. ,, ,
status and prestige scales. Economists are more likely to stress the. , i ,
.
.
importan6e of differences ambneabor Marketsthe segmentation, of the . -o .:. .
.
sclabor market. But they have not developed any satisfactory classification.4 -
'of occupations or'markets. As Osterman (1975)°.notes; the interesting
questidn is not whether the laboedarket is-s4gmenbut how it'isr 4,
segmented.' Dual labor market. economist's haVe provided a theoreticale
.
rbasis,f9p, classify,ing occu0Stions, .but tliey have found no'useful.wayiof
, = a.,-,
cldstiWZPations independently of the intome dif- terences they, -,
predict they,will find among.differeOt hypothetical labor markets,..,
,
will
. ....,_ .Census categories` are occas.4.011y,uSed by other-researchera (StoIzenbeig
. -is
1975) to develop income models for different occupational mups, but
tfie'densus categories have Yong been critic zed because they lackit.
exp14 -6it principles for deLning cateas--/and because they are an .r
unclear mixture of situs and status of work (Caplow 1954; 'Parnes 1954)?;
4 I
Multiple-Market Model
,Vocational psychology provides both a theoretiCal base and an
empirical means for developing a classification of occupational labor
12

tF
.,%
6
mar kets. Vocational psychologist's have attended to sittrs of work,
although they do not use the term situs, awd.they hare developed' both
the ories and-classifications to summarize the major differences between.
. .
kinds'of occuptions and types of people. .At this time Hollands,(1,973)
theory and:classification appears to be the most influential, the most
developed, and the best researched. The major categories of his classi-.
-7-74Lation of occupatiiins- are used here to approximate six-boad sinuses.
I. of work in the U.S. occupational tructure.
I
'Holland's classificatiton'groups occupation's according to their
resemblance-to six ideal types of work: Realstie (R), Investigative
Antis tic (A), Social (S) EnteVpriaing (t), and gOnv .6(C). Table
1 prov'des t brief description of the types. Each typeof occupation.
is chara 'riled by the kind of activities involved, the competencies
required and rewarded, and 014 kind of interpersonal'relations prevailing.
A Realistic occupation, for example, is.characterized by,dempod. and ,
.opportunities for the concrete or systematic manipulation of objects,
-tools, machines, or animals. In contrast,. a Social occupation i § `an
. 0 environment characterized by demInds and opportunities for the manipulation
of peop4e to inform, train, develop, cure, or enlighten.
.
Insert Table 1 AboUt Here
. .
The theorYalso postulates that people can be classified according to
their resemblance to six personality types; Realistic cp4 ,Invettigatilie
(I), Artistic (S), Enterprising (E), and Conventional (C).
Each -personality type has a distinctive-pattern of .self- 'perceptions,
interests, and competencies, and each showd a-preference for different
1.3t,,
7
kitids of occupations. The six types of personality are parallel to the
-six'kinds of Work and are alsodescribed in Table 1.
The clissification was empirically developed froM data -6n personality,b
apti :worked traits, andjob duties, for people in different Occupa-
tions ,(Holland 1962, 1966, 19,73, 1975). .A fuller description of the
types and a description of other major theoretical constructs not
discussed here are-providby-liol-land-419-Walsh--(1-9-734-and-Oakpow
(1913) provide other' reviews of the theory.
Holland's classification should not.be considereda.replacement for 4
,
socioeconomic scales of occupations; lit should be,used-together
with such scales. Table 2 summarizes the distribution of workers%.
according to both prestige and Holland category of work." This table
shows that although type of work is not independent of level or
work,.there is nevertheless considerable diversity in the kinds of work
performed at most levels, particularly at the higher prestigt levels.
Insert Table 2 About Here
Income, status, and educational achieveMent are only a peripheral
concern of Holland's theory of careers, butthe theory does suggest that
the six major occupational types are situses characterized by different
income determination processes. Two ways in which the theory suggests/
a multiple-market model of income determination are,discussed belOw.'a
Yirst, the different kinds of work require different skills.
Consequently, resources which bring high returns in one type of work1 .
:
-0 i
will not necessaily bring highincome or prestige.in other types. For
example, education may be highly rewarded in scientific (Investigative)/

.
8
av
ar educational (Social) ocduOttions and experience or specialized aptitudes
may be highly rewarded in manual (Real-istic)'or Aitistic workbut not
. vice versa.,
.- - .,
Second, occupations are populated primarily by people with persbnalities.1- .
people
...it\ .
.
congruent with that type of work. ,Social envtronments are populated
.....
.
primarily by Social people; Enterprising,_envirohmentS are populated by
.-.
Enterprising people, and so on. Thecliisteting of different personality-.
...'
types--who have different valuOlgoals, and interests -- indifferent
'occupations might lead to the creat ..,oionf structurally different systems,
each with its own institutionalized.rules governing occupational.4
success (cf. Kerr 1954). For.example, Enterprising people dominate
Enterprising environments, so Enterprising such as economic achieve-.
.%
ment are likely to be informally enforced in those environments.. These,
. ,
, .
values are, Also the ones. most likely to be formalizedi.
by memeers of that
occupational group.' A4 Durkhe.im (1893/1964) suggested, different occupa-
tional groups may create different moral communities, Also, thincentives
most effective for'hnterprising people are likely to differ from the
incentives effective for Social, Artistic, or Investigative people. 'con-
sequently, emplbyers are likely to have created different reward structures for
the different occiipatibnal groups. For example, many jobs.in the Social
category,OsuCh as teaching,. have fixed salaries with no provision for
overtime pay, but provide non-monetary incentives (for instance,
community z'ecognition) for long hours and high quality performance.
'In contrast, many-Enterprising jobs fpay,people by commission or-accord-
ing,to hours worked, so that the more 'ambitious or persuasive can earn
,more money. The income `prospects of individual workers whose values-
.15,
A
I
9
differ from those of the people dominating an environment may there-,
fore be determined by the way a Sob is structured by employers or other
employees regardless of their own personal values or preferences.40'
I
Consequently, taking account, of differences in personal characteristics'
may not completely account for the association oaf type of work with i come./ .
There may be many other sources of iistitutionalized difference
socioeconomic returns for the same skills. The point here is tha
Holland 's, theory implies.that the different situses are differe
occupational markets. To use a 'familiar analogy in stratific
mobility work, different situses may be different occupation
Thfse jahers may reach to different heights in the 4cupa
and the rules for, climbing them may differ. It is expect
that regression models of income determlnation will diff
estimated` separately by Holland sftus of work.
The Data
A subsample of men was taken ftoM a 1/1000 sempl of the.19.70. census
0--of pOpulation. It was, chosen to decrease the chanc s of finding incomer-
determination differences by situs,-that if, to:Or vide a strong test of,4011W.,
,,..,,
one-market versus muitiple-Market models. 'Blacks ,nd women were excluded, ,,
40 ,because income mfy be determined differently for t ese populations than, , 11 ,
it is for white men. Men in military, farming, Cr part time jiibe, (lessa . .
than 35 houis perrYeek) were'excluded for the same reason. ,The final
f. 6
sample consisted of 27,067 white men. Men in Artistic work were'!,,w .. . .
.
excluded from most of'the analyses because there were-few suchmen id
..-\
the sample.
-16

The data impose three main limitations-upon the. analyses. First,
occupational title and hours worked per week were obtained for the year
1.470 but income and weeks worked refer to.1969., I have assumed"that
the 190 occupation is the same as the 1970.occupation. This is a
reasonable assumption, because Byrne (1975) has shown that only 12.4%
of 25-34 'ear old to 2.6% of 55-,:.64 year old white men-changed occupations
during a 'one-year perillod. In a ny case, discrepancies cannot by expected
to favorably bias the results, that is, to increase situs differences.
:Second, the assumptions necessary for performing.tets of significance
4%4are not met because the sample was constructed according to a stratified
dluster design. There is no clear way of overcoming this nor0
of easily assessing its impact on research results. Many researchers
use samples thtt are not simple random samples, the most widely used
-being the 1960, and 1970 census data, the OcCupational Changes in a
Generation data (Blau and Duncan 1967); and the National Longi udinal
Surveys (Parnes et al'. 1970).' The few researchers who menti n the sampling
problem (for example, Blau and Duncan 1967) suggest no solutiOn. ,However,. I,
. Frankel (1971) concludes from empirical inves0.gations4of the/effects
of cluster designs on first- and second- order statistics that the
/sampling probleth may not be serious.
/
-The lamples- used here are largp, so statistically significant results
rwould be expected'even for small differences and t erefore would be.pf
little interest. The best evidence for,the substantive significance of
differences among the.different situses of work s the'donSistent and
interpretable variation across the'groups.
17

44
11
Third, some important variables are not,available in the census data.
tIncluding social background and ability variables would enabre. better
comparisons with status attainment research. Fringe benefits and Other'
income-related characteristics probably vary considerably by labor market
. but such information is not available in the census data. Also, without.
including workers' 'aspirations for category of work, it is not
to say conclusively Whether income differences by sit us result from
differences in, workers or from differences in occupational. systems.
A 'simple model of income attainment was used to test the superiority
q/ a multiple-market versus -a one-market model Of attaioment. Years of
'
education, weeks worked in 1969, hours worked during the survey week,
occupational prestige (Temme 1975), and Holland occupational,Titus were
used to predict total 1969 income. (See Appendix A 'for a. listti.of Holland codes for detailed occupational titles.) This model includes
variables known!to be important in accounting for income differences
among individuals.
Income attainment models typically include moreariables such as
marital status, potential work experiehce, age, and vocational training..1
'When these variables were include8 in the regre on-Analyses, they didollw
riot alter the main conclusions. Ther efore, t simpler mode lis used
here to simplify preseritation of the results.
Testing the 0116= and Multlple-Market ode is
Th usefulness of one-market versus multiple-market models was
tested using regression analysis because this method has been traditional
among status attainment and human capitil'researchers during the last
decade for analyzing.education, status, and'income differences amongs
O

T 12
A.,- ,individuals. The multiple-met model predicts that separate regressions
. for each situs of work account for More of the income variation than does.'.,
a single model. In other words, the Multiple-marketmodel'predicts
statistic-a1 intetactns between situs -and the other determinants of
income. More basically, it predicts that the relationi,among variables
.in the model - -for example, education, prestige, and income-- differ by.
situs. .Education mieteibe correlated_ differently With income in Investi-.
.s. .
gative7Te7g:"iCientific) work than in Enterprising (e.g..sales and
management) work. In contrast, the one-market model prediCts no intey-
actions aAd no-sittre differences, in the patterns of correlations among .
income detep iinants.
Tests for teractions
Table 3 P ompards the usefulness of five different models for
4
predicting income in each of four age groups--26-35, 36-45, 46-55 and
56-65. Models 1 through 4 are all one-market models because-only,oneIK
regression equation was used to characterize all men within an age group.ibk
These four models differ only according to the specific variables used
to predict income. .,Mpdel 5 is a multiple- market model because separate
regression equations were used for men in each situs.
Ak ir
Insert Table 3 About Here6 I
Models 4 and 5 are used here-to test the superiority of a multiple-
)market over a one-market model-of achievement. Both use hours; weeks,
prestige, and years of education.of men to predict income and both take
acc,Funt ofitus of work. Model'4, a one market model., asaumesAhat
. there is some constant advantage to,being in some situses rather than
I19
r
13
others and incorporates situs by.a.d g dummy variables for situs. ,*'
Model 5 assumes that - processes of income determinpion differ by situs, .0 n.
I. 4 ,'.
1 .)aA'and so includes situs by calculating separate regressions for,each bits.p5,
If the multiple- market model is superior,.the errotdo6redOtion fOr
4
model 5 should be significantly smaller than those of model 4.
The results indicate that the'multiple-market model predicts income
_ substantially better than does the one-market, model. Model 5,aceounts,
for about one-.third of the variance in income in the three oldest ager,
groups, and account%for 1:6 to 4t4% more variance than does.model 4.
F-tAts for homog neity of r ression (Tatsuoka 1971) indicate that
the multiple-market Model is $ign icanely bettet than the one=market
Xmoder In all, four age grolips . , .
, ..
.
*.. . 2I
t The squared'multiple correlations (R ) for three other orle- mErket
models are also presented in Table 3'to illustrate.
the relative uSeful-
aess of the multiple-market model.. A comparison of models 1, 2, and.5.: .
. I' 0to model 3 indicates that using a Multiple-market rather than a onemarket
- ,I 4
.
:.
'model which. does not incorporate situs in any way-is as useful as adding..,
(
prestige or years of educatiow.to a one-market model. Model 3 is a one-
market model using hours, weeks, occupational.preatige, and years of
education as predictors' of income. Comparing the percentage of income
6 variance accounted for by the multiple-market model using the same_four
prpredictors'in each situs- -model 5--shows that situs interactions, increase
, variance accounted for by'4.3 to 7.6%. This-increase is comparable
to that gained by adding ptlestige to the one-market model. A comparison,
of model 3 to model 2 shows thatprestige adds from 3.1 to 8.5%..01.
Adding education to, the one-market model--that is, comparing model 3 to
20
14
model 1--adds only 1.8 to 3.6%. This isjtst halfi' as much as is added
by situs. These are conservative comparisons because situs is taken
into account only,'safter prestige and ;education lave been added to the
_regression. of income and these two variables therefore are credited with
the Vaiiance'they predict jointry with situs.
e -:-
Differences among Siuses'4' .--
. ..4 .;
The tests for interactions provideevidence'that income determination,
processes differ by situs, gut they do not indicate what those differences
Aare. The following analyses detail the size and patteln of some'of
those differences! The analyses focus primarily On the relations between
the three measures of achievemsnt7-years of education-, occupational
prestige, and income.f;;
':Means, standard deviations, correlations-,. and regression, coefficients-
, je- 44
are used to esdcribe situs differences. Situs differences in mean:income
or other ct!aracterist
market model. A one-
s are not necessarily inconsistent with a one-.
rket model does predict, howIter, that the patterns
of means, standard deviations, ana correlations should be the samegion all. .
..
.situses. For example, wp,inight expect men in one sivtus to have higher
, , VIP'mean education, prestige; and income than men in another situs.,.
.7 ,..,.
would not expect men in a thix.d,itus too be high, in prestige educ4ion,.
..
t.' '..
but low in income. But the analyses reveal that the patterns of relations
among variables do differ by situs and that these differences are found-. . .
for 111 age grbups. The following discussion focuses On men" presumably,'
established in their careers--ages 36-45, 46-55, and 56-65--because situs
differences are most pronounced for,tfiese groups.
%.
4 /

15..
Table 4 shows.that mean education prestige, end income are low,',
.. ,.
for all age groups in Realistic workbou 10 yeare'of education,
34'restige points and $9,,000), intermediate for men itlled0040pionar.7 ...
t*.I..-
work kabodt Nyears,-47 prestige points,' and $11,000), andlit4gh for .-
- ,
1 . ':.* :41: ft, 9
Men in Investigative work" (14 years,,:59' prestige Points, ana'1116,060)::
.
However, the pattern shifts with Social and'Enterprising work.` a the. 1
.9
average, men in the Social situs arehigh in both education and preti-0.
' but only intermediat
are intermediate in.. j
in income. In .contrast, men in Enterprising Work '
ducation and prestigt,41?ut relativelY high in income':
Men in the Social situs have higher prestige on the average than4do men
, e
in Enterprising work,_ but they earn only three- fourths as muchinoney..
I, ..
.,. .
n ;,
Insert Table 4 About Here.
These mean differences accord with our gnval\'mpressions of the
occupational world. Almost' all laborets,vfactpry operatives, anAther
\-- ...... .. ..... ,...
.manual workers are found in Realistic work. 'Many orthese.jObT require ,
.., -,
. -, , ...
, .. t c,,,_
/4 .41.,;,1, li e abillty, education, or expeaence, and they yiela little income.1 ' .
.
or prestige. In contrast, Investigative WOrk'inclndes 40st sci ntifie, .,., .
lA
medical, and technical work. The Investigative jobs of physician,
mathematician, or physicist,epitomize occupational success in the eyes of
o4,
many people! The work requires considerable skill and-educationtend
yields considerable income or prestige. The deviations frotil the expected.
p'attern'also accord.wit110,15r impressions of the occupational structure;-
>
14)anyworkers in the Social situs, such as teach e s and social workefslo ,-
"'have a college education but earn. relatively 1 salaries. Also, many,4
salesmen and businessmen (Enterprising workers),with high incomes do not
- - 22

ae
.4"---)
1
ti16
4
seem to be accorded the social esteenr thaeLmight be expected on the basis
Of their incomes.'
Table 5 shows the correlations between education, presti and
income and Table 6 shows the standard deviations of these variables or
men in each situs. Differences among Realistic,, Conventional, and-
0 tInvestigative work are consistent witha one-market model but the dataN
.."!"
for Social 4nd Enterpfising.work Tresent quite a different pattern.'
Correlations Along education, prestile, and inCame are somewhat
higher in ConVentional that n inc'Realistic work. The..,correlations are
-evedhigher in Investigative work, but the patterns o-correlations are
. ., 04
similar in the.three situses. Education and income are correlated in. :-.
the .30-'1 in Realistic and Coriventional work, but in the .50's in,
s 4
Investigative cork. The, correlations orprestigIrwith education are
about .4D in Realistic and Conventional work, but .70 in InvestigativeA
work; the correlations of prestige With income are .40 versos .60.5
J
Insert Tablev5,About Here.
These correlational,differences are partly a fun tion of the differ-
ences'fn.stanaard deviations among situsea of work. Table 6 shows that
the variation in the three variables in,question is much higher in
Investigative work than in Realistic or Conventional work. These,
situses could theiefore be conceptualiiedas groups subjett t the same
income determtnation processes but with different ranges of education,/
prestige, and income. In other words, a one- m.rket model for Realistic,
Conventional-, and Investigative, ork cannot be rejected simply on the
23
os9
s
17
basis of correlational differences. However; other data presented later. ,
.., .
do provide an explicit reason to question the appropriateness of a one--A
market model for these situses.
Insert Table 6 About Here
Alt
'Other, Afferences correlations are npt consistent with a one-
market model. Table Yqhows.that education and prestige are as highly
correlated in Social'as in Investigative work, and-Table 6 shows that
the yaAation in these two variables is also relatively high'in.bdth
situses. At the same time, there is surprisi ly'little variation
. .
in income in-the Social situs, and the oorre atifons of income with
/ /-------,
10--ttan in0Spvestigativeeducation and prestige iare much lower--abou
work. In other words; there is considerab a lariatioo in-both education,
and Prestige in,Investigative and Social
is associated with high variation in inc
the first situs but with relatively lit
the second.
The.resulti fOr men in. Enterprisi
in education and prestige, is rdwer
similar instead to that in Realisx
variation in income is comparable
As would be expected froti-the
in Enterprising, Work, the corn
not high--about -30 to ..40:1
In summary, the means,
patipns, but this variation
and a high mean income in
var Afton and low income in
are different. Variation
nvestigative-Wrk--and is
OnVentional work--but the
of men in Investigative work,
ation of education and prestige
'among the three variables are
deviations, and coltationakOf
`It
u
184p.m
education, prestige, and income are progressively higher in Realistic,
Conventional,, and Investigative work. The means, variation, and
correlations of prestige and education are high for Men in the Social
,situs but their income is relatively low, homogeneous and onlYWeaely
correlated with education and prestige. On.thei,other hand, the high
level and variation of income in.Enterprising woik is accompanied by
Only moderate means and variation in educatiorwarid prestige.
These differences in patterns among the varrabled,suggest Oat
the same variables may play, different toles in determining infome in
the different'situses. For example,,education seems to make less
difference for income in the Social than in the Investigative situs
because the high level and variation in education is matc4td by a
correspondingly high level and variation of income in the latter but
not the former Atus. Regression coefficients are often used to esti-
mate the effects of different income determinants, so they were also
examined.. The. simple Model used here is not a comprehensive represtn-'"--:.._
.
tation of income determination processes, sb the regression coefficients .
r. . ..
are not intended to be accurate estimates of,the camel importance of
each variable. Instead, imy. objective iskto show that variation 1:.? situs
in regression coefficients is more dramatic than variations'obtained
by adding More ariables-to one - market models.
Table 7 shOws the unstandardized regression coefficiensand the!
proportion of variance (squared multiple correlatiOn or R2) accounted
for by Wegression'equations in the.20 age-agd situs groups. The table. .
shows that an additional year of education generally is associated'
;with an additional' $200 to $300 per year in ligalistic and Social
.1
25
I ,

19
occupations, $400 to $600 in Conventional and Investigative work', and
about $1000 in Ehterprisin _Work. When a single model is used for all
situses, a year of edication is associated with---a-n--a_clational $400 to
$600, depending on age. The coefficients for prestige also differ,
indicating that the relati n of income to prestige differs by situs.
These regression coefficie ts indicatelthat-,thg relation ranges from
. .
Oop per point of prestige in Investigative aork to under $100 in he ,
, ....
Social situs.
Insert Xabie 7 About Herb' J
NNote how large these differences are% Th. c fficients for '
. 4
educati are gene ily twicvas large in Investigative and Conven-
.
tional work and four mes as large in Enterpr ising work as.y .4
are in Realistic and SociallOccupations. Th',9A ArgeOlifrecenZes are.. -
1.
replicated across the three' oiliest age,go5ups. Other eyes on the..,
P ...'""', returns educatiop,patalW till4 present results for all men; they, , .,
often fi that-aritadditio 1 year of education is ated,with4.
l' .,)
/t7 .
_ . an additiona1 5400-$500 i earnings or, a.
4-6% in- rease in income,-
e %'
(Ostcrtan 197 Thea%tstimates generally va y by ,10-40'7. hen 4
e /.-__
theoretically important variables finch as abili and social back-. ,..
. .
ground are mitt? from income determination mod (Griffin 1976;
Wolfe 102). The'difference.in coefficieniNMong situses fndicates,.. -.1-
t
r-11.-"that orAteing occupational situses or markets 6/tsa Much stronger
bias on/ estiMioes than does omission of the-variablestypically. ...
4.
stbdied. A
26
,

20 <
Iry
The severity of this apparent bias has important policy impli-
cations. For example, it.would be misleading to say that.a year of ,
education is worth $500 if it is.worth $2610 in some lines of work but
$1000 in others. Regression results from men in all occupations
pooled together might indicate that job training is more useful than
additional years of schooling for increasing rncome. However, it
would be unwise for manpower training policies--say, for minorities--
to routinely emphasize job training rather than formal educed= if
job training is less important than staying in school for advancement
in some occupational situses. It would.be particularly unwise if
these were also the best-paying situses.
Pattern of Situs Differences
Income and prestige differences amoqg groups of men at different
educational levels were also examined. These comparisons reveal a
striking pattern of situs differences not evident in regressiono
4
analyses. The major differences among the situses are illustrated
in Figure 1: This figure includes education, prestige, income,
and situs SQ. that it shows relations among all four,variables.
V.
Differences among men in the thrbe oldest 'groups aietelatively
small so data for men 36-65 have been pooled to simplify presenta-,?
tion.
\ "
Insert Fi ure.1 About Here
Figure 1 shows. themeaniprestige and income of 20' subgroups of
27.Ry

f
21
men:.,four educational groups (9-11, 12, 13-15, and-16 or'more years)
within each of the filfeaituses. The means for the %four educational
groups within each situs are connected by a line--one line or eafh.
situs. The mean years of education completed is'about 10.1 in each
of the five 9-11 year educational groups and about 13.9 in each of
the 13-15 year groups. Men with 16 or more years (presumably college
graduates):tlibwever, vary in mean years of education from 16.4 in
Conventional work to 17.4 in the Social situs. Therefore a broken
circle is shown for the thee situses where the mean differs consid-
erably from 16.4 years of.educ4tion. This circle represents an esti-
mate of what the mean income and prestige Would bfor men with 16.4
years of education.
The sloP'e of the line for each situs can be conceived of as depic-
ting the mixture of increased income and, prestige associated with an
increase in education: The figure illustrates one particularly
important situs difference.:-the mixture of prestige and income
associated with higher education varies markedly by situs. For
example,' more educationAn the Enterprising sitds is associated
with large increases in mean income but not in occupational prestige.
In contrast, more education in.the Socialsitus i$ associated with
large increases in mean preitige but not in income. The.ratio of
increases in mean income to prestill from one educational level to
,another is approXimately $150, $300, $500, $600, and $1200, respec-,:
tively, for pen in Social, Realistic, Investigative, Conventional
and-Enterprising work. Figure 1 also suggests-that this mixture (the
ratio Of-increates'in mean income relative to mean prestige) does not
A
1

40.
22
change much with'increasing education. This can be seen in Figure 1,
for the s lopes of the lines are fairly constant in all but the Inves-,
.tigative situs. -
These results illustrate some of the pro ems of comparing the
effects of education on occupational aehievament,in different popu-
A
o' lations- Education may appear to have the same effect pn prestige
(or income) in different situses, but a different. effect on income4
As.
(or prestige). For example,'men with a college education (for this
example, men with 16.4 years of education) are on the 'average 104
points higher in prestige than men with 13-15 years of education
(14 years on the average) in Realistic, Social, and Investigative
work'. But these differences in education an prestige are associated
with average income differences of $4000, $2000 and $6000in the
same situses.
The foregoing results are based on conventional measures of,
achie'rement and methods of analysis in status attainment researdh.
They indicate that slitus differences do exist, that ehil differences
are large .and consistent, and that they make sense intuitively-.
The_exact nature of situs differences can be determined only by
4 further analyses which take account of,measurement error and addition-
al Measures of monetary benefits and job.characteristics. However,
_ -
these preliminary results suggest that such research would be a... , .
'rewarding next step in stratification and mobility research..
29 .
r
8.

23
Implications-
The one-market model of occupational achievem4t is a one-dimen=
sional model of man and a one-dimensional model of the Occupgtional
_ .
structure; wOrkera_are Ordered in a single queue by their desirability
usi
fto "' iployers" and jobs by their desirability to "workers" Researchers
usi the model acknowledge that it is a simplified model of reality.
The value of the present analyses is'not that they demonstrate theAo.
obvious multi=dimensionality of the real world, but that they demonstrate
how the one-market model is deficient°and suggest a more-useful and com-
prehensive peespective./5-
Some theoretical and practical social impli-
cations of the research are discussed in the following sections.
An Alternative Paradigm,00
The change in conceptualization of occupational inequality
suggested here is not another extension or amplification of the Blau-
Duncan (1967) status attainment model; it does not involve adding situs
variables to current one-market models. It is a restructiring of
thought: the assumptions about people and jobsare different, new
quesiOns'are raised, current research techniques are challenged, data
are interpute# differently, and some previous anomolies'-are clarified.
Some common assumptions Of research on occupational ineTiality are
'reviewed to illustrate that a shift in ap proachis involved.
Despite admissions that a one-Market model is'too simple, the
basic assumptions of that modelcare ingrained in much thinking about
occupational achievement., Two such assumptions are that people can ber_
ordered on a single scale of ability or intelligence, and. that a single. ), ;
value can be assigned to the useful s of social resources such-as
."1:1414N,

24
os.
education for securing income and prestige.
Research,
on otcupatiOnal lnequalitygenerally ranks people along
a single scale of intellectual ability, this dimension being'rererred
to as int lligince or ab'i'lity' : The most heated recent debates
about the measurement of intelligence have not been whether people
should be ranked along a single continuum, but whether different methods
are fair measures of that one ability continuum. Intelligence as usually
measured reflvtg competencies valuable for succeeding in the reading,
writing, and reasoning required for academic, scientific or clerical
pursuits, but it does not adequately reflect otherdo
ains of talent-
that are necessary for superior performance in managerial, leadership;
sales, ministerial, social service, or artistic-.-occupations. It is
p ;ecisely those sitUsga requiring talents for dealing:with people'
rather than with data or thingsEnterprising and Social 7 -that deviate
most dranitically from a one-market model of occupational-achievement
that incprporaies academic achievement (years of.education.completed).
IAlthough Jencks (1972) has been ididely quoted for his hypothesis?that
luck accounts f6r much difference in achievement, his suggestiontthat
nom-cognitive abilities are important (chapter4) has been ignorecic-
t
Earlier studies by psychologists (Baird 1976; Munday and Davis 1974;
Richardsj970) have identified a variety .of non-cognitive and non -aca-
demic abilities and po can provide valuable information for studies of--
differential occupational achievement.
t.,Related to this one=dimensional treatment of human talents are"
continued efforts to provide the most accurate single estimate of the
value of education and of other social resources for obtaining and
31'

25'
advancing within occupations. ,My analyses imply that there is no.single'
value (cf. EckausSafty, and Norman 1974) - -the value varies by a factor -
of two to four dependingion the occupational context. Therefore, questio s
about the_relation of educatiorho work should take account of the dilier
sity of talents and labor marke s. For example, which-skills do schools
foster; I select? Do college-a and secondary schools vary considerably
/ , (-
in the.types of skills they foster or certify? Do particular schools, or-
schools in general, orient and train)geople fdr some labor markets but
not for others? Has increased college attendance increased competition
for jobs'in some situses but not in others--for example, in Investigative
. but not EAtei.prising work? In short, analyses of the value of education'
or any other social advantage should take account of di.,fferencep in the
A
occupationalAttings in which workers are att'empting to convert their.
advantages into desired outcomes. 1
Social Class
Most research on'OccuPational inequality assesses an individual's
socioeconomic statu by assigning a score-from:4escale of prestige,
income,, education,' or some combination olf these variables. An alter-
...native approach has been to characterize individuals according to
. their membership in different social classes, these classes being
ordered hierarchically.- Theories of social class assume that people
who share the same socioeconomic fate may actually 'constitute a groupA 1,
because of their associations with one another or through their, similar. .
role in the.productive system (Marx 1893/1967'; Weber! 1946). These ,
A*
theories therefore emphas ze the growth, development, and interactions
of social groups rather than the attributes of individuals.

260
The following assumptions about situses are consistent with concepts
of social class. People in the different situses Perform different
functions in the productive system; they have different values and
world views; and they-associate Are with pebple in the same situs than
with- workers in other situses. (They socialize their children to have
different values,4nterests,, and competencies, and they expoae thelr
children-to different job information and opportunities. So not only
do the adults tend to be mobile within rather than between situses,
but their children are also likely to enter work within the same'
situs
as the parents. In brief,. situs may be a barrier to horizontalmobility
over careers or over generations of workers.. It also helps to explain
the apparent social distance between white-collar workers such as
clerks.(Conventional) and salesmen (Enterprising) and blue-collar -
Workers (Realistic), despite their simil4gi socioeconomic status.
The situses are not hierarchically ordered to the degree usually
assumed for social classes. The situses overlap considerably in.000me,
_education, and prestige. Nevertheless, Investigative, Social, Artistic,
-and some Enterprising workers can be considered four social elites,.
with Realistic and Conventional workers'constituting the bulk of the
labor force. The situses are to some extent competing interest groups
.__
with different bases of influence. For example, in our society. the
power of the Enterprising situs is based, on money and the control of
most production, that of the Investigative situs on the mystery and
practical usefulness, of higher knowledge, and that of the Social situs
on its maintenance of.educaticlon, health, sand the socialization, of the
young.
0 e33
(
27
Ito
The comparison -of situses with social classes is made to demonstrate
that divergent,,theories of stratification can be integrated. Both
.functionalist and conflict theories, for example, are consistent with
the discussion of situs differences.( The comparison was also'made to
show stow studies of group processes bofh inside and outside 'sociology -
networks, 4nterest groups, socialization, the development of elites --.
Oican contribute to'a broad theory of socioeconomic differentiation.
_ .
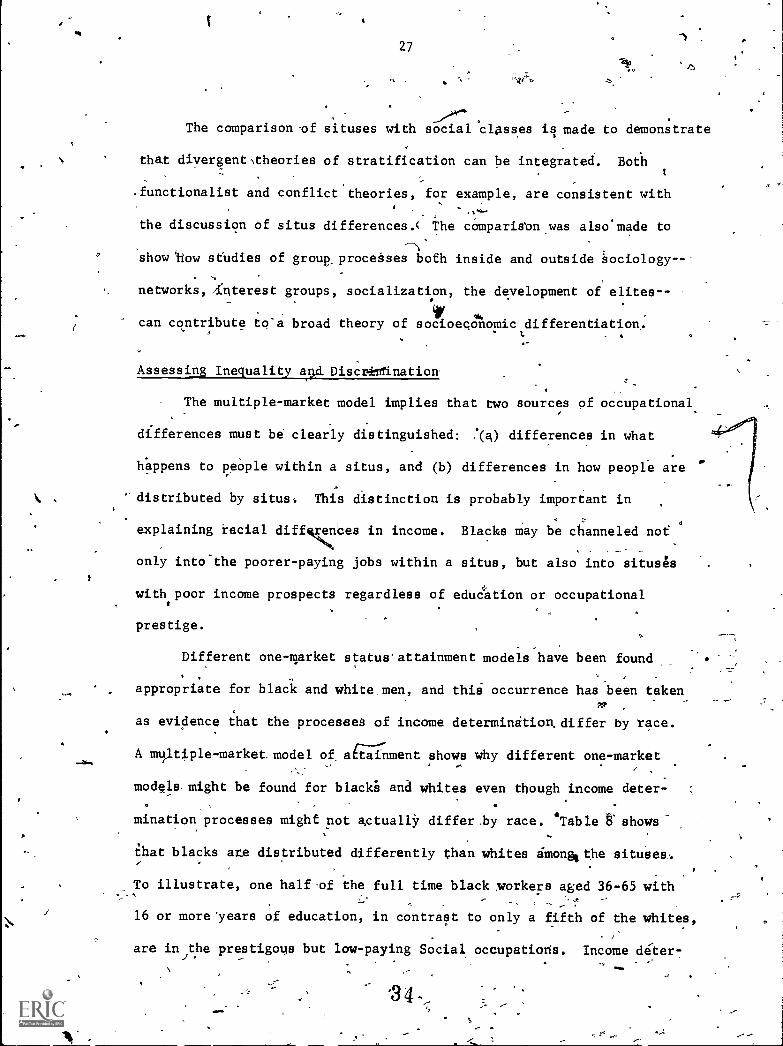
Assessing Inequality alp. Discr4n1ination
The multiple-market model implies that two sources Of occupational
differences must be clearly distinguished: :(a) differences in what
happens to people within a situs, and (b) differences in how people are
'distributed by situs, This distinction is probably important in
explaining racial diffv<ces in income. Blacks may be channeled not
only into the poorer-paying jobs within a situs, but also into situses
with poor income prospects regardless of edudation or occupational
prestige.ti
Different one - market status` attainment models have been found. ,
appropriate for black and white, men, and this occurrence has been taken
as evidence that the processes of income determination, differ by race.
A multiple-market. model of attainment shows why different one-market
models- might be found for black; and whites even though income deter-
mination processes might not actually differ .by race. 'Table leshows
that blacks are distributed differently than whites imonggthe situsea,.
To illustrate, one half-of the full time black workers aged 36-65 with
16 or more-years of education, in contrast to only a fifth of the whites,
are in the prestigous but low-paying Social occupations. Income dater -
.3 4

"*.
_38 %WO
/r.
mination'salso differs by situs, so we, would expect a comparison ofall.
white and all black workers to reveal differences in income determination.
by race. However, if we compared workers separarely by situs, income
determination processes might be similar for blacks whites within
some but not all situses. For example, income dete mination might be
Similar for men of both races in Realistic, Conven ional, and Social
work, but not in Enterprising or InVestigative worlt. Special attention
could then be, devoted to the latter situses.
Insert Table 8 About Here f .
The multiple-market model also implies that some come and pres-
tige differences are voluntary., Sot* people prefer Social' occupations -
despite the low pay; others would tot enter EnterpTising jobyespite
*obvious income advantages. Aspirations diner by Sex and race, both
women and blacks more often prefering the Social situs of work than
do' white men (Nafziger et al. 1974; Gottfredson, Holland and Gottfredson
1975). If blacks and women differ from white men in.the jO1;s they want:,
then we cannot say'that all differences in the jobs they actually get
reflect social inequality or discrimination. Certainly many race and
sex differences in occupational achievement are not by choice. But
neither should we reflexively equate social differences with inequality
or discrimination. If some occupational differences are voluntary,
.,:'
then it is important to evaluate differences in aspirations for situs.
.
.
of work of people entering,
the labor force and to examine when and how ..
these differences in aspirations develop. Differences in aspirations
3 5
a
c
./

A1
29
not only present technical problems for measuring discrimination by
sex or race, but as the forring discus orr makes clear, they also
present ethical problems in reducin: inequality.
.00
Reducing Inequality,
The Multiple-market model as implications fop changing occupaiionalc,
inequality. The model suggests that if the occupational structurews,
remains cons ant, income differences betwee4,bjacks and wftites and
'between merr and women will not'be eliminated unless the distributions
of these group across situses ane equalized. The difference's in
distribution by sex and race are probably the.result both of choices
by,job applicants and by employers. Therefore, both -hiring practicep .
and the aspiratiogs of jobseekes would have to be changed. Employers
are under pressure to change hiring pradtices and to increase recruit-.
ment of minorities. But efforts to change aspirationslorpoteutial
appLcants are infrequent andTcontroverslal, For'exaMple, effo'rts to
manipulate scores to-eliminate differences in the mean profiles of men
and women taking.vocational interesierinventories,ave aroused onsiderable
debate (G. Gottfredsdn 1976). Any attempts to change--or ignore- -
differences in the socialization of men and women and of blacks and ,
whites involve the ethics of .manipulating people in ways to which they
or their families might rightfully object. Some interventions would
be less objectionable. For example black high,school students might
be exposed more often than they now are to work experience, job infor
mation, and role models in managementAnd stales-work; and so be more
likely to enter and prosper in Enterprising work at all levels.4
Although changing the distribution of women and blacks by-situs
36..ti
-,

fik
-
4
-t
A'30
It
o
may be useful ino,the short run for reducing income differences by race
and sex, it would not modify the overall occupational tructure and so
would not modify the great differences in material 1 being experi-.
enced by people' in our society% Incomes would still vary considerably
both within and between situses.
//However, the discussion of simis differences suggests that the
elithination of all differences in income, prestige, or ()her occupa-
tionar.rewardsis not necessary for a fair society. A comfortable
level of well being should be available to all-workers, but beyond
that level people should be able to. pursue different goals. Jobs,might
differ inhe mixture of rewards they provider:money, prestige, adto-
nomy, interests and competencies fostered- -and they might differ in
the life styles and world Views they encompass.
Origins of Situs Differences
The appare_nt situs differences in income eterminprobabily;
cannot be accounted fof by more extensive one- market models. InStead,
situs differences may originate from variations in occupatiohalrewvd '
systems, s ch,as in criteria of evaluation, source of furids, and
fcompetencies'required on the job. The present data do not allow a test
of the following speculations,, but they are offered to restructure
thinking and.40bthote research about the relation of job and personal
characteristics to income. They are also offered as examples of-labor
market characteristics which should be examined in future research on
income differences. These speculations are all based on the observation
that workers in different situses perform different or
functions.
37'
4

9
31'
Criteria for Evaluating Job Performance
The contrib4ions diet. managers and sales en (Enterprising workers)
make to their organizations are quite variable but often easily quantifiable.
One salesman} orimanager may commit a company to unprofitable transactions
whereas anotheF may bring enormous profits to the company--both seriously
iniluending 4e viability of the company. Income for these.Enternising,
workers is p oen based on the dollars that they bring to their rganize-,
tions. Beciause the variation in .effects of workers is great, the varia-
tion in iticomeis also high. In contrast, the effects of workers in
Realistic, Social, and Conventional work are less variable or more/
difficult toevaluate. For example, most accountants and clerical.
c
person, el probably have less variable effects upon their organizations,
/
,
and e consequence of this fact is,that incomes do not vary much either.o
11In t e Social situs outcomes or marginal'productitity may be quite
able but hard to evaluate. Administr ,tors, researchers, and
blic officials all attest to the diffi&ilty of evaluating social
service programs. Unable to discern variability in effects, employersL-,
ay pay fairly uniform salariks.
Source of Funds;
' 4
flterprising workers.probably are found. largely in private businesses
which derive their .ncome directly from individual or organiiation4
consumers. These saes to some extent are able to modify their
activities to produce goon and serviceeto suit the preferences of4
current or; potential customers, and therefore to maintain profits and
provide high pay to motivate their managers and sales staff: In contrast,
most workers in the Social'situs provide services which are designated
384
,-/
32
by profess,ionals and public officials ii-necessary for the health and
welfare of citizens. These are the servicesfor which consumers either
will not pay - (public health services), cannot pay (welfare and rehabili-.
/'''TtAln services), or are not expected to pay directly (primary,ando
's,econdary education). Reyenues for these services are not directly
related to public demand and the activitiesare generally funded by,
non-profit or Voluntary organizations or by'gevernment. Th4se funding,
agencies are not likely to raise much'pore money than absolutely
necessary to maintain services.- Furthermore, an increase in demand for
goods and services means increased revenues in the private sector but
it means a strain on already limited budgets in the public sector.
Asa result,, the general level of friEbme for providers of social
services is low and fluctuates little if at all with changes in
demand for services.I
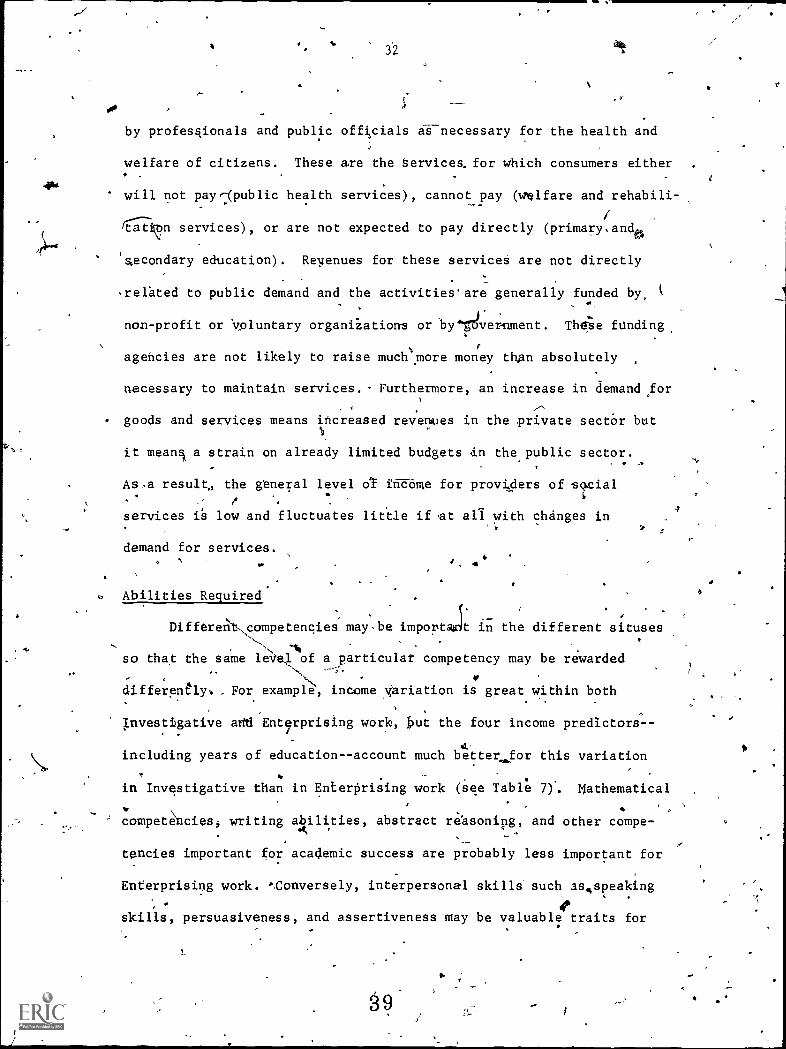
Abilities Required
4
DifferelitNcompetencies may-be important in the different situses-...
.,
-ti, .
so that the same 100 of a particular competency may be rewarded-..,,
differently,, For example, income variation is great within both. '.
Investigative add Ent,rprising work, but the four income predictors--, .
including years of education--account much be4 tter for this variation
in Investigative than in Enterprising work (see Table 7). Mathematical
competencies, writing abilities, abstract reasoning, and other compe-
tencies important for academic success are probably less important for
Enterprising work. 'Conversely, interpersonal skills such as,speaking
skills, persuasiveness, and assertiveness may be valuable traits for
39.

41.
414
managers and salespeople (Enterprising Work) but less so for scientists.
wand other InvestigatAve workers., iThese speculations are consistent
With evidence (Ghiselli 1949) about the differential,validity of
various aptitude tests, in different occupations. The validity of
academic aptitudesor predicting occupational success differs
consistently and substantially among occupations.-, /
Both;occupational and personal characteristics are imports* in
-explaining indome Aifferences. My analyses do not reveal the degree
to whieh each set of characteristics prockces..the observed situs dif-
ferences in income. The evidence1oes suggest, howeyer, that job
attributes are important and should receive more attention in the
future. The evidence also implies that income differences depend upon
the paiticular combinations (or interactions) 'of person and job charac-
0 .
teristics, and that'thorough studies of occupational achievement must
,
look not,only at the natu e of the competitors for..jobs but also at
the nature of tie compet ions they enter.
4
40
4444 \
6
a

166
0
34
Footnotes
1. The term 'situs has been used inconsistently so a definitylt is
necessary. Benoit-Smul/yan (1944) advocated measOring social
. -position in three different ways: status (position in a hierarchy),
.situs (membership in a group), and locus (socially defined function/A*
in an organized group). Benoit- Smullyan's original use of the
words situs and loaus is noe'now common. Situs is often used
more or less vaguely to imply an non- hierarchical aspect of social
poSition. In4this paper I will use situs to specify the kind of
work orjob activities performed on a job, and status to refer to
the position of a job or occupation within an occupational hier-
archy. Situs will ferer to the function of art occupation or set
of occupations within the division of labor.
2. More extensive tables of results are provided in AppendiX,B and
id Gottftedsow(1976).
y
4
41,
4
t6-

'4 4
TABLE 1
Description of Personality Types and Work Environments
Personality Work EUV1ronment
6
t
Sample OccupationsRelated'Categories
Realistic
Has mechanical abilityland
lacks social ability; values
concfete things, power, money,
status. Is asocial, conform-
ing; frank, materialistic,
practical,' stable, and
uninsightful.
Investigative
Has mathematical and scienti-
fic aVility and lacks leader-
ship-ability; values science.
Is analytical, cautious, crit-
ical, independent, methodical,
rational, rtserved, and unpop7\4.
\*ular:
Fosters technical competencies and
achievements, and manipulation of
Mechankcal engineer
Plumber
objects, machines, or animals; rewards Auto Mechanic
the display of such values as money, Fork lift operator
power, and- possessions. Encourages
people to see the world in simple,
tangible and traditional terms.
Fosters scientific competencies and
achievements, and observation and
systematic investigation of phenomena;
rewards the display of scientific
values. Encourages people to see
the. world in complex, abstract,
independent,"and original ways.
/
Physicist
Weather observer
LabOratory assis-
- tant
TV repairperson
Manual
Skilled
trades
Mechanical
Scientific
Intellectual
43
In

TABLE 1 continued
. Artistic
Has artistic and musical
ability; values aesthetic,
qualities. Is complicated
disorderly,-emotional,
_pulsiVe, intuitive, non-
conforming, and original.
Social
Understands others and
has teaching ability;
values social and ethical.
'activities and'ProbleMs.,
Is cool)erative, friendly,
insightful, responsible,
tactful, and understanding.
Fosters artistic competencies
and achievements, and ambiguous,
free or =systematized wotk;
"rewards display of artistic-
values. Encourages peripie to
see the world in complex,,
independent,-unconventional,
and flexible ways.
Fosters interpersonal competencies,
and informing, training, curing,
or, enlightening others; rewards
the display of social'or!humani-
tarian values. Encourages people
to see the world in flexible ways.
_ 4 !
Editor
DecOrator
Garme'nt designer
Fashion model
Aesthetic
Cultural
Intellectual
Minister Education
Elementary teacher
Physical therapist
Ward Attendant 1
- Social Service
13

TABLE,1 continued
Enterprising
Has leadership and per-
suasive abilities and lacks
scientific ability; values
political and economic achiever
went; Is acquisitive,' ambitions',
domineering, energetic, optimis-
tic, self-confileni; and
talkative.
4
* ConventionAl
Has clerical and numerical
-ability; values business and
economic achieyement.. Is
conforming, coniqientious,
inflexible, inhibited, order-
ly, practical,%self-controlled,
and unimaginative.
_2--
.10
46
Fosters per asive and leadefshig_
competencies achievemenp,,and
the manipulatio of others for per-,
sonal or organiza oval goals; re-
wards the display of e tefpriting
values and goals such-=as money,
power, and status. Encourages
people to see the world it terms
of power,statns,,responsibility,.
and in stereqyped and simple terms.
-Fosters conformity and clerical)----dompetencies, and explicit manipu-,
lation. of data, records, or, written
material; rewards the. display of such
values as money"; dependability, con-
formity. Encourages people to seeP
the world in conventional, stereotyped,.
constricted,. simple,,and dependent
ways.
Lawyer
Contractor
Automobile
dealer'
Salespersone 4
Entrepreneurial
Business contact
Management
Sales
Political
Certified public, Clerical
accountant Business detail
Secretary
Timekeeper
Clerk
Bureaucratic
4
47

0
TABLE 2
1970,Employment by Situs of Work and Occupational 'restige
(Thousands of Workers)
Situs Occupational Prestige Level /
of
Work 0-9 10-19 20-29 30-39 40-49 50-59t
60-697
704
Realistic 433 5,1 7
41te i,Investigativ .,...%
..
Artistic, . ! .
Social 228.r
.128.
0 Aols 4,-
Enterprising 64,
CoAgentional ..- 56
°
1,1,081
--
.
296
f59
1,694.
11,613
612
22
0
1,738
3,743
4,309
'
5,265
813
232
.
1,018
,4;112
5,701.
330.
210
.347
1,546.- , f
1,28
17.
433
1,446
t.
277,7r-a,77<
, 3,199
1,867
711
610
.-95
241
280'
14
4
Source: Gottfredson (1976)
.416
m .
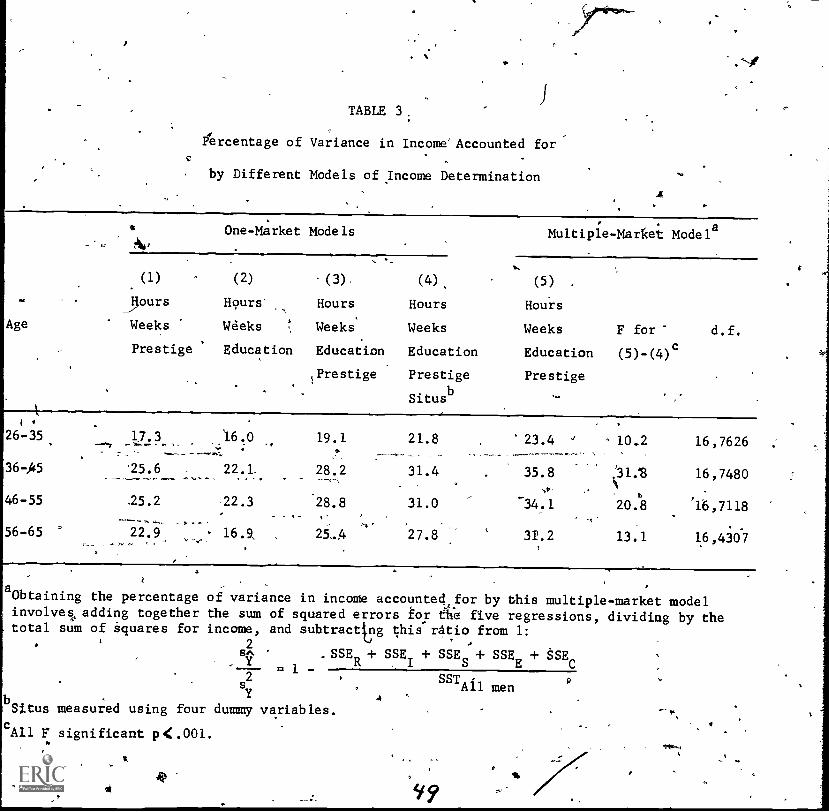
TABLE 3.
Percentage of Variance in Income' Accounted for
by Different Models of Income Determination
NY
Age
One-Market Models Multiple - Market Modela
(1)
jours
Weeks
Prestige
(2)
Hours-
Weeks
Education
_
(3) . (4)
Hours Hours
Weeks Weeks
Education Education
,Prestige Prestige
Situsb
(5)
Hours
Weeks F for - d.f.
Education (5)-(4)c
Prestige
26-35. 17.3 1.6.0 19.1 21.8 23.4 - 10.2 16,7626
36 -45 25.6 22.1. 28.2 31.4 35.8 16,7480
46-55 .25.2 22.3 28.8 31.0 -34.1 20.8 6,7118
56-65 * 22.9 16.9 25,.4 27.8 3r.2 13.1 16,4307
aObtaining the percentageinvolves, adding togethertotal sum of Squares for
bSitus
of variance in income accounted for by this multiple-market modelthe sum of squared errors for the five regressions, dividing by theincome, and subtracting this ratio from 1:
2&A. .SSE
R+ SSEI + SSE + SSE
E+ SSE
= 1 -s2
measured using four dummy variables.
cAll r significant p4(.001.
I
SSTAi1 men
9?O

I.
TABLE 4
'Mean Years of Education, Prestige, and Income: By Age and Situs-ot Work
Education
Situs
of
Age
Work 26-35 36-45 46-55 56-65 .26-35
Real 11.2 10.5 10.1 .9.4 34.7.
Inv ; 14.6 14.5 13.R 13.0 %'*55.'5.-
.
o.
Soe 15.5, 15.2 14.2 13.7 057.0s
Ent 13.5 13.2 12.8 14.1 ,:.49.3
Conv,,, 13.7 13.1 ° 12.7 12.2 ° 48.0
Prestige Income
Age Age
36-45' 46 -55 56-05 26-35 36-45
34.9'
61%2
5
'34.3 3 .3 8,348
513.6 7.7 a 11,515
2 53.0 8,925
/692.).
15.,855
10;580
` , '..:-,-'7'"-----.
49. 49.40 -1-48.7' rk. 553 14;346
47.7 7.46-..,45.9' 5 10037g ,
.
.
6! 3
.
s ....
\ ,,
46-55 .56-65
8,779 8,009-
16,025 14,758
1,265 10,783
15,100 14,296
11,386 10,331
50
-4.- e
4!"
a 4.

. TAI312-5
Correlations Among Years of Education, Prestige,.
and Income: By.Age and Situs' of WOrk
SAus
oft
Work
Education and &come -Education and Prestige Prestige and Income
Age Age 40"
26-35 36-45 46-55.56-65
Age
26-35 36-45 46-55 56766 2.6 -35 36-45 46,-55-56-65--
4%
I0 'Realistic .29 .31 .33/ .23 .35 .38 .35- .27 .36 .38 .39°, .39
/
eInvestigative. .33 .4 .59 .52
.
.74 .77 .75' .76 .37 .63 .65 .59
Social ' .09 .22 5 .26 .68 .73 .67 .74 .10 .2.2 .29 .31
Enterprising .28 .39 .36 .35 .42 .39 .39 .34 .24 .33 .29 .31
Conventional .38 .36 .35 .37 .55. -.40 .38 .44 .31 .29 .38 .37

N
tr
TABLE 6.
Standard Deviation of Years of Education,
Prestige, and Income:.
ByS
Age and Situs of Work,.
Situs
of
Education Prestige Income
Age ,Age" Age
Work 26-35 36-45 46-55 56-65 26-35 36-45 46755 56-65 26-35 36 -45 46-55.' 56-65
21'
Real 2.4 2.8 2.8 2.9 ° 9.5 9.8 9.5 9.5 3.,654 .4,18 4,315 3,995
Inv ' --2.8 3.2 3.7 4.,1 14.3 15.3 '15.6 17.0 6,549 10,366 10,844 11,644
Soc 2.5 3.1 3.6 3.9 10.9 12.1 12.9W 133 '4,265. 5,102 7,227 7,028.
41Ent 2.5 278 3.1 in 9.6 9'.8 10.0 6,843 v-9,239 10,564 11,092
2-r-5- 2.7 2.5 2.6 X10.3 9.4 9.6 9.7 4,006 6,099 6,216 6,003con
wotb" -. t.)
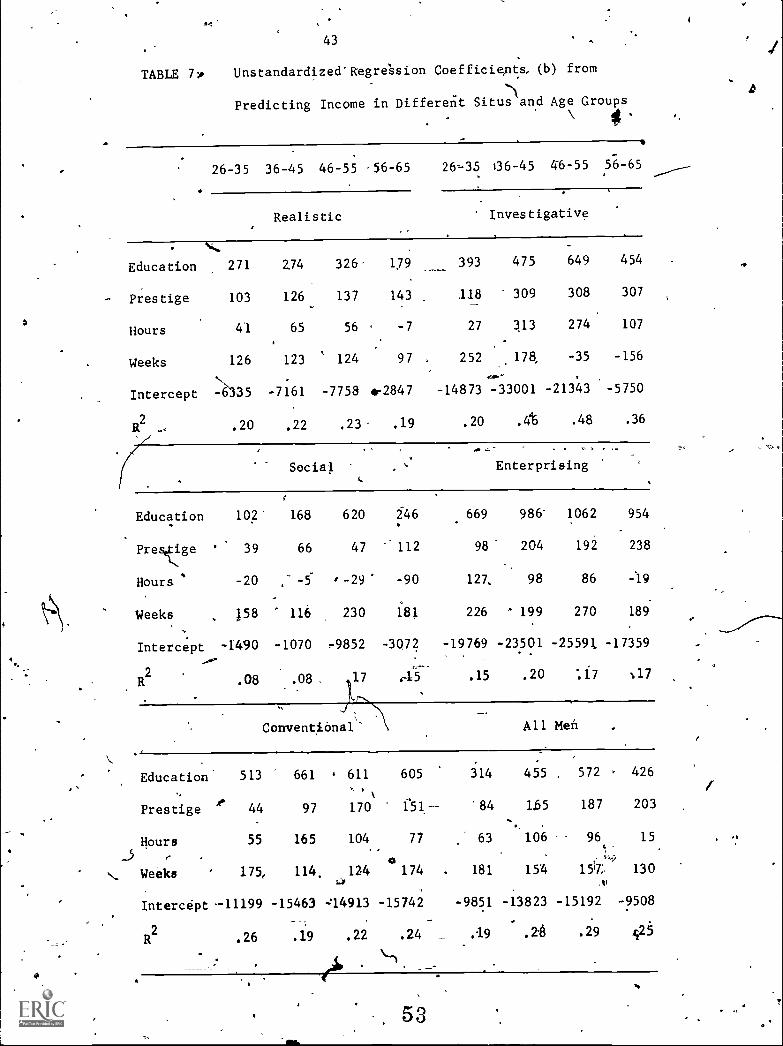
43
TABLE 7A Unstandardized-RegrAsion Coefficiepts, (b) from
Predicting Income in Different Situs and Age Groups
.
26-35 36-45 46-55 -56-65 26=35 66-45 46-55
Realistic Investigative
. %..
Education 271 274 326. 179 393 475 649
Prestige 103 126 137 143...
.118 309 308
Hours 41 65 56 . -7 27 313 274
Weeks 126 123 ' 124 97 , 252 178, -35
N, ...- ,.
Intercept -6335 -7161 -7758 i2847 -14873 -33001 -21343
R2
.20 .22 .23. .19 .20 .4`5 .48
Social Enterprising.
Education 102 168 620 246.669 986 1062
Presetige 39 66 47 112 98 204 192
Hours ' -20 ,-29' -90 127. 98 86
Weeks 158 116 230 181 226 ' 199 270.
Intercept -1490 -1070 -9852 -3072 -19769 -23501 -25591
R .08 .08 , 17 .15 .20 :17
56 -65
454
307
107
-156
-5750
.36
954
238
-19
189
-17359
:17
Conventional:- All Moil
Education' 513 661 . 611 605 314 45 572 - 426/
Prestigee
44 97 170 f51.-- '84 1.65 187 203
Hours 55 165 104
_5 r
\,. Weeks 175, 114, 124k>
Intercept -11199 -15463 :14913
-;
R2
.26 .19 .22
77 63
a174 . 181
-15742 -9851_.
.24 _ .19
106 96 15 ,`.4
154 151i 130ti
-13823 -15192 -9508
.21% .29 0
53
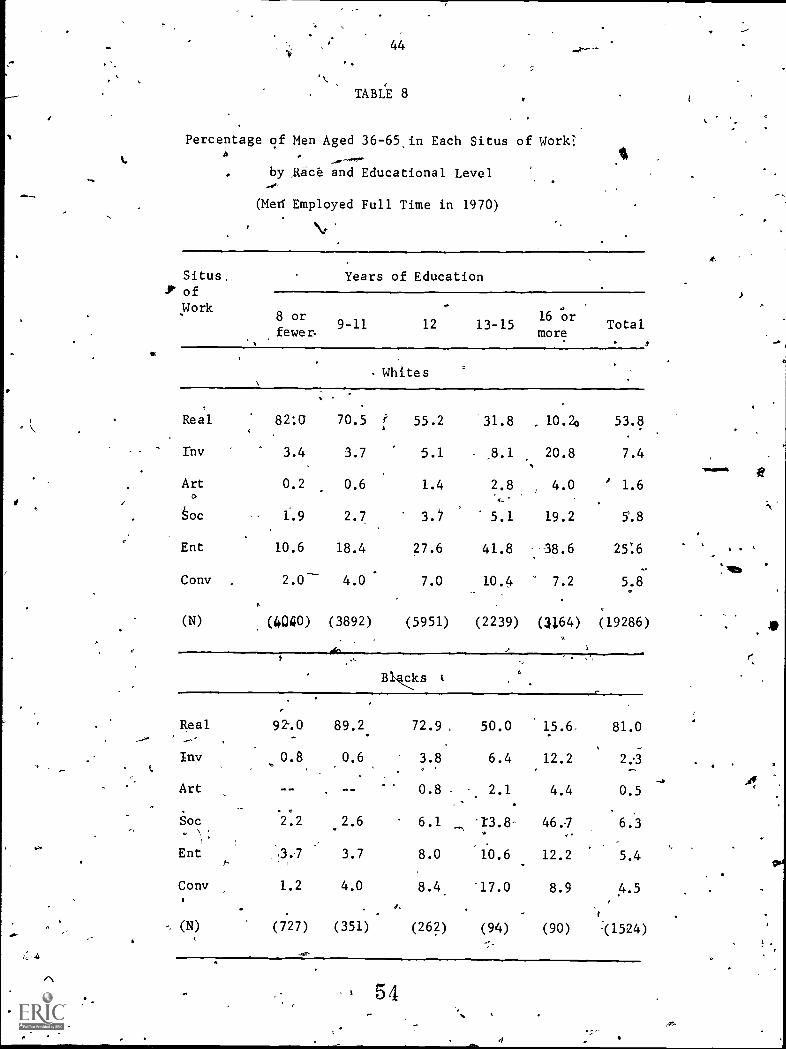
4
44
TABLE 8
Percentage of Men Aged 36-65.in Each Situs of Work:a
by Aice and Educational Level
(Med Employed Full Time in 1970)
Situs.
ofWork
.
Years of Education
8 or
.
fewer9-11 12 13-15
Whites
Real
rnv
82:G
3.4
70.5
3.7
55.2
5.1
31.8 ,
8.1
Art 0.2 0.6 1.4 2.80
hoc 1.9 2.7 3.7 5.1
Ent 10.6 18.4 27.6 41.8
Cony 2.0-- 4.0 7.0 10.4
(N) (4040) (3892) (5951) (2239)
Blks
Real 92-.0 89.2 72.9 . 50.0
Inv 0.8 0.6 3.8 6.4
Art IN . 0.8 2.1
..Soc 2.2 6.1 13.8-
t
.2.6
Ent,-
3.7 3.7 8.0 10.6
Cony 1.2 4.0 8.4 17.0
, (N) (727) (351) (262) (94)
r^
16 or
moreTotal
10.20 53.8
20.8 7.4
4.0 ' 1.6
19.2 5.8
38.6 25:6
7.2 5.8
(3164) (19286)
15.6 81.0
12.2
4.4 0.5
46./ 6.3..
12.2 5.4
8.9 4.5
(90) -(1524)
54
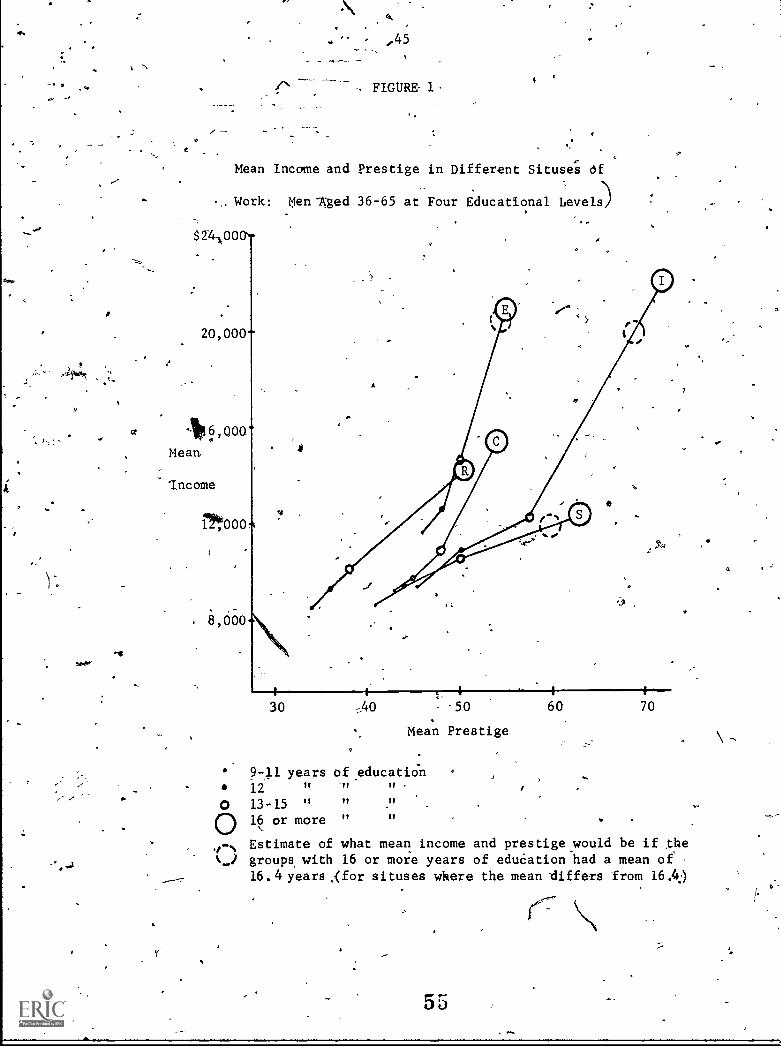
4.- ,45
FIGURE-
Mean Income and Prestige in Different Situses Of
,Work: Oen'Aged 36-65 at Four Educational Levels)
.$2400
20,000
16,000Mean
Income
1124r000,
(
30 -2,40 -50
Mean Prestige
9-11 years of education12-
II it
O 13-15 "
(:)16 or more "
60 70
7
4% Estimate of what mean income and prestige would be if the%..,) groups. with 16 or more years of eduCation had a mean of
16.4 years {for situses where the mean differs from 16.4)
55
O

L
46. .
References.
Baird, Leonar4,E.)1976. \Using Self-Reports to Predict Student
Performance. liew York: :Educational Tpsting Service, Research
4Ograph Number 7.
Benoit-Smullyan, Emile. 1944. "Status, Status Types, and Status_... -
Interrelationg." American Sociological Review 9 (April): 151-161`.,
.4*
Blau, Peter M., and Otis, Dudley Duncan. 1967. The American*Qccupational
Structure. New York: Wiley.
-Byrne, James J. 1975. "Occupational Mobility of orkers." Monthly
Labor Review 98 (February): 53-59.. , ..
Caplow, Theodore. 1954. The Sociology of Work. Minneapolis: -Univer-
sity of Minnesota Press.
Davis, Kingsley, and Wilbert E. Moore. 1945. "Some Prindiples of
Stratiiication." AmericanSociological Re;riew 10 (2): 242-249.
Duncan, Otis Dudley, David L. Ftatherman, and verly Duncat.' 1972.
Socioeconomic Background and Achievement. New York: Seminar Press.
Durkheim, Emile. (1893) 1964. The Division of Labor in Society.
New York: a'Free Press.,
Eckaus, Richard S., Ahmed El Safty, -and Victor D. Norman. 1974. "A
Appraisal of the Calculations of Rates of Return to'Higher Education."
Pp. 333-372 in Higher Education and the Latfor:Market, edited by3
Margaret S. Gordon. New Ybrk:
tFrankel, Martin R. 1971. Inference from Survey An Empirical
Investigation. Ann Arbor, Michigan: Institlite for Social Research.
'Ghiselli, Edwin $. 1949. "The Validity of Commonly Emplo-yed Occupational
Tests." University of California Publications in Psychology 5 (9):
253-288.
56

...
47
Gord9n,-David M. 1972. Theories of Poverty and Underemplent.
Lexington, Massachusetts: Heath.
Gottfredson, Gary D. 1976. "Good Items, Bad, Items, Sex, and the Voca-
tionarPreference Inventory." Paper presented at a symposium on
Issues and Some Possible Answers in Sex Fairness in Career,Interest
, Measurement. American Psychologicar AsSociation,'Washington, D.C.,
September 7.
Gottfreidson, Gary D., John L. Holland, and LindavS. Gottfredson.
"The Relation of Vocational Aspirations and Assessments to Employment
Reality." Journal of Vocational Behavior 7: 135:148:
Gottfredson, Linda S. 1976. The Relation of us of Work to Occupa-
tional Achievement. Baltimore: Johns Hopkins University.
Unpublished Doctoral Dissertation.
Griffin, Larry J. 1976. "Specification Biases in Estimates of Socio-
economic Returns to,Schooling." Sociology of Education 49 (April):
121-139.
. .,
Hatt, Paul I, 1950. 'Occupation and Social Stratification." American
Journal of Sociology 55 (Nay): 533-543. op , '`+
!
-Hodge, Robert W., Paul M. Siegel, and Peter H. Rossi.: 1966. "Occupa-
tional Prestige in the United States: 1925-1963/." Pp. 322-324 in
Class, Status, and Power, edited by Reinhard Beadi* and Seymour
-Hodg ,.Robert W., Donald J. Treiman, and Peter 14.1-Rossi. 1966. "A-,
omparative Study of Occupational Prestige.? Pp. 309-321 in Class,
_Status, and Power, edited by Reinhard Bend ix and Seymour Lipset.
M.1ipset. New York: Free Pregs.
- New York: Free Press.
.
Hollafid, John L. 1962. "Some Explorations f a Theoryof Vocational!
Choice: I. One- and Two -Year Longitud nal Studies." lsycho--
logical Monographs 76 (26): 1:44. (Whale No. 545)
57 /
48
H011and, John L. 1966. The Psychology of Vocational Choice: A Theory
of Personality Types and Model Environments. Waltham, Miassachusetts:
Blaisdell.
`.Holland, John L. 1973. Making Vocational Choices: A Theory of Careers.
'Englewood Cliffs, New Jarsey: Prentice-Hall.
Holland, John L. 1975. Manual for the Vocational Preference Inventory.
Palo-Alto, California: Consulting Psychologists Press.
Hout, Michael, and William R. Morgan. 1975. "Race and SeX Variations
in the Causes of the Expected Attainments of.High School Seniors." ---
American Journal of Sociology 81 .(September): 364-394..
Jencks, Christopher, Marshall Smith, Henry Acland, Mary Jo Bane, David
Cohen, Herbert Gintis, Barbara Heyns, and Stephen Michelson. 1972.
Inequality: A Reassessment of the Effect of Family and Schooling in
America. New.Yorkl Harper and Row.
Kerr, Clark. 1954. "The Balkanization 'of Labor Market .1! Pp. 92-1,1A,
in Labor. Mobility and Economic Opportunity, edited E. W. Bakke,
P. M. Hauser, G. L. Palmer, C. A. Myers, D. Yoder, and C. Kern.
New York: Wiley.
Marx, Karl. (1893) 1967. Calital: A Critique of Political-Economy.
Volume II. New York: International Publishers.'
Morris, R. T., and ,R. J. Murphy. 1959. "The Sittis Dimension in
Occupat nal Structure." AmericanSociological Review 24 ,April):
231-239.
Munday, Leo N., and Jeanne C. Davis. 1971: "Varieties of Accomplishment,
after College: Perspectives on the Meaning of Academic Talent."
. e.
ACT Research Report No. 6. Iowa City, Iowa: American College
Testing Program..
. e-N,
1 4,58
4.
1

49
Nafziger, Dean H., John L. Holland, Samuel T. Helms, and James M.
--11cPartfand., _"Applying an OcCUpational Classification to the
Work Histories of Young Men and Women." Journal of Vocational Behavior
5 (December): 331-345._
Osipow,' Samuel H. 1973. Theories of Career Development." New York:
Appleton-Century7Crofts.
Osterman, Paul. 1975. "Anmpirical Study of Labor Market Segmentation."
Industrial and Labor Relations Review 28: 508-521.
Parnes, Herbert S. ,1954. Research on Labor Mobility: An Appraisal of
Research Findings in United States. New York: Social Science
Research Council, Bulletin 65.
Parnes, Herbert S.,_Robert C. Miljus,'Ruth A. Spitz and Associates.
1970. Career Thresholds: A Longitudinal Study of the EducationalJ
and Labor Market Experiences of Male Youth, Vol. 1, U.S. Department
of Labor McIpograOh:No. 16. Washington D.C.: U.S. Government
PrintO ffice.
,
Richards, James M., Jr, 1970:"Assessing Stu4ent Performance in College:"
ERIC Report 2. Washington, Tr7CLs; _ERIC Clearinghouse on Higher
Education.
Roe, Anne. 1956. The Psychology of OccupatioRs._ New York: 'Wiley.
Sewell, William H., and Robert M. Hauser. r975. Eduction, OcCifpratlon,
and Earnings': New York: Academic Press.
Stolzenberg, Ross M. 1975. "Occupations, Labor Markets,'" and-the'
Process of Wage Attainment," 'American Sociological Review 40
(October): 645-665.
- 59

50
Strong, Edward7K., Jr. 1943. Vocational Interests of "Pren and.Women.
Stanford, California: Stanford University Press.
'Tatsuoka, Maurice, M. 1971. Multivariate Analysis: Techniques for
Educational and Psychological Research. New York:" Wiley.
Temme, Lloyd V. 1975. Occupation:. Meanings and Measures: Washington,
D.C.: BureaU of Social Science Research.
U. t. Department of Labor, Manpower Administration. 1965% Dictionary
of Occupational Titles. Volume II: Occupational Classification.
Washington, D.C.: U.S. Government Printing Office.
Viernstein, Mary Cowan. '',1972. "The Extendion ob Holland's Occupational
Classification to.All'Occupations in the Dictionary of Occupational
Titles." Journal of Vocational Behavior 2 (April):. 107-121.
.
Walsh, W. B. 1973. Theories of Person-Environment Interaction:
Implications for the College ,Student. Iowa City, IowS: !American '
College Testing Prograff.
Weber, Max. 1946. Max Weber: ,Essays in Sociology, translited by
H. H. Gerth and C. Wright Mills. New York:, Oxford University
Press.
Wolfe, Dael. 1972. "To What ExtentDo Monetary Returns to EdurtIon
Vary with Family Background, Mental,Ability, and School Quality?"
Pp. 65-74 in Does College Matter?, edited by Lewis C. Solmon and
Paul J. Taubman. New York:' Academic Press.
_
60
t

51
Appendix A.
Holland Codes and Prestige of_Detailed Occupations
in the MO Census
Occupations are listed in ascending order according to prestige
within each of the six major Holland categories. Prestige codes were
obtained frOt Temme (1975)I
Three-letter Holland codes are provided for each detailed occupa-
tion becatipe these more deta4led codes are useful in some research (for
example, Nafziger et al., 1974). Holland (1973) lists empirically de-
rived codes for approxitately 450 titles. These were used to recode
corresponding detailed census titles. Viernstein (1972) has developed
a scheme for estimating Holland codes using the Dictionary of Occupationalo
Titles (U.S. Department of Labor, 1965) codes for occupations. Detailed
titles frod,the census for which no empirical code was already available
were given Holland codes by looking up these occupational titles in the
Dictionary and then using Viernstein's translation procedure.
61.
, 2
t

r
*10
O
Census'
Code,
o
Realistic
913
911
941
983
953
823
750
822 :-,
984
754
764
625
916
914
.. 960
762
755 I
52
RSC . 0.0. Dishwashers
RSC 0.0 Busboys
kcs 3.7
RSE 8.5 -
HollandCode Prestige , 'Occupational Title
RIC 1.6 Bootblacks
REC 2.0 Laundresses, private household
Farm laborers, unpaid family
RIC 12.8 Vehicle washers and equipmentcleaners
RCE -13.8 Produce graders a c- -packers,
except' faciory and farm
. . *RSE 13:8 Food.service workers, n..a.c.,
except private household
'Parking attendantsattendanta
Gardeners and groundskeepers,except farm
Ushers, recreation and amusement
workers
RSE 9.3 Carpenters helpers
RIC 10:8 Farm laborers, wage workers
REC. 11.4 Maids and servants, private house-hold
RCE 11.5 Garbige collectors
RSE' ,14.1
RIE -, 14.5' tumbermen,.raftsmen a wood- '---
cWWpders ,-
RSE 14.6 Food counter nd fountain-yorkers( .
\4. ,
RSC 15.0 ' ,CAftsing guardy and bridge tenders_
RIC 15.3 .Stock handlers40
RIC 15.5
4
.
*n e.c.--not elsewhere classified
62

53.-
901 16.9
932 RCS 17.2
981 RIS, '17.4
752 RES 18.1
902 REC - 18.2-
623 RIS 18.3'
943 RSC 18.3
630 RIC '4 1912
780' RSE 19.2
670 RIE 190
4f664 RIE 20.2
751 RSE
q.
20.5
.604 RIS 21.0
624. RCE 21.3
662 RIC 21.6
672 RCS 21.7
763 RIC 22.2
706 RCE 22.6
903 RSE 22.7
674 RIE 22.9
753 RSC 23.0.
63
, 4
Chambermaids and maids, exceptprivate household .
Attendants, recreation and amuse-. ment
.
Cooks, private household
Fishermen1nd oystermen
Cleaners and charwomen
Garage workers and gas stationattendants
Elevator operators
Laundry and drycleaning operatives
Miscellaneous and not specifiedlaborers '
Carding, lapping and combingoperatives
.Shoemaking machin operatives
Construction laborers, exceptcarpenters- helpers
Bottlin and canning operatives
Graders and sorters, manufacturing
Sawyers "
Spinners, twisters and winders
Teamsters
Fork lift and tow motor operatives
Janitors and sextonst_
Textile operatives, n.e.c.
Freight and 'material handlers
f!.
"ti

54
'740 RIC '23.3 Animal caretakers, except lerm
643 RES 23.4 Packers and wrappers,.except meatand produce
9154 RSE 23.5 Waiters
620 RCE 23.6 Dyers r621 RIC, ___24.2, Filer polishers, sanders and
611
714
760
, 642
770
392
660=
962,*
542
3710
671 .
933
. 501
641
634
612
640
.935
buffers a. 0
r
RIC 24-;-2- Clothing ironers and pressers
RSE 24.2 Taxicab drivers and chauffeurs
RSE 24.8 Longshoremen and stevedores
RCI 25.1 Oilers and greasers, exrpt-aueo.
RSE 25.3- Warehousemen, n.e.c.'.
REI 25.6 . Weighers
RIC 25.9 Riveters and fasteners '
. .
RSE : 26.0 .1Guards and watchmen
RIC 26.2 Shoe repairmen, 'L.
RSE 6.4 ,.Motormen; vane, factory, loggingcamp, etc.
RSI
me
26.4 Knitters, loopers and toppers
RSE 26.4 Attendants, personal service, n.e.c.-
: RIS 26.5 Millers: grain, flour and feed
RIC 26.; Mixing operatives
RSE 27 3 Meat wrappers, retail trade
$RCS 27.4 Cutting-operatives,-n.e.c.
RCS 27.6 Mine operatives, n.e.c.
'RSE 27.9 Barbers
64

55 ,4g
633
563
'622
546
RSE
RIE
; RCS
RICt
28.0
28.0
'28.3
28.4
Meat cutters and butchers,manufacturing
Upholsterers
Furnacemen, smeltermen
. .
Stone cutters and stone
_
nd pourerat.,,_
__....,carvers
450 RCI 28.7.
Inspectors, scalers andlog and lumber
graders,graders,_
evt6 RCS 28.8 Sailors and deckhands
1 RCE 29,1 Truck drivers
605 , RCI 29.2 Chainmen, rodmen and'vaxmen, survey
613 RCS 29,:3 Dressmakers and seamstresses,except factory
673 v RSI 29.3 Weavers
,- %.
690 , RIE ,29.3 Miscellaneous and not specifiedoperatives
412 RIE 29.6 Bulldozer operators
644 RCI 29.6 Painters, manufa(tured articles
534 -RIE 29.7,
Roofers and slaters
824 RSE 29.8 Farm svice laborers, 'self employed
703 30.2 Bus drivers---RCS
912% RIS .30.2 Cooks, except private h6usehold
533 RIC 30.3 Rollers, and finishers, metal
=636 4 RCS- 30.3 Milliners
602 RIC Assemblers'
701 RCS 30.8 Boatmen and canalmeno .
665 RIS 30.8 Sol erersN
421' RCS 30.9 - Cement and concrete niS4rs
f

801
436
510
551--.
.-------- -652
424 '
651
614* ,
681.
656
374
9\ t.
650
7
483
472
6
80
.
635
'581
- 420
.965
402
56
RTE 30.9 Farmers, owners and tenants.
51.2, Excavating and-road machineoperatives, except bulldozer
RCI 31.3 Painters, construction andnaain-tenance
.
RCS . 31.7 Tailors
RIC 51.7.
Lathe and milling machine operatives
RCE 31.8 Cranemen, derrickmen and hojstmen
RRIC 31.8 Grinding machine operatives
RIC 32.0 Drillers, earth
RIE 32.1 Winding operatives, n.e.c.
'RIE 32.2 Punch and stamping operatives
RIC 32.3 Shipping andreceiving clerks
.RIC 32.3 Drill press operatives,
RES 32.4 Railroad switchmen
REI 32.6 Farm foremen
RIC 32.7 Furniture and wood 4nishe/
RIS 32.8 Loom fixers
RIE 33.2 Automobile body repairmen,
RIS 33.2 Heat treaters, annealers and temperers
RIS 33.4. .
.-Welders and-f mecutters
RIE 33.5 ..Metal platers
RES 53:6 Stock clerks and storekeepers,
RCS 33.7 Carpet installers
RSE , 53.7 Marshals and constables
RIS 33.9 Bakers
66

57
.
C
512
334
440
575
RCI-
RCS
RCS
RIS
34.0
. 34.1
. 34.1
34.1.
4
,Paperhangers
Meter readers, utilities
.F400r layers, except tile. setters
'e..
tsmen and kindd workers,n.e. c . , .
.... _
666 RIC 34.1 Stationary.firemen
413 RCI 34.4 Cabinetmakers
610 RIC 54.4 . Checkers, exatniners and inspectors,manufacturing
331 RCS .34.5 Mail carriers, post office
"503 RSE' , 34.5 Moldert, metal
401 RIE 34.8 Automobile accessories installers
313 RSC 34.9 ,Collectors, bill and account'
442 RIE 35.0 ForgemeWand ammermen
965 . RSE 35.1 Sheriffs and bailiffs
603 Rdt 35.2 Blasters and powdermen
560 RCS Lire setters
410 RCS , 35.5 Brickmasons and stonemasons'
520 35.5 Plasterers
704
653
RSE
RIC
35.5
35.6
.ConduCtorsi.,
and-motormen, urbanrail transit ,
Precision machine operatives-n.e.c. =
403 RSE 35.7 Blacksmiths
712 RES,
3517--:
'-Taiiroad brakemen .7
_ -,---
A
645 :RIC 46.Q Photographic process workers
405 RAI 36.2 -pookbinders
ti
67 .
4

RSE
435 RIE
506 RIS
473 RIE
445 .RIS
626 RCS
964 RSE
,,-
601 RICv
516 Ric°
482 RSI
615 'RCS
505
486 RIE, 1
RIE
415 - RCI
_495 RIE
. 171 RIS
454 RIE
a -
550 RIC 39.5. Structural metal craftsmen, .
..."-
404 RIE 4044 Boilermakers, .
1, .
452 . RIC 40.7 LInspectOrs, n.e.c.
58
36.2
36.3
36.6
Meat cutters and butchers, except,manufacturing
Engravers, except photoengrav
Opticians, lens grinders andpolishers
.L.T.
36.6 -Automobile mechanics
36.7N
Glaziers
37.3 Heaters, metal'
37.3 Policemen4and detectives
,
37.4 AsbesioS and insulation worker's
37.5 -
,
Piano,and_organ tubers and re-paiiinen
37.5 Household appliance installersand mechanics
.7.7 Dry wall insAxllers and lathers
37.9 Motion picture projectionists
,
,38.2 Railroad and carshop repairmen
38.4 M4scellaneous mechanics and repair-men ,
-
38.7 derpenter,s1
38.8 Islotspecified mechanics and.re-.
pairmen
39.9 Radio operatorsOE
39.4 Job and die setters, metal
552 RCS Telephone installers and repairmen
"'68
4*.

.
59
453
961
554
470
461
150.
535'
5/5.
434
484
502
221
53D
540
522
471
433
'422
430
561
173
515
426
441
'
.
RIS
RSE
RIE
REI
RIE
RIC
RIE
RIS
RIC
RCI
RIE.
REI.
RIC
RIE
RIE
RIE
RIE
RAI
RIS
'RIS
,RIE
RSC
RIA.
REI .
41.2
41.2
41.3
4144
41.5
42.1
42.4
42.4
42.6
42.6
4300
43.2)
43.2
43.2'
43;4
43.4
43.6
43.6
43.8
44.4
44.5
44.7
44.9
44.9
.
Jewelers and -watchmakers
Firemen, fire protection
Telephone linemen and splicers
Air conditioning, heat and re-frigeration mechanics
Machinists
'Agricultural and biologicaltechnicians, except health
Sheettetal workers and tinsmiths
Stationary engineers
"Electrotypers and stereotypers
Office machine repairmen
Millwrights
Officers, pilots and pursers, ship
Pressmen and plate printers, printing
Shipfitters
Plumbers and pipe fitters
"Aircraft mechanics.-
.
.-'
Electric power linemen and cablemen4.
...
Compositors and typesetters
Electricians.-:
eTool and die makers'
Technicians, n,e.c.,
Photoengravers and lithographers
/Dental laboratortechnicians
Foremen, n.e.c.
Hn
-
69
- .
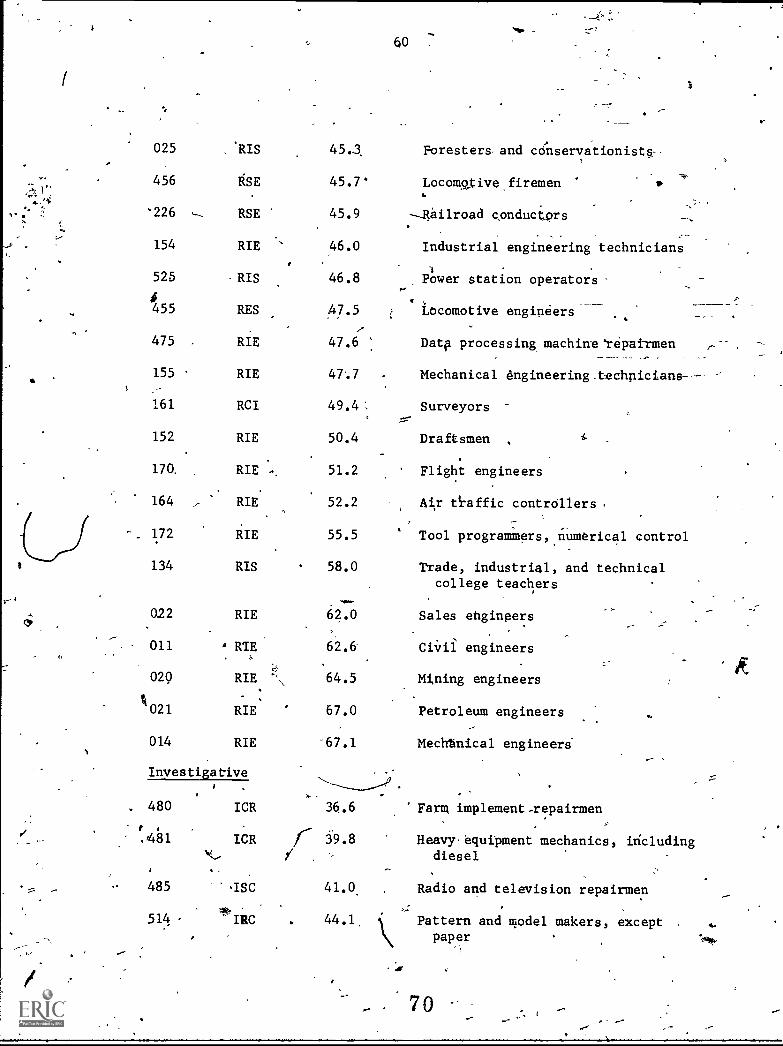
I
r- 4
_
"qp
60
025 'RIS
456 RSE
'226 -- RSE
45..3
45.7'
45.9
Foresters- and cdilservationists-
Locomotive iremen
--Railroad condnctprs
.
154 RIE 46.0 Industrial engineering technicians
.
525 RIS 46.8 Power station operators
455 RES 47.5 Locomotive engineers
475 RIE 47.6 Date processing machine 'repairmen
155 RIE 47.7 . Mechanical engineering_techniciens----;
161 RCI 49.4: Surveyors
152 RIE 50.4 Draftsmen .is
170, RIE ., 51.2 Flight engineers.
164 RIE 52.2 Air tiaffic controllers,
.-. 172 RIE 55.5 Tool programmers, numerical control
134 RIS 58.0 Trade, industrial, and technicalcollege teachers
022 RIE 62.0 Sales engineers
011 RTE 62.6 CiVii engineers
029 RIE 64.5 Mining engineers
W021 RIE 67.0 Petroleum engineers
014 RIE -67.1 Mechtnical engineeri
Investigative'-'------...----1° -
. 480 ICR 36.6 Farm implement repairmen
#
.,481 ICR r 39.8 Heavyequipment mechanics, includingdiesel
485 ISC 41.0 Radio and television repairmen
7*514 - IRC 44.1, Pattern and model makers, except
paper
0""
oe-
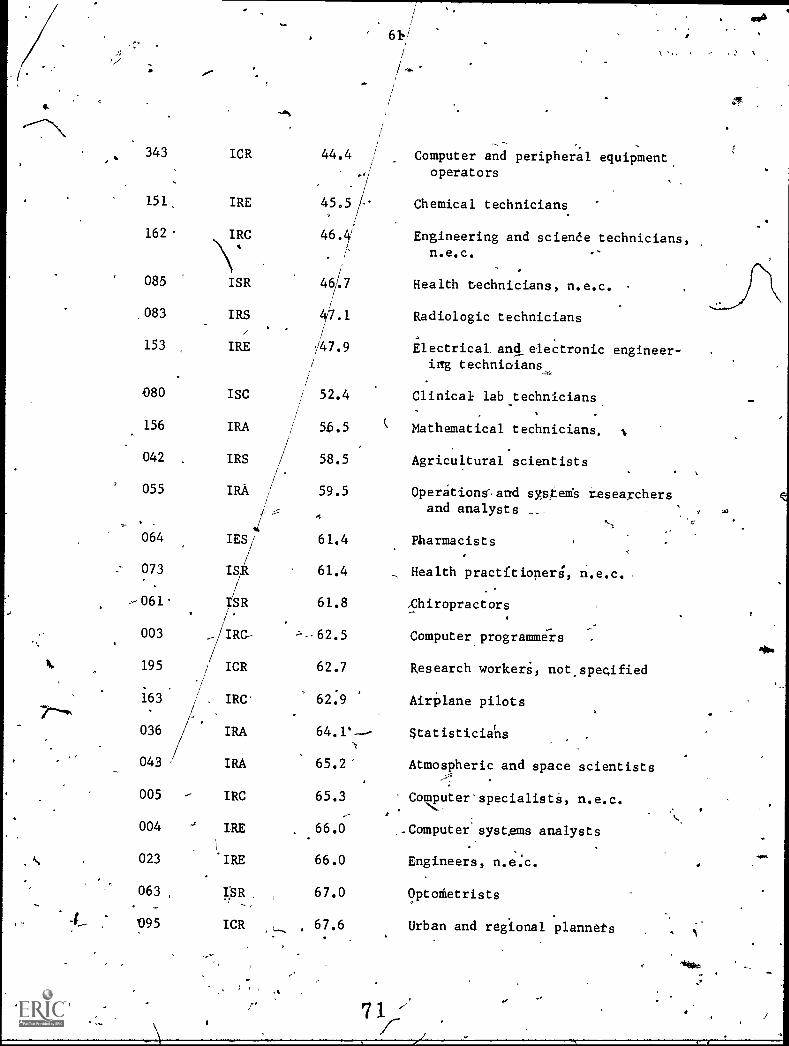
343
151,
162
085
083
153
080
156
042
055
064
073
,061.
61,1
ICR 44.4
wog
IRE 45.5,. /
IRC 46.4/I,
/
ISR 46/.7
IRS 4/.1
IRE /47.9
/
/
ISC/
52.4
IRA / 56.5 c
IRS 58.5
IRA 59.5
IES 61.4
ISR 61.4
ISR -61.8
Computer and peripheral equipment.operators
Chemical technicians.
Engineering and science technicians,n.e.c.
,
...
Health technicians, n.e.c.
Radiologic technicians
Electrical. and electronic engineer-ing technioians,,
Clinical lab technicians
Mathematical technicians,
Agricultural scientists
Operations' and syBteds researchersand analysts
Pharmacists
Health practitioner;, n.e.c..
,Chiropractors
003 _./IRC- ;'---62.5 Computer programme-
195/
/ ICR 62.7 Research workers, not specified
163. //. IRC' 62.9 Airplane pilots
Statisticians036 IRA 64.1`-..
043 IRA 65.2"
005 - IRC 65.3
,004 IRE 66.0
023 'IRE 66.0
063 ISR , 67.0.,.
095 ICR L , 67.6
Atmospheric and space scientists
Computer'specialiste, n.e.c.N,.. .
'...
..Computer systems analysts
Engineers, n.e.c.
Optonietrists
Urban and regional plannets
7,
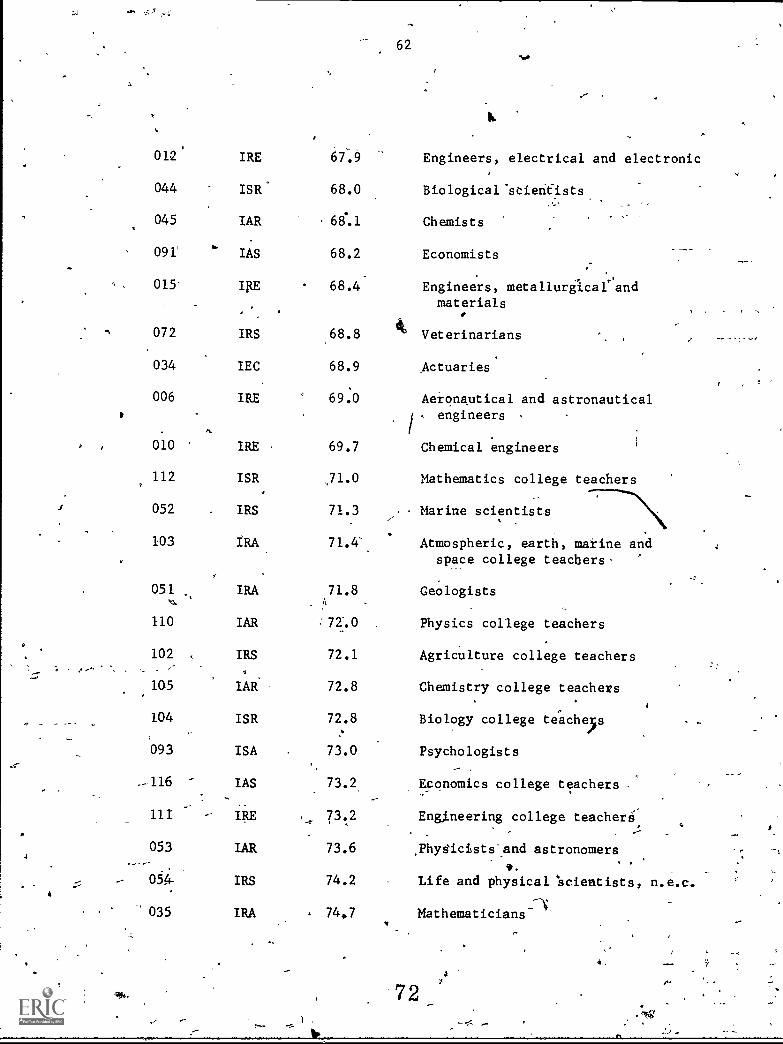
62
012'
044
045
091'
IRE
ISR
IAR
IAS
67.9
68.0
6e.1
68.2
..-
Engineers, electrical and electronic
Biologicarstientists
Chemists
Economists
.015 IRE 68.4' Engineers, metallurgical andmaterials
072 IRS 68.8 Veterinarians
034 IEC 68.9 Actuaries
o
006 IRE 69.0 Aeronautical and astronautical, engineers
010 IRE 69.7 Chemical engineers
112 ISR ,71.0 Mathematics college teachers
f 052 . IRS 71.3 Marine scientists
103 IRA Atmospheric, earth, marine andspace college teachers'
e
051 IRA 71.8 Geologists
110 IAR 72.0 Physics college teachers
102 IRS 72.1 Agriculture college teachers
105 IAR 72.8 Chemistry college teachers
.
104 ISR 72.8 Biology college teachey....
093 ISA 73.0 Psychologists
.-116 IAS 73.2.
- ,
Economics college teachers
111 IRE ..., 73.2 Eng.neering college teacher,
053 IAR 73.6 astronomers4
Phydicists'and, ',.., - e. t.
05.4- IRS 74.2 Life and physical 'scientists, n.e.c.
035 IRA , 74,7 Mathematicians -"-'

I
63
113 ISA . 75.3 Health specialities college teachers, k 9
--. 114 ISA i 75.3 __Psychology college-teachers
062 IRE /6.-7' Dentists .
065 , ISA 88.4 Physicians, medical and osteopathic
. Artistic
. -
543 IATR. .39.2 Sign painters and letterers
444 .4 A16--- 0. 39.3 - Furriers
182 , AES '''' 40.4 Dancers...,..._ -,..
,
191 AIR 42.9 Photographers
425 AIE 43.5 Decorators" and window dressers. .0
185 ASI 45.0 Musicians and composers
175: AIS 51.8 Actors
190 AIR ' 52.5 Painters and sculptors
260 AES 53.5 Advertising agents and salesmen
194' AIS 53.7 Writers, artists and entertainers,*% . n.e.c. Aw.,,
183 AIS 55.5, Designers
AES 62.0 Public relations men and publicitywriters
ASE 65.3 Editors and reporters,,,
- t. 123 ASI 68.1 Art, drama, and music collegeteachers
181 ,' AIS 68.
126 ASE 70.3
002 --'7 0 . 9
Authors
English College teachers
Architects
73

fi.
_
64
Social
SRE
SRE
SCE
9.8
15.8
19.0
Child ca-re workers, private house-hold
Housekeepers, private household
School monitors
980
982
952
934.
SCE 20.9 Baggage porters and bellhops
942 SRE 23.0 Child care workers, except privatehousehold
923a
SRI 27.0 - Health trainees
382 SCE 29.1 Teacher'aides, except school monitors....
320 SEC 30.3 Enumerators and interviewers
.
910 SEC 31.0 Bar_ tendefs
924 SAI 33.3 fay midwiveso'
925 SRI . 33.6 Nursing aides, orderlies andattendants
950 SRE 36.6 Housekeepecskexcept private house-hold
084 SRI 37.2 Therapy assistants A
922 SRI' 38.5 Health aides, except nursing
-,..944' SAC 38.5 Hairdreesers and cosmetologists
180111. ----,SRE 38.9 Athletes and kindred workers
SRE 41.5 Managers and sulierintendents,building -
.
954 SRE 43.2 reffare service aides
926 e SAI 43.3 Practical nurses
323 SER 43.6 Expediters and production controllers,
921 SAI 43.9 Dental assistants
390 SCE 44.2 Ticket, station and express agents
74

si
075 SIA 53.8.
096 SAI 53.9
211. SEC 54.2:
081. SAI 555.3
082 SAI '55.5 .
076 an 56.0
2235, SCE 56.0
033 SAI 56.4
t 141 SIA 58.0.1
086 SAI 59.6fr.
100 SIA 60.7
024 SRI 60.8
212 SCE 60.9 .
215' SIE 45.8.
074 S1E 47.2'
° 145 , SAE 49.1
213 SIE, 49.k
101 SCE 51.9
201 SCE , 51.9
165 SEC 50.3
143 SAI 50.9
65
J 'I
.
Inspectors, except construction;public administration
Dieticians , %
Teachers, except college anduniveYsity, n.e.c.
Construction inspectors, publicadministration
',4
Embalmers
Prekindergarten and kindergartenteachers
Recreation workers
Assessors, controllers andtreasurers; local public adminis-tration
Registered nurses
Religious workers, n.e.c.
Funeral directors
ental hygienists.
Health record technicians
Therapists
7-5
Officgrs of lodges, 'societies andunions.
Archivists and curators.
Adult education teachers
Clergymen
Social workers
Farm management advisors
Health administrators.
Alb

?4' 66
6
. .026 SAE 61.9 Hdme management advisors
144 SAE . 62.7 Secondary school teachers..
.
142 , SAI 63.6 Elementary school teachers
'032 SAI 63.7 Librarians
174 SEA 64.6 Vocational. and educationalcounselors.4gadk 1
7
071 SIR 64.7 P iatrists
092 SIA 66.8 Po tical scientists
140 SIA 67.4 Teachers, college and university,subject not specified
124 SRE . 68.8 Coaches and physical education,college teachers.
235 SEI 68.8 -School administrators, college
. . .
096 SIA 69.0 ,, Soial scientists, n.e.c.
133 SAI 69.2 Theology college teachers
130- SAE 69.3 Foreign! languige college teachers
120 SEI 70.4 History college teachers
094 SIA 71.i
-e,
Sociologists
240-
SEI 71.2 Schoo1 inistrators, elementaryand econdary,
. .
. 135 SIA 71.9Nro Miscellaneous teachers, college
and university
121- SIA 72,0 sociology college teachers* .
131 SAE 73.4 Home economids college teachers
122 SIA 73.7 Social science teachers, n.e.c.
125 SAE 74.9 Education college teachers
P
76

4
EnterR;!liag
67
.3*
1:e
266 ESC 5.31
Newsboys. .
264 ESC 25.2. '--,,Hucksters and peddlers
262 ESC 27.5 Demonstrators0* .
705 ESR 30.5 Deliverymen and routemen (b.
.,,.
283 .ESC 30.7 Sales, clerks, retail, tri-de
940 ESC 33%.4 Boarding. and lodging house keepers
315 . ESC 38.2 Dispatchers and starters,, vehicle
.
261 ESC 38.4 Auctioneers
*245 ESI 38.5 / Retail managers, gas station;salaried L
245 ESI 38.6 Retail managers, gas stations; selfemployed
802. ERI 39.1 Farm managers 0
1
245 ESI 39.6 Retail 'tanagers, food stores;if employed
284 ESC 39.7 Salesmen, retail trade
285 ECS 41.0 Salesmen of .services and constructiona,
245 ESC 42.7 Personal services managers/-,
245 ESC
-
42.7 Communications,utilities,,and'sanitary services managers; selfemployed
282 ESC 43.4- Sales representatives, whbIesaletrade
230 ESC 43.7 Restaurant, cafe, and bar managers7-
245 ESt 44.5 Retail managers, other retail;selfemployed
-
951.
ESA 44.7 Aline stewardesses ,
245 ESC 44.9 Transportation managers, selfeMployed
77

A
68"..)11
245
245
ESC
ESI
45.4
45.6
wI
Construction managers, salaried
Retail managers, general merchan-dise;, self employed
.245 ESI 45.9 Retail managers,'hardware; selfemployed
.
245 ESC 46.1 Personal services managers; salaried
'243- ESI 46.2 Retail managet, food stores;salaried
245 ESI / 46.3 Retail managers, furnitufe; selemployed
245 ESC 46.4? Business and repair servicesmanagers; self employed
245 ESI 46.5 Retail managers, motor vehicles;self -employeX.
281- ESC ' 47.1 Sales representat ives, manufactur-;ng industries
245 ESI 47..6 Retail managers, apparel; selfemployed
245 -ESI '47.7 Retail managers, other .retail;salaried
270 ECS 47.8 Real estate agents and brokers
AP.47.9-245 ESI Retail managers, motor vehicles;'
salaried . ,
231 - ESC 48.0 '1 Sales managers and department heads,£rade
1
245 , -ESI 48.10 Retail,Managers, hardware; salaried
245 ESC 48.3
rManagers, all other industries;
self employed,
/,
245 ESI\e" 48.4 Retail, managers, general-mOrchan?-7
dise; salaried 3
193 SEAR 48.8' Radio and TV announcers
78O
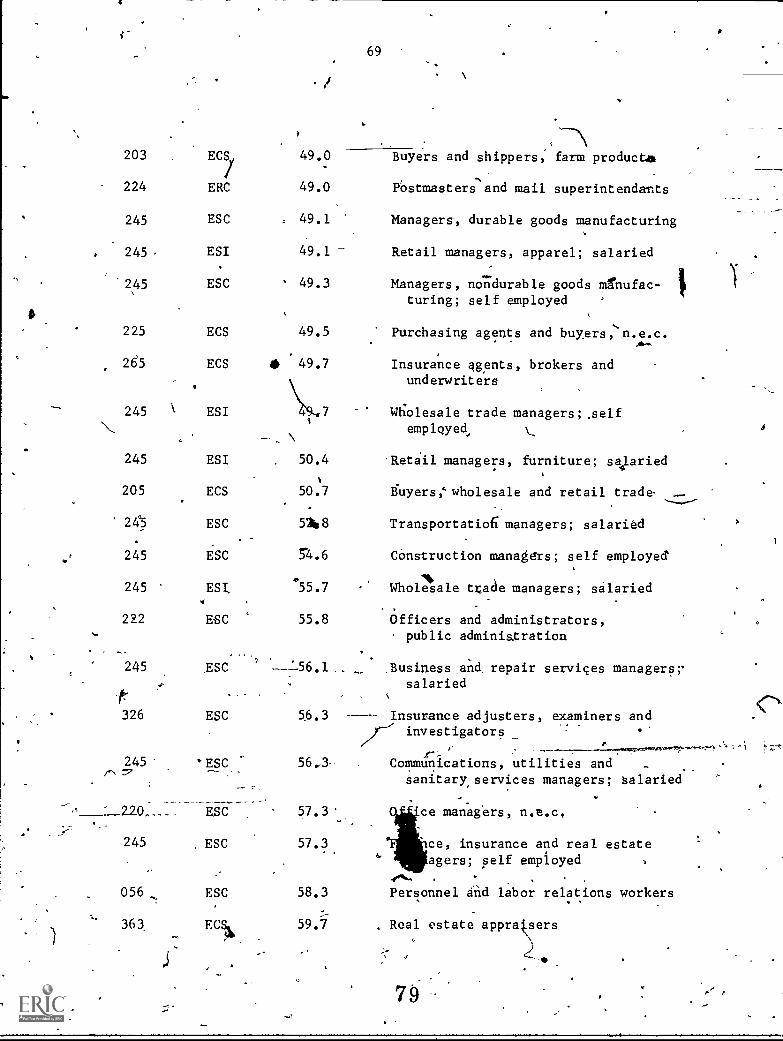
f69
203 ECS/ 49.0 Buyers and shippers, farm products
224 ERC 49.0 POstmasters,and mail superintendants
245 ESC . 49.1 Managers, durable goods manufacturing
245 ESI 49.1 Retail managers, apparel; salaried
245 ESC 49.3 Managers, nondurable goods mfnufac-turing; self employed
225 ECS 49.5 Purchasing agents and buyers, n.e.c.
265 ECS 49.7 Insurance agents, brokers andunderwriters
245 ESI Wholesale trade managers;selfemployed
245 ESI 50.4 Retail managers, furniture; salaried
205 ECS 50.7 Buyers,` wholesale and retail trade
24°5 ESC 5%8 Transportatio6 managers; salaried
245 ESC 54.6 Construction managers; self employed
Wholes7.
lk245 ESI.
.55ale trade managers; salaried4
222 EC 55.8 Officers and administrators,public administration
245 ESC '56.1 Business and repair services managers;salaried
326 ESC 56.3 ----- Insurance adjusters, examiners and
245 'ESC
investigators
/--Communications, utilities and
sanitary, services managers; salaried
290_ ESC 57.3 G ice managers, n.e.c,
245 . ESC 57.3 -ce, insurance and real estateg agers; self employed ,
.04... ..
.
056 ESC 58.3 Personnel and labor relations workers. .
363, ECSL 59.7 . Real estate appraisers
79 /
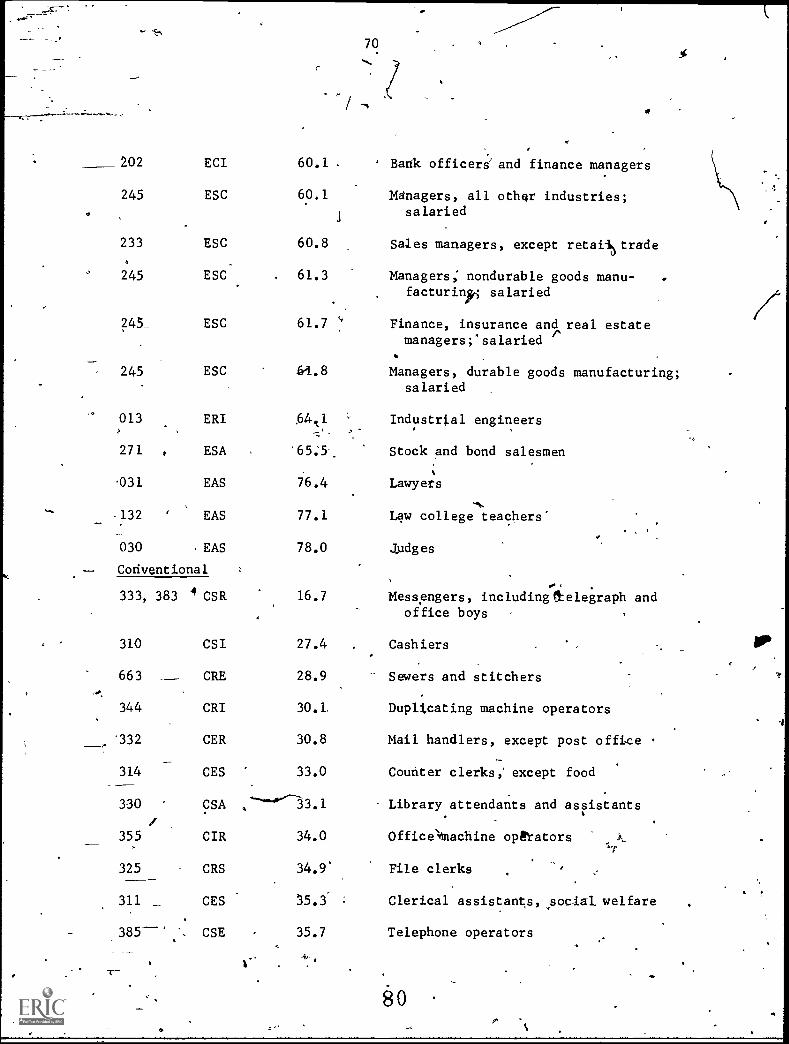
202 ECI 60.1
245 ESC 60.1
233 ESC 60.8
245 ESC 61.3
245_ ESC 61.7
245 ESC 6,1.8
013 ERI 64.1
271 , ESA
-031 EAS 76.4
132 EAS 77.1
030 EAS 78.0
Conventional
333, 383 4 CSR 16.7
310 CSI 27.4
663 CRE 28.9
344 CRI 30.1.
'332 CER 30.8
314 CES 33.0
330 CSA.......-0.----D.1
/355 CIR 3434.0
325 CRS 34.9'
311 CES 5.3
385 CSE 35.7
70
. ' Batik officers' and finance managers
Managers, all other industries;salaried
Sales managers, except retai3Ntrade
Managers; nondurable goods menu-facturinori salaried
Finance, insurance and real estatemanagers;'salaried
Managers, durable goods manufacturing;salaried
Industrial engineers
Stock and bond salesmen
Lawyers
Lay college teachers"
Judges
Messengers, includingrelegraph andoffice boys
. Cashiers
Sewers and stitchers
Duplicating machine operators
Mail handlers, except post office
Counter clerks; except food
Library attendants and assistants
Officestlachine op8ators
File clerks
Clerical assistants, social_ welfare
Telephone operators

.71
a
364 CSE 36.3 Receptionists
0 350 CRI .36.4 Tabulating machine operators.6..
391 CIE 37.6 Typists
342 CIS . . 37.7 CalculatIng machine operators
303 s CRI ' 38.5 Billing clerks
394,395 CES 39.6
*5 CRI
384
362
341
""le 361
39.9
Miscellaneous and not specified.
clerical workers
Keypunch operators
40.5 Telegraph operators
40.7 Proofreaders
40.8 Bookkeepingand tilling machineoperators
CER0 41.2
375 CIS 70
41.5 Statistical clerks
376 CEs 2.5 Stenographers
301
'7360
X05 C'SI 45.9 Bookkeeper5
371'
372 CSA 47.7
,PoStal clerks
CR 43.7 Bank tellers
CIE , 44.-7 '0, Payroll and timekeeping cletks
di*
CSA 47.1 Medical secretaries
Secretaries, n.e.c.
Estimators and investigators, n.e.c.
Legal secretaries
Clerical supervisors, n.e.c.
Creditmen
;Accountants
321 CIS 48.3
370 CSA 49.0
312 ES 52.3
N. 210 CES 56.4
001 CES ,60.6
115 " CSE 73.3 Business and Commerce college.teachers
4 ANote: AlloCated *end apprentice census categories are not listed.
Also, 36 types of managers' with.the.same census code -(245) arelisted separately here.
8 12-

"
4.
A
g 0
472
Appendix B9
7
JAdditional Results by Age and Situs of Work:
Means, Standard,Deviations, and Correlations of YearsEducation, Occupational Prestige, Hours Worked,
'Weeks Worked, and Incbme
9
e,
4,...

N
73
TABLE B-1
'means and Standard Deviations foren
in All S ses of Work (Except Artistic)
Age
26-35 36-45 .46-55 56 -65
Years education Mean 12.6 %/,12.0 11.5 10.7
SD 2.9 3,3, _3.3 3.4
Occup prestige Mean 43.1 43.3 41.8 40.3
) SD 14.1 14.1 13.4 13.5
Hours/week ,Mean 45.3 45.4 . 44.6 L' 44.0
SD 7.2 7.4 -7.0 ) 6.7
Weeks/Year Mean 49.2\ .49.5 49.5 49.0
SD 5.9 5:2 5.3 6.3
.-ncome/year Mean 9,456 11,232 11,248 10,242
-
SD 5;169 7,233 7,878 7;764-
-
0,
Age Mean 30.3 ,40.7 50.3 59.6
SD 2.9 218 2.8 2.7
(N), (7651) (7505). (7143) --(4332)
..0
,
4
5
83:
er.

I
740
TABLE B-24, .%
te
Means aria.Standard Deviations for Bet isfic Work
Ag
26-35 56-45 46-55 56-65
Years education Mean 11.2 - 10.5 10:1 9.4
SD 2.4 2.8 2.8 249
Occup prestige Mean 34.7 4:9 ;" 34.3 33.3-
.
SD 9.5 9.8 . 9.5 9.5
Hours/week Mean 44.5 44.2 43:6 42-.9
-SD 6.8 6.6 6.2 5.7
Weeks/year Mean 49.2 49.1 49:1 -48.7
, .
SD 5.7 5.8' 5.9 -6.5-'
..--clean. 8,348 8092' 8,779 8,009Imuthe year--
.kSD° 3,614 4,182 4,315 3,995
O
7
4Age Mean 30.2 40:7 50.3 59.6
SD 2.8 2.8 2.7 -
(N) (4060) (3934) (3942) (2503);
)->
-;
.84

75
c
TABLE B-3
Means and Standard Deviations for investigative Work o'
I
Age
26-35 36-45 46-55 . 56-65 .
a $ .
Years-education Mean- 14.6 14.5
SD 2.8 3.
,413.7 13.0
3.7 4.1
Occup prestige Mean 59.5 61.2 58.6 57.7
SD 14.3 15.3 - 15.6 ... 17.0
. ,
Hours/week Mean, 44.7 45.2 44.5 44.2. e
..
SD.- ' -7.1 7.5 --' 7.1 6.8
Weeks/year 50.1c 50:3 50.1
SD 6.2 4.S '2.7 3.0
f$_ v.
. Income/year Mean
SD
Age' Mean
SDA
11,515 15,855 16,025
6,549 10,366 10,844.
30.2 40.4 50.0
2,9 2.8 ° 2.8
14,758
11,644 4
59:6'
2.7
506) 1(242)
\\,
4
" 2-
85.

-;-
""\
,,. e...11.
76
,
TABLE
Means And Standard Deviations for Social Occupations
Years education
Occup prestige
Pliours/week
s. Weeks/year
Incpme/year '-,
Age
e^2".:
--Ai ,,..
26-15
Mean 15.5
SD 2.5
Mean 57.0
SD 10.9
Mead 46.2 .
SD 7.8
Mean 47.5.
SD 7:1
Mean 8:§25
-S15-4.' 4,?65
s
Age
36745 46-55 56-65
15.2 14.2 13.7-
3.1 ' 3.6 . 3.9
56.2 52.7 53.0
-12.1 ,c12.9 13.3.
'"-"C
46.7** 146.6 45.7
47.9
6.3
10,580
5.402
130.3' 40.6
2.9 2.9
(N) v- ,.,(565) (492)
7.9 7.8,
47.7
7.9
48.5,
9
11,265 10,783
. 7,227 7,028
50.1 59.5
2:9 2.7
(406) (226)
t7,
-t 0 01.
86
4

a.
77
TABLE B-5
Meani--and_Siandatd Deviations for Enterprising Work-
,1
Age
426-35 36-45 46-55
Years education Mean 11.5 13-.2 12.8
SD 2.5 2.8 2.8
Occup prestige Mean 49.3 49.8- 49.4
SD 10.3 9.1!) 9.8
'47.9 46.8Hours /week --Mean:- *7-1,
,. SD_ 7.7 7.9 . 7.i
- -,=-71-774/"I''-nrwl---....:.
Weeks/year Mean \49.7 50.2. ,
50.2
_SD 5.4 3.8
w.-
Income /year Mean 11,357 14,346fi
15,100
SD 6,843 9,219 10,564
- - .* -.As
oAge Mean 30.5 40.7 50.34
SD 2.8 2.8 '2.8
(N) (1736) (1984) ° (1884)
_-_,.. ---,,1
V
..
1
,
qdlo''I00%0
56-65,
48.7
10.0
46.7,
7.9
5.8
14,296
11,092
59.6
2.7 %
(1073)
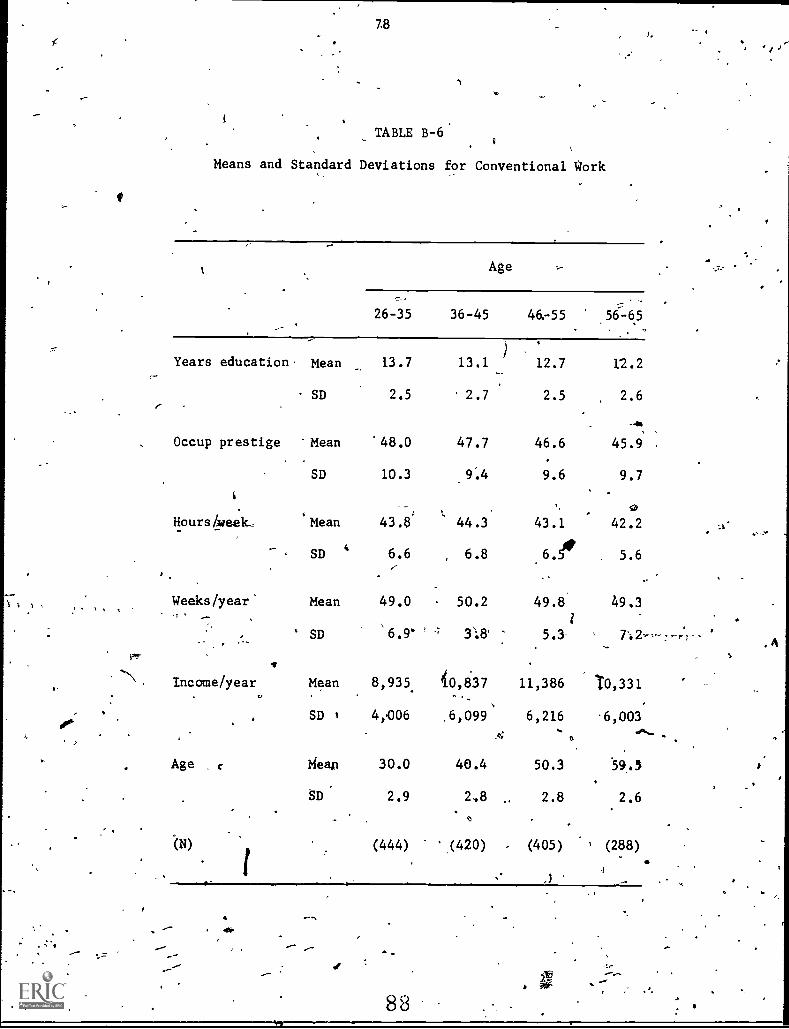
78
1).
TABLE B-6
Means and Standard Deviations for Conventional Work
II
.1.
;65'
Years education. Mean 13.7
(N)
Occup prestige .Mean °48.0
Hours /week_ Mean
SD 2.5
26-35
SD 10.3
43.8
SD 6.6
Weeks/year' Mean 49.0.,.
1
' SD 6.9' '
.\Income/year Mean 8,935.
SD 4,006
Age. c gear! 30.0
SD. 2.9
(444)
Age
36-45 46:55 56-:-65.
13.1
2.7
12.7
2.5
12.2
2.6
-41
47.7 46.6 45.9
9.4 9.6 9.7
L 44.3 43.1 42.2
, 6.8 5.6
50.2 49.8 49.3
,
3:8' 5.3- ° Ta---:--,-1,-
40,837 11,386 10,331
...6,099 6,216 6,003
40.4 50.3 59.5 r
2,8 2.8 2.6
(420) - (405) ° (288)
c 3
rf
88
oft
,A

I
TABLE B-7
Correlations for Men in All Situses of Work (Except Artistic):
Mel 26 -35 Above.the Diagonal and Men 36-45 Below the 'Diagonal
%go
- Educ Pies Hours Weeks InCome Ra
. '
Years educ .64 .05 -.01 .32 -.49 .24 ...29 .18 .10
Prestige .64 .07 .02 .35 -.63 .39 .28 .24 .09
Hours/week .10 ',12 .04 .12 21:12 -.03 . : .04' .17 -.05
Weeks/year .08 .09 407 .21 .00 .01 -.08 .05. -.01%
Income/year .43 .48 .18 .16 -.23 .14 -.03 .20 .17
Real -.49 -..63 -.17 -.07 -.32 .-.36 '-;..30 -.59 -,26
Inv .24 .40 -.01 .04 .20 -.33 -.10 -.19 -.08
Soc .26 .24 .05 -.08.. . -.02 -.28 -.08 -;t6 -.07
Entst,
-Conv
.22,...
.08
.28
.08
.20
-.04
.08
'.03
.26
.03
-.63
-.26
-.19
-.08
-.16
-.06 =:5
-.14
aDummy variable
.
89 .1
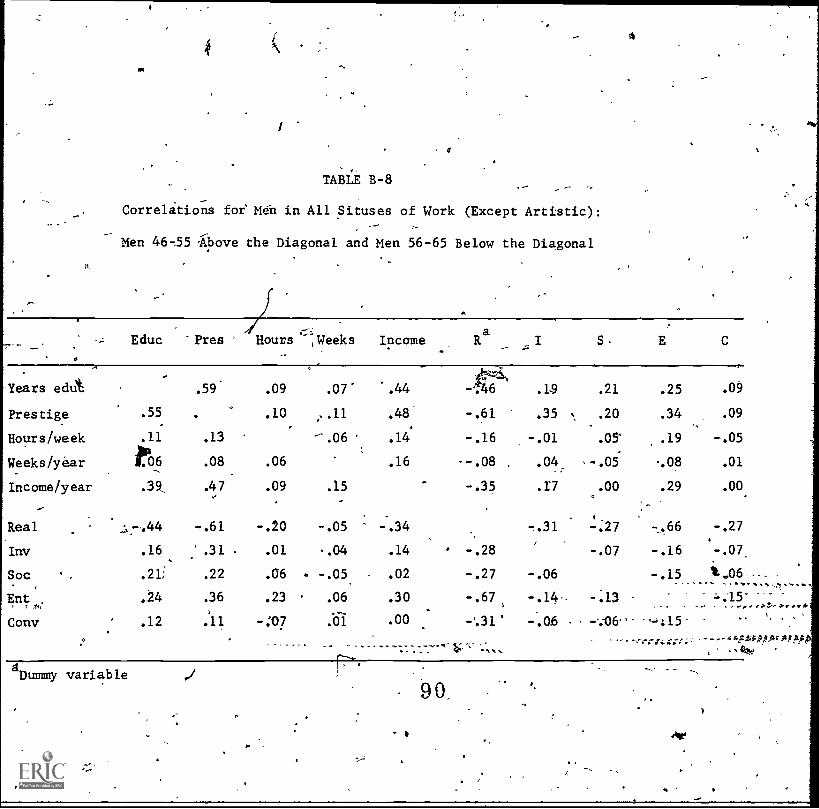
;$
lig
J
,TABLE B-8
Correlations for Mdn in All Situses of Work (Except Artistic):
Men 46 -55 =Above the Diagonal and Men 56-65 Below the Diagonal
Educ -Pres 4'Hours .--,Weeks Income Ra
I S.
.
Years edut
Prestige .55
Hours/week .11
Weeks/year INIncome/year .39,
Real .:,-.44
Inv .16
Soc .21i
Ent . ,24
Conv .12
.59' .09 .07. ..44 -'.46 .19 .21 .25 .09
.10 ,..11 .48 -.61 .35 ,,,. .20 .34 .09
.13 -.06 .14 -.16 -.01 .05- .19 -.05
.08 .06 .16 --.08 . .04, ,-.05 -.08 .01
.47 .09 .15 -.35 .17 .00 .29 .00..
-.61 -.20 -.05 : -.34
: .31 . .01 .04 .14
.22 .06 . -.05 - .02
.36 .23 .06 .30
.11 -:07 Si. .00
1.27 -.27
-.28 -.07 -.16 -.07
-.27 -.06 -.15 --
-.67 -.14- -.13
gDunmy variable
90,
-

I
6
81
TABLE B -9J
I
Correlations for. Realistic Work (Above the Diagbnal).
. .
and Investigative Work (Below the Diagonal) .
.,-
,
1
.Educ. Pres. Hours Weeks -Income-
'Age s 26-35
Years educ_ .35 ...03. .07 .29
Prestige .74 -.Olt, .14 .36
Hours/Week .13 .21 .03 .08
Weeks /year -.13' -.09 -.04 .25
, Income/year .33 .37 '.10 .19
Age es 36-45
Years 'educ -.18 :.- .03 .09 .. .31
Prestige .77 , .01 .11 .38
.-',',=-7-74.-- AftAitticidaie .18 .29k .05 : 1112-,,&s.;.-i-411 t t 't. 1 liegiz§/ydar,
,.. , , s
Income year(
.0,1 .p9 .03 .22
.54. - .63 .39 .08-,-12,
'Ages 46-55
Years educ
Prestige
Hours/weeit:.
Weeks/year
Income/year
.35 .01 .07,
.75 -.03
.24 .23 .03
-.01 .08
.59. '.65 .00
.08'
.22
Ages 56-65
Years edUc
Prestige
Hours/week
Weeks/year
Income /year
.76
.27
-.62
.52t
.27 .04 .07 .23,..,
-.04 el0 .39
S3 .05 -.01
-.06 .03 .20' -
.59 ,.25 -.07
91
S.

ti
, I
82
4
a
TABLE B-10
Correlations: for Social Work (Above the Diagonal)
and Enterprising Work. (-Below the-Diagonal)
Educ Pres Hours Weeks Income
Ages 26-35
Years ethic 4 A .07 -.12 .09
Prestige .42 .02 .' -.13 .10
Hodrs/week -.12, -.08 .13 .00
Weeks/year* -.05 .00 -.08 .24
Income/year .28 .24 .12 a&
Ages.36-45
Years educ
Prestige
Hours/week
,Weeks /year
Inome/year
.73_ .13 %02 , .22
1 .39 .02 -.06.. .22
-.07 -.04: . .23- *Ott
.09 .10 .02.--1-71-1-1-1-r-r,- ,
;.70t ..39 .33 ---157
Yeais educ . .67 .13 -.07
Prestige .39 .09 .00
Hours/week -.07 -.03 .18Q
Weeks/year .01N, .48 .0.5; `,
- Incbme/57ear .36 .29 - .04 .14-- - 4
Years -educ,
.74 .13 .003 ,
Prestige .34 .08 . .04
Hours /week -.08 -.06 .18...
Weeks/year- .06 .05 .03
Income/year - .35 , .31,:- -.05:1`3
Ages 46-55
, Ages 56-65
.28
.31
-.03 .,
.20
92

O
4
ABLE B-11
Correlations for ,Conventional Work
Ver
Educ Pies Hours 'Weeks 'Income
JP.
Age s 26-35
Years educ
Prestige
Hours/week
.55 .01
.03
.
.06
.04
.38
.31
.11
.Weeks /year 7 .32
Incdme/year-%
pAges 36-45
Yeai'S edUC' .40 .04 .06 .36
Psestige .10 .06 .29
Hours /weekv
.02 .21
Weeks /year .10oN .- 'Yr t
Income /y.sar
Age,s 46-55
Years educ
Prestige .
Hours/week
Weeks /year
Income/year
.38 .07
.06
.61
.17
--.06 --
.35
.38"
.15
.16
Age s 56-65
Years educ
Prestige*
Hours/week
Weeks/year
Income/year
-.05 .37
.16 .00 :37
.07 .15
II
.20
.,
f

4
C
':ABLE B-12
A
NEean Income of Men 36-65: By Education. and Situs of Work .
Years of Education
I
8 ortfewer 9-11 12 13-15 16 or more' Total.
_.
Real
Inv..,
Art 7-.-N.....
Soc
Ent
Cony
Total'
_
s
7,309
7,862
a.
7,301
--9,788'
,792
7,614-
8,533
9,372
10,675
8,609
.,/11,607
9,154'
9,169 -
r. 9,325
10,914
i
11,320
\--) 9,427
,_ 12,699/---
9,770-..,.
r 10,372
'.
10,067
12,206
_ . - . . .--
.14,203
10,464
14,628
10,839
'12,364
14,141
21,946
-- - . -._--.,- -
15;537,
12',304 4
20,796
15,360
18,123
A
,
/8,674
I
'15,729
I
132! 652-
10,1868
. ,
14j623
10L,906-.3
.
'
.
111,054
I
-a-Fewer" than,410 cases
4.r
. 9 4 .
r
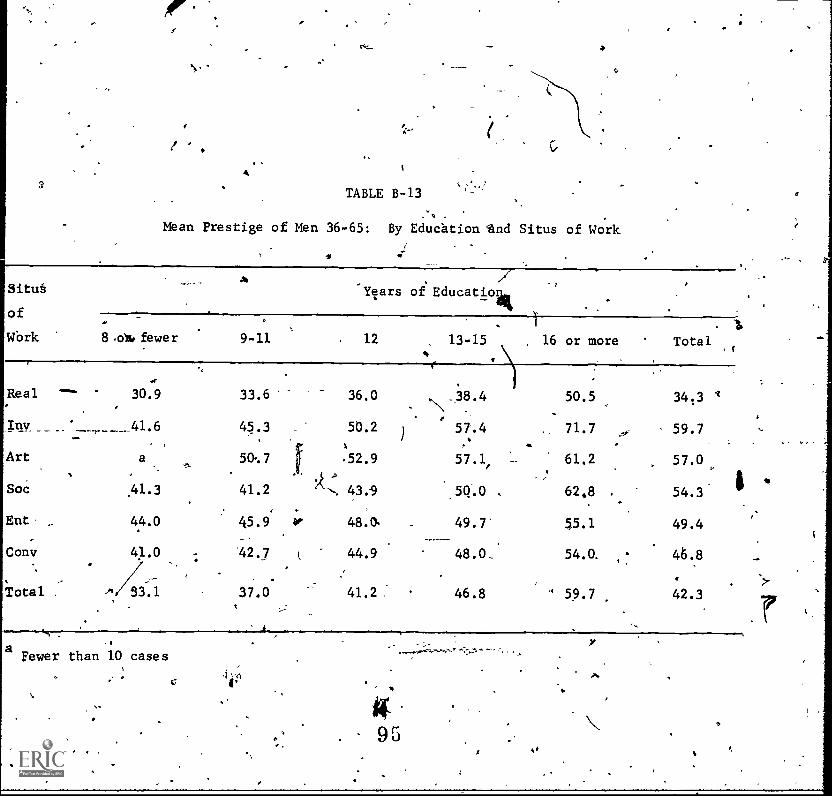
3
,
4
TABLE B-13
4
Mean Prestige of Men 36-65: By Educhtion tnd Situs of Work
situp
of
WOrk 8 .ols. fewer 9-11
0
Real --- 30.9 33.6.
Inv __. 41.6 45.3
Art a 50.7
Soc ,41.3 41.2
Ent 44.0 45.9 ;
Cony 41..0 42.7
Total 53.1 37.0
Years of Educatiok
. 12 , 13-15
36.0 38.4\
% .
50.2 1 57.4x
.52.9 57.1, -
43.1 50.0
48,0. 49.7
44.9 48.0
41.2 46.8
16 or more Totalr
50.5 34.3 .
71.7 59.7
61.2 57.0
62,8 . 54.3
55.1 49.4
54.0. 46.8
59.7 42.3
I
aFewer than 10 cases
c
95.4

TABLE B114
.
Mean Years of Education of Men 36-.65:r--
Educational "Group and ,Situs of WoA..40
Situsof
I .Years of Education
.,
Work.
8 or fewer-..
9-11 . 12 13-15 16 or more-
-_,G.
Total
Real
Inv
Art
Soc
Ent.
Cony
Total
,
6.8
. 7.0
6.8
7.1
7.3
6.8
ss,
10:0
10.1'
9.9
10.2
10.2
'10.2
/10:1
12.0f ,
12.0
12.0
12.0
12.0
-12:0
13.7
14..0
14.1
13.9
13.9
13.9
//
16.5
17.2
18.8-
17.4
116.7
16.4
16.9
'10.1
14.0,
14.1,,
14.5
12.8
12.7
11.6
--Fewer fhan 10 cases
`2.
16.
9G
f; N9