conceptvector: text visual analytics via interactive...
TRANSCRIPT

ConceptVector: Text Visual Analytics via Interactive LexiconBuilding using Word Embedding
Deokgun Park, Seungyeon Kim, Jurim Lee, Jaegul Choo,Nicholas Diakopoulos, and Niklas Elmqvist, Senior Member, IEEE
(8)Conceptrefinement
(6)Articleinformation
(7)Scorevisualization
(10)Conceptrankedbyconcept
(9)Conceptselection(1)ConceptType
(2)Userinput
(3)Suggestedwords
(5)Irrelevantwords
(4)WordClusterView
(a) Concept-Building View (b) Document Analysis View
Fig. 1. ConceptVector supports interactive construction of lexicon-based concepts. Here the user creates a new unipolar concept (1)by adding initial keywords related to ‘tidal flooding’ (2). The system recommends related words along with their semantic groupings(3), also shown in a scatterplot (4), revealing word- and cluster-level relationships. Irrelevant words can be specified to improverecommendation quality (5). Concepts (9) can then be used to rank document corpora (10). Document scores can be visualized in ascatterplot based on concepts such as ‘tidal flooding’ and ‘money’ (7). Users can further refine concepts based on results (8).
Abstract—Central to many text analysis methods is the notion of a concept : a set of semantically related keywords characterizing aspecific object, phenomenon, or theme. Advances in word embedding allow building such concepts from a small set of seed terms.However, naive application of such techniques may result in false positive errors because of the polysemy of human language. Tomitigate this problem, we present a visual analytics system called ConceptVector that guides the user in building such concepts andthen using them to analyze documents. Document-analysis case studies with real-world datasets demonstrate the fine-grained analysisprovided by ConceptVector. To support the elaborate modeling of concepts using user seed terms, we introduce a bipolar conceptmodel and support for irrelevant words. We validate the interactive lexicon building interface via a user study and expert reviews. Thequantitative evaluation shows that the bipolar lexicon generated with our methods is comparable to human-generated ones.
Index Terms—Text analytics, visual analytics, word embedding, text summarization, text classification, concepts.
1 INTRODUCTION
We live in a world that routinely produces more textual data on adaily basis than can be comfortably viewed—let alone analyzed—by
• D. Park and N. Elmqvist are with University of Maryland in College Park,MD, USA. E-mail: {intuinno, elm}@umd.edu.
• S. Kim is with Google Inc. in Mountain View, CA, USA. E-mail:[email protected].
• J. Lee and J. Choo, the corresponding author, are with Korea University inSeoul, Republic of Korea. E-mail: {jurim0301, jchoo}@korea.ac.kr.
• N. Diakopoulos is with Northwestern University in Evanston, IL, USA.E-mail: [email protected].
Manuscript received xx xxx. 201x; accepted xx xxx. 201x. Date of Publicationxx xxx. 201x; date of current version xx xxx. 201x. For information onobtaining reprints of this article, please send e-mail to: [email protected] Object Identifier: xx.xxxx/TVCG.201x.xxxxxxx
a single person in virtually any given domain: finance, journalism,medicine, politics, and business, to name just a few examples. As aresult, automatic text analysis methods, such as sentiment analysis [34],document summarization [4], and probabilistic topic modeling [3] arebecoming increasingly important. Central in most of these methods isthe focus on textual concepts, defined as a set of semantically relatedkeywords describing a particular object, phenomenon, or theme. Forexample, sentiment analysis can be viewed as analyzing documentsaccording to two concepts: positive and negative sentiment. Similarly,the topics derived in topic modeling can be thought of as document-driven concepts. The benefit of this unified view is that concepts, oncecreated, can then be shared and reused many times, similarly to widelyapplicable lexicon sets such as Linguistic Inquiry and Word Count(LIWC) [37] or General Inquirer (GI) [39].
Generally, building a lexicon for a particular concept requires signif-icant human effort, and thus only a limited number of human-generatedconcepts have been available, usually with a small number of keywords

Fig. 2. Workflow of ConceptVector, involving human- and machine-sidetasks in a collaborative manner. See Section 5 for details.
contained in each. Recently, Fast et al. [14] proposed a technique calledEmpath, which uses state-of-the-art word embedding [31] to efficientlybuild a semantically meaningful lexicon for a concept. Given user-provided keywords, such as ‘bleed’ and ‘punch,’ Empath automaticallygenerates semantically related keywords (e.g., ‘violence’). This enablesuser-driven document analysis from diverse aspects. For example, theyfound that deceptive languages in fake reviews tend to use strongerand exaggerated words while real reviews often use spatial words todescribe their experiences with a concrete detail.
However, we claim that without considering the document contextand keyword usage patterns in it, the blind application of a pre-builtlexicon for document analysis can easily lead to a misunderstanding ofdocuments. For instance, when we compare Twitter messages from theU.S. 2016 presidential candidates using a built-in lexicon provided byEmpath, we found that Donald Trump used twice as many keywords inan ‘alcohol’-related lexicon than the other candidate. Close inspectionof the usage pattern of this lexicon revealed the single word lightweightas a dominant keyword. Lightweight is colloquially used for a personwho cannot withstand an alcoholic drink, thus it found its way intothe lexicon for ‘alcohol’. However, Trump used this keyword to mockpeople as less influential or important, therefore this keyword is notrelated to an ‘alcohol’ concept in this corpus. This illustrates thedifficulty in applying a lexicon to document analysis in a custom domainbecause of different usages of keywords in their context.
Motivated by this challenge, we present a visual analytics systemcalled CONCEPTVECTOR1, which seamlessly integrates a user-drivenlexicon-building process with customized document analysis in a highlyefficient and flexible manner. As shown in Figure 1, a user can createa lexicon for a particular concept in mind by easily adding their ownkeywords or system-recommended keywords. The user can tag someother recommended words explicitly as irrelevant, allowing for steer-ing the meaning of a concept by weakening the overall relevance ofthose words. ConceptVector also supports the construction of bipolarconcepts (e.g., positive vs. negative sentiments, liberal vs. conservativepolitical orientation, and Trekkie vs. Star Wars fans) that can be mod-eled by providing two sets of seed words corresponding to differentpolarities. ConceptVector also allows users to analyze a document cor-pus with respect to diverse concepts, such as analyzing product reviewsbased on sentiment, blog posts based on political orientation, or tradearticles based on business sectors. As shown in Figure 2, this processis tightly integrated with the concept-building process described aboveso that users can customize concepts during document analysis.
Our quantitative evaluation validates the proposed bipolar conceptbuilding model by comparing automatically generated rankings with asmall number of seed words to the human-labeled rankings of words for‘happiness’ [11]. We also present a user study to evaluate the interactiveconcept-building process, where we compared the performance of alexicon-building process against using an online thesaurus (Thesaurus.com) and the WordNet [33] lexical database. We also provide usagescenarios demonstrating the concept-based document analysis process.
In summary, the contributions of our work include the following:
1http://www.conceptvector.org/
• A visual analytics system called CONCEPTVECTOR where userscan interactively build and refine a lexicon for custom conceptsand analyze a document corpus using them in a seamless manner;
• Models for user-steerable word-to-concept similarities incorpo-rating irrelevant keywords as well as bipolar concepts; and
• Quantitative results comparing the capabilities of our word-to-concept similarities to human-labeled ones; and
• Results from a user study comparing concept generation perfor-mance using ConceptVector to Thesaurus.com and WordNet.
2 RELATED WORK
Numerous previous studies exist to scale up human capability to makesense of a large-text corpora. ConceptVector is a visual analytics sys-tem that uses word-level semantics using a lexicon for concepts. In thissection, we discuss current research related to our work from three per-spectives: (1) manual approaches for constructing word relationshipsand hierarchies, (2) automatic word-embedding approaches, and (3)visual analytics approaches for word-level content analysis.
2.1 Building Word Relationships and HierarchiesManually building a lexicon with coherent semantics has long been anactive area of research. LIWC [37] is an example of a manually builtlexicon that characterizes various concepts. The General Inquirer2 isa comparable line of research that builds lexica in diverse concepts.Beyond building a lexicon for a particular purpose, researchers havealso developed sophisticated structures that hold relationships and hier-archies of words.
Unlike these methods, which rely on a small number of experts tocompose a lexicon, the Hedonometer project [11] employed crowd-sourcing to build a lexicon for sentiment ranking. One benefit of thisapproach is its large-sized lexicon, containing the ranked list of 7,000words in terms of the degree of happiness.
Although these manually-built databases, which store relationshipsand hierarchies of words, provide high-quality information for variousnatural language understanding and text analysis tasks, the main issueis the significant human effort needed to create and validate them. Thismakes it difficult for a single user to efficiently create a lexicon fortheir own purpose. Because of this high cost, only a limited number ofwidely applicable concepts can be built, and building a domain-specificcustom lexicon has not been well-supported. This has motivated a slewof automatic methods to craft a lexicon for custom concepts.
2.2 Word EmbeddingWord embedding computes semantically meaningful vector representa-tions of words in a high-dimensional space. Compared to traditionalmethods of representing a word as a vector, such as the bag-of-wordsrepresentation [29] or latent semantic indexing [9], recent word em-bedding methods such as word2vec [31] and GloVe [38] have twonoteworthy advantages in terms of high-level semantics: meaningfulnearest neighbors and linear substructures [38]. Regarding the first,these techniques nicely capture semantically related words as the near-est neighbors of a particular word in a vector space. As for linearsubstructures, the vector obtained by subtracting two words in a vectorspace often yields semantics that contrast the words. For instance, ifwe subtract a word vector ‘queen’ from ‘king’ and then add ‘girl,’ theresulting vector corresponds to ‘boy.’ This stems from the fact thatthe vector from ‘king’ to ‘queen’ and from ‘boy’ to ‘girl’ are similar,commonly representing the notion of gender (from male to female).
Since such word embedding techniques have shown their advan-tages in numerous tasks in natural language processing and informationretrieval, advanced word embedding techniques have recently beenactively studied. Ling et al. proposed to use multidimensional trans-formation matrices to flexibly capture different semantics of a singleword [27], which led to better representations for part-of-speech taggingtasks. Similarly, assigning more weight to a particular word than other
2http://www.wjh.harvard.edu/ inquirer/

words in a sentence produced better word embeddings by extendingthe continuous bag-of-words model [28]. The weights are computed byan attention model, yielding better performance than neural networkmodels [1]. Tian et al. integrated an Expectation-Maximization (EM)algorithm with the continuous skip-gram model to handle the polysemyproblem [42]. For example, the word ‘bank’ can have multiple vectorrepresentations corresponding to ‘a place related to money’ and ‘aplace where water runs,’ respectively. Besides transforming word-levelembeddings, several efforts extended this technique to document-levelembeddings that yielded good performance in information retrievaltasks [20,24]. Other notable recent studies applied the technique to ma-chine translation [30,32]. Additionally, the skip-gram idea of word2vechas been applied in generating the embeddings of entities in other do-mains, e.g., bibliographic items in scientific literature [2] and nodesin a network analysis [15]. Finally, and most relevant to this work,Fast et al. [14] showed that word embedding can be used to expeditelexicon-building so that users can easily create their own concepts.
2.3 Word-Level Content Analysis
The use of a coherent set of keywords for characterizing a particularconcept has wide applicability in various document analysis tasks.For instance, the problem of sentiment analysis has been tackled byidentifying a set of keywords expressing the positive (or the negative)sentiment, possibly with different degree values, which is also knownas a lexicon-based sentiment analysis [34, 40]. In topic modeling, suchas latent Dirichlet allocation (LDA) [3], a topic represents a set ofsemantically related keywords found in a document corpus, e.g., sports-or science-related topics, from a large amount of news articles. Recentstudies by Kim et. al [19, 21] are particularly notable because theyintroduced a continuous embedding space similar to concepts of thispaper, although they only covered emotion-related concepts.
Topic modeling has also been actively employed in visual analyticsapproaches for document analysis. TIARA [44] is one of the first visualanalytic systems that integrated LDA with interactive visualization.This system visualizes the topical changes of documents over time in astreamgraph view reminiscent of ThemeRiver [16]. Other studies, suchas ParallelTopics [12] and TextFlow [8], also focused on visualizingtopical changes over time in document data using different visualizationtechniques, such as parallel coordinates and custom glyphs, respectively.In most of these studies, the key information for understanding the visu-alized topics is a set of dominant keywords associated with each topic.However, the number of topics can be as large as several hundreds orthousands [41]. This makes manual interpretation of topic character-ization or topic labeling a main bottleneck for its effective usage. Tofacilitate this task, Termite [7] provides an interactive visualization withwhich a user can explore topics in terms of their dominant keywords,as well as the overlapping patterns of keywords among different top-ics. In addition, various interactive capabilities that can steer the topicmodeling process in a user-driven manner have been studied as well.iVisClustering [26] allows a user to perform a user-driven topic model-ing process by interactively constructing topic hierarchies and changingkeyword weights of a topic. Chang et al. introduced a user-drivenclustering system based on knowledge-graph embeddings [5]. Morerecently, non-negative matrix factorization [25] has been proposed asan alternative topic modeling method that can flexibly support varioususer needs such as splitting and merging topics, creating a new topicvia particular keywords, and supporting user-driven topic discovery [6].
Our ConceptVector work in this paper has much in common withtopic modeling: both try to summarize documents, and both expresswords and documents as high-dimensional vectors. However, theydiffer in whether humans or the document corpus itself drive the latentsemantics behind each dimension. Topic modeling, therefore, is better-suited for finding hidden underlying topic clusters, while ConceptVectorprovides better interpretability and transferability. In this sense, topicmodeling and ConceptVector are complementary.
Lexicon-based document analysis has also been applied in variousapplication domains. Kwon et al. [23] utilize a manually-built lexi-con to identify online health community postings that share personalmedical experiences. In most of these previous studies, the document
analysis relies on dictionaries equipped with properly chosen words fora particular need, for which the ConceptVector system aims.
3 MOTIVATION: CONCEPT-BASED DOCUMENT ANALYSIS
To motivate this work, here we describe two real-world examples ofconcept-based document analysis done by using Empath and JupyterNotebook.3 First, we show how concepts can reveal underlying dif-ferences in two document sets, such as tweets from Hillary Clintonand from Donald Trump, highlighting the importance of the lexiconbuilding process integrated with its refinement during the documentanalysis. Second, we demonstrate how NASDAQ 100 companies canbe clustered using the differences in concepts and how each cluster canbe interpreted using tweets mentioning them.
3.1 Tweets by U.S. 2016 Presidential CandidatesEmpath [14] provides pre-built lexica of various concepts that can beused to compare two document groups. Using these 194 pre-built con-cepts provided by Empath, we analyzed tweets composed by HillaryClinton and Donald Trump.4, each of which contains about 3,000tweets. Figure 3(a) shows the top ten categories statistically signifi-cantly different from each other (p < .01). For example, Trump men-tioned more terms in the ‘ugliness’ (13.9 odds), ‘swearing terms’ (6.7odds), and ‘surprise’ (5.8 odds) concepts, while Hillary used more inthe ‘sexual’ (4.97 odds), ‘eating’ (4.6 odds), and ‘home’ (4.2 odds)categories. Interestingly, Trump used more casual languages whileHillary’s tweets contained words related to ‘anger’ and ‘disgust.’5
However, our further examination reveals numerous false positives.Figure 3(b) shows the most dominant keywords corresponding to eachconcept. While some keywords make sense, e.g., ‘wow’ in the ‘surprise’category, less meaningful words exist in other categories. For example,Trump was shown to talk more about the ‘plant’ concept because ofthe term ‘bush,’ which in fact indicates Jeff Bush. ‘crooked’ in the‘ugliness’ concept means ‘deformed’, whereas Trump is using it in hiscatchphrase ‘Crooked Hilary’ to mean ‘not straitforward; dishonest.’Also another strong concept of ‘hipster’ was due to the term ‘looking.’,while ‘swearing terms’ was due to ‘bad.’ In Hillary’s case, the ‘sex-ual’ concept was due to ‘violence,’ which did not make much sense.After removing these words (false positives or Type II errors) fromthe corresponding concepts, these concepts no longer show significantdifferences between the two.
3.2 Tweets from NASDAQ 100 CompaniesConcepts can be also used to extract meaningful features from docu-ments. Given tweets about NASDAQ 100 companies,6 our goal here isto find meaningful clusters and their distinct characteristics by usingconcepts as features. That is, for a set of tweets belonging to eachcompany, we obtain its 194-dimensional feature vector by computingthe occurrence count of words contained in each of 194 pre-built con-cepts. Afterwards, we perform k-means clustering and 2D embeddingvia principal component analysis (PCA) [17].
The results (Figure 4(a)) reveal that many words from the companyname affect the results, e.g., ‘cooking’ and ‘restaurant’ categoriesfor Dish Network Corporation. Companies containing ‘technology’in their names form a single cluster due to similar reasons. Afterremoving these words from the lexicon of the corresponding conceptand recomputing feature vectors, the clustering results are shown to bemore reasonable (Figure 4(b)). For example, Marriott and TripAdvisorform a single cluster due to the high frequency of words in ‘tourism,’‘warmth,’ ‘sleep,’ and ‘vacation’ mainly due to the word ‘hotel’ and‘hot.’ Companies with their tweets containing negative sentiments suchas ‘ridicules,’ ‘neglect,’ ‘kill,’ or ‘hate’ are clustered together.
This example shows that document analysis using concepts as afeature extractor is useful, but that existing systems such as Empath
3http://conceptvector.org/#/twitter4https://www.kaggle.com/benhamner/clinton-trump-tweets5http://graphics.wsj.com/clinton-trump-twitter/6http://www.followthehashtag.com/datasets/nasdaq-100-companies-free-
twitter-dataset/

−5 0 5 10
ocean
hipster
sleep
morning
fire
plant
beauty
surprise
swearing_terms
ugliness
sexual
eating
home
medical_emergency
youth
health
joy
disgust
anger
children
Hillary
Trump
−5 0 5 10
ocean
hipster
sleep
morning
fire
plant
beauty
surprise
swearing_terms
ugliness
sexual
eating
home
medical_emergency
youth
health
joy
disgust
anger
children
1st Word2nd Word3rd Word4th Wordetc
crookedbad
wow
bush
looking
violence
(a) Top 10 categories between Trump and Hillary (b) Detailed analysis of top words in each category
Fig. 3. Comparison of tweet messages from Hillary Clinton and from Donald Trump during the U.S. 2016 presidential election. The odd ratios of thetop 10 categories show differences between the two candidates in (a). The analysis on actual keywords contributing to their corresponding categoryscores reveals limitations of using the pre-built lexicon in (b). Red dotted categories does not make sense, because a irrelevant top word is counteddominantly. For example, keywords such as ‘bush’ in the ‘plant’ category and ‘looking’ in the ‘hipster’ category are not relevant to their categories.
lack the integrated support for concept construction and refinement, aswell as interactive concept-based analysis itself.
4 CONCEPTVECTOR IN ACTION
Motivated by the limitations of using pre-built lexica, ConceptVectoraims at facilitating user-driven concept building as well as the subse-quent concept-based document analysis in a seamless manner.
While the previous examples started with pre-built lexica, we nowpresent how ConceptVector can be used to build custom concepts inthe task of journalistic curation of user comments on online news.Moderation of online comments can follow various approaches, andoften includes mechanisms to remove uncivil, profane, or otherwiseinflammatory comments. That is, however, not our focus here, whereinstead we consider the approach championed by the New York Times,in which editorially interesting and insightful comments are selectedand highlighted on the site as “NYT Picks” comments. Below wepresent a scenario showing how an expert community moderator froman organization such as the New York Times could leverage the capa-bilities of ConceptVector to define and deploy those concepts useful forfinding and selecting “NYT Picks” comments.
It is helpful to understand the general editorial attitude andapproach—the persona—of an online news moderator. Prior researchhas enumerated several dimensions of editorial interest for findinghigh-quality comments including factors such as comment relevance,argument quality, novelty, and personal experience [10]. Importantly,different articles or sub-communities on a site demand different ap-proaches to moderation and the application of different editorial crite-ria [35]. Diversity is a dimension of utmost importance to commentmoderators; it is a difficult task to select high-quality comments thatalso reflect the diversity of voices available in a comment stream. Con-ceptVector is well-suited to enabling such diverse selection because ofits capabilities to allow moderators to develop content-specific or evenarticle-specific concepts to apply to different contexts, and to see howcomments are scored when applying that concept.
Let us follow Laurie, a hypothetical comment moderator at the NewYork Times who is trying to moderate comments on several differentarticles. Her task is to pinpoint diverse but representative comments tohighlight on the site as “NYT Picks.”
The article she is examining is entitled “Seas Are Rising at FastestRate in Last 28 Centuries”, which has over 1,200 comments when she
logs on.7 She is really not looking forward to this one, because anarticle like this always brings out the global warming skeptics who cancause quite a ruckus. The article is specifically about the idea of ‘tidalflooding’, i.e., the notion that coastal areas will be flooded more oftenas sea levels rise. Using ConceptVector, she first wants to develop atightly defined concept on this specific idea of ‘tidal flooding’ so thatshe can find comments maximally relevant to the article.
Laurie creates a unipolar concept for ‘tidal flooding’ by typing inits relevant keywords, starting with the words ‘tidal’ and ‘flooding.’She then sees related words as recommendations in the scatterplot thathelp her flesh out the concept by adding related terms such as ‘flood’,‘floods’, ‘tide’, and ‘tides,’ as shown in Figure 1. She examines theclusters of other terms generated, and decides to avoid words related tospecific instances of tidal flooding, such as ‘katrina’, or those associatedwith storms and hurricanes, such as ‘storm,’ ‘raging,’ or ‘swell.’ Shewants to keep this a general-purpose concept. Moving on to the secondphase, she applies the concept to the comments on the article andimmediately notices other key terms, e.g., ‘storm,’ highlighted as yellowin the retrieved comments. She then adds them to the relevant keywordset of the concept using the integrated concept editor.
Based on her understanding of media framing, Laurie knows that peo-ple often discuss complex issues in terms of specific frames relating todefinitions, causal interpretations, moral evaluations, and solutions [13],as well as using topical perspectives like economic, political, or scien-tific. She decides to find a comment to highlight that deals with tidalflooding from the perspective of economic implications. Similar to howshe developed the unipolar concept for ‘tidal flooding,’ she developsanother unipolar concept relating to economic implications. She startswith ‘economic,’ and the scatterplot of recommended words leads herto add related terms such as ‘economy’ and ‘economies’, as well assome of the negative implications that she wants to include, such as‘crisis’, ‘impact’, ‘turmoil’, and ‘instability.’ Her economic concept isthus tuned towards negative economic impacts that could arise.
To apply the combinations of these two concepts, Laurie checksthe distribution showing all comments plotted against the relevancescores to each of the two concepts (Figure 5). Here she maps the ‘tidalflooding’ concept on the x-axis and the ‘economy’ concept on the y-axis. She then brushes on the scatterplot to find comments containingboth concepts, and these comments are filtered into the ranked list.
7http://www.nytimes.com/2016/02/23/science/sea-level-rise-global-warming-climate-change.html

nightreligioneating
restaurantcooking
DISH Network Corporation
Companies ending with ‘Technology’
technologycomputer
schoolprogramming
science technology
technologytechnology
After Re�ning Dictionary
hatekill
neglectart
ridiculeCompanies with Negative Contents
(a) (b)
technology
technology
dishdish
dish
Marriott and TripAdvisor
vacationsleep
firewarmthtourism
hotelhothot
hotel
hotelhot
hothotel
Fig. 4. PCA 2D projection of NASDAQ 100 companies with their k-means clustering labels color-coded, where the feature vector of each company iscomputed from its tweets’ word count in each of 194 concepts. The clustering using the pre-built lexica shows some outliers (a), where the furtherinvestigation of contributing words shows that the company name itself act trivially as strong signals, such as ‘dish’ in Dish Network Corporation.Another cluster is shown to be formed because of the common word ‘technology’ in their names. After excluding them in the initial lexicon, moremeaningful clusters are revealed. For example, Marriott and TripAdvisor form a cluster because of words in ‘tourism,’ ‘vacation,’ and ‘sleep’ concepts(olive green with a black border). Companies with negative sentiments such as ‘ridicules,’ ‘neglect,’ ‘kill,’ and ‘hate’ were also clustered together(bright red dots with red border).
Fig. 5. Distribution of comments across the ‘tidal flooding’ (X-axis) andthe ‘economy’ (Y-axis) concepts. A comment that has scored relativelyhigh on both concepts is selected (orange box). The content of thecorresponding comment within this dataset is shown.
She finds an insightful comment she likes that perfectly combines thetwo concepts, discussing coastal flooding in terms of impacts to theeconomy as exposed through the insurance industry. She marks thecomment as a “NYT Pick” and it gets highlighted on the site.
She then begins to read those comments with high scores from thetop of the list and quickly finds an insightful one indicating that someof the coastal flooding in Virginia has actually been shown to be a resultof subsidence of land. Laurie thinks that highlighting this will deepenthe discussion online by pointing out the diverse factors that societyneeds to grapple with as it confronts global warming. Therefore, shemarks this comment as an “NYT Pick” as well.
5 THE CONCEPTVECTOR SYSTEM
Motivated by the limitations of using pre-built lexica for concept-baseddocument analysis, ConceptVector is a visual analytics system thattightly integrates concept building and refinement with direct supportfor concept-based document analysis. In detail, our design rationalebehind ConceptVector is as follows:
D1 Supporting diverse user needs in concept building. Users mayhave diverse meanings in mind for defining their concepts. Thus,users should be able to construct the lexicon of a concept fromscratch and/or refine a pre-built one in an efficient manner.
D2 Supporting integrated analysis of iterative lexicon refine-ment and concept-based document analysis. As seen from ourmotivational examples (Section 3), even carefully curated lexicaneed to be adjusted depending on a document corpus. Thus, theconcept-based document analytics system should provide inter-active refinement capabilities of a lexicon as well as dynamicdocument analysis based on the updated lexicon.
D3 Revealing lexicon word context in documents. The systemshould allow users to understand how the words in a lexicon areused in documents in terms of their context.
In this section, we explain how our front-end interfaces and theback-end computational modules support these tasks and associateseach components with design guidelines.
5.1 Front-end Visual InterfaceBased on our design rationale, the text analytics process in ConceptVec-tor is composed of two iterative processes: concept building and docu-ment analysis (Figure 2). We introduce views that support each loop.
5.1.1 Concept Building ViewAs shown in the left pane of Figure 2, the concept building processallows a user to interactively build the keyword sets describing a user’sintended concept. Figure 1 shows a screenshot of our front-end interfacesupporting this process when building the ‘tidal flooding’ concept.
We define two types of concepts: bipolar and unipolar. Bipolarconcepts have two nontrivial polarities, e.g., positive vs. negative senti-ments, happiness vs. unhappiness, etc., while unipolar concepts have asingle one, e.g., work-related (or not), biology-related (or not), etc. Tosupport both types, ConceptVector models a particular concept usingthree different sets of keywords: positive, negative, and irrelevant (D1).In the case of unipolar concepts, the positive keyword set contains thosekeywords relevant to a concept of interest, while the negative set isan empty set. For both types, the irrelevant keyword set indicates thewords marked as explicitly irrelevant by the user.
The user starts the concept building process by adding a small num-ber of seed keywords to describe their concept. ConceptVector thenrecommends keywords that are potentially relevant to the seed key-words for each positive and negative keyword set, and performs k-means clustering, where we set k as 5, based on their word embeddings.The keyword clusters are presented to the user (Figure 1(3)), alongwith their 2D embedding view, computed by t-distributed stochastic

neighbor embedding (t-SNE) [43] (Figure 1(4)). Checking these rec-ommendation results, they can expand the initial keyword set by (1)adding individual words, (2) a cluster of them, or (3) move words tothe irrelevant set (D1). This iterative concept building continues untilthe user is satisfied with the constructed keyword set.
Those relevant (or irrelevant) keywords often appear together in asingle cluster, and processing words at the cluster level makes the con-cept building process much more efficient than without clustering (D1).For example, if a user enters ‘happy’ as the only keyword for a concept,those irrelevant words such as ‘everyone,’ ‘anyway,’ ‘yes,’ and ‘any-more’ are recommended as a single cluster, while semantically relevantwords such as ‘glad,’ ‘good,’ and ‘thrilled’ form another cluster. Whenthe semantic distinction among words is not clear, users can still tagindividual words in the cluster.
The t-SNE embedding space has very strong neighboring effects [31,38], placing similar words closely to each other, and thus the 2Dembedding view shows the distribution among user-initiated keywordsand recommended ones. Users can enter/remove keywords in the t-SNEviews as well (D1).
5.1.2 Concept-Based Document Analysis View
As shown in the right pane of Figure 2, concept-based document anal-ysis allows the user to analyze a document corpus with respect toconstructed concepts. Figure 1(b) shows a screenshot corresponding tothis process. See Section 4 for a detailed description.
Given a single or multiple user-selected concepts, ConceptVectorcomputes the relevance scores of documents to each concept and re-trieves/ranks those documents with high score values (Figure 1(10)),which would be meaningful to the user that created/selected the cor-responding concept. To help the user understand why these docu-ments have high scores, the significantly contributing keywords arehighlighted in yellow color (D3). Please note that our relevance scor-ing algorithm is not limited to the keywords registered in the posi-tive/negative/irrelevant sets, but that other keywords potentially relevantto the concepts are considered as well. We will describe the algorithmfurther in the following section.
Additionally, ConceptVector provides two different views: a tem-poral view showing the concept strength over time, and a scatterplotshowing the distribution of documents according to the relevance scoresto the two different concepts, e.g., ‘tidal flooding’ vs. ‘economy’ con-cepts (Figure 5). According to the Janicke et. al., extraction, evolution,and clustering is three main tasks in the taxonomy of visual text anal-ysis [18]. The temporal view support temporal tracking of the topicsignal evolution, while the scatterplot allows and mapping/clusteringdocuments in semantic space. Users can assign the user-defined con-cepts as axes of the scatterplot to explore the distribution of the semanticmeaning of documents (D2). Note here that we use a modified versionof a scatterplot, where both dimensions are binned and dots are scaledto fill the assigned space [36]. This improves the visibility of outliersand densely overplotted areas. In these views, the user can brush over atime axis or data items to filter data in the ranked retrieval results.
During the process, the user may add additional words to the relevantand the irrelevant keyword sets of the concept (D2). For example, whenapplying the ‘tidal flooding’ concept shown in Figure 1 to a documentcorpus, the word ‘disaster’ was highlighted due to its high relevancescore to the concept. Since this word is not related to the ‘tidal flooding’concept, the user can add it to the irrelevant keyword set to revisethe concept and update the ranking of documents accordingly. Thisinteraction allows in-situ concept refinement.
Note that the two analysis tasks of concept building and documentanalysis are not separate, but tightly connected in ConceptVector, sothat the user can fluidly switch between concept building/refinementand document analysis based on concepts.
5.2 Back-end Relevant Scoring Model
ConceptVector is built upon the vector representations of words gen-erated by word embedding techniques such as word2vec [31] orGloVe [38]. In this step, the training corpus for word embeddings
could be a generic one such as Wikipedia articles or one within a partic-ular domain, so that the trained vectors can better reflect the semanticsof the domain. ConceptVector currently adopts the pre-trained vectorembedding using Wikipedia articles by GloVe.8
ConceptVector represents a concept C as the three set of keywords:the positive, the negative, and the irrelevant ones—Lp, Ln, and Li,respectively. Given a word or a document, ConceptVector computes itsrelevance scores to the concept, based on the probability of a given wordbelonging to each of Lp, Ln, and Li using a kernel density estimation(KDE) method.
In detail, let us denote q as the vector representation of a query word,l as that of the keyword contained in the keyword set L, where L can beone of Lp, Ln, and Li. We define the probability of q belonging to L as
p(q|L) = 1|L| ∑x∈L
k (q, l) , (1)
where k (q, l) represents a kernel function computing the similarityvalue between the two word vectors q and l. That is, Eq. (1) computesthe average similarity values between q and each word l contained in aparticular keyword set L. The reason for using a kernel function insteadof a simple similarity measure such as cosine similarity is because thisprovides not only a user-controllable, flexible similarity measure butalso a principled probabilistic framework of incorporating multiplesimilarities of q with Lp, Ln, and Li, as will be described later.
The choice of the kernel function k (q, l) can vary, but in ConceptVec-tor, we adopted a Gaussian kernel defined as
k (q, l) =1√
2πσ2exp
(−‖q− l‖2
2σ2
),
where σ2 is the bandwidth parameter that determines how quickly thesimilarity decreases as the L2 distance increases. A small bandwidthvalue gives a high similarity only on the words exactly contained inL, which is suitable when L contains many words and one does notwant to consider other words outside L as relevant to the concept. Alarge bandwidth, on the other hand, will consider many of the outsidewords as relevant to L, which is useful when a user wants to define theconcept in a broad and flexible manner, not just limited to those wordscontained in L.
Viewing p(q|L), which is computed by Eq. (1), as the likelihood ina Bayesian context, one can define the prior probability p(L) and theposterior probability p(L|q), respectively, as
p(L) =|L|∣∣Lp
∣∣+ |Ln|+ |Li|, and
p(L|q) = p(L) · p(q|L)p(Lp) · p(q|Lp)+ p(Ln) · p(q|Ln)+ p(Li) · p(q|Li)
.
Using them, the final relevance score r (q,C) of a query word q to theconcept C is computed as
r (q,C) =(1− p(L = Li|q))·(
p(Lp) · p(q|Lp)− p(Ln) · p(q|Ln)).
Basically, r (q,C) computes the differences between the joint proba-bilities p(q, Lp) and p(q, Ln), ranging nicely between −1 and +1, andfurthermore, as p(L = Li|q) increases, r (q,C) becomes close to zero,indicating irrelevance to the concept.
In the case of a unipolar concept, the relevance score is computedin the exact same manner by setting Ln = /0. These bipolar scores andunipolar scores are used for recommendation of relevant words.
Finally, the relevance score of a document to a particular concept iscomputed by simply taking the average relevance score among all thewords contained in a document.
8http://nlp.stanford.edu/projects/glove/
5.3 Implementation DetailsConceptVector was implemented as a web-based application usingD3 and AngularJS. We employed the New York Times online articlecomments as our corpus; naturally, the approach can be applied to anydocument corpus. We selected articles with more than 300 commentsfrom the most popular articles during the period August to September2016. Articles and comments were collected using the NYT API.9
The back-end computational modules were implemented usingPython with the Flask framework.10 The key computation shownin Eq. (1) for recommending relevant words requires computing theone-to-all distances for all words in the current keyword set (either pos-itive, negative, or irrelevant). Computing a single one-to-all distancesrepeatedly due to frequent user interaction may slow down the overallprocess. We instead compute the one-to-all distance incrementally witha cache that contains recently computed pairs. This is possible becausethe user incrementally adds a single word at a time to the keyword set.To this end, a least recently used cache of size 10,000 word pairs wasemployed, resulting in a speed-up for efficient user interactions.
6 EVALUATION
There are many interconnected components in visual analytics systems,which complicates their overall evaluation. Here we separate the visualinterface and the back-end computation and evaluate them individu-ally with a user study and a quantitative evaluation, respectively. Forthe front-end, we focus on the effectiveness of the concept buildingview because document analysis requires domain knowledge and issubjective to individual differences. For the back-end, we validate theeffectiveness of supporting the process of building bipolar concepts.Although we did not evaluate a unipolar case, we generally expectthe same level of effectiveness since it follows the process similar yetsimpler than the bipolar case. Finally, we also include results froman expert review comparing ConceptVector to Empath [14] to showConceptVector’s performance in relation to the state of the art.
6.1 Evaluation of Concept BuildingWe conducted a user study to evaluate how users generate lexica withConceptVector compared to WordNet [33]11 and Thesaurus.com12 asbaselines. WordNet is known for its large-scale lexical database, andThesaurus.com is an online thesaurus containing exhaustive synonymsand antonyms for the English language. We employed the followingperformance metrics: (i) the completion time for building concepts,and (ii) the quality of the resulting concepts.
6.1.1 MethodologyWe recruited 15 graduate students (1 female and 14 males) majoring incomputer science to participate in the study. All participants reportedhigh computer skills.
Each study session lasted 15–25 minutes and involved three systems:ConceptVector, WordNet, and Thesaurus.com. Before starting the ses-sion, a test administrator briefly explained how to use the systems andallowed the participant to spend enough time to familiarize themselves.Participants were then asked to build a lexicon for three concepts: ‘fam-ily’, ‘body’, and ‘money’, which we selected as relatively neutral andeasily comprehensible by all participants. Each participant was ran-domly assigned to a system for each concept so that at the end of thestudy they had used all three conditions. Each concept-building taskwas capped at three minutes. All three systems, including ConceptVec-tor, were accessed by their official websites. We recorded both thelexicon each participant created as well as the number of keywords init as a dependent variable.
As the ground truth lexicon for each concept, we selected threedictionaries from Linguistic Inquiry and Word Count (LIWC) 2007 [37].The ground truth lexicon sizes of the three concepts are 65 words for‘family’, 180 for ‘body’, and 173 for‘money.’ We adopted widely-used
9http://developer.nytimes.com/10http://flask.pocoo.org/11http://wordnetweb.princeton.edu/perl/webwn12http://www.thesaurus.com/
information retrieval evaluation metrics, precision and recall, whereprecision is the fraction of correct answers over the total number ofanswers given, and recall is the fraction of retrieved correct answersout of all correct ones. The null hypothesis assumes the difference ofmethods does not effect the precision, recall, or average number ofwords in the resulting lexicon.
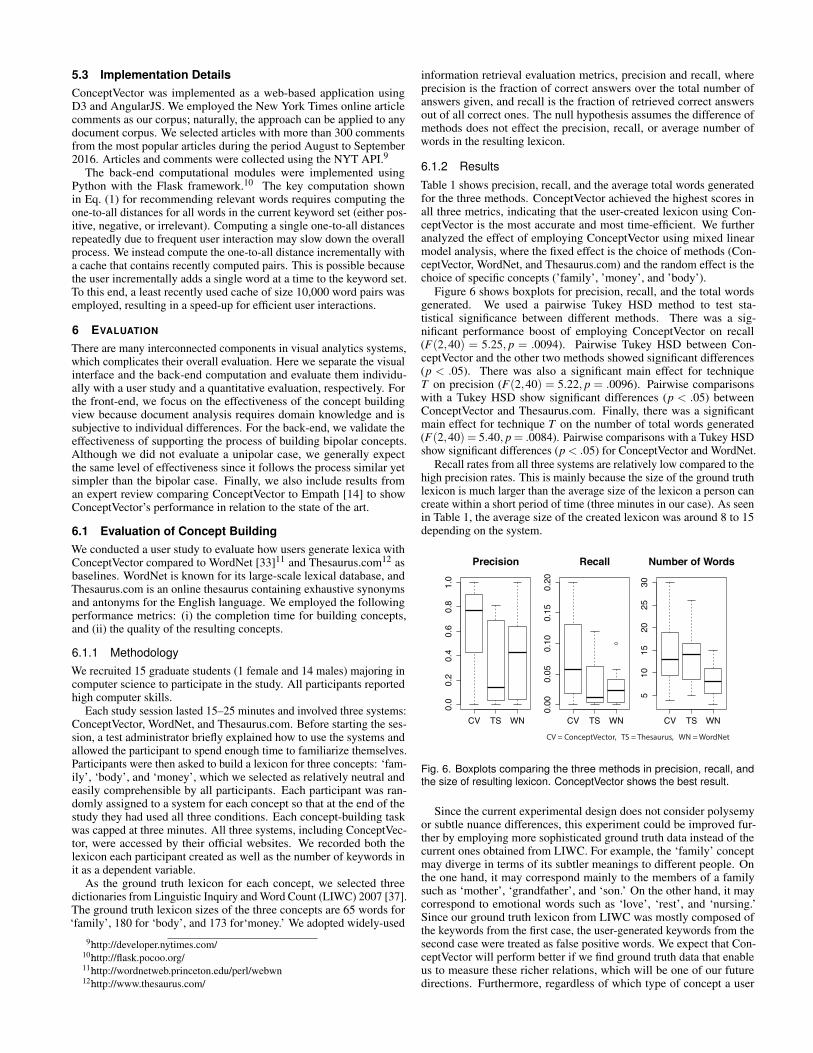
6.1.2 ResultsTable 1 shows precision, recall, and the average total words generatedfor the three methods. ConceptVector achieved the highest scores inall three metrics, indicating that the user-created lexicon using Con-ceptVector is the most accurate and most time-efficient. We furtheranalyzed the effect of employing ConceptVector using mixed linearmodel analysis, where the fixed effect is the choice of methods (Con-ceptVector, WordNet, and Thesaurus.com) and the random effect is thechoice of specific concepts (’family’, ’money’, and ’body’).
Figure 6 shows boxplots for precision, recall, and the total wordsgenerated. We used a pairwise Tukey HSD method to test sta-tistical significance between different methods. There was a sig-nificant performance boost of employing ConceptVector on recall(F(2,40) = 5.25, p = .0094). Pairwise Tukey HSD between Con-ceptVector and the other two methods showed significant differences(p < .05). There was also a significant main effect for techniqueT on precision (F(2,40) = 5.22, p = .0096). Pairwise comparisonswith a Tukey HSD show significant differences (p < .05) betweenConceptVector and Thesaurus.com. Finally, there was a significantmain effect for technique T on the number of total words generated(F(2,40) = 5.40, p = .0084). Pairwise comparisons with a Tukey HSDshow significant differences (p < .05) for ConceptVector and WordNet.
Recall rates from all three systems are relatively low compared to thehigh precision rates. This is mainly because the size of the ground truthlexicon is much larger than the average size of the lexicon a person cancreate within a short period of time (three minutes in our case). As seenin Table 1, the average size of the created lexicon was around 8 to 15depending on the system.
CV TS WN
0.0
0.2
0.4
0.6
0.8
1.0
Precision
CV TS WN
0.00
0.05
0.10
0.15
0.20
Recall
CV TS WN
510
1520
2530
Number of Words
CV = ConceptVector, TS = Thesaurus, WN = WordNet
Fig. 6. Boxplots comparing the three methods in precision, recall, andthe size of resulting lexicon. ConceptVector shows the best result.
Since the current experimental design does not consider polysemyor subtle nuance differences, this experiment could be improved fur-ther by employing more sophisticated ground truth data instead of thecurrent ones obtained from LIWC. For example, the ‘family’ conceptmay diverge in terms of its subtler meanings to different people. Onthe one hand, it may correspond mainly to the members of a familysuch as ‘mother’, ‘grandfather’, and ‘son.’ On the other hand, it maycorrespond to emotional words such as ‘love’, ‘rest’, and ‘nursing.’Since our ground truth lexicon from LIWC was mostly composed ofthe keywords from the first case, the user-generated keywords from thesecond case were treated as false positive words. We expect that Con-ceptVector will perform better if we find ground truth data that enableus to measure these richer relations, which will be one of our futuredirections. Furthermore, regardless of which type of concept a user
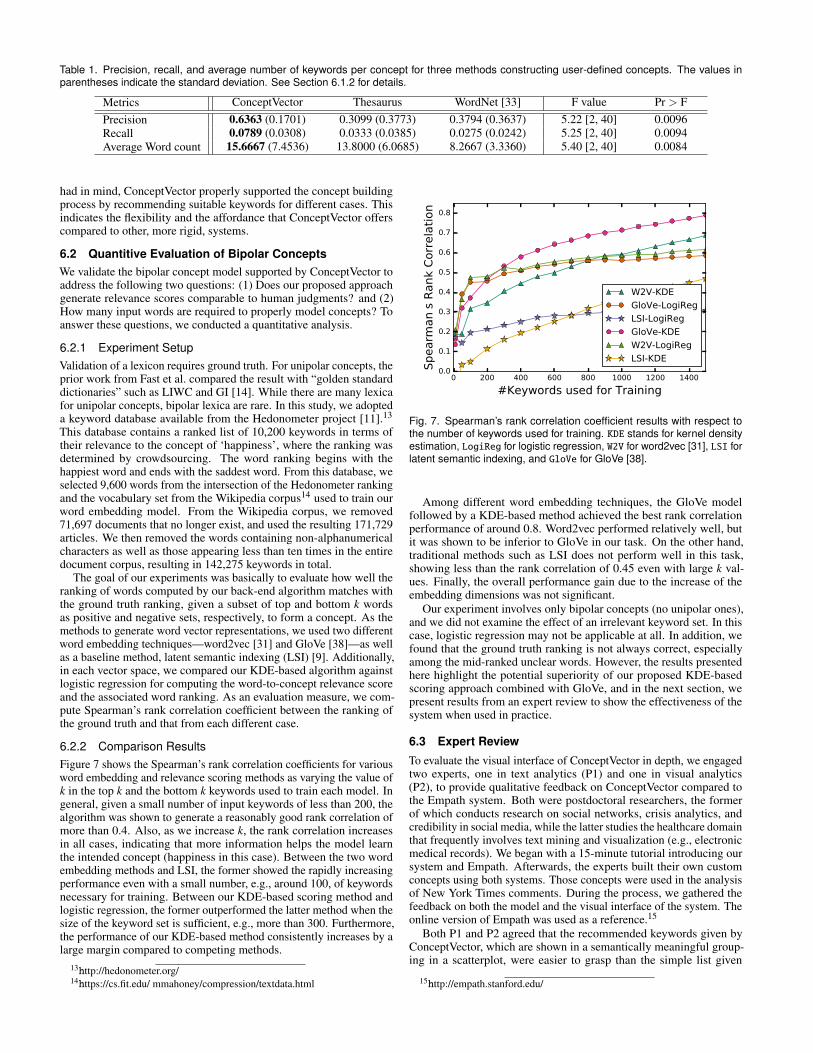
Table 1. Precision, recall, and average number of keywords per concept for three methods constructing user-defined concepts. The values inparentheses indicate the standard deviation. See Section 6.1.2 for details.
Metrics ConceptVector Thesaurus WordNet [33] F value Pr > FPrecision 0.6363 (0.1701) 0.3099 (0.3773) 0.3794 (0.3637) 5.22 [2, 40] 0.0096Recall 0.0789 (0.0308) 0.0333 (0.0385) 0.0275 (0.0242) 5.25 [2, 40] 0.0094Average Word count 15.6667 (7.4536) 13.8000 (6.0685) 8.2667 (3.3360) 5.40 [2, 40] 0.0084
had in mind, ConceptVector properly supported the concept buildingprocess by recommending suitable keywords for different cases. Thisindicates the flexibility and the affordance that ConceptVector offerscompared to other, more rigid, systems.
6.2 Quantitive Evaluation of Bipolar ConceptsWe validate the bipolar concept model supported by ConceptVector toaddress the following two questions: (1) Does our proposed approachgenerate relevance scores comparable to human judgments? and (2)How many input words are required to properly model concepts? Toanswer these questions, we conducted a quantitative analysis.
6.2.1 Experiment SetupValidation of a lexicon requires ground truth. For unipolar concepts, theprior work from Fast et al. compared the result with “golden standarddictionaries” such as LIWC and GI [14]. While there are many lexicafor unipolar concepts, bipolar lexica are rare. In this study, we adopteda keyword database available from the Hedonometer project [11].13
This database contains a ranked list of 10,200 keywords in terms oftheir relevance to the concept of ‘happiness’, where the ranking wasdetermined by crowdsourcing. The word ranking begins with thehappiest word and ends with the saddest word. From this database, weselected 9,600 words from the intersection of the Hedonometer rankingand the vocabulary set from the Wikipedia corpus14 used to train ourword embedding model. From the Wikipedia corpus, we removed71,697 documents that no longer exist, and used the resulting 171,729articles. We then removed the words containing non-alphanumericalcharacters as well as those appearing less than ten times in the entiredocument corpus, resulting in 142,275 keywords in total.
The goal of our experiments was basically to evaluate how well theranking of words computed by our back-end algorithm matches withthe ground truth ranking, given a subset of top and bottom k wordsas positive and negative sets, respectively, to form a concept. As themethods to generate word vector representations, we used two differentword embedding techniques—word2vec [31] and GloVe [38]—as wellas a baseline method, latent semantic indexing (LSI) [9]. Additionally,in each vector space, we compared our KDE-based algorithm againstlogistic regression for computing the word-to-concept relevance scoreand the associated word ranking. As an evaluation measure, we com-pute Spearman’s rank correlation coefficient between the ranking ofthe ground truth and that from each different case.
6.2.2 Comparison ResultsFigure 7 shows the Spearman’s rank correlation coefficients for variousword embedding and relevance scoring methods as varying the value ofk in the top k and the bottom k keywords used to train each model. Ingeneral, given a small number of input keywords of less than 200, thealgorithm was shown to generate a reasonably good rank correlation ofmore than 0.4. Also, as we increase k, the rank correlation increasesin all cases, indicating that more information helps the model learnthe intended concept (happiness in this case). Between the two wordembedding methods and LSI, the former showed the rapidly increasingperformance even with a small number, e.g., around 100, of keywordsnecessary for training. Between our KDE-based scoring method andlogistic regression, the former outperformed the latter method when thesize of the keyword set is sufficient, e.g., more than 300. Furthermore,the performance of our KDE-based method consistently increases by alarge margin compared to competing methods.
13http://hedonometer.org/14https://cs.fit.edu/ mmahoney/compression/textdata.html
0 200 400 600 800 1000 1200 1400
#Keywords used for Training
0.0
0.1
0.2
0.3
0.4
0.5
0.6
0.7
0.8
Spearm
an's Rank Correlation
W2V-KDE
GloVe-LogiReg
LSI-LogiReg
GloVe-KDE
W2V-LogiReg
LSI-KDE
Fig. 7. Spearman’s rank correlation coefficient results with respect tothe number of keywords used for training. KDE stands for kernel densityestimation, LogiReg for logistic regression, W2V for word2vec [31], LSI forlatent semantic indexing, and GloVe for GloVe [38].
Among different word embedding techniques, the GloVe modelfollowed by a KDE-based method achieved the best rank correlationperformance of around 0.8. Word2vec performed relatively well, butit was shown to be inferior to GloVe in our task. On the other hand,traditional methods such as LSI does not perform well in this task,showing less than the rank correlation of 0.45 even with large k val-ues. Finally, the overall performance gain due to the increase of theembedding dimensions was not significant.
Our experiment involves only bipolar concepts (no unipolar ones),and we did not examine the effect of an irrelevant keyword set. In thiscase, logistic regression may not be applicable at all. In addition, wefound that the ground truth ranking is not always correct, especiallyamong the mid-ranked unclear words. However, the results presentedhere highlight the potential superiority of our proposed KDE-basedscoring approach combined with GloVe, and in the next section, wepresent results from an expert review to show the effectiveness of thesystem when used in practice.
6.3 Expert Review
To evaluate the visual interface of ConceptVector in depth, we engagedtwo experts, one in text analytics (P1) and one in visual analytics(P2), to provide qualitative feedback on ConceptVector compared tothe Empath system. Both were postdoctoral researchers, the formerof which conducts research on social networks, crisis analytics, andcredibility in social media, while the latter studies the healthcare domainthat frequently involves text mining and visualization (e.g., electronicmedical records). We began with a 15-minute tutorial introducing oursystem and Empath. Afterwards, the experts built their own customconcepts using both systems. Those concepts were used in the analysisof New York Times comments. During the process, we gathered thefeedback on both the model and the visual interface of the system. Theonline version of Empath was used as a reference.15
Both P1 and P2 agreed that the recommended keywords given byConceptVector, which are shown in a semantically meaningful group-ing in a scatterplot, were easier to grasp than the simple list given
15http://empath.stanford.edu/

by Empath. The scatterplot helped them digest the generated wordsby providing a high-level overview (P2) or chunking the words intosemantically homogeneous groups (P1). It was especially useful inthe early stage of concept building, because irrelevant words formeda separate group in many cases, allowing the user to spot them easilyand mark them as irrelevant. The word clusters (Figure 1(3)) weregood for reading words quickly (P2), and was used during most ofthe concept building process (P1). Furthermore, the t-SNE view (Fig-ure 1(4)) provided an additional benefit of showing the similaritiesbetween words (P1) and the relationships between the input terms andthe recommended terms (P2). For example, whether the input wordsform tight clusters or not gives a visual clue as to whether the generatedconcept is consistent (P1). At the same time, P1 noticed that an inputterm was actually an outlier compared to other input terms forming apacked cluster. After examining this word, he removed it because ithad a very broad meaning and thus dilutes the clarity of the concept.
Both experts noted that the difference between the corpora used totrain word embedding affects the concept quality. Empath used modernamateur fiction data, but ConceptVector used the Wikipedia dataset.For example, when P1 used ‘politics,’ ‘voting,’ and ‘elections’ as seedterms in Empath, the generated words contained several words such as‘shipping’ and ‘readers’ which did not really make sense. Accordingto P1, Empath also generated more ‘high school’-related words. Thisdoes not necessarily mean that one system is better but rather that usingword embedding trained by the corpus suitable for target corpus toanalyze is important. After building a concept about ‘grievance,’ P1noted “The recommended words for the grievance concept is differentfrom what I saw on social media. That is, many legalese and lengthywords related to grievance were recommended, but very unlikely toshow up on social media.” P2 suggested the using ConceptVector as atool to evaluate multiple versions of word embedding models duringiterative model development.
P1 and P2 both agreed that comparing Empath and ConceptVector ischallenging, because the main focus of Empath is not its user interface.P1 thought the visual interface in ConceptVector was useful to explorethe semantic space. Being able to look around and select words that arenot originally shown to him helped to expand the lexicon. P2 pointedout that the document analysis feature of Empath is more of a blackboxand felt uncomfortable with trusting the result. For example, whenanalyzing the Wikipedia page about ‘Ramen,’ the ‘friends’ categorywas ranked as the 6th, but it is not clear which words in the friendscategory were counted.
P1 noted that the word-highlighting feature of ConceptVector allowsfor the easy spotting of false positives, but detecting false negatives isnot currently supported. P2 appreciated the concept score scatterplot(Figure 1(7)), which showed the distribution of comments with respectto custom concepts as axes. It revealed outliers and enabled filteringof comments based on semantic contents. After using ConceptVector,P2 said that it could be useful to build a concept for drugs by addingrelated symptoms and using a positive-negative sentiment as anotheraxis to visualize the sentiment for a particular drug. P2 also liked thatthe concept dictionary can be refined by trial and error.
P1 expressed concern about fundamental limitations of both systems.Both systems use word embedding based on the assumption that wordco-occurrence statistics reflect semantic similarities, which might notbe always true in real-world text analysis. P1 pointed out that whilethe color coding of words to highlight newly recommended wordsis an improvement over Empath, it was still difficult to follow theword changes according to the input terms. P2 liked bipolar conceptsfeatures because it helps in building more sophisticated concepts. Asan alternative design, P2 suggested showing the words interpolatingpositive and negative terms. Those interpolated words will reveal thevalidity of a concept, as suggested in Axisketcher [22].
7 DISCUSSION
ConceptVector is a novel approach for text analysis that falls somewherebetween sentiment analysis performed using manually constructeddictionaries, and topic modeling performed by automatic algorithms.This unique position brings new benefits as well as limitations.
In general, when achieving a particular analytic goal, an interest-ing tradeoff between quality and efficiency can be considered. Thatis, human efforts secure the quality of the outcome, while automatedapproaches can significantly boost the efficiency of our efforts. Forconcept building, purely manual approaches such as LIWC and He-donometer can be viewed as one extreme case, where the task reliescompletely on human effort. Thus, the resulting dictionary is of highquality, but it is achieved by an inefficient, costly process without au-tomation. On the other hand, purely automated approaches such astopic modeling, which generate multiple sets of semantically coherentwords, maximize the efficiency of the task, but the quality of the out-come cannot be controlled by the user. Human labor is still needed tointerpret the results that such fully automatic approaches generate.
In this sense, our approach in the ConceptVector system can beviewed as a balanced—or hybrid—case, where both efficiency andinterpretability are achieved via a synergetic blending of both humanefforts and automated machine computations. That is, our main stepsof adding and removing keywords to construct a particular concept areall confirmed by humans, and in this manner, a high quality outcomeis maintained. However, our system significantly accelerates thesehuman-guided processes by crucial automated approaches, includingword recommendation based on word embedding, followed by wordgrouping and visual presentation. Also, after users build a specification,this specification is used to build the concept model, which calculatesthe relevance scores of all words with this particular concept. In thisrespect, our system represents an illustrative example for properlyachieving human-machine collaborations. As it happens, this is alsoprecisely in line with the visual analytics philosophy, where automaticalgorithms and visual interfaces create synergies in this partnership.
8 CONCLUSION AND FUTURE WORK
Current text analytics methods are either based on manually craftedhuman-generated dictionaries or require the user to interpret a complex,confusing, and sometimes non-sensical topic model generated by thecomputer. In this paper we proposed ConceptVector, a novel text an-alytics system that takes an interactive visual approach to documentanalysis by allowing the user to iteratively define concepts with theaid of automatic recommendations provided using word embeddings.The resulting concepts can be used for concept-based document anal-ysis, where each document is scored according to the degree abouthow much each document contains words related to these concepts.We crystallized the generalizable lessons as design guidelines abouthow visual analytics can help concept-based document analysis. Wecompared our interface for generating lexica with existing databasesand found that ConceptVector enabled users to generate custom con-cepts more effectively using the new system than when using existingdatabases. We proposed an advanced model for concept generationthat can incorporate irrelevant words input and negative words inputfor bipolar concepts. We also evaluated our model by comparing itsperformance with a crowdsourced dictionary for validity. Finally, wecompared ConceptVector to Empath in an expert review.
The sophisticated text analysis provided by ConceptVector enablesseveral novel concept-based document analysis capabilities, such asmuch richer sentiment analysis than previous approaches, which canbe useful for data journalism or social media analysis. There aremany limitations that ConceptVector do not solve. Among those, theselection/integration of multiple heterogeneous training data accordingto the target corpus and the automatic disambiguation of multiplemeaning of words according to the context are promising avenues offuture research.
ACKNOWLEDGMENTS
Research reported in this publication was partially supported by NIHgrant R01GM114267 and the National Research Foundation of Korea(NRF) grant funded by the Korean government (MSIP) (No. NRF-2016R1C1B2015924). Any opinions, findings, and conclusions orrecommendations expressed in this article are those of the authors anddo not necessarily reflect the views of the funding agencies.

REFERENCES
[1] D. Bahdanau, K. Cho, and Y. Bengio. Neural machine translation byjointly learning to align and translate. CoRR, abs/1409.0473, 2014.
[2] M. Berger, K. McDonough, and L. M. Seversky. cite2vec: Citationdrivendocument exploration via word embeddings. IEEE Transactions on Visu-alization and Computer Graphics, 23(1):691–700, Jan 2017.
[3] D. M. Blei, A. Y. Ng, and M. I. Jordan. Latent Dirichlet allocation. Journalof Machine Learning Research, 3:993–1022, 2003.
[4] J. Carbonell and J. Goldstein. The use of MMR, diversity-based rerankingfor reordering documents and producing summaries. In Proceedings of theACM Conference on Research and Development in Information Retrieval,pp. 335–336, 1998.
[5] S. Chang, P. Dai, L. Hong, C. Sheng, T. Zhang, and E. H. Chi. AppGrouper:Knowledge-based interactive clustering tool for app search results. InProceedings of the International Conference on Intelligent User Interfaces,pp. 348–358, 2016.
[6] J. Choo, C. Lee, C. K. Reddy, and H. Park. UTOPIAN: User-driven topicmodeling based on interactive nonnegative matrix factorization. IEEETransactions on Visualization and Computer Graphics, 19(12):1992–2001,2013.
[7] J. Chuang, C. D. Manning, and J. Heer. Termite: Visualization techniquesfor assessing textual topic models. In Proceedings of the ACM Conferenceon Advanced Visual Interfaces, pp. 74–77, 2012.
[8] W. Cui, S. Liu, L. Tan, C. Shi, Y. Song, Z. Gao, H. Qu, and X. Tong.TextFlow: Towards better understanding of evolving topics in text. IEEETransactions on Visualization and Computer Graphics, 17(12):2412–2421,2011.
[9] S. Deerwester, S. Dumais, G. Furnas, T. Landauer, and R. Harshman.Indexing by latent semantic analysis. Journal of the Society for InformationScience, 41:391–407, 1990.
[10] N. Diakopoulos. Picking the NYT Picks: Editorial criteria and automationin the curation of online news comments. ISOJ Journal, 2015.
[11] P. S. Dodds, K. D. Harris, I. M. Kloumann, C. A. Bliss, and C. M. Danforth.Temporal patterns of happiness and information in a global social network:Hedonometrics and twitter. PLOS ONE, 6(12):e26752, 2011.
[12] W. Dou, X. Wang, R. Chang, and W. Ribarsky. ParallelTopics: A prob-abilistic approach to exploring document collections. In Proceedings ofthe IEEE Conference on Visual Analytics Science and Technology, pp.231–240, 2011.
[13] R. M. Entman. Framing: Toward clarification of a fractured paradigm.Journal of Communication, 43(4):51–58, 1993.
[14] E. Fast, B. Chen, and M. S. Bernstein. Empath: Understanding topicsignals in large-scale text. In Proceedings of the ACM Conference onHuman Factors in Computing Systems, pp. 4647–4657, 2016.
[15] A. Grover and J. Leskovec. Node2vec: Scalable feature learning fornetworks. In Proceedings of the ACM Conference on Knowledge Discoveryand Data Mining, pp. 855–864, 2016.
[16] S. Havre, E. Hetzler, P. Whitney, and L. Nowell. ThemeRiver: visualizingthematic changes in large document collections. IEEE Transactions onVisualization and Computer Graphics, 8(1):9–20, 2002.
[17] I. T. Jolliffe. Principal Component Analysis. Springer-Verlag, New York,1986.
[18] S. Jnicke, G. Franzini, M. F. Cheema, and G. Scheuermann. Visual textanalysis in digital humanities. Computer Graphics Forum, pp. n/a–n/a,2016. doi: 10.1111/cgf.12873
[19] S. Kim, J. Lee, G. Lebanon, and H. Park. Estimating temporal dynamicsof human emotions. In Proceedings of the AAAI Conference on ArtificialIntelligence, pp. 168–174, 2015.
[20] S. Kim, J. Lee, G. Lebanon, and H. Park. Local context sparse coding.In Proceedings of the AAAI Conference on Artificial Intelligence, pp.2260–2266, 2015.
[21] S. Kim, F. Li, G. Lebanon, and I. Essa. Beyond sentiment: The manifoldof human emotions. In Proceedings of the International Conference onArtificial Intelligence and Statistics, pp. 360–369, 2013.
[22] B. C. Kwon, H. Kim, E. Wall, J. Choo, H. Park, and A. Endert. Axisketcher:Interactive nonlinear axis mapping of visualizations through user drawings.IEEE Transactions on Visualization and Computer Graphics, 23(1):221–230, 2017.
[23] B. C. Kwon, S.-H. Kim, S. Lee, J. Choo, J. Huh, and J. S. Yi. VisOHC: De-signing visual analytics for online health communities. IEEE Transactionson Visualization and Computer Graphics, 22(1):71–80, 2016.
[24] Q. Le and T. Mikolov. Distributed representations of sentences and doc-
uments. In Proceedings of the International Conference on MachineLearning, pp. 1188–1196, 2014.
[25] D. D. Lee and H. S. Seung. Learning the parts of objects by non-negativematrix factorization. Nature, 401:788–791, 1999.
[26] H. Lee, J. Kihm, J. Choo, J. Stasko, and H. Park. iVisClustering: Aninteractive visual document clustering via topic modeling. ComputerGraphics Forum, 31(3pt3):1155–1164, 2012.
[27] W. Ling, C. Dyer, A. Black, and I. Trancoso. Two/too simple adaptationsof Word2vec for syntax problems. In Proceedings of the Conference of theNorth American Chapter of the Association for Computational Linguistics:Human Language Technologies, pp. 1299–1304, 2015.
[28] W. Ling, Y. Tsvetkov, S. Amir, R. Fermandez, C. Dyer, A. W. Black,I. Trancoso, and C.-C. Lin. Not all contexts are created equal: Better wordrepresentations with variable attention. In Proceedings of the Conferenceon Empirical Methods in Natural Language Processing, pp. 1367–1372,2015.
[29] C. D. Manning, P. Raghavan, and H. Schutze. Introduction to InformationRetrieval. Cambridge University Press, 2008.
[30] T. Mikolov, Q. V. Le, and I. Sutskever. Exploiting similarities amonglanguages for machine translation. CoRR, abs/1309.4168, 2013.
[31] T. Mikolov, I. Sutskever, K. Chen, G. S. Corrado, and J. Dean. Distributedrepresentations of words and phrases and their compositionality. In Pro-ceedings of the Conference on Advances in Neural Information ProcessingSystems, pp. 3111–3119, 2013.
[32] T. Mikolov, W.-t. Yih, and G. Zweig. Linguistic regularities in continuousspace word representations. In Proceedings of the Conference of theNorth American Chapter of the Association for Computational Linguistics:Human Language Technologies, pp. 746–751, 2013.
[33] G. A. Miller. WordNet: A lexical database for English. Communicationsof the ACM, 38(11):39–41, 1995.
[34] B. Pang and L. Lee. Opinion mining and sentiment analysis. Foundationsand Trends in Information Retrieval, 2(1-2):1–135, 2008.
[35] D. Park, S. Sachar, N. Diakopoulos, and N. Elmqvist. Supporting com-ment moderators in identifying high quality online news comments. InProceedings of the ACM Conference on Human Factors in ComputingSystems, pp. 1114–1125, 2016.
[36] D. G. Park, S.-H. Kim, and N. Elmqvist. Gatherplots: Extended scatter-plots for categorical data. Technical Report HCIL-2016-10, University ofMaryland, College Park, 2016.
[37] J. W. Pennebaker, M. E. Francis, and R. J. Booth. Linguistic inquiry andword count: LIWC 2001. Lawrence Erlbaum Associates, 2001.
[38] J. Pennington, R. Socher, and C. D. Manning. GloVe: Global vectorsfor word representation. In Proceedings of the Conference on EmpiricalMethods in Natural Language Processing, pp. 1532–1543, 2014.
[39] P. J. Stone, D. C. Dunphy, M. S. Smith, and D. M. Ogilvie. The GeneralInquirer: A Computer Approach to Content Analysis. MIT Press, 1966.
[40] M. Taboada, J. Brooke, M. Tofiloski, K. Voll, and M. Stede. Lexicon-based methods for sentiment analysis. Journal Computational Linguistics,37(2):267–307, 2011.
[41] E. M. Talley, D. Newman, D. Mimno, B. W. Herr II, H. M. Wallach, G. A.Burns, A. M. Leenders, and A. McCallum. Database of NIH grants usingmachine-learned categories and graphical clustering. Nature Methods,8(6):443–444, 2011.
[42] F. Tian, H. Dai, J. Bian, B. Gao, R. Zhang, E. Chen, and T.-Y. Liu. Aprobabilistic model for learning multi-prototype word embeddings. InProceedings of the International Conference on Computational Linguistics,pp. 151–160, 2014.
[43] L. van der Maaten and G. Hinton. Visualizing data using t-SNE. Journalof Machine Learning Research, 9:2579–2605, 2008.
[44] F. Wei, S. Liu, Y. Song, S. Pan, M. X. Zhou, W. Qian, L. Shi, L. Tan,and Q. Zhang. TIARA: a visual exploratory text analytic system. InProceedings of the ACM Conference on Knowledge Discovery and DataMining, pp. 153–162, 2010.