conceptual hydrological models module 8
TRANSCRIPT

WPRB /INAGA Bali Seminar: Conceptual Hydrological Models PAGE 1
Conceptual Hydrological Models
Module 8

WPRB /INAGA Bali Seminar: Conceptual Hydrological Models PAGE 2
Contents
1. Introduction………………………………………………………………. 3
2. Presentation of a Hydrological Model……………………………….. 4
3. Case Study: Exploration Model………………………………………. 5
4. Later-Stage Conceptual Models……………………………………….9
4.1 Introduction………………………………………………………. 9 4.2 Case Study: Development Model……………………………. 10
WPRB /INAGA Bali Seminar: Conceptual Hydrological Models PAGE 3
1. Introduction
Scientific evaluations of a geothermal prosect can be wide-ranging in scope; starting with a brief surface reconnaissance (perhaps involving the sampling of a few major features) and extending with a multidisciplinary integration of scientific data from a fully drilled field. The final task at each stage of investigation will usually be the development of a conceptual hydrological model of the system. This can be described as a generalised mental impression of the physical and chemical structure of the system. Although it should conform to general physical principals (e.g. boiling point for depth relationships) the model is generally not rigorously constrained by physical conditions (e.g. temperature, pressure, size etc). This is in contrast to numerical models where physical parameters are assigned exact values and quantitative estimates of reservoir capacity or reservoir performance are derived. The derivation of a hydrological model should make use of all of the available data. Often data from one discipline can complement those of another in a way that may not be apparent until they are combined. For example, if relict hydrothermal alteration is found on the surface, it could mean that some of the zones of low resistivity are likewise relict. Apparent conflicts between data from different disciplines may also be highly significant and efforts should be made to arrive at a model which can resolve such discrepancies. For example, consider the case of a geothermal system located within a structural depression, apparently infilled with low-density sediments. One would normally expect this to be expressed as a gravity low, due to the density contrast. If a gravity high is present, it may be revealing the presence of densification by deposition of hydrothermal minerals, or of a shallow intrusive. Conversely, at one strato-volcano geothermal prospect in Indonesia which has evidence for acid-magmatic volatiles, there is a central gravity low, surrounded by a weak annular gravity high. This was interpreted as corresponding to leaching of material from the central part of the system by the aggressive acid fluids, and then re-deposition of secondary minerals where the fluids cooled and became dilute and neutralised. Only by combining the geology, geochemistry and geophysics could these interpretations be made. Hydrological models naturally evolve as more information about a geothermal system is obtained. At an early stage there may be little on which to base a hydrological model except analogy with other systems. As more data become available the model can be refined. In this section two examples of hydrological models are presented. The first is one developed on the basis of surface exploration data. The second is a far more refined model developed after a field has been drilled.

WPRB /INAGA Bali Seminar: Conceptual Hydrological Models PAGE 4
2. Presentation of a Hydrological Model
In our experience the best way to present a simple hydrological model, such as might be applicable at an early stage of exploration, is as a cross-section. In areas of low relief some vertical exaggeration may be helpful, but it should not exceed 2:1. The orientation of the cross-section should be carefully thought out to maximise the information shown: for example by orienting it along an outflow. Sections nearly parallel to structures such as faults can look unrealistic. If the system is complex it might be helpful to show two cross-sections in different orientations. Perspective, isometric or orthographic drawings are visually striking, but can be more difficult to use. However, three-dimensional mapping routines such as “Surfer” or “Winglink” can be very useful when trying to decide on the best orientation on which to draw cross sections.
WPRB /INAGA Bali Seminar: Conceptual Hydrological Models PAGE 5
3. Case Study: Exploration Model
An example of a hydrological model developed at the surface exploration stage is shown in Figure 1. It is instructive to go through this example and see how it was drawn up, to illustrate the level of detail that can be inferred, and also to demonstrate the level of uncertainty that results. This is an area where there has been fairly extensive surface geoscientific exploration but no drilling apart from one shallow hole. The geothermal system is hosted beneath a steep-sided Quaternary stratovolcano comprising two eruptive centres. Resistivity data show a broad, deep, low resistivity zone centred beneath one of the mountains, with possibly two upflow zones at intermediate depths (about -1000 m). The northwestern one is much more prominent. The resistivity data suggest lateral outflows towards coastal thermal areas in the northwest and south. The outflows appear to be rather deep because sodium-chloride water, the definitive expression of liquid outflows, has not been identified anywhere at the surface. This is with the exception of one coastal spring where the waters are clearly of seawater origin, heated by rising steam or by mixing with secondary low-chloride thermal waters. Springs located above the northern outflow do not exceed 60°C but have very high flowrates suggesting thermal activity is quenched by a large natural flow of meteoric water. Fumaroles are found only in the south. Gas chemistry for the most active area supports the existence of a liquid-dominated reservoir at depth, with a temperature locally of 280°C or more. Another fumarole further down the mountain appears to have a relatively cooler source while a thermal area to the south-east is probably located on the cool periphery of the resource with only minor steam, high gas contents and low geothermometer indications.

WPRB /INAGA Bali Seminar: Conceptual Hydrological Models PAGE 6
Figu
re 1
: H
ydro
logi
cal m
odel
dev
elop
ed a
t the
surf
ace
expl
orat
ion
stag
e

WPRB /INAGA Bali Seminar: Conceptual Hydrological Models PAGE 7
The proportion of helium in fumarole steam suggests a possible fluid contribution from granitic or metamorphic basement rocks which is consistent with the regional geology and the geophysics. There are no indications from fluid chemistry of an acid magmatic component in the surface thermal discharges. The nature of deep permeability, and the importance of structure in controlling fluid movement are unclear. A basaltic to andesitic complex such as this could be expected to have generally good permeability. Based on the regional geology, crystalline basement and sedimentary rocks may occur at relatively shallow depths, however, and could be expected to have limited permeability. Faulting appears to be mainly normal and therefore tensional and may provide important channels for fluid movement. A major northwest-striking fault may be a significant factor controlling the hydrology and resistivity pattern of the resource. Isobars have been drawn on the reservoir model on the following basis: There must be at least localised boiling near to the coastal spring, as the spring discharges steam-heated seawater with no identifiable primary chloride component. The spring is at sea level. Fluid geothermometry on this feature indicates a minimum temperature of 200°C. We can then assume a boiling zone with a temperature of at least 200°C, implying a saturation pressure of 16 bars abs. The fact that seawater is mixing with the steam suggests that there is close to a hydrological balance. The most likely situation is that the steam zone is slightly underpressured with respect to seawater, and that inflow of seawater is being hindered by anhydrite deposition. The 15 bar gauge isobar has therefore been drawn at -150 m RSL near to the coast. The boiling temperature in the upflow zone can be determined from gas geothermometry at the most central fumarole. A temperature of 295°C is considered the best estimate by applying the H2/Ar gas geothermometer strictly, but there has been minor re-equilibration towards vapour suggesting that a temperature of 280°C is more correct for the boiling level. This is equivalent to a saturation pressure of 64 bars abs. A further reference point can be obtained by taking a gas geothermometric temperature of 240°C for the lower-elevation fumarole. This indicates a saturation pressure of 34 bars abs. There is no evidence for condensation between these fumaroles. Hence, separate boiling from a somewhat degassed fluid is implied, rather than cooling within a laterally extensive steam zone and the saturation pressure can be taken as applying to the boiling interface. Some evidence for a minimum depth to the top of the steam zone can be gained from a shallow drillhole, which showed an increasing temperature from a depth of 215 m, close to sea-level. This shows the level at which groundwater may be affected by steam-heating. The water level in the hole fluctuated around 40 m depth. Hence, a cold water layer 175 m thick has been assumed, underlain by water at a cold hydrostatic pressure gradient to a depth of 330 m (- 90 m RSL) where the extrapolated temperature gradient would reach 100°C, and hot hydrostatic below that. By analogy with other areas, most of the steam zone can be expected to be close to isothermal and the temperature at the top

WPRB /INAGA Bali Seminar: Conceptual Hydrological Models PAGE 8
of the steam zone can be expected to be in the range 200 - 230°C, implying a pressure of between 16 and 28 bars abs. Hence the top of the steam zone will lie between the 15 and 30 bar g contours. The elevation of the boiling level (i.e. bottom of the steam zone) away from the coast is more difficult to estimate. It is probable that the liquid outflow rises buoyantly over colder water to some extent, and there is a need to maintain a positive but not unreasonably high lateral pressure gradient away from the upflow within the liquid zone. This limits the maximum depth of the bottom of the steam zone in the south-eastern sector. By analogy with other vapour-dominated systems, it is probable that quite a small portion of the steam zone is above 240°C, as shown, and that there is a restricted region with a greater pressure gradient where the upflow is taking place. This applies also to the underlying liquid zone: the pressure gradient must be greater than hydrostatic in the upflow zone, causing the isobars to bunch up. It has been assumed that the upflow at depth is as located by the resistivity, but that it slants to the SE, possibly offset by downhill flow of cold groundwater. As well as the main steam zone feeding the southern fumaroles, there must also be boiling on the northwestern side of the mountain, to supply the steam-heated springs in that sector. This may however be quite a thin boiling layer, and the fact that no fumaroles can be identified suggest that is laterally extensive but diffuse. Accordingly, a second, thin, cooler steam zone has been shown to the NW. It is not shown connected to the higher-pressure SE steam zone as otherwise unrealistically high pressure gradients would be needed within the steam zone. The resulting steep lateral pressure gradients within the surrounding liquid at depth imply some localised hydrological isolation, that is to say localised poor permeability. There is no immediately obvious geological explanation for this. The bottom of the liquid outflow may have been detected by resistivity soundings, at around 500- 750 m below sea-level, which is reasonably consistent with the 200°C isotherms. This model is sufficient to define initial drilling targets, well and casing depths, with some degree of accuracy. It can also be used as a basis for resource estimation.
WPRB /INAGA Bali Seminar: Conceptual Hydrological Models PAGE 9
4. Later-Stage Conceptual Models
4.1 Introduction
At a later stage, once drilling data become available, the hydrological model will become more complex. A large array of scientific and reservoir engineering data may be presented on this model, including the following:
• Stratigraphy and lithology
• Geological structure
• Hydrothermal alteration
• Well profiles with feed-zones
• Physical data: broad temperature, pressure and phase conditions
• Composition and distribution of major fluid types
• Physical processes: flow direction, boiling, mixing, controls on fluid movement (e.g. faults, lithological contacts).
• Chemical processes: mineral deposition and dissolution, chemical reactions.
The hydrological model will now contain measured temperature data rather than temperatures inferred from geothermometers. The approximate boundaries of the reservoir may be known and the chemistry of the reservoir will be accurately characterised. The conceptual model must be presented as a three-dimensional picture of a geothermal system and all information presented in the model must relate to some point in space within the system. For most information (e.g. reservoir temperature and lithology), the point in the reservoir to which the data relates is known, usually from the location of a well and the depth at which the data was obtained. Reservoir chemistry is more difficult to map because most of the raw data is obtained from discharge testing, and the feed-points in the well are not immediately known. A well may have several feed-zones spread over 1000 m of hole. An important task in integrating the chemistry into a hydrological model is to determine as accurately as possible the depth at which the well feeds. This is generally done on a well-by-well basis using the techniques described elsewhere. Hydrological models are often presented in cross-section and plan view so as to accurately portray information in a spatial manner. It is likely that some numerical modelling of the reservoir will be undertaken. The geoscientists' task is to ensure that the data are available in a form which is most readily used by the reservoir engineers. Reservoir models are usually based around a three-dimensional grid of blocks. This may mean working with the reservoir engineers at an early stage to ensure that the grid is laid out in the most geologically meaningful way. For example, one axis of the grid should be parallel to the major fault

WPRB /INAGA Bali Seminar: Conceptual Hydrological Models PAGE 10
orientation. Horizontal block boundaries should correspond to geological or isothermal boundaries, if any are known.
4.2 Case Study: Development Model
Figures 2 and 3 present the conceptual hydrological model for a high-relief field that has been drilled and is at the power station design stage of development. This example is based loosely on a field located in the Philippines, and original place-names are omitted. Deep drilling in the central part of the reservoir has delineated a high-temperature reservoir. The reservoir fluid is single-phase, neutral pH, sodium chloride water with about 0.5% by weight CO2. Chloride concentrations are 5500 - 6500 ppm in the central resource area. The location of the centre or the hottest part of the system lies to the east of the presently drilled resource on the basis of temperature and chloride contours which are open to the east. The highest measured temperature is 324°C. Temperatures decline steadily to the west and more steeply to the southwest.
Reservoir chemistry is fairly typical for the water salinity: calcium (100-200 mg/kg) predominates
over bicarbonate and the waters are near saturation with respect to anhydrite (CaSO4). Cl/B ratios (30-70) are fairly typical of andesitic systems, but strong trend of increasing Cl/B to the northwest is indicative of loss of boron through uptake into alteration clay minerals. The productivity of wells indicates that permeability is anisotropic and controlled primarily by faults with a predominant SSW-NNE strike. Major production is from depths below -500 mRSL. Above this depth and almost to surface, a generally conductive gradient indicates that permeability is low and fluid movement restricted. The top of the conductive layer (500-600 mRSL) corresponds to the first occurrence of intense alteration - which may be responsible in part for the reduced permeability - and also corresponds to the top surface of the low resistivity anomaly. The alteration between this surface and the top of the reservoir is predominantly neutral and may have been produced by neutral chloride waters that in the past occurred at shallower levels.
WPRB /INAGA Bali Seminar: Conceptual Hydrological Models PAGE 11
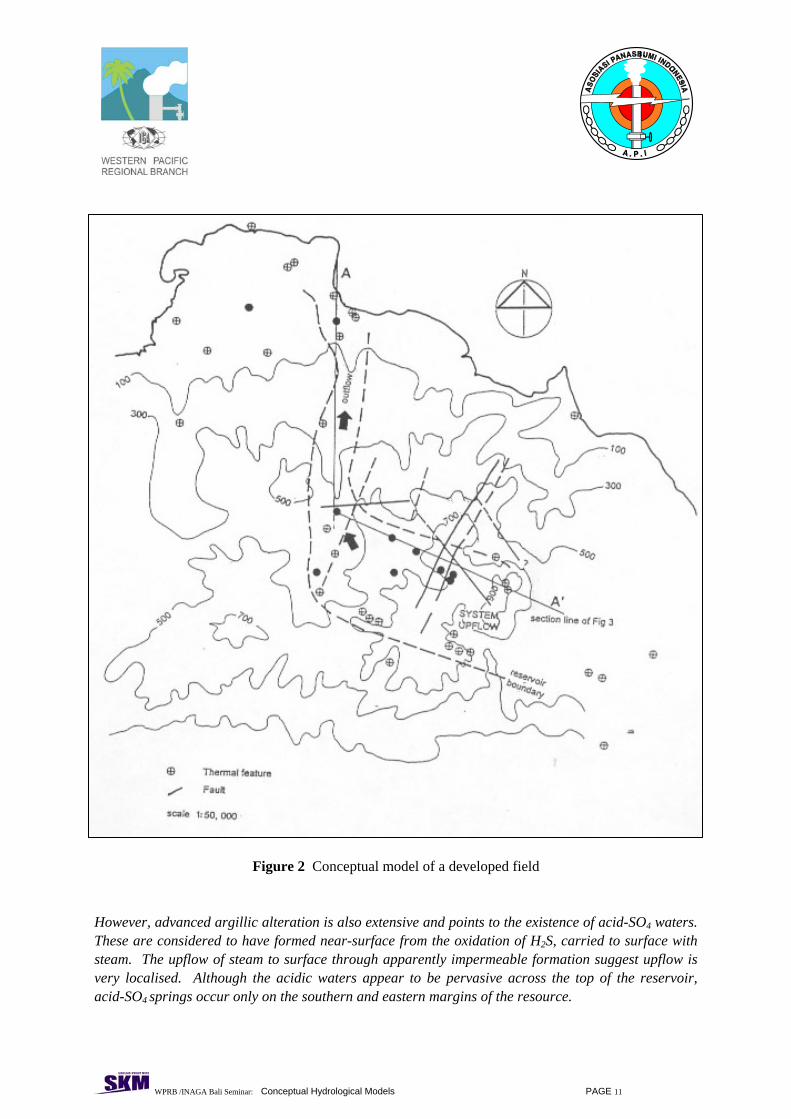
Figure 2 Conceptual model of a developed field
However, advanced argillic alteration is also extensive and points to the existence of acid-SO4 waters. These are considered to have formed near-surface from the oxidation of H2S, carried to surface with steam. The upflow of steam to surface through apparently impermeable formation suggest upflow is very localised. Although the acidic waters appear to be pervasive across the top of the reservoir, acid-SO4 springs occur only on the southern and eastern margins of the resource.

WPRB /INAGA Bali Seminar: Conceptual Hydrological Models PAGE 12
Figure 3 Conceptual model of a developed field
Anhydrite deposition is widespread over the top of the reservoir where low-chloride, acid-SO4 waters have mixed with neutral, Ca-rich, sodium-chloride reservoir water. Where localised vertical permeability has allowed (e.g. because of faulting) acid fluids have invaded the deeper reservoir to production depths where they exist in discrete zones, separated from surrounding neutral waters by anhydrite deposition. However, where wells have intersected these zones, acid feeds occur in wells and anhydrite blockages have developed where the acid-SO4 waters have mixed with deeper neutral Ca-rich water. The acid feeds are manifest either as internal downflows under shut-in conditions or as minor producing zones.
The deep reservoir is single-phase liquid with a gas content of less than 0.5%. However, some shallower producing wells have significantly higher gas contents that indicate the existence of gas-rich, two-phase zones at shallow depths.
Wells located to the west and in the northwest have temperature inversions indicating that they lie in
outflow situations. By far the most dominant outflow is to the northwest and this is driven by a 200 m RSL hydrostatic head in the central reservoir. The northwest outflow terminates on the coast 6-7 km away, where high-flow chloride springs occur. Cooling along this outflow is largely conductive because there is little change in chloride. Although the major outflow to the north gives the resource an asymmetric shape, the existence of HCO3-SO4 springs to the east and northeast, and their association with resistivity anomalies, suggests there are also outflow in these directions. The information obtained in this model is extensive and is at a level that can be used with confidence in on-going field development. The greatest uncertainty in the model is the distribution of permeability within the reservoir and the distribution of acid-SO4 waters which occur in very narrowly confined zones at deeper levels.

WPRB /INAGA Bali Seminar: Conceptual Hydrological Models PAGE 13
The model as presented may be considered a “natural state” model representing the system prior to commissioning and exploitation of the resource. Once the field is produced, the model will be up-dated with new information added to show how the reservoir responds to exploitation (e.g. the effect of reinjection, pressure drawdown, groundwater incursion). These processes will be discussed elsewhere.