concepts of database management seventh...
TRANSCRIPT

Concepts of Database ManagementSeventh Edition
Chapter 6
Database Design 2: Design Method

Objectives
• Discuss the general process and goals of database design
• Define user views and explain their function
• Define Database Design Language (DBDL) and use it to document database designs
• Create an entity-relationship (E-R) diagram to visually represent a database design
• Present a method for database design at the information level and view examples illustrating this method
2

Objectives (continued)
• Explain the physical-level design process
• Discuss top-down and bottom-up approaches to database design and examine the advantages and disadvantages of both methods
• Use a survey form to obtain information from users prior to beginning the database design process
• Review existing documents to obtain information prior to beginning the database design
3
Objectives (continued)
• Discuss special issues related to implementing one-to-one relationships and many-to-many relationships involving more than two entities
• Discuss entity subtypes and their relationships to nulls
• Learn how to avoid potential problems when merging third normal form relations
• Examine the entity-relationship model for representing and designing databases
4

Introduction
• Two-step process for database design
• Information-level design: completed independently of any particular DBMS
• Physical-level design: information-level design adapted for the specific DBMS that will be used
– Must consider characteristics of the particular DBMS
5

User Views
• User view: set of requirements necessary to support operations of a particular database user
• Cumulative design: supports all user views encountered during design process
6

Information-Level Design Method
• For each user view:
1. Represent the user view as a collection of tables
2. Normalize these tables
3. Identify all keys in these tables
4. Merge the result of Steps 1 through 3 into the
cumulative design
7

Represent the User View As a
Collection of Tables
• Step 1: Determine the entities involved and create a separate table for each type of entity
• Step 2: Determine the primary key for each table
• Step 3: Determine the properties for each entity
• Step 4: Determine relationships between the entities
– One-to-many
– Many-to-many
– One-to-one
8

Represent the User View As a
Collection of Tables (continued)
• One-to-many relationship: include primary key of the “one” table as a foreign key in the “many” table
• Many-to-many relationship: create a new table whose primary key is the combination of the primary keys of the original tables
• One-to-one relationship: simplest implementation is to treat it as a one-to-many relationship
9

Normalize the Tables
• Normalize each table
• Target is third normal form
– Careful planning in early phases of the process
usually rules out need to consider fourth normal form
10

Identify All Keys
• For each table, identify:
– Primary key
– Alternate keys
– Secondary keys
– Foreign keys
• Alternate key: column(s) that could have been chosen as a primary key but was not
• Secondary keys: columns of interest strictly for retrieval purposes
11

Identify All Keys (continued)
• Foreign key: column(s) in one table that is required to match value of the primary key for some row in another table or is required to be null
– Used to create relationships between tables
– Used to enforce certain types of integrity constraints
12

Types of Primary Keys
• Natural key: consists of a column that uniquely identifies an entity
– Also called a logical key or an intelligent key
• Artificial key: column created for an entity to serve solely as the primary key and that is visible to users
• Surrogate key: system-generated; usually hidden from users
– Also called a synthetic key
13
Database Design Language (DBDL)
• Table name followed by columns in parentheses
– Primary key column(s) underlined
• AK identifies alternate keys
• SK identifies secondary keys
• FK identifies foreign keys
– Foreign keys followed by an arrow pointing to the
table identified by the foreign key
14

Database Design Language (DBDL)
(continued)
FIGURE 6-1: DBDL for the Employee table
15
Entity-Relationship (E-R) Diagrams
• Visually represents database structure
• Rectangle represents each entity
– Entity’s name appears above the rectangle
• Primary key for each entity appears above the line in the entity’s rectangle
• Other columns of entity appear below the line in rectangle
16

Entity-Relationship (E-R) Diagrams
(continued)
• Letters AK, SK, and FK appear in parentheses following the alternate key, secondary key, and foreign key, respectively
• For each foreign key, a line leads from the rectangle for the table being identified to the rectangle for the table containing the foreign key
• Text uses IDEF1X style of E-R diagram
17
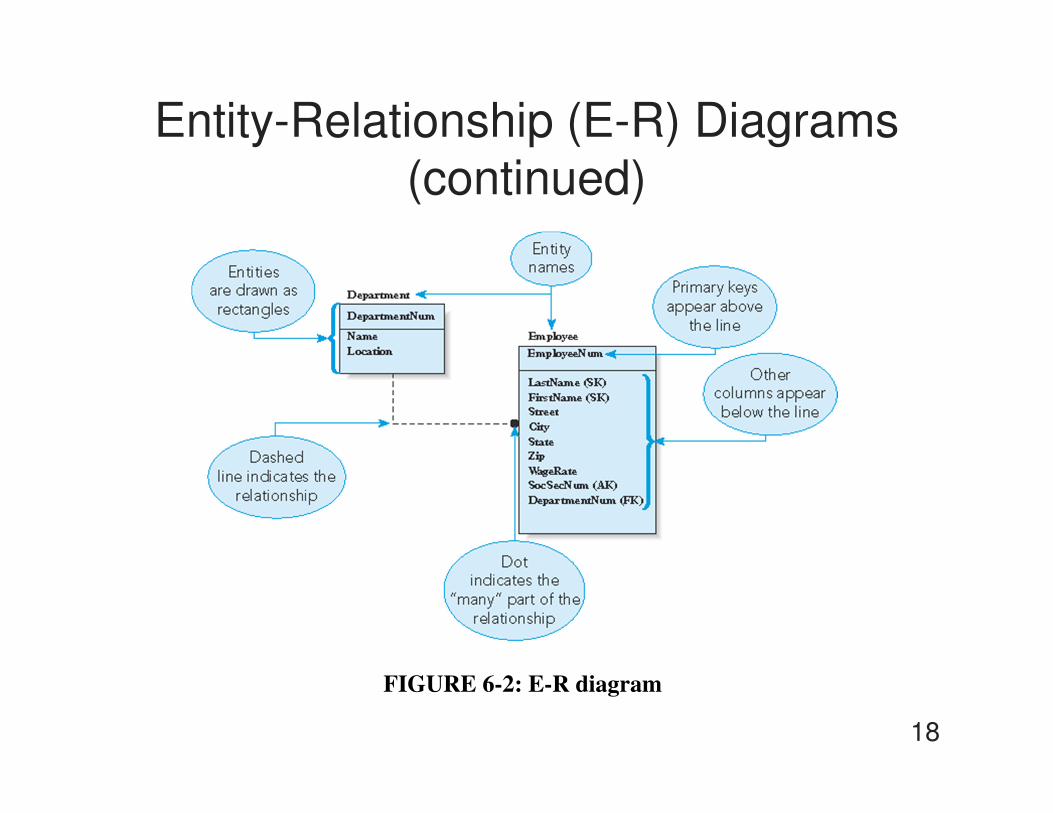
Entity-Relationship (E-R) Diagrams
(continued)
FIGURE 6-2: E-R diagram
18

Merge the Result into the Design
• Combine tables that have the same primary key to form a new table
• New table:
– Primary key is same as the primary key in the tables
combined
– Contains all the columns from the tables combined
– If duplicate columns, remove all but one copy of the
column
• Make sure new design is in third normal form
19

Merge the Result into the Design
(continued)
FIGURE 6-3: Information-level design method
20

Database Design Examples
• Develop an information-level design
• Company stores information about sales reps, customers, parts, and orders
• User view requirements
• Constraints
FIGURE 6-4: Cumulative design after first user view
21

Database Design Examples
(continued)
FIGURE 6-6: Cumulative design after third user view
22

Database Design Examples
(continued)
FIGURE 6-8: Final information-level design23

Database Design Examples
(continued)
• Henry Books database: information about branches, publishers, authors, and books
• User view requirements
FIGURE 6-9: DBDL for Book database after first user view
24

Database Design Examples
(continued)
FIGURE 6-10: DBDL for Book database after second user view
25

Database Design Examples
(continued)
FIGURE 6-13: Cumulative design after fifth user view26

Physical-Level Design
• Undertaken after information-level design completion
• Most DBMSs support primary, candidate, secondary, and foreign keys
• To enforce restrictions, DB programmers must include logic in their programs
27

Top-Down Versus Bottom-Up
• Bottom-up design method
– Design starts at low level
– Specific user requirements drive design process
• Top-down design method
– Begins with general database that models overall
enterprise
– Refines model until design supports all necessary
applications
28

Survey Form
• Used to collect information from users
• Must contain particular elements
– Entity information
– Attribute (column) information
– Relationships
– Functional dependencies
– Processing information
29

Obtaining Information from Existing
Documents
• Existing documents can furnish information about database design
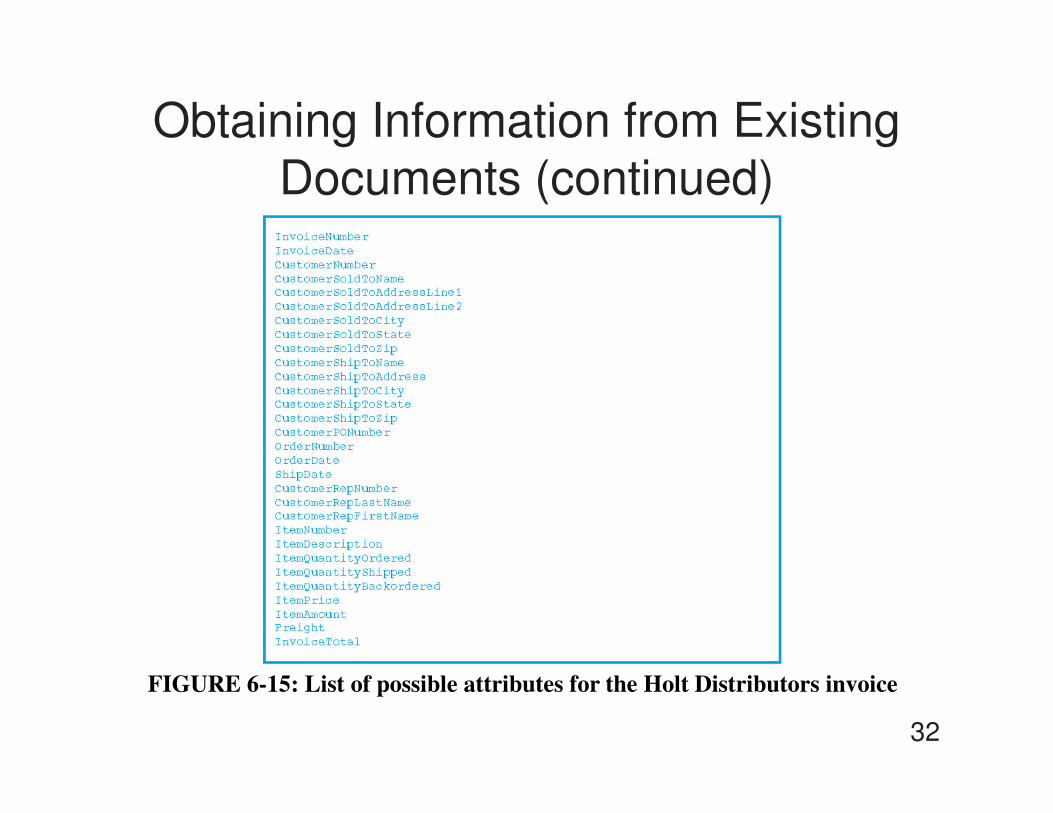
• Identify and list all columns and give them appropriate names
• Identify functional dependencies
• Determine the tables and assign columns
30

Obtaining Information from Existing
Documents (continued)
FIGURE 6-14: Invoice for Holt Distributors
31
Obtaining Information from Existing
Documents (continued)
FIGURE 6-15: List of possible attributes for the Holt Distributors invoice
32

Obtaining Information from Existing
Documents (continued)
FIGURE 6-17: Revised list of functional dependencies for the Holt
Distributors invoice
33
Obtaining Information from Existing
Documents (continued)
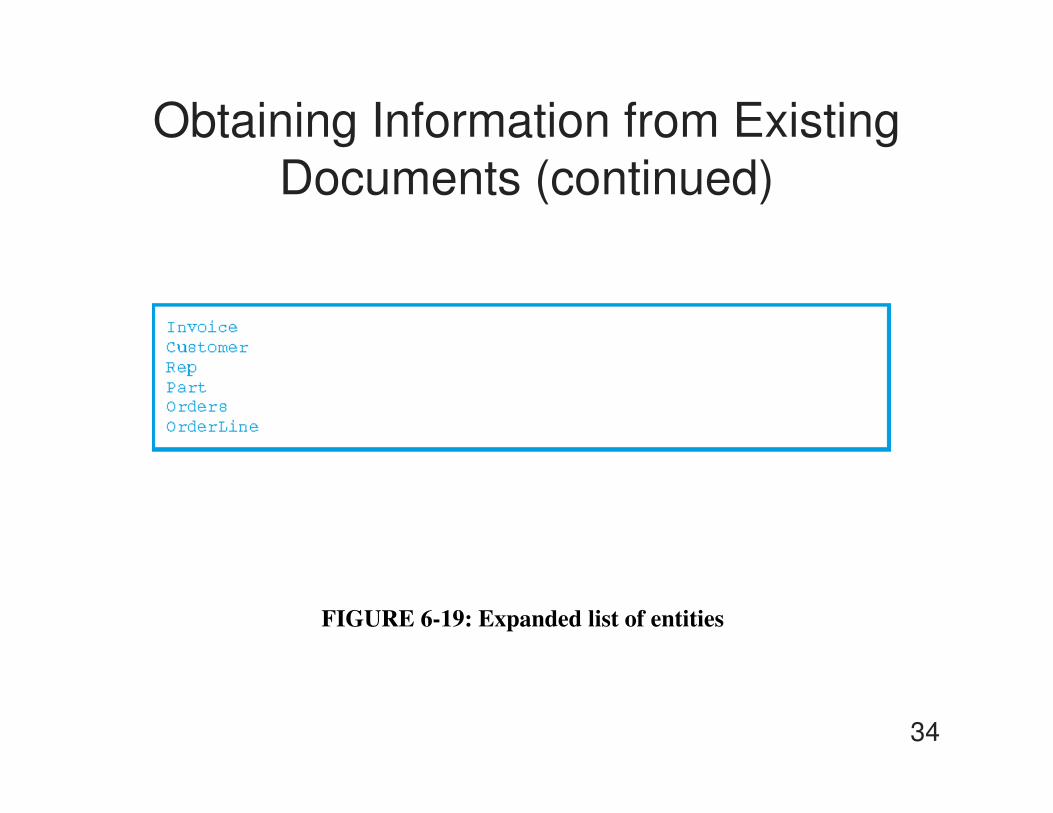
FIGURE 6-19: Expanded list of entities
34

One-to-One Relationship
Considerations
• Simply include the primary key of each table as a foreign key in the other table
– No guarantee that the information will match
• One solution: create a single table
– Workable, but not the best solution
• Better solution
– Create separate tables for customers and sales reps
– Include the primary key of one of them as a foreign
key in the other
35

One-to-One Relationship
Considerations (continued)
FIGURE 6-23: One-to-one relationship implemented by including the primary
key of one table as the foreign key (and alternate key) in the other
table
36
Many-to-Many Relationship
Considerations
• Complex issues arise when more than two entities are related in a many-to-many relationship
• Many-to-many-to-many relationship: involves multiple entities
• Deciding between a single many-to-many-to-many relationship and two (or three) many-to-many relationships
– Crucial issue: independence
37

Many-to-Many Relationship
Considerations (continued)
FIGURE 6-25: Result obtained by splitting the Sales table into three tables
38

Many-to-Many Relationship
Considerations (continued)
FIGURE 6-26: Result obtained by joining three tables—the second and third
rows are in error!
39

Nulls and Entity Subtypes
• Null
– Special value
– Represents absence of a value in a field
– Used when a value is unknown or inapplicable
• Splitting tables to avoid use of null values
• Entity subtype: table that is a subtype of another table
40

Nulls and Entity Subtypes (continued)
FIGURE 6-27: Student table split to avoid use of null values
41
Nulls and Entity Subtypes (continued)
• Subtype called a category in IDEF1X terminology
• Incomplete category: records that do not fall into the subtype
• Complete categories: all records fall into the categories
42

Nulls and Entity Subtypes (continued)
FIGURE 6-29: Entity subtype in an E-R diagram
43

Nulls and Entity Subtypes (continued)
FIGURE 6-32: Two entity subtypes—incomplete categories
44

Nulls and Entity Subtypes (continued)
FIGURE 6-33: Two entity subtypes—complete categories
45

Avoiding Problems with Third Normal
Form When Merging Tables
• When combining third normal form tables, the result might not be in third normal form
• Be cautious when representing user views
• Always attempt to determine whether determinants exist and include them in tables
46

The Entity-Relationship Model
• An approach to representing data in a database
• Entities are drawn as rectangles
• Relationships are drawn as diamonds with lines connecting the entities involved in relationships
• Composite entity: exists to implement a many-to-many relationship
• Existence dependency: existence of one entity depends on the existence of another related entity
• Weak entity: depends on another entity for its own existence
47
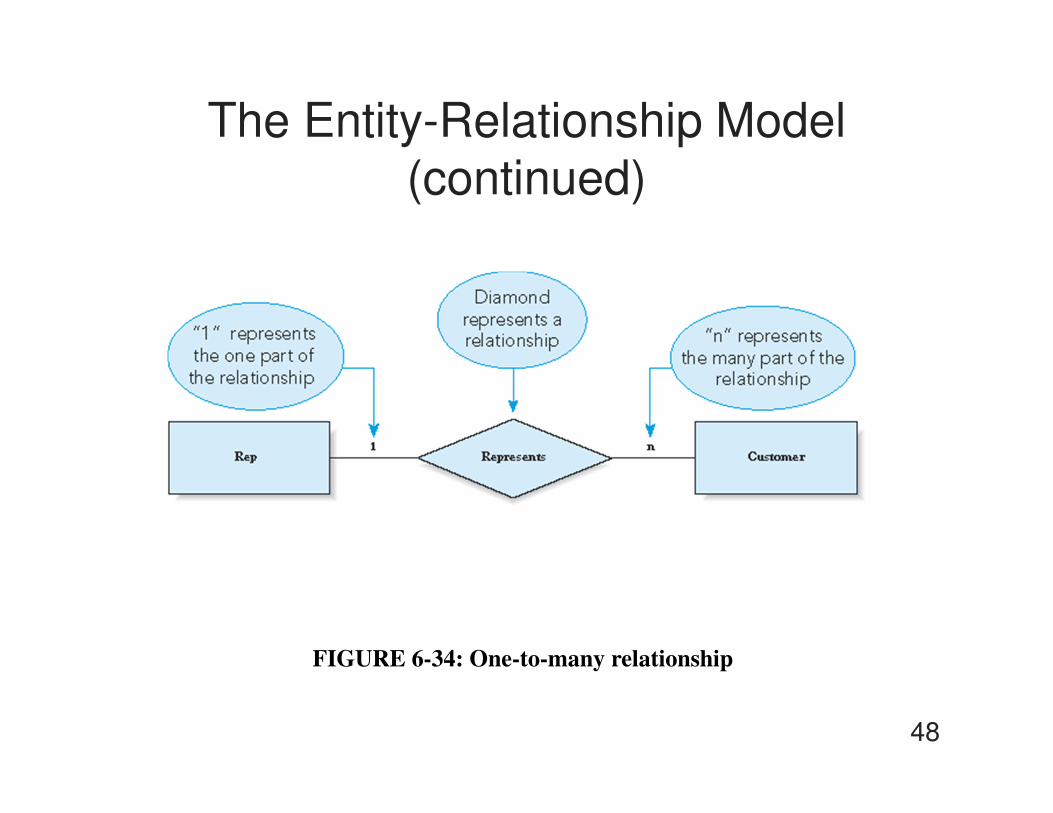
The Entity-Relationship Model
(continued)
FIGURE 6-34: One-to-many relationship
48

The Entity-Relationship Model
(continued)
FIGURE 6-35: Many-to-many relationship
49

The Entity-Relationship Model
(continued)
FIGURE 6-36: Many-to-many-to-many relationship
50

The Entity-Relationship Model
(continued)
FIGURE 6-37: One-to-many relationship with attributes added
51

The Entity-Relationship Model
(continued)
FIGURE 6-38: Many-to-many relationship with attributes
52

The Entity-Relationship Model
(continued)
FIGURE 6-39: Composite entity
53

The Entity-Relationship Model
(continued)
FIGURE 6-40: Complete E-R diagram for the Premiere Products database
54

The Entity-Relationship Model
(continued)
FIGURE 6-41: E-R diagram with an existence dependency and a weak entity
55

The Entity-Relationship Model
(continued)
• Cardinality: number of items that must be included in a relationship
– An entity in a relationship with minimum cardinality
of zero plays an optional role in the relationship
– An entity with a minimum cardinality of one plays a
mandatory role in the relationship
56

The Entity-Relationship Model
(continued)
FIGURE 6-43: E-R diagram that represents cardinality
57

Summary
• Database design is a two-part process: information-level design (not dependent on a particular DBMS) and physical-level design (appropriate for the particular DBMS being used)
• User view: set of necessary requirements to support a particular user’s operations
• Information-level design steps for each user view: represent the user view as a collection of tables, normalize these tables, represent all keys (primary, alternate, secondary, and foreign), and merge the results into the cumulative design
58

Summary (continued)
• Database design is represented in Database Design Language (DBDL)
• Designs can be represented visually using entity-relationship (E-R) diagrams
• Physical-level design process consists of creating a table for each entity in the DBDL design
• Design method presented in this chapter is bottom-up
• Survey form is useful for documenting the information gathered for database design process
59

Summary (continued)
• To obtain information from existing documents, list all attributes present in the documents, identify potential functional dependencies, make a tentative list of tables, and use the functional dependencies to refine the list
• To implement a one-to-one relationship, include primary key of one table in the other table as a foreign key and indicate the foreign key as an alternate key
60

Summary (continued)
• If a table’s primary key consists of three (or more) columns, determine whether there are independent relationships between pairs of these columns
• If a table contains columns that can be null and the nulls mean that the column is inapplicable for some rows, you can split the table, placing the null column(s) in separate tables
• The result of merging third normal form tables may not be in third normal form
• Entity-relationship (E-R) model represents the structure of a database using an E-R diagram
61