concept bto report - aromatic amino acids as a source for
TRANSCRIPT
BTO 2018.035 | March 2018
BTO report
Aromatic amino acids as a source for nitrogen containing by-products formed by advanced oxidation water treatment

BTO 2018.035 | March 2018 Aromatic amino acids as a source for nitrogen containing by-products formed by
advanced oxidation water treatment
BTO 2018.035 | March 2018 Aromatic amino acids as a source for nitrogen containing by-products formed by
advanced oxidation water treatment
BTO 2018.035 | March 2018 © KWR
All rights reserved.
No part of this publication may be reproduced, stored in
an automatic database, or transmitted, in any form or by
any means, be it electronic, mechanical, by photocopying,
recording, or in any other manner, without the prior
written permission of the publisher.
PO Box 1072
3430 BB Nieuwegein
The Netherlands
T +31 (0)30 60 69 511
F +31 (0)30 60 61 165
I www.kwrwater.nl
Year of publishing
2018
More information
Dennis Vughs
T 578
Keywords
BTO
Aromatic amino acids as a source for nitrogen
containing by-products formed by advanced
oxidation water treatment
BTO 2018.035 | March 2018
Project number
400554/109
Project manager
Stefan Kools
Client
BTO - Thematical research – nieuwe meetmethoden en
sensoring
Quality Assurance
Pim de Voogt
Author(s)
Dennis Vughs, Annemieke Kolkman, Kirsten Baken
Sent to
This report is distributed to BTO-participants and is
public.

BTO 2018.035 | March 2018 1 Aromatic amino acids as a source for nitrogen containing by-products formed by
advanced oxidation water treatment
Samenvatting
Geavanceerde oxidatie processen zoals UV/H2O2 en ozon worden steeds vaker ingezet voor
de productie van drinkwater vanwege desinfectie, maar ook doordat het een belangrijke
barrière vormt tegen organische microverontreinigingen in bronnen van drinkwater. Uit
voorgaand onderzoek is gebleken dat middendruk (MP) UV/H2O2 behandeling leidt tot een
positieve respons in de Ames mutageniteitstests, die geheel verwijderd wordt doormiddel
van GAC en duininfiltratie. Deze positieve respons wordt vermoedelijk veroorzaakt door de
vorming van stikstofhoudende bijproducten (N-DBPs) die gevormd worden door de reactie
van fotolyseproducten van nitraat met (fotolyseproducten van) natuurlijk organisch materiaal
(NOM). In voorgaand onderzoek is met behulp van stabiel isotoop gelabeld nitraat (15NO3-)
aangetoond dat na MP UV behandeling van kunstmatig water dat NOM en nitraat bevat,
verschillende stikstofhoudende bijproducten worden gevormd. Met deze aanpak zijn er in
totaal 84 N-NBPs gedetecteerd, waarvan 22 ook zijn aangetoond in monsters van een full-
scale drinkwaterzuiveringsinstallatie op basis van MP UV/H2O2 behandeling. Tot op heden
zijn 14 van de 84 bijproducten geïdentificeerd. Echter kan de positieve response in de Ames
test niet verklaard worden door het genotoxisch potentieel van deze geïdentificeerde
bijproducten, wat dus vraagt om verder onderzoek.
Uit de literatuur blijkt dat aromatische aminozuren (tyrosine, fenylalanine en tryptofaan) een
mogelijke bron kunnen zijn voor de vorming van stikstofhoudende bijproducten. Wanneer
water dat aromatische aminozuren en nitraat bevat, wordt behandeld met UV, laat dit een
verhoogde mutageniteit zien in de Ames test. In de huidige studie wordt de rol van
aminozuren in de vorming van stikstofhoudende producten verder onderzocht. Hiervoor zijn
stabiele isotoop labeling experimenten uitgevoerd met nitraat, aromatische aminozuren, MP
UV behandeling en hoge resolute massaspectrometrie. Met deze aanpak kon worden
aangetoond dat er veel bijproducten gevormd worden, waarvan slechts een aantal gelinkt
kon worden aan de N-DBPs die gedetecteerd zijn in het kunstmatig water monster van de
vorige studie. Voor tryptofaan kon één N-DBP welke geïdentificeerd is als 3-nitroindole,
gelinkt worden aan een N-DBP gedetecteerd in kunstmatig water. De resultaten laten ook
zien dat het niet waarschijnlijk is dat 3-nitroindole gevormd wordt uit tryptofaan, maar wordt
gevormd uit een andere bron. Voor fenylalanine zijn vier (nog) ongeïdentificeerde
bijproducten gelinkt aan bijproducten gedetecteerd in kunstmatig water. De resultaten laten
zien dat deze vier bijproducten werkelijk van fenylalanine afkomstig zijn in kunstmatig
water, waarmee aangetoond is dat aromatische aminozuren een bron kunnen zijn voor N-
DBPs gevormd door MP UV behandeling van artificieel water.
Van vijf N-DBPs is de identiteit opgehelderd tijdens deze studie, waardoor het totaal van
geïdentificeerde bijproducten op 19 komt. De toxiciteitsbeoordeling van deze vijf N-DBPS is
uitgevoerd op basis van structuur eigenschappen en de uitkomst duidt op mogelijke
potentiele mutageniteit.
In het tweede deel van deze studie is een LC-QToF doelstofmethode ontwikkeld voor de
bepaling van de 19 geïdentificeerde N-DBPs in drink- en oppervlaktewater. De
prestatiekenmerken van de methode, zoals aantoonbaarheids- en detectiegrenzen zijn
bevredigend. De methode is vervolgens toegepast voor een monitoringstudie van zeven
maanden van een full-scale drinkwaterzuiveringsinstallatie op basis van MP UV/H2O2
behandeling. Tijdens de monitoring studie zijn 15 van de 19 N-DBPs gedetecteerd in

BTO 2018.035 | March 2018 2 Aromatic amino acids as a source for nitrogen containing by-products formed by
advanced oxidation water treatment
concentraties tussen de 1,0 en 44 ng/L. De totale hoeveelheid aan gedetecteerde
verbindingen in een full-scale drinkwaterzuiveringsinstallatie laat de relevantie zien van de
geïdentificeerde N-DBPs en de ontwikkelde N-DBPs doelstofmethode.
BTO 2018.035 | March 2018 3 Aromatic amino acids as a source for nitrogen containing by-products formed by
advanced oxidation water treatment
Contents
1 Introduction 4
1.1 Disinfection by-products 4
1.2 Objective BTO study 5
1.3 Structure of this study 6
2 Development and validation of a LC-QToF
method for the determination of aromatic
amino acids in water 7
2.1 Amino acids analysis 7
2.2 Material & methods 8
2.3 Results method development and optimisation 9
2.4 Method validation 10
2.5 Source and artificial water analysis 11
2.6 Summary/conclusion 12
3 Labeling experiments 13
3.1 Stable isotope labeling strategy 13
3.2 Tryptophan labeling experiments 13
3.3 Tyrosine and phenylalanine labeling experiments 22
3.4 SPE experiments of tryptophan and phenylalanine
by-products 28
3.5 Conclusion labeling experiments 30
4 Identification, toxicological evaluation and
quantification of N-DBPs 31
4.1 Identification of N-DBPs 31
4.2 Toxicological evaluation of the identified N-DBPs 32
4.3 Development of a LC-QToF target method for N-
DBPS in water 34
4.4 Method validation in ultrapure water 35
4.5 Monitoring study full-scale drinking water
treatment facility 37
4.6 Results monitoring study 38
4.7 N-DBP concentration in extracts of previous study 40
5 Conclusion & recommendations 42
6 References 44

BTO 2018.035 | March 2018 4 Aromatic amino acids as a source for nitrogen containing by-products formed by
advanced oxidation water treatment
1 Introduction
1.1 Disinfection by-products
For the production of drinking water, surface water is gaining importance due to increasing
populations and limited availability of groundwater. However, surface waters may contain a
large variety of organic micropollutants, such as pharmaceuticals, pesticides and industrial
compounds, for which the traditional water treatment systems (e.g. rapid sand filtration,
coagulation, granular activated carbon filtration) do not constitute a robust barrier [1].
Advanced oxidation processes (AOP), such as UV/H2O2 and ozone are becoming increasingly
important for the preparation of drinking water, for effectively removing these
micropollutants [2-4]. However, it is known that advanced oxidation processes can produce
potentially harmful disinfection by-products (DBPs) [5-8]. Many studies were performed to
investigate the formation, identities and occurrence of these DBPs [9]. Such studies are
challenging, due to the vast amount of DBPs that can be formed. Many factors can contribute
to the formation of DBPs such as, disinfection method, type of source water and process
conditions. Information on the potential human health risk of these DBPs is often unknown
because of their unknown identity and/or the lack of toxicity data. A relatively new subgroup
of DBPs are the nitrogenous DBPs (N-DBPs) [10-12], which have a higher human toxicological
potential than the well-known chlorinated DBPs [9, 10, 12].
Earlier research has shown that medium pressure (MP) UV/H2O2 treatment in drinking water
production may lead to the formation of N-DBPs [7, 13, 14]. These N-DBPs are formed
through a complex mechanism of nitrate photolysis by UV in which nitrate is converted into
the stable nitrite [15, 16]. During this nitrate to nitrite reduction, various nitrate intermediate
radicals are formed [16], which have the ability to react with natural organic matter (NOM)
that is present in source water. This ultimately results in the incorporation of the nitrogen-
atom of nitrate into aquatic NOM [14].
In previous research, an innovative approach was developed in order to trace N-DBPs,
combining stable isotope labeled nitrate with high-resolution mass spectrometry (HRMS)
[13]. It was shown that multiple N-DBPs were formed after MP UV treatment of artificial water
containing nitrate and NOM. Using this approach a total of 84 N-DBPs were detected in
artificial water. A suspect screening for these 84 N-DBPs in water samples from a full-scale
drinking water facility using MP UV/H2O2, resulted in the detection of 22 N-DBPs. The Ames
mutagenicity test, a way to determine genotoxicity of (treated) water [5, 6, 17], was also
performed. It was shown that chemical response detected by the suspect screening was
comparable with the response obtained with Ames fluctuation assay using Salmonella strains
TA98 and TA100. This implies that some of the 22 N-DBPs are possibly responsible for the
positive response in the Ames fluctuation test. The genotoxic effect was shown to be
effectively removed from treated drinking water with granular activated carbon (GAC)
filtration and/or dune infiltration [5, 7].
Without the identity and any information about the toxic potency of N-DBPs, it is not possible
to perform substance-specific health risk assessment. Therefore, it is important to identify
these N-DBPs and to investigate what their mutagenic response is in the Ames test. In our
follow-up study this was investigated by applying a fractionation method to MP UV treated
water containing nitrate and NOM. Next, the different fractions were analysed by
mutagenicity testing and chemical suspect screening [18]. This showed that the presence of

BTO 2018.035 | March 2018 5 Aromatic amino acids as a source for nitrogen containing by-products formed by
advanced oxidation water treatment
N-DBPs and mutagenicity in the Ames fluctuation test were correlated. Five potentially
genotoxic by-products, with relatively high concentrations, were linked to fractions in which
mutagenicity was observed. Of the 84 known N-DBPs formed by MP UV treatment, 14 by-
products were unambiguously identified [13, 18]. However, the genotoxic potential of the
identified by-products does not explain the observed Ames response, and the subject for the
present research project is to further identify products that may explain the observed
genotoxicity.
1.2 Objective BTO study
A different strategy for detecting by-products and assessment of their mutagenic response,
is to use model compounds and apply MP UV treatment. Literature has shown that a possible
source for the by-products, besides NOM, could be aromatic amino acids, which are present
in NOM and surface water [19, 20]. Suzuki et al. [21] showed that aromatic amino acids (i.e.
tryptophan, phenylalanine and tyrosine) become mutagenic after UV irradiation in water
containing nitrate and nitrite. For the three aromatic amino acids the highest Ames response
was observed for tryptophan, using the salmonella strain TA98 with and without S9 mix.
Furthermore Aljammaz [22] showed that in water containing aromatic amino acids the
concentration of inorganic nitrogen (i.e. nitrate, nitrite and ammonia) is substantially
decreased after MP UV treatment, which indicates that at least a part of inorganic nitrogen is
converted to organic nitrogen by nitration of the aromatic amino acids. Once again water
containing tryptophan showed the largest nitrogen gap, indicating that tryptophan is most
susceptible for nitration and thus by-product formation. Because aromatic amino acids are
expected to be present in source water (i.e. surface water) [19, 20] for MP UV drinking water
treatment, the role of aromatic amino acids in by-products formation needs to be further
investigated.
In order to explain the observed genotoxic response in MP UV treated water and to perform
substance-specific health risk assessment, the identities of these N-DBPs needs to be known.
Based on evidence by Suzuki and Aljammaz, the following hypothesis was made: aromatic
amino acids are a source for the formation of some of the genotoxic N-DBPs formed by MP
UV water treatment.
The first part of the present study therefore aims to: (i) investigate the role of aromatic
amino acids in N-DBPs formation, by irradiation of aromatic amino acids under MP UV
conditions, in combination with stable isotope labeling and high resolution mass
spectrometry; and (ii) identification of N-DBPs formed from aromatic amino acids and further
identification of relevant N-DBPs formed during full-scale MP UV water treatment. To address
the first goal, the labeling strategy developed by Kolkman et al. [13] using 14N and 15N nitrate
was used, and was expanded by also using labeled and unlabeled aromatic amino acids, for
the detection of N-DBPs and for obtaining structural information.
The second part of the study aims to: (i) perform a toxicological evaluation of newly
identified N-DBPs in the present study; and (ii) conduct and evaluate a seven month
monitoring study for identified by-products in order to determine the relevance of N-DBPs in
a full-scale drinking water treatment facility using MP UV treatment.

BTO 2018.035 | March 2018 6 Aromatic amino acids as a source for nitrogen containing by-products formed by
advanced oxidation water treatment
1.3 Structure of this report
In the first part of the present study, the role of aromatic amino acids in N-DBPs formation is
investigated. Therefore the presence of aromatic amino acids in in source water (Lake IJssel)
and artificial water (i.e. NOM and nitrate dissolved in ultrapure water) has to be
demonstrated first. Therefore an analytical method is developed in chapter 2, using liquid
chromatography (LC) coupled to a high resolution quadrupole time of flight mass
spectrometer (QToF), for the quantitative determination of aromatic amino acids in source
and artificial water. In chapter 3 the developed LC-QToF method is optimised for stable
isotope labeling experiments involving aromatic amino acids. Experiments are conducted
using tyrosine, phenylalanine, tryptophan, labeled and unlabeled nitrate, labeled tryptophan
and MP UV treatment. Subsequently, the artificial water and full-scale water treatment facility
sample of the prior study [13] in which 84 and 22 N-DBPs were detected, is screened for
aromatic amino acids N-DBPs (formed with labeling experiments) in order to determine if
some of unidentified N-DBPs found in the prior study could originate from aromatic amino
acids and be identified. In chapter 4, more of the 84 previously detected N-DBPs are
identified and a toxicological evaluation is performed on the identified N-DBPs. Finally, an
analytical target method (LC-QToF) is developed and validated for all identified N-DBPs in the
current and prior study, in order to perform and evaluate a seven month monitoring study
for N-DBPs in a full-scale drinking water treatment facility using MP UV treatment. Finally, in
chapter 5 the conclusions of this study are presented and recommendations are discussed.

BTO 2018.035 | March 2018 7 Aromatic amino acids as a source for nitrogen containing by-products formed by
advanced oxidation water treatment
2 Development and validation of a
LC-QToF method for the
determination of aromatic amino
acids in water
Only if aromatic amino acids are truly present in source water (Lake IJssel) and artificial water
(i.e. NOM and nitrate dissolved in ultrapure water), N-DBPs originating from aromatic amino
acids can be formed and labeling experiments are meaningful. Therefore, first an analytical
method has to be developed for the determination of free dissolved aromatic amino acids
(i.e. tyrosine, phenylalanine and tryptophan) in water.
This chapter describes the analytical method, method development, validation and sample
analysis of free dissolved aromatic amino acids in water.
2.1 Amino acids analysis
Amino acids present in surface water play an important role in the biogeochemistry of
nitrogen and carbon [23], and are therefore studied extensively. They can be analysed with a
large variety of analytical techniques (e.g. HPLC, GC-MS, CE, IC) in many different types of
matrices. Due to their hydrophilicity and zwitterionic nature, analysis of amino acids can be
challenging. Derivatization techniques are therefore widely used to improve detection and
chromatographic separation in biological and environmental matrices. But derivatization
techniques have some major drawback such as, instable derivatives, low derivatives yield and
being labour intensive. Therefore direct analysis techniques without derivatization are
becoming more popular using analytical methodologies such as, CE-MS [24], HPAEC-PAD
[25], ion-pair chromatography (LC) coupled to MS [26], and HILIC-MS [27]. For the analysis of
the total amount of amino acids in a sample (i.e. bound species and biopolymer), often an
acid or alkaline hydrolysis is employed before chromatographic separation. Since it was
shown that free dissolved amino acids are a potential source for N-DBP formation [11, 21,
22], hydrolysis is not needed.
Because this study focuses on the moderately polar aromatic amino acids and their by-
products, sufficient retention and detection is expected using a regular reversed phase C18
method. As a starting point for the analytical method development of free dissolved tyrosine
(Tyr), phenylalanine (Phe) and tryptophan (Trp) (see Figure 1 for structures) in water, the
non-target high resolution screening method employed in the previous studies was used [13,
18]. A high resolution mass spectrometer was used because of its capabilities for detecting
unknown aromatic amino acids by-products, which is needed for the labeling experiments in
chapter 3.
TYROSINE PHENYLALANINE TRYPTOPHAN
Figure 1: Structures of tyrosine, phenylalanine and tryptophan

BTO 2018.035 | March 2018 8 Aromatic amino acids as a source for nitrogen containing by-products formed by
advanced oxidation water treatment
2.2 Material & methods
In this section, the final optimized analytical method and sample pre-treatment is described
for the analysis of tyrosine, phenylalanine and tryptophan in water.
Chemicals
All solvents used were of analytical grade quality. Acetonitrile and methanol (ultra gradient
HPLC grade) were obtained from Avantor Performance Materials B.V. (Deventer, the
Netherlands). Formic acid (HPLC quality) was purchased from Sigma-Aldrich (Steinheim,
Germany). The aromatic amino acids reference standards; L-tyrosine, L-phenylalanine and
L-tryptophan were acquired from Sigma-Aldrich. The isotopically labeled internal standards;
L-tyrosine-d4, L-phenylalanine-d5 and L-tryptophan-d5 were purchased from Toronto
Research Chemicals (Toronto, Canada). In table 1, the CAS number, formula, accurate mass
of the protonated molecule ([M+H]+) and Log D are shown for the aromatic amino acids and
their corresponding internal standards. Ultrapure water was obtained by purifying
demineralized water in an Elga Purelab Chorus ultrapure water system. (High Wycombe,
United Kingdom). Stock solutions of the reference and internal standards were prepared in
methanol and ultrapure water (20/80% v/v) at a concentration of 100 and 50 mg/L,
respectively. Stock solutions were stored at -25o C. Standards were prepared from the stock
solutions by dilution in ultrapure water, and were prepared shortly before analysis.
TABLE 1: CAS NUMBER, FORMULA, ACCURATE MASS PROTONATED MOLECULE AND LOG D OF AROMATIC
AMINO ACIDS AND INTERNAL STANDARDS
Name CAS number Formula Accurate mass
[M+H]+
Log D*
(pH 4)
L-tyrosine 60-18-4 C9H11NO3 182.0812 -1.49
L-phenylalanine 63-91-2 C9H11NO2 166.0863 -1.20
L-tryptophan 73-22-3 C11H12N2O2 205.0972 -1.10
Internal standards
L-tyrosine-d4 62595-14-6 C9H7D4NO3 186.1063 n.d.
L-phenylalanine-d5 56253-90-8 C9H6D5NO2 171.1176 n.d.
L-tryptophan-d5 62595-11-3 C11H7D5N2O2 210.1285 n.d.
n.d. not determined
* calculated using ChemAxon
Sample pre-treatment
Fifty mL of water sample was transferred into a 50 mL flask, to which the internal standards
were added (2.0 µg/L). After homogenization the samples were filtered using a 0.2 µm
Phenomenex Phenex regenerated cellulose filter (Utrecht, Netherlands) and were transferred
to an autosampler vial for LC-QToF analysis.
LC-QToF analysis
The LC system consisted of a LC-30AD binary gradient pump, SIL-30AC auto sampler and a
CTO-20AC column oven (Shimadzu Corporation, Kyoto, Japan). The chromatographic
separation was achieved using a Xbridge BEH C18 XP (2.1 x 100 mm, 2.5 µm, Waters,
Milford, MA, USA) preceded by a Phenomenex SecurityGuard Ultra column (Phenomenex,
Torrance, USA) at a temperature of 25o C. The mobile phase consisted out of solvent A;
ultrapure water with 0.05% formic acid (v/v) and solvent B; acetonitrile with 0.05% formic
acid (v/v). The gradient elution started with 4% B and was held constant for 1 minute, and
was then followed by a linear gradient to 100% B in 7 min, and was held constant at 100% B
for 4 min. Then the mobile phase was returned to initial gradient conditions in 0.5 min and

BTO 2018.035 | March 2018 9 Aromatic amino acids as a source for nitrogen containing by-products formed by
advanced oxidation water treatment
was held for 4.5 min. The mobile phase flow rate was 0.3 mL/min and the injection volume
was set to 50 µL.
Detection was performed using an AB Sciex TripleTOF 5600+ high resolution QToF mass
spectrometer (AB Sciex, Concord, Canada) operated in positive electrospray (ESI) mode with a
DuoSpray ion source. External mass calibration was automatically performed after thirty
consecutive samples by a calibration delivery system (AB Sciex) using the APCI probe of the
DuoSpray ion source. The source conditions were as follows: ion spray voltage, 5.0 kV; ion
source gas 1 and 2 at 40 and 50 psi, respectively; curtain gas, 25 psi; temperature, 500 oC
and declustering potential, 70 V. Full scan accurate MS and MS/MS mass spectra were
acquired from 100 to 800 Da with a resolving power of 30,000 FWHM (at m/z 400). In order
to unambiguously confirm the identities of tyrosine, phenylalanine and tryptophan, MS/MS
spectra were recorded with a collision energy of 35 eV and collision energy spread (CES) of
15 eV. The recording of MS/MS spectra of the analytes, specified in the mass list, was
continuously acquired (no threshold) from 40 to 300 Da. Data acquisition and processing
were performed using Analyst TF 1.6 and Multiquant 3.0 software (AB Sciex).
2.3 Results method development and optimisation
For the method development of free dissolved aromatic amino acids in water, the LC-QToF
non-target screening method employed in the previous study [18] was used as starting
point . Due to the hydrophilicity of the aromatic amino acids (see table 1 for Log D values),
sample pre-treatment using the solid phase extraction method described in the previous
study is not possible. The recovery for these aromatic amino acids would just be too low.
Therefore the decision was made, to use a direct injection approach in which water samples
are directly injected onto the column, in order to minimize the loss of aromatic amino acids.
The same approach is used for the labeling experiments described in chapter 3, also to
minimize the loss of N-DBPs during sample pre-treatment.
A reversed phase Xbridge BEH C18 XP analytical column was used for the method
development. And for the mobile phase a combination of ultrapure water (A) and acetonitrile
(B) with formic acid as modifier (0.05% v/v) was used. The initial gradient of the non-target
screening method started with 5% B. First the injection volume was optimised. In order to
obtain the most sensitivity, a large injection volume (for a 2.1 mm column) of 100 µL was
tested first. This resulted in a broad peak for tyrosine (most polar) and also a moderately
broad peak for phenylalanine. Satisfactory peak shapes were obtained for all aromatic amino
acids using a 50 µL injection. The gradient was then further optimised by lowering the initial
gradient to 4% B, and by holding the gradient for 1 min, improving retention for tyrosine.
Furthermore the linear gradient was shortened from 40 min (100% B) to 7 min (100% B),
improving total analysis time from 52 min to 17 min.
Since mass spectrometric analysis of amino acids can be performed in the positive or
negative mode using electrospray ionisation, first a comparison was made between both
ionisation modes. It was determined that the sensitivity was improved substantially (> 2x) in
the positive mode. Therefore the mass spectrometric detection was performed by the
detection of the protonated molecular ion ([M+H]+) using an extracted ion chromatogram
window of 10 ppm. In order to improve selectivity and sensitivity, continuous MS2 spectra
recording of the aromatic amino acids was added to the QToF acquisition method. The most
intense fragments per compound were selected for quantification purposes. This resulted in
improved selectivity and thus lower detection limits for all aromatic amino acids. See figure 2
for a comparison between the extracted ion chromatogram (EIC) of the protonated molecular
ion ([M+H]+) and EIC of the most intense fragment per compound.

BTO 2018.035 | March 2018 10 Aromatic amino acids as a source for nitrogen containing by-products formed by
advanced oxidation water treatment
Fragment ions were acquired with a collision energy of 20, 35 and 50 eV, which was
automatically averaged (CES) to obtain MS2 spectra with many fragment ions (see attachment
I for MS2 spectra of tyrosine, phenylalanine and tryptophan).
1.6 1.8 2.0 2.2 2.4 2.6 2.8 3.0 3.2 3.4 3.6 3.8 4.0 4.2 4.4 4.6 4.8 5.0 5.2 5.4 5.6 5.8 6.0 6.2
Time, min
0
100
200
300
400
500
600
700
800
900
1000
1100
1200
1300
1400
Inte
nsi ty
1.5 2.0 2.5 3.0 3.5 4.0 4.5
Time, min
0
20
40
60
80
100
120
140
160
180
Inte
nsity
3.0 3.5 4.0 4.5 5.0 5.5 6.0
Time, min
0
50
100
150
200
250
300
350
400
450
500
Inte
nsi ty
4.0 4.5 5.0 5.5 6.0 6.5 7.0
Time, min
0
50
100
150
200
250
300
Inte
nsi
t y
A)
B) C) D)tyrosine phenylalanine tryptophan
tyrosine
phenylalanine
tryptophan
Figure 2: Chromatograms of drinking water spiked with 0.25 µg/L aromatic amino acids. A) Summed EIC
[M+H]+ trace (10 ppm) of aromatic amino acids. B) Tyrosine MS2 EIC of m/z 91.0542. C) Phenylalanine
MS2 EIC 120.0808. D) Tryptophan MS2 EIC of m/z 118.0651.
Sample pre-treatment consisted of adding isotopically labeled internal standards of the
aromatic amino acids to the sample followed by filtration using a 0.20 µm filter prior to LC-
QToF analysis. No loss of aromatic amino acids was observed during the filtration step.
2.4 Method validation
The developed analytical method was validated for drinking and surface water. The limit of
detection (LOD), limit of quantification (LOQ), repeatability and recovery were determined for
all aromatic amino acids in both matrices. The validation results are shown in table 2 for
drinking water and table 3 for surface water.
TABLE 2: VALIDATION RESULTS AROMATIC AMINO ACIDS IN DRINKING WATER (N=8)
Compounds LOD LOQ Repeatability
1 µg/L
Recovery
1 µg/L
(µg/L) (µg/L) (%) (%)
L-tyrosine 0.033 0.10 3.5 98.5
L-phenylalanine 0.008 0.10 2.6 98.5
L-tryptophan 0.016 0.10 2.2 101.9
BTO 2018.035 | March 2018 11 Aromatic amino acids as a source for nitrogen containing by-products formed by
advanced oxidation water treatment
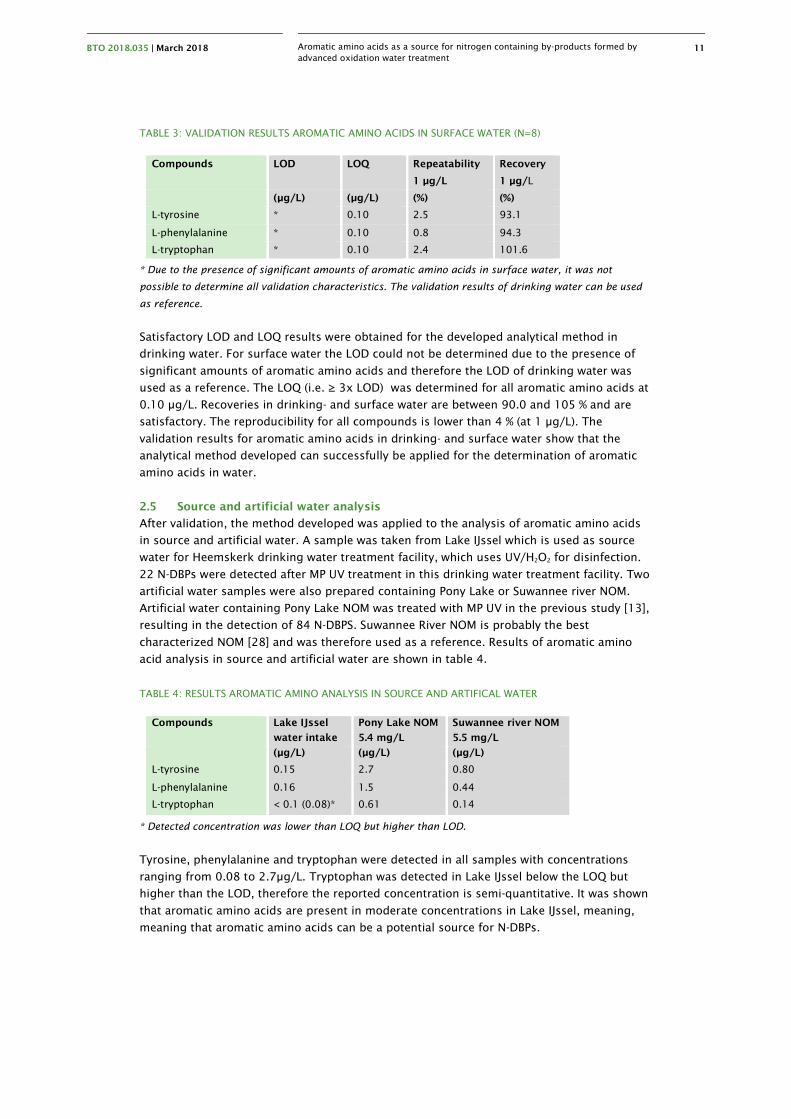
TABLE 3: VALIDATION RESULTS AROMATIC AMINO ACIDS IN SURFACE WATER (N=8)
Compounds LOD LOQ Repeatability
1 µg/L
Recovery
1 µg/L
(µg/L) (µg/L) (%) (%)
L-tyrosine * 0.10 2.5 93.1
L-phenylalanine * 0.10 0.8 94.3
L-tryptophan * 0.10 2.4 101.6
* Due to the presence of significant amounts of aromatic amino acids in surface water, it was not
possible to determine all validation characteristics. The validation results of drinking water can be used
as reference.
Satisfactory LOD and LOQ results were obtained for the developed analytical method in
drinking water. For surface water the LOD could not be determined due to the presence of
significant amounts of aromatic amino acids and therefore the LOD of drinking water was
used as a reference. The LOQ (i.e. ≥ 3x LOD) was determined for all aromatic amino acids at
0.10 µg/L. Recoveries in drinking- and surface water are between 90.0 and 105 % and are
satisfactory. The reproducibility for all compounds is lower than 4 % (at 1 µg/L). The
validation results for aromatic amino acids in drinking- and surface water show that the
analytical method developed can successfully be applied for the determination of aromatic
amino acids in water.
2.5 Source and artificial water analysis
After validation, the method developed was applied to the analysis of aromatic amino acids
in source and artificial water. A sample was taken from Lake IJssel which is used as source
water for Heemskerk drinking water treatment facility, which uses UV/H2O2 for disinfection.
22 N-DBPs were detected after MP UV treatment in this drinking water treatment facility. Two
artificial water samples were also prepared containing Pony Lake or Suwannee river NOM.
Artificial water containing Pony Lake NOM was treated with MP UV in the previous study [13],
resulting in the detection of 84 N-DBPS. Suwannee River NOM is probably the best
characterized NOM [28] and was therefore used as a reference. Results of aromatic amino
acid analysis in source and artificial water are shown in table 4.
TABLE 4: RESULTS AROMATIC AMINO ANALYSIS IN SOURCE AND ARTIFICAL WATER
Compounds Lake IJssel
water intake
Pony Lake NOM
5.4 mg/L
Suwannee river NOM
5.5 mg/L
(µg/L) (µg/L) (µg/L)
L-tyrosine 0.15 2.7 0.80
L-phenylalanine 0.16 1.5 0.44
L-tryptophan < 0.1 (0.08)* 0.61 0.14
* Detected concentration was lower than LOQ but higher than LOD.
Tyrosine, phenylalanine and tryptophan were detected in all samples with concentrations
ranging from 0.08 to 2.7µg/L. Tryptophan was detected in Lake IJssel below the LOQ but
higher than the LOD, therefore the reported concentration is semi-quantitative. It was shown
that aromatic amino acids are present in moderate concentrations in Lake IJssel, meaning,
meaning that aromatic amino acids can be a potential source for N-DBPs.

BTO 2018.035 | March 2018 12 Aromatic amino acids as a source for nitrogen containing by-products formed by
advanced oxidation water treatment
2.6 Summary/conclusion
A LC-QToF method was developed for the determination of aromatic amino acids in drinking-
and surface water. Satisfactory LOD and LOQ results were obtained for both drinking- and
surface water. Aromatic amino acids were detected in source and artificial water, showing
that they can be a potential source for the formation of N-DBPS.
The developed analytical method demonstrated that it is well applicable for analysis of
aromatic amino acids, and will therefore be used for the labeling experiments in chapter 3.
However some adjustment will be made to the method in order to perform non-target
screening for unknown aromatic N-DBPs (e.g. longer gradient and information dependent
MS2 acquisition).

BTO 2018.035 | March 2018 13 Aromatic amino acids as a source for nitrogen containing by-products formed by
advanced oxidation water treatment
3 Labeling experiments
In chapter 2 it was shown that aromatic amino acids are present in source and artificial
water, meaning that the possibility exist that some of the N-DBPs could originate from
aromatic amino acids after MP UV treatment. In this chapter stable isotope labeling
experiments will be conducted to really find out whether this is the case.
3.1 Stable isotope labeling strategy
In the previous study, an innovative stable isotope labeling strategy was developed for
tracing N-DBPs in artificial water [13], based on incorporation of the nitrate atom originating
from nitrate into an newly formed N-DBP after MP UV treatment. This strategy will also be
used for labeling experiments with aromatic amino acids.
The labeling strategy works as follows: when stable isotope nitrate (15NO3-) is added to
artificial water and normal nitrate (14NO3-) is added to another artificial water sample from the
same source and both are MP UV treated, 15N will be incorporated into a newly formed N-DBP
in the first artificial water sample, and 14N will be incorporated into the same N-DBP in the
second artificial water. This will result in a mass difference of 0.99704 Da between the N-DBP
formed with normal nitrate (14NO3-) and labeled nitrate (15NO3
-). This mass difference can be
detected by high resolution mass spectrometry in combination with a non-target screening
approach (see figure 3). Only N-DBPs will have this characteristic mass difference, and can
therefore be distinguished from regular DBPs and background ions.
Figure 3: Stable isotope labeling strategy for the detection of N-DBPs. A mass spectrum is shown with a
∆m/z of 0.99704 between the stable isotope labeled N-DBP compared to the normal N-DBP.
3.2 Tryptophan labeling experiments
Since tryptophan showed the highest Ames response and nitrogen gap in other studies [21,
22] after MP UV treatment, tryptophan is the obvious choice for starting the labeling
experiments. Two stable isotope-labeled substances were used for labeling experiments, i.e.
nitrate (15NO3-) and tryptophan-13C11 (
13C11H12N2O2).The stable isotope-labeled tryptophan was
used to provide additional certainty that the formed by-product really originates from
tryptophan itself, and not from an unwelcome contamination. Another advantage of using
labeled tryptophan is that the number of carbon atoms present in the formed by-products
can easily be determined. A sample scheme was made for the tryptophan labeling
experiments, in which different sample compositions are tested (table 5). All the samples
consisted out of ultrapure water to which a combination of; unlabeled tryptophan, labeled
tryptophan, unlabeled nitrate, labeled nitrate and Pony Lake NOM was added. For the

BTO 2018.035 | March 2018 14 Aromatic amino acids as a source for nitrogen containing by-products formed by
advanced oxidation water treatment
labeling experiments a relatively high concentration (5 mg/L) of labeled and unlabeled
tryptophan was used, in order to ensure that high concentration of by-products were formed
in, which easily should be detected using mass spectrometry. Nitrate and NOM concentration
were at the same level as in the previous studies [13, 18], in order to obtain comparable
results and to ensure by-product formation. NOM was added to some samples to find out if
NOM or NOM intermediate products can react with tryptophan to form other by-products.
All samples were prepared in fourfold (with exception of the untreated reference) which then
were subdivided into two duplicate sample sets, of which one duplicate sample set was MP
UV treated while the other remained untreated. Of each sample 100 mL was prepared and
was transferred to a glass sample bottle and was stored at 1-5 oC until MP UV treatment.
TABLE 5: OVERVIEW TRYPTOPHAN LABELING SAMPLE SCHEME
Samples MP UV Unlabeled Labeled Unlabeled Labeled Pony Lake
treatment Tryptophan
5 mg/L
Tryptophan
5 mg/L
nitrate
10 mg/L
nitrate
10 mg/L
NOM
5 mg/L
Untreated reference (ultrapure water)
Untreated + Trp, without nitrate x
UV treated + Trp, without nitrate x x
Untreated + Trp + 14NO3- x x
UV treated + Trp + 14NO3- x x x
Untreated + Trp + 15NO3- x x
UV treated + Trp + 15NO3- x x x
Untreated + Trp + 14NO3- + NOM x x x
UV treated + Trp + 14NO3- + NOM x x x x
Untreated + Trp + 15NO3- + NOM x x x
UV treated + Trp + 15NO3- + NOM x x x x
Untreated + Trp-13C, without nitrate x
UV treated + Trp-13C, without nitrate x x
Untreated + Trp-13C + 14NO3- x x
UV treated + Trp-13C + 14NO3- x x x
Untreated + Trp-13C + 15NO3- x x
UV treated + Trp-13C + 15NO3- x x x
Untreated + Trp-13C + 14NO3- + NOM x x x
UV treated + Trp-13C + 14NO3- + NOM x x x x
Untreated + Trp-13C + 15NO3- + NOM x x x
UV treated + Trp-13C + 15NO3- + NOM x x x x
UV treated + Trp-13C + 14NO3- + 15NO3
- x x x* x*
UV treated + Trp-13C 14NO3- + 15NO3
- +
NOM
x x x* x* x
All samples were prepared in duplicate
* 5 mg/L
MP UV treatment
The samples were sent to PWN technologies for MP UV treatment using a collimated beam
set-up. Fifty-five mL of sample was transferred into a 60 × 35 mm crystallizing dish and was
MP UV treated in open air at room temperature. The MP UV dose was delivered by a Trojan
collimated beam apparatus using a 3 kW medium pressure Hg lamp. UV dose calculations
were performed according to Bolton and Linden [29]. UV intensity was measured using a
radiometer (International Light IL1700). A MP UV dose of 600 mJ/cm2 was applied to each

BTO 2018.035 | March 2018 15 Aromatic amino acids as a source for nitrogen containing by-products formed by
advanced oxidation water treatment
sample. After irradiation the samples were returned and stored at 1-5 oC awaiting sample
pre-treatment and LC-QToF analysis.
Sample pre-treatment
Twenty-five mL of water sample was transferred into a 25 mL flask, to which the internal
standard tryptophan-d5 was added (100 µg/L). After homogenization, the samples were
filtered using a 0.20 µm filter and were transferred to an autosampler vial for LC-QToF
analysis.
LC-QToF analysis
For the analysis of tryptophan labeling samples, the aromatic amino acid method used in
chapter 2 was partially adjusted. A longer linear gradient was applied, increased from 7
minutes to 100 %B, into 40 minutes to 100% B, in order to achieve a better separation for by-
products and also to detect less-polar by-products. Data acquisition was performed in
positive and negative ionisation mode. And instead of using a mass list for triggering MS/MS
spectra, information dependent acquisition (IDA) was used for triggering MS/MS spectra.
Eight IDA MS/MS spectra were triggered per full scan cycle, only for signals higher than 100
counts in combination with background subtraction and dynamic exclusion. The remainder
of the LC-QToF settings can be found in attachment II (materials & methods labeling
experiments).
Mass spectrometric data analysis
After LC-QToF analysis, the raw mass spectrometric data was processed using MasterView
(Sciex) and differential analysis was performed in order to detect differences between 14NO3-,
15NO3-, Trp12C11, Trp-13C11, TRP-12C11D5 and NOM MP UV treated samples, and the control
samples. The intensity threshold for MasterView was set at 2000 counts for the positive and
negative mode. The chromatographic data was compared from 1.5 to 35 min, with a mass
range of 65-800 Da and an EIC width of 0.02 Da and retention window of 1min.
The nitrate labeling strategy was used for the detection of all N-DBPs formed by the MP UV
treatment of nitrate. For this the UV treated Trp + 14NO3- sample was compared with UV
treated Trp + 15NO3- sample, wherein all detected compounds with a mass difference of
0.99704 Da between the 14NO3- and 15NO3
- sample, which were not present in the control
samples, were detected as N-DBPs. Also the UV treated Trp + 14NO3- sample was compared
with UV treated Trp-13C11 + 14NO3- sample, in order to detect all by-products originating from
tryptophan, including by-products that were formed only by UV photolysis without
interactions of nitro radicals. An overview of the amount of detected by-products is shown in
table 6.
TABLE 6: OVERVIEW OF THE NUMBER OF DETECTED TRYPTOPHAN BY-PRODUCTS
Type of compounds Number of accurate masses Summed concentration
Trp-d5 equivalents (µg/L)
Positive Negative Positive Negative
DBPs (all) 957 1127 4049 3292
N-DBPs 157 278 680 741
Many by-products were formed by MP UV treatment of water containing tryptophan. In total
957 and 1127 accurate masses were detected in positive and negative mode, respectively. Of
these detected accurate masses only a relative small number were N-DBPs, 157 for positive
mode and 278 for negative mode. The number of accurate masses of DBPs and N-DBPs
stated in the table are not all unique. Some of the detected accurate masses are from

BTO 2018.035 | March 2018 16 Aromatic amino acids as a source for nitrogen containing by-products formed by
advanced oxidation water treatment
fragments or adducts of by-products, therefore the actual number of by-products will be
lower.
In order to obtain a good overview and to find out if most of the by-products are detected
with the applied approach, a mass balance was made up. For this the concentration of
tryptophan before UV treatment and after UV treatment was calculated using Trp-d5. All the
detected by-products were also semi-quantified as Trp-d5 internal standard equivalent. The
mass balance is shown in table 7.
TABLE 7: MASS BALANCE OF TRYPTOPHAN AND BY-PRODUCTS AFTER MP UV (TRP-D5 EQUIVALENTS)
Type of compounds Positive mode Negative mode
Concentration
(µg/L Trp-d5 eq.)
(%) Concentration
(µg/L Trp-d5 eq.)
(%)
Tryptophan before UV 5188 - 5188 -
Tryptophan after UV 1117 21.5 1560 30.1
DBPs after UV 3369 64.9 2551 49.2
N-DBPs after UV 680 13.1 741 14.3
Sum Trp + DBPs 5166 99.6 4852 93.6
The concentration of tryptophan after MP UV is substantially decreased to 21.5% and 30.1%
of its initial amount, for positive and negative mode respectively. This means that a
considerable amount of tryptophan is converted by UV photolysis and nitro radicals into
DBPs and N-DBPs, which is confirmed by the detected amounts DBPs and N-DBPs. In the end,
99.6% and 93.6% (positive and negative mode) of the mass balance is accounted for,
demonstrating that most of by-products are detected using this approach. However, there
are some remarks for calculating the mass balance like this. First, the concentration of the
by-products cannot be determined exactly, because the ionisation efficiency is different for
each by-product. Therefore the calculated concentration is an indication. Second, there is no
correction made for the amount of nitrate/nitro groups reacting with tryptophan to form N-
DBPs. Nevertheless, the mass balance still gives a good overview of the performed
experiment and also shows that most of the by-products are probably detected.
Tryptophan labeling results
For the detection of N-DBPs formed by MP UV treatment of tryptophan, the UV treated Trp + 14NO3
- sample was compared with UV treated Trp + 15NO3- sample as described in 3.2.4. An
example of an N-DBP detected using the labeling strategy is shown figure 4. In this figure an
extracted ion chromatogram is shown of an N-DBP with the elemental composition C8H6N2O2.
In the 14NO3- MP UV treated sample, a chromatographic peak is detected for m/z 161.0360,
but is not present in the 14NO3- sample without MP UV treatment. In the 15NO3
- MP UV treated
sample, a chromatographic peak is detected for m/z 162.0331 and no peak is visible for
m/z 161.0360. In the sample with an equal amount (1:1) of 14NO3- and 15NO3
-, both peaks are
detected in the same ratio and at the same retention time. This confirms that detected
compound at m/z 161.0360 is really a N-DBP. The 1:1 mixture sample can also be used to
search for peak pairs with a 1:1 ratio and mass difference of m/z 0.99704 (for a single N
incorporation), making data analysis easier.

BTO 2018.035 | March 2018 17 Aromatic amino acids as a source for nitrogen containing by-products formed by
advanced oxidation water treatment
Sample 1 2 3 4
Nitrate 14NO3- 14NO3
- 15NO3-
14NO3- / 15NO3
-
(1:1)
MP UV - + + +
EICm/z
161.0630
EICm/z
162.0331
16.87 min
16.85 min
16.84 min
16.84 min
Figure 4: Example of a detected N-DBP (C8H6N2O2) in negative mode that is formed after MP UV treatment.
The EICs of m/z 161.0360 and m/z 162.0331 are shown.
In total 157 and 278 accurate masses of N-DBPs were detected in the positive and negative
mode, respectively The N-DBPs were considered to be “real” when they were present in the
same ratio in the 14NO3- and 15NO3
- sample after MP UV treatment and were present in the 1:1
mixture sample in the same ratio and were also detected in the 13C-Trp sample after MP UV
treatment. The 13C-Trp sample was used for confirmation and determination of the amount
of 13C atoms in the formed by-products, which give extra information about the elemental
compositions of the by-products. The top 10 and top 15 of the highest detected N-DBPs in
the positive and negative mode are shown respectively in tables 8 and 9. The elemental
composition and mass error were determined for the listed N-DBPs, and for some of the
detected N-DBPs the identity was also determined. For the identification, a diagram
containing common tryptophan modifications by nitrating agents [30] was used, or were
determined using the elemental composition and MS/MS spectrum. All identifications are
tentative.(i.e. level 2/3 according to Schymanski [31])
TABLE 8: MOST ABUNDANT TRYPTOPHAN N-DBPS IN POSITIVE MODE
Accurate Accurate Accurate RT Intensity Concn. 13C Formula ∆ppm Identity
mass mass mass Trp-d5 atoms
14NO3- 15NO3
- 13C-Trp (min) equiv (µg/L)
282.0729 283.0702 293.1097 6.36 344064 61 11 C11H11N3O6 3.7 dihydroxy-nitrotryptophan
220.0723 221.0691 230.1051 6.97 329039 58 10 C10H9N3O3 2.4
220.0721 221.0691 230.1051 5.59 300943 53 10 C10H9N3O3 1.5
266.0780 267.0749 277.1146 3.90 174436 31 11 C11H11N3O5 3.2 hydroxy-nitrotryptophan
248.0673 249.0642 259.1038 3.90 139152 25 11 C11H9N3O4 2.9
266.0779 267.0749 277.1145 5.22 137670 24 11 C11H11N3O5 3.2 hydroxy-nitrotryptophan
264.0625 265.0593 275.0989 4.02 118528 21 11 C11H9N3O5 2.7
250.0828 251.0801 261.1196 8.91 108081 19 11 C11H11N3O4 2.3
254.0779 255.0748 264.1112 7.03 104660 19 10 C10H11N3O5 2.6
203.0453 204.0423 213.0784 6.96 97688 17 10 C10H6N2O3 0.9

BTO 2018.035 | March 2018 18 Aromatic amino acids as a source for nitrogen containing by-products formed by
advanced oxidation water treatment
TABLE 9: MOST ABUNDANT TRYPTOPHAN N-DBPS IN NEGATIVE MODE
Accurate Accurate Accurate RT Intensity Concn. 13C Formula ∆ppm Identity
mass mass mass Trp-d5 atoms
14NO3- 15NO3
- 13C-Trp (min) equiv (µg/L)
189.0311 190.0281 198.0611 14.53 253492 42 9 C9H6N2O3 2.3 nitroindole-carbaldehyde
280.0579 281.0550 291.0944 6.36 240716 40 11 C11H11N3O6 1.4 dihydroxy-nitrotryptophan
217.0260 218.0229 227.0595 10.85 237069 40 10 C10H8N2O5 1.5
236.0681 237.0649 246.1014 5.59 230689 39 10 C10H11N3O4 1.4
264.0632 265.0600 275.0998 3.90 214684 36 11 C11H11N3O5 1.9 hydroxy-nitrotryptophan
264.0631 265.0600 275.0996 5.21 162315 27 11 C11H11N3O5 1.5 hydroxy-nitrotryptophan
262.0476 263.0443 273.0839 4.03 136529 23 11 C11H9N3O5 1.4
248.0677 249.0647 259.1052 8.58 104598 18 11 C11H11N3O4 -0.3 nitrotryptophan
233.0205 234.0174 243.0544 8.89 99350 17 10 C10H6N2O5 0.0
190.0260 191.023 198.0527 10.66 88417 15 8 C8H5N3O3 0.4
280.0574 281.0543 291.0942 11.9 83280 14 11 C10H9N3O4 -0.4
161.0360 162.0331 169.0629 16.87 70977 12 8 C8H6N2O2 2.2
189.0308 190.0278 198.0609 15.48 64659 11 9 C9H6N2O3 0.2
235.0359 236.0330 245.0692 13.67 56744 9 10 C10H8N2O5 -1.0
280.0573 281.0542 291.0939 10.16 50687 8 11 C11H11N3O6 -1.1
Dihydroxy-nitrotryptophan is detected as highest in the positive mode and as second highest
in the negative mode. The identity of the most intense N-DBP with m/z 189.0311 in the
negative mode is uncertain. A possible candidate is nitroindole-carbaldehyde, but many
structural isomers are possible. Another frequently detected N-DBP (multiple isomers) is
nitrotryptophan, which is detected using both ionisation modes. As expected there is a
substantial overlap between the N-DBPs detected in the positive and negative mode, due to
the presence of functional groups that are ionisable in the positive (e.g. nitrogen) and
negative (e.g. carboxyl and hydoxy) ionisation mode.
NOM samples
For the tryptophan labeling experiments also some samples were prepared containing NOM
(see 3.2) in order to find out if NOM or NOM intermediate products can react with tryptophan
to form other by-products, or have any effect on by-product formation. For this the UV
treated Trp + 14NO3- + NOM sample was compared with UV treated Trp + 15NO3
- + NOM
sample. The top 25 highest detected by-products were then compared with the top 25 by-
products formed without NOM to check if there was any difference. See table 10 for an
overview of the total amount of N-DBPs detected in the NOM sample, compared with the
amount of N-DBPs detected without NOM.
TABLE 10: COMPARSION OF THE AMOUNT OF N-DBPS DETECTED WITH AND WITHOUT NOM
Sample Detected
accurate masses
Summed concentration
Trp-d5 equivalents (µg/L)
Positive Negative Positive Negative
Trp + 14NO3- without NOM 157 278 680 741
Trp + 14NO3- with NOM 165 189 595 459
The same N-DBPs were found with and without NOM, although the concentrations detected
in the NOM samples are on average lower. The total amount and concentration of by-
products detected in the NOM samples is lower. This is probably due to the available amount
of nitrate present in the sample, resulting in competition between the formation of

BTO 2018.035 | March 2018 19 Aromatic amino acids as a source for nitrogen containing by-products formed by
advanced oxidation water treatment
tryptophan N-DBPs and NOM N-DBPs. So in the end more by-products are probably formed in
the presence of NOM, but remain undetected because they fall below the threshold of
detection. This experiment shows that presence of NOM has a relatively small effect on
tryptophan N-DBP formation, and will therefore not be used for the stable isotope labeling
experiments with tyrosine and phenylalanine.
Suspect screening of 84 N-DBPs
The goal of the tryptophan labeling experiments was to find out if some of unidentified N-
DBPs detected in artificial water and/or full-scale water treatment facility (both MP UV
treated) in the prior study could originate from tryptophan. So a suspect screening was
performed for the 84 N-DBPs detected in previous study (see attachment III for the list). For
the suspect screening the MP UV treated Trp + 14NO3- sample was used. In order to confirm a
possible match, the artificial water samples and samples of the full-scale water treatment
facility (both SPE extracts) of the prior study were analysed again using the analytical method
for the tryptophan labeling experiments. The sample extracts were pre-treated in the prior
study using the AMES SPE protocol, in order to achieve sufficient sensitivity for the Ames
fluctuation assay and non-target HR-MS screening. Because the aromatic amino labeling
experiments were conducted at relatively high concentrations, SPE treatment was not
needed, and sufficient sensitivity was achieved using direct injection.
With the suspect screening, only one N-DBPs at m/z 161.0360 (in negative mode) was
detected in the original 14NO3- artificial water sample of the prior study, was also detected in
the MP UV treated Trp + 14NO3- sample of the current study. See table 11 for the results. The
N-DBP with m/z 161.0360 was not detected in the full-scale water treatment sample.
TABLE 11: RESULTS SUSPECT SCREENING OF THE MOST ABUNDANT TRYPTOPHAN N-DBPS IN THE
ARTIFICAL WATER SAMPLE OF THE PRIOR STUDY
Accurate RT Intensity Concn. Formula RT RT RT, MS1 and
mass Trp-d5 Trp N-DBPs Original 14NO3- MS2 Confirmed
14NO3-
(min)
equiv
(µg/L)
Trp + 14NO3-
sample (min)
sample (min)
161.0360 16.87 70977 12 C8H6N2O2 16.87 16.88 yes
With the suspect screening there were no N-DBPs detected in the positive mode in the
original 14NO3- artificial water sample. In the negative mode one by-product with m/z
161.0360 was detected and confirmed in the original 14NO3- artificial water sample by
matching retention time and MS/MS spectrum (see figure 5 and table 11). This demonstrates
that experimental design of this study has worked, and that one by-product detected in the
prior study could potentially originate of tryptophan.
In the prior study only 16 N-DBPs (of which 6 uniquely) of the 84 N-DBPs were detected in the
positive mode, therefore it was taken into account that N-DBPs originating from tryptophan
most likely would be detected in the negative mode. Of the top 15 by-products formed by
the MP UV tryptophan labeling experiments, only number 12 (m/z 161.0360), a relatively
low intensity N-DBPs was detected in artificial water. This could mean that the other by-
products are not formed during the MP UV irradiation of artificial water, or that these other
formed by-products are not sufficiently extracted from the water using AMES pre-treatment
protocol, which was used as sample pre-treatment in the prior study. So in order to
investigate if the detected N-DBP, really originate of tryptophan, SPE experiment will be
conducted to determine the extraction recovery of the top 15 N-DBPs in negative mode. See
3.4 for the SPE experiments.

BTO 2018.035 | March 2018 20 Aromatic amino acids as a source for nitrogen containing by-products formed by
advanced oxidation water treatment
15.5 16.0 16.5 17.0 17.5 18.0 18.5Time (min)
0e0
1e4
2e4
3e4
4e4
5e4
6e4
Inte
nsity
15.5 16.0 16.5 17.0 17.5 18.0 18.5Time (min)
0
200
400
600
800
1000
1200
1400
1600
50 60 70 80 90 100 110 120 130 140 150 160 170m/z
0
100
200
300
400
500
600
700
800
900161.0348
131.0371115.0427
50 60 70 80 90 100 110 120 130 140 150 160 170m/z
0
20
40
60
80
100
120
140
160
180
161.0338
131.0379115.0415
16.87
16.88
Inte
nsi
ty
Inte
nsit
yIn
ten
sity
A)
B)
C)
D)
Figure 5: confirmation of N-DBP m/z 161.0360 in artificial water. A) EIC of m/z 161.0360 in Trp + 14NO3-
after MP UV sample. B) EIC of m/z 161.0360 in artificial water after MP UV. C) MS2 spectrum of m/z
161.0360 in Trp + 14NO3- after MP UV sample. D) MS2 spectrum of m/z 161.0360 in artificial water after
MP UV.
Identification of m/z 161.0360
Before a toxicological evaluation can be performed for the N-DBPs with m/z 161.0360, the
identity must be known. The identification process for m/z 161.0360 (C8H6N2O2) started with
investigating the loss of elements during N-DBP formation. The molecular formula of the by-
product (C8H6N2O2) was subtracted from that of tryptophan (C11H12N2O2). So during N-DBP
formation C3H6 was lost, and the by-product was very likely nitrated, and gained also a nitro
(NO2) group. This means that of the original tryptophan structure C3H6NO2 was lost. This loss
shows that the acid functional group and amine functional group of the basic amino acid
structure were probably lost during N-DBP formation, whereby the nitrated indole structure
remains. See figure 6 for the structure of indole.
Figure 6: structure of indole (CAS nr. 120-72-9)
The theory that the formed by-product is nitroindole, is supported by the observed retention
for this by-product (16.87 min) compared with that of tryptophan (6.86). Nitroindole is less
polar due to the missing amine and acid functional group, and should therefore have a
substantially higher retention, which is the case. Next a reference spectrum was sought and
found of 6-nitroindole in the NIST EI-GC-MS library. This EI-GC-MS spectrum (figure 7)
containing nominal masses, was compared with that of the MS2 spectrum of the by-product
(figure 5C) and showed similarities. There is a mass difference of one Da between the EI-GC-
MS and LC-MS MS2 [M-H]- spectrum, which can be explained by the loss of a proton (negative
mode ionisation).

BTO 2018.035 | March 2018 21 Aromatic amino acids as a source for nitrogen containing by-products formed by
advanced oxidation water treatment
Figure 7: EI-GC-MS reference spectrum of 6-nitroindole
Because nitroindole has many structural isomers, the most common structural isomers were
ordered as reference standard for the confirmation of the identity of the by-product. The
results of the reference standards and the Trp + 14NO3- MP UV sample analysis is shown in
table 12.
TABLE 12: RESULTS REFERENCE STANDARD ANALYSIS OF NITROINDOLE ISOMERS
Compound CAS nr RT sample
(min)
RT reference
standard (min)
RT, MS1 and
MS2 Confirmed
7-Nitroindole 6960-42-5 16.19 18.70 no
6-Nitroindole 4769-96-4 16.19 18.28 no
5-Nitroindole 6146-52-7 16.19 17.49 no
4-Nitroindole 4769-97-5 16.19 17.06 no
3-Nitroindole 4770-03-0 16.19 16.18 yes
The identity of 3-nitroindole was unambiguously confirmed as one of the N-DBPs being
formed after tryptophan MP UV irradiation. The retention time and MS2 spectrum of the Trp
+ 14NO3- MP UV sample matches exactly with that of the 3-nitroindole reference standard (see
figure 8).
15.0 15.5 16.0 16.5 17.0 17.5Time (min)
0
1000
2000
3000
4000
5000
6000
7000
8000
9000
10000
11000
1200016.19
15.0 15.5 16.0 16.5 17.0 17.5Time (min)
0.0e0
2.0e5
4.0e5
6.0e5
8.0e5
1.0e6
1.2e6
1.4e6
1.6e6
1.8e616.18
50 60 70 80 90 100 110 120 130 140 150 160 170m/z
0
100
200
300
400
500
600
700
161.0347
131.0365115.0417
50 60 70 80 90 100 110 120 130 140 150 160 170m/z
0100020003000400050006000700080009000
1000011000120001300014000
161.0359
131.0375
115.0425
Inte
nsity
Inte
nsi
ty
Inte
nsit
yIn
ten
sity
A)
B)
C)
D)
Figure 8: Confirmation of 3-nitroindole. A) EIC of 3-nitroindole (m/z 161.0360) in Trp + 14NO3- MP UV
sample. B) EIC of 3-nitroindole reference standard (m/z 161.0360). C) MS2 spectrum of 3-nitroindole in
Trp + 14NO3- MP UV sample. D) MS2 spectrum of 3-nitroindole reference standard.
BTO 2018.035 | March 2018 22 Aromatic amino acids as a source for nitrogen containing by-products formed by
advanced oxidation water treatment
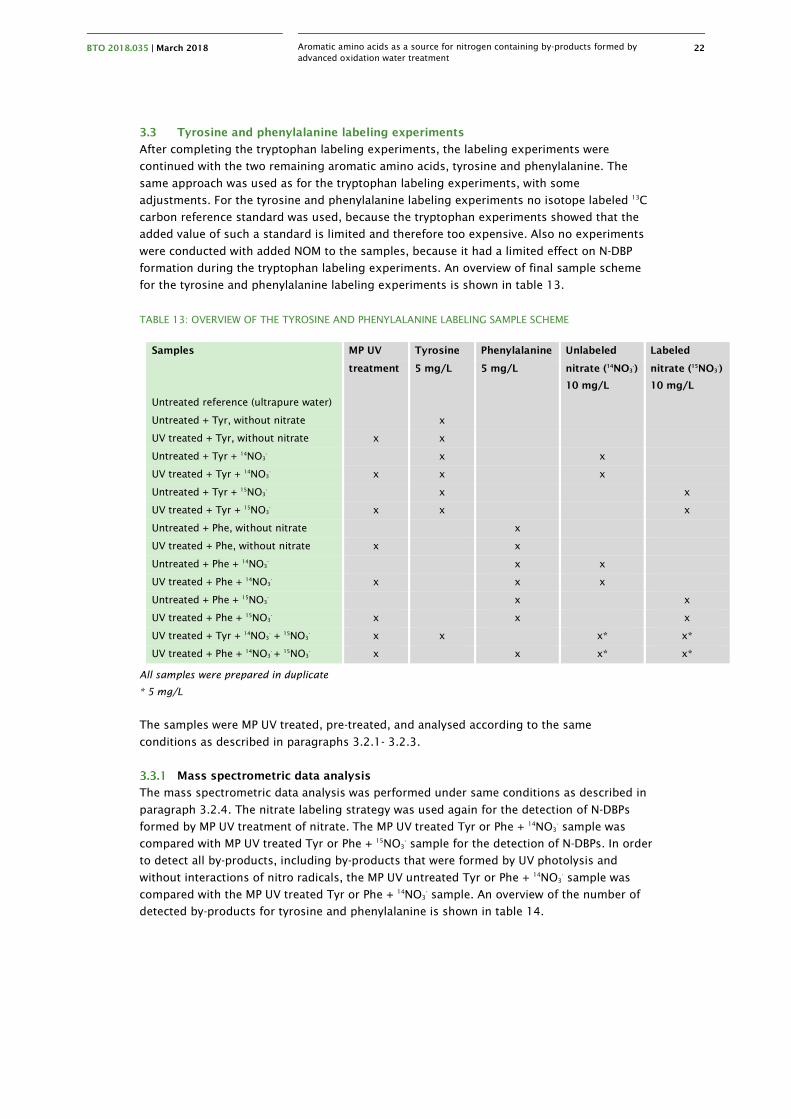
3.3 Tyrosine and phenylalanine labeling experiments
After completing the tryptophan labeling experiments, the labeling experiments were
continued with the two remaining aromatic amino acids, tyrosine and phenylalanine. The
same approach was used as for the tryptophan labeling experiments, with some
adjustments. For the tyrosine and phenylalanine labeling experiments no isotope labeled 13C
carbon reference standard was used, because the tryptophan experiments showed that the
added value of such a standard is limited and therefore too expensive. Also no experiments
were conducted with added NOM to the samples, because it had a limited effect on N-DBP
formation during the tryptophan labeling experiments. An overview of final sample scheme
for the tyrosine and phenylalanine labeling experiments is shown in table 13.
TABLE 13: OVERVIEW OF THE TYROSINE AND PHENYLALANINE LABELING SAMPLE SCHEME
Samples MP UV Tyrosine Phenylalanine Unlabeled Labeled
treatment 5 mg/L 5 mg/L nitrate (14NO3-)
10 mg/L
nitrate (15NO3-)
10 mg/L
Untreated reference (ultrapure water)
Untreated + Tyr, without nitrate x
UV treated + Tyr, without nitrate x x
Untreated + Tyr + 14NO3- x x
UV treated + Tyr + 14NO3- x x x
Untreated + Tyr + 15NO3- x x
UV treated + Tyr + 15NO3- x x x
Untreated + Phe, without nitrate x
UV treated + Phe, without nitrate x x
Untreated + Phe + 14NO3- x x
UV treated + Phe + 14NO3- x x x
Untreated + Phe + 15NO3- x x
UV treated + Phe + 15NO3- x x x
UV treated + Tyr + 14NO3- + 15NO3
- x x x* x*
UV treated + Phe + 14NO3- + 15NO3
- x x x* x*
All samples were prepared in duplicate
* 5 mg/L
The samples were MP UV treated, pre-treated, and analysed according to the same
conditions as described in paragraphs 3.2.1- 3.2.3.
Mass spectrometric data analysis
The mass spectrometric data analysis was performed under same conditions as described in
paragraph 3.2.4. The nitrate labeling strategy was used again for the detection of N-DBPs
formed by MP UV treatment of nitrate. The MP UV treated Tyr or Phe + 14NO3- sample was
compared with MP UV treated Tyr or Phe + 15NO3- sample for the detection of N-DBPs. In order
to detect all by-products, including by-products that were formed by UV photolysis and
without interactions of nitro radicals, the MP UV untreated Tyr or Phe + 14NO3- sample was
compared with the MP UV treated Tyr or Phe + 14NO3- sample. An overview of the number of
detected by-products for tyrosine and phenylalanine is shown in table 14.
BTO 2018.035 | March 2018 23 Aromatic amino acids as a source for nitrogen containing by-products formed by
advanced oxidation water treatment
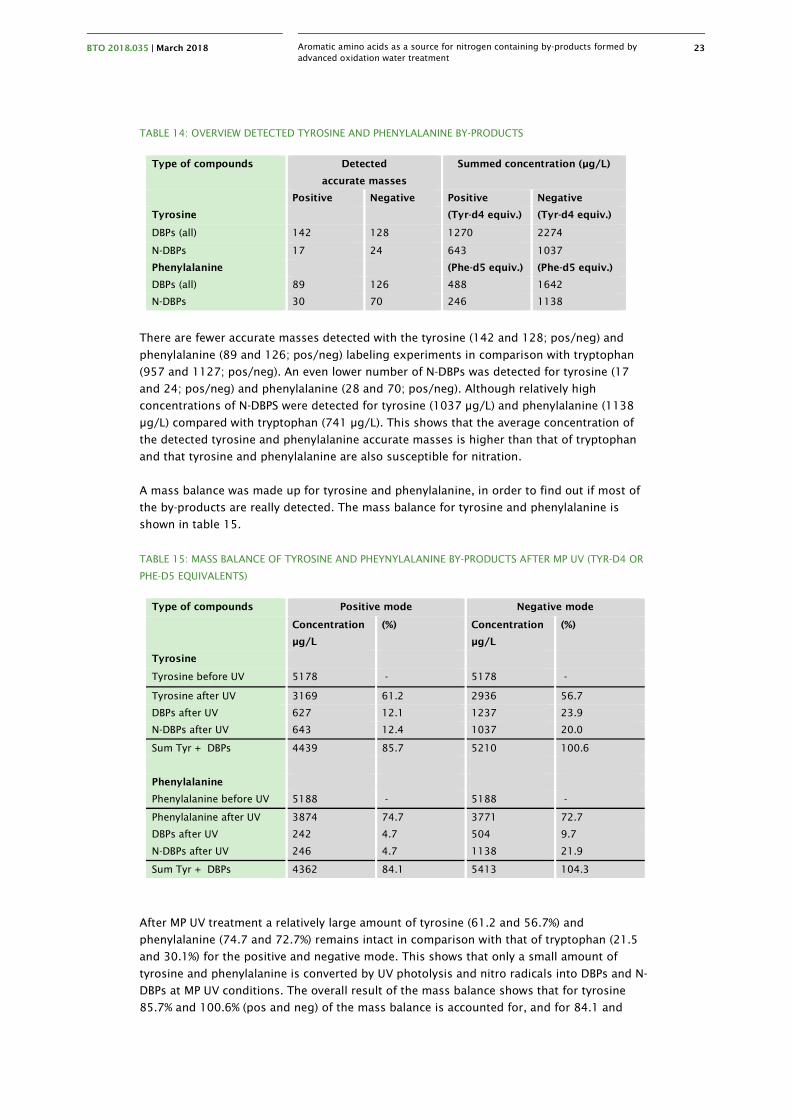
TABLE 14: OVERVIEW DETECTED TYROSINE AND PHENYLALANINE BY-PRODUCTS
Type of compounds Detected
accurate masses
Summed concentration (µg/L)
Positive Negative Positive Negative
Tyrosine (Tyr-d4 equiv.) (Tyr-d4 equiv.)
DBPs (all) 142 128 1270 2274
N-DBPs 17 24 643 1037
Phenylalanine (Phe-d5 equiv.) (Phe-d5 equiv.)
DBPs (all) 89 126 488 1642
N-DBPs 30 70 246 1138
There are fewer accurate masses detected with the tyrosine (142 and 128; pos/neg) and
phenylalanine (89 and 126; pos/neg) labeling experiments in comparison with tryptophan
(957 and 1127; pos/neg). An even lower number of N-DBPs was detected for tyrosine (17
and 24; pos/neg) and phenylalanine (28 and 70; pos/neg). Although relatively high
concentrations of N-DBPS were detected for tyrosine (1037 µg/L) and phenylalanine (1138
µg/L) compared with tryptophan (741 µg/L). This shows that the average concentration of
the detected tyrosine and phenylalanine accurate masses is higher than that of tryptophan
and that tyrosine and phenylalanine are also susceptible for nitration.
A mass balance was made up for tyrosine and phenylalanine, in order to find out if most of
the by-products are really detected. The mass balance for tyrosine and phenylalanine is
shown in table 15.
TABLE 15: MASS BALANCE OF TYROSINE AND PHEYNYLALANINE BY-PRODUCTS AFTER MP UV (TYR-D4 OR
PHE-D5 EQUIVALENTS)
Type of compounds Positive mode Negative mode
Concentration
µg/L
(%) Concentration
µg/L
(%)
Tyrosine
Tyrosine before UV 5178 - 5178 -
Tyrosine after UV 3169 61.2 2936 56.7
DBPs after UV 627 12.1 1237 23.9
N-DBPs after UV 643 12.4 1037 20.0
Sum Tyr + DBPs 4439 85.7 5210 100.6
Phenylalanine
Phenylalanine before UV 5188 - 5188 -
Phenylalanine after UV 3874 74.7 3771 72.7
DBPs after UV 242 4.7 504 9.7
N-DBPs after UV 246 4.7 1138 21.9
Sum Tyr + DBPs 4362 84.1 5413 104.3
After MP UV treatment a relatively large amount of tyrosine (61.2 and 56.7%) and
phenylalanine (74.7 and 72.7%) remains intact in comparison with that of tryptophan (21.5
and 30.1%) for the positive and negative mode. This shows that only a small amount of
tyrosine and phenylalanine is converted by UV photolysis and nitro radicals into DBPs and N-
DBPs at MP UV conditions. The overall result of the mass balance shows that for tyrosine
85.7% and 100.6% (pos and neg) of the mass balance is accounted for, and for 84.1 and
BTO 2018.035 | March 2018 24 Aromatic amino acids as a source for nitrogen containing by-products formed by
advanced oxidation water treatment
104.3% (pos and neg) for phenylalanine. This means that most of the by-products are
detected. The mass balance results in the negative mode are greater than 100%, which can
be explained by that some fragments and adducts are also included in the detection of the
by-products. And because the ionisation efficiency is different for each by-product, resulting
in less reliable concentrations.
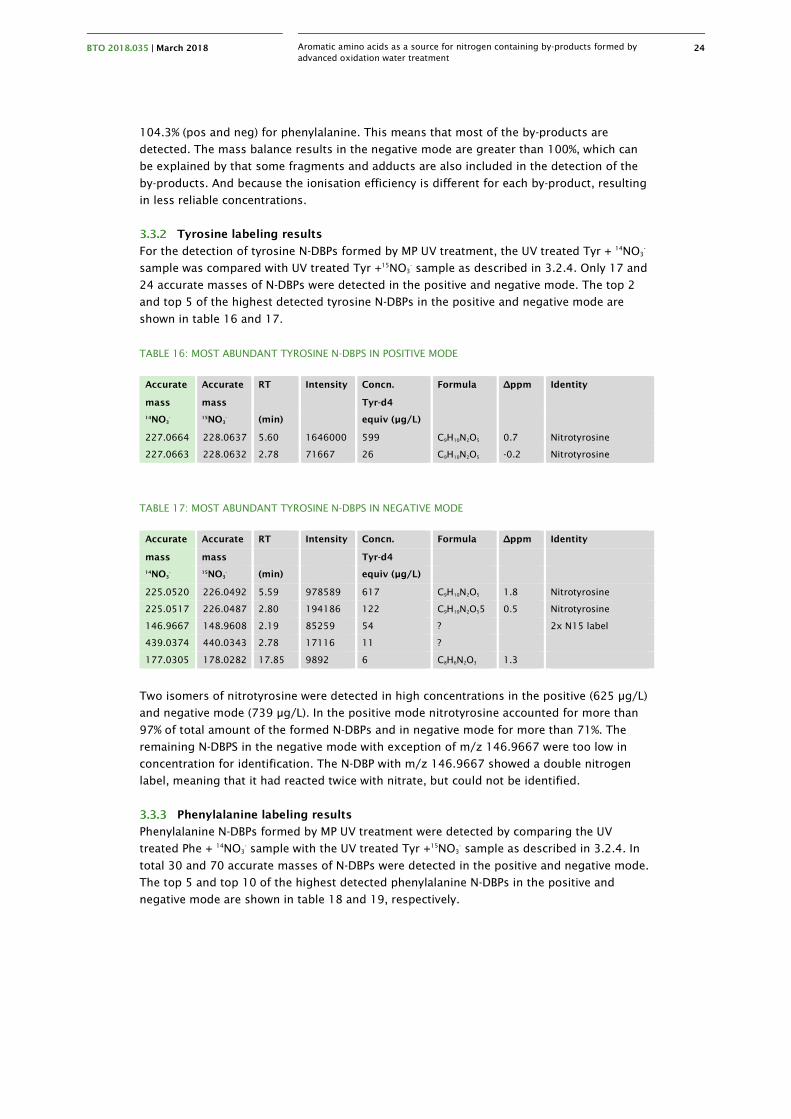
Tyrosine labeling results
For the detection of tyrosine N-DBPs formed by MP UV treatment, the UV treated Tyr + 14NO3-
sample was compared with UV treated Tyr +15NO3- sample as described in 3.2.4. Only 17 and
24 accurate masses of N-DBPs were detected in the positive and negative mode. The top 2
and top 5 of the highest detected tyrosine N-DBPs in the positive and negative mode are
shown in table 16 and 17.
TABLE 16: MOST ABUNDANT TYROSINE N-DBPS IN POSITIVE MODE
Accurate Accurate RT Intensity Concn. Formula ∆ppm Identity
mass mass Tyr-d4
14NO3- 15NO3
- (min) equiv (µg/L)
227.0664 228.0637 5.60 1646000 599 C9H10N2O5 0.7 Nitrotyrosine
227.0663 228.0632 2.78 71667 26 C9H10N2O5 -0.2 Nitrotyrosine
TABLE 17: MOST ABUNDANT TYROSINE N-DBPS IN NEGATIVE MODE
Accurate Accurate RT Intensity Concn. Formula ∆ppm Identity
mass mass Tyr-d4
14NO3- 15NO3
- (min) equiv (µg/L)
225.0520 226.0492 5.59 978589 617 C9H10N2O5 1.8 Nitrotyrosine
225.0517 226.0487 2.80 194186 122 C9H10N2O55 0.5 Nitrotyrosine
146.9667 148.9608 2.19 85259 54 ? 2x N15 label
439.0374 440.0343 2.78 17116 11 ?
177.0305 178.0282 17.85 9892 6 C8H6N2O3 1.3
Two isomers of nitrotyrosine were detected in high concentrations in the positive (625 µg/L)
and negative mode (739 µg/L). In the positive mode nitrotyrosine accounted for more than
97% of total amount of the formed N-DBPs and in negative mode for more than 71%. The
remaining N-DBPS in the negative mode with exception of m/z 146.9667 were too low in
concentration for identification. The N-DBP with m/z 146.9667 showed a double nitrogen
label, meaning that it had reacted twice with nitrate, but could not be identified.
Phenylalanine labeling results
Phenylalanine N-DBPs formed by MP UV treatment were detected by comparing the UV
treated Phe + 14NO3- sample with the UV treated Tyr +15NO3
- sample as described in 3.2.4. In
total 30 and 70 accurate masses of N-DBPs were detected in the positive and negative mode.
The top 5 and top 10 of the highest detected phenylalanine N-DBPs in the positive and
negative mode are shown in table 18 and 19, respectively.

BTO 2018.035 | March 2018 25 Aromatic amino acids as a source for nitrogen containing by-products formed by
advanced oxidation water treatment
TABLE 18: MOST ABUNDANT PHENYLALANINE N-DBPS IN POSITIVE MODE
Accurate Accurate RT Intensity Concn. Formula ∆ppm Identity
mass mass Phe-d5
14NO3- 15NO3
- (min) equiv (µg/L)
227.0666 228.0635 5.60 479466 67 C9H10N2O5 1.1 Nitrotyrosine
227.0665 228.0635 6.09 438853 61 C9H10N2O5 0.8 nitro-hydroxyphenylalanine
227.0664 228.0635 6.39 417768 58 C9H10N2O5 0.7 nitro-hydroxyphenylalanine
227.0664 228.0635 5.90 141834 20 C9H10N2O5 0.7 nitro-hydroxyphenylalanine
227.0664 228.0633 3.93 53856 8 C9H10N2O5 0.7 nitro-hydroxyphenylalanine
TABLE 19: MOST ABUNDANT PHENYLALANINE N-DBPS IN NEGATIVE MODE
Accurate Accurate RT Intensity Concn. Formula ∆ppm Identity
mass mass Phe-d5
14NO3- 15NO3
- (min) equiv (µg/L)
225.0519 226.0489 6.09 390075 148 C9H10N2O5 0.5 nitro-hydroxyphenylalanine
225.0517 226.0490 5.60 353717 134 C9H10N2O5 0.0 Nitrotyrosine
222.0156 224.0097 18.45 322402 122 C8H5O5N3 0.7 2x N15 label
225.0519 226.0488 6.39 280288 106 C9H10N2O5 0.0 nitro-hydroxyphenylalanine
222.0156 224.0097 17.79 279937 106 C8H5O5N3 -0.2 2x N15 label
267.0005 506.0145 17.31 128372 49 C8H4N4O7 -0.8 3x N15 label
177.0311 178.0279 17.23 99836 38 C8H6N2O3 2.5 nitrooxindole?
504.0208 506.0145 6.08 95040 36 ? 2x N15 label
436.0008 437.9951 17.79 89085 34 ? 2x N15 label
177.0311 178.0279 14.72 86245 33 C8H6N2O3 3.0
391.0165 392.0135 14.72 78018 30 ?
243.8992 244.8901 2.29 73738 28 ?
257.0410 258.0384 5.47 71785 27 C9H10N2O7 -1.3
168.0305 169.0274 10.31 52166 20 C7H7NO4 1.0
208.0250 209.0223 5.91 48094 18 C9H7NO5 0.5
Nitrotyrosine and the structural isomer nitro-hydroxyphenylalanine were detected in high
concentrations in the positive and negative mode. In the positive mode, nitrotyrosine and
nitro-hydroxyphenylalanines together account for more than 86% of the concentration of
detected by-products. In the negative mode this accounts only for less than 36% and many
other by-products are also detected. For the negative detected phenylalanine by-products, it
is striking that four by-products are detected with a double nitrogen label and even one with
a triple nitrogen label (see figure 9 for the mass spectrum of m/z 267.0005, containing a
triple nitrogen label). This shows that phenylalanine is very susceptible for double or even
triple nitration.

BTO 2018.035 | March 2018 26 Aromatic amino acids as a source for nitrogen containing by-products formed by
advanced oxidation water treatment
265.0 266.0 267.0 268.0 269.0 270.0 271.00
1000
2000
3000
4000
5000
1x14N + 2x15N268.99492x14N + 1x15N
267.9976
3x15N269.9934
3x14N267.0003
265.0 266.0 267.0 268.0 269.0 270.0 271.00
4000
8000
12000
16000
3x15N269.9917
265.0 266.0 267.0 268.0 269.0 270.0 271.00
4000
8000
12000
16000
3x14N267.0005
m/z
m/z
m/z
Inte
nsi
tyIn
tensity
Inte
nsi
tyA) Phe + 14NO3
- + MP UV
B) Phe + 15NO3- + MP UV
C) Phe + 14NO3- + 15NO3
- + MP UV
Figure 9: Mass spectra of N-DBP m/z 267.005 in various samples showing different 14N and 15N labels.
A) Mass spectrum of Phe + 14NO3- + MP UV sample, showing a triple 14N label. B) Mass spectrum of Phe +
15NO3- + MP UV sample, showing a triple 15N label. C) Mass spectrum of Phe +14NO3
- + 15NO3- + MP UV
sample, showing a triple 14N, double 14N + single 15N, single 14N + double 15N and triple 15N label.
Suspect screening of 84 N-DBPs
After the tyrosine and phenylalanine experiments a suspect screening was performed using
the 84 N-DBPs detected in previous study (see attachment III for the list). The suspect
screening was performed on the MP UV treated Phe + 14NO3- and MP UV treated Phe + 15NO3
-
sample. The suspect screening was performed as described in 3.2.7. See table 20 for the
results of the suspect screening.
TABLE 20: RESULTS SUSPECT SCREENING OF THE MOST ABUNDANT PHENYLALANINE N-DBPS IN THE
ARTIFICAL WATER SAMPLE OF THE PRIOR STUDY
Accurate RT Intensity Concn. Formula RT RT, MS1 and
mass Phe-d5 Original 14NO3- MS2 Confirmed
14NO3- (min) equiv (µg/L) sample (min)
222.0156 18.45 322402 122 C8H5O5N3 18.42 yes
222.0156 17.79 279937 106 C8H5O5N3 17.76 yes
With the suspect screening there were no tyrosine N-DBPs detected in the original 14NO3-
artificial water sample in the positive and negative mode and for phenylalanine no N-DBPs
were detected in the positive mode. For phenylalanine in the negative mode, two by-products
with m/z 222.0156 (isomers) were detected and confirmed in the original 14NO3- artificial
water sample by matching retention time and MS/MS spectrum (see figure 10), but these
were not detected in the full-scale water treatment sample. This shows once again that
aromatic amino acids could potentially be the source of some of the by-products detected in
the prior study.

BTO 2018.035 | March 2018 27 Aromatic amino acids as a source for nitrogen containing by-products formed by
advanced oxidation water treatment
Of the most abundant 15 by-products formed by the MP UV phenylalanine labeling
experiments, only number 3 and 5 (both m/z 222.0156) corresponded with the list of
suspects. As before with the tryptophan labeling experiments, this could mean that the other
by-products are not formed during the MP UV irradiation of artificial water or that these by-
products are not sufficiently extracted from the water. This will be further investigated in
3.4.
16.5 17.0 17.5 18.0 18.5 19.0 19.5Time (min)
0
2000
4000
6000
8000
10000
12000
14000
16000
18000
20000
18.42
17.76
Inte
nsity
B)
16.5 17.0 17.5 18.0 18.5 19.0 19.5Time (min)
0.0e0
5.0e4
1.0e5
1.5e5
2.0e5
2.5e5
3.0e518.45
17.79A)
60 80 100 120 140 160 180 200 220m/z
0
500
1000
1500
2000
2500
3000
3500
4000205.0128
222.0159
103.0300175.0144
131.0244115.0297
C)
60 80 100 120 140 160 180 200 220m/z
0
10
20
30
40
50
205.0120
222.0151
175.0152103.0310
131.0226115.0296
D)
60 80 100 120 140 160 180 200 220m/z
0
50
100
150
200
250
300
350
400
450222.0137
205.0124
146.0242162.0186
117.0185 175.0138192.0162106.0161
90.0358
F)
60 80 100 120 140 160 180 200 220m/z
0
500
1000
1500
2000
2500
3000
3500
4000
222.0166
205.0131
146.024690.0351162.0196
175.0148
117.0223 192.0183106.0172
Inte
nsity
E)
Inte
nsity
Inte
nsity
Inte
nsity
Figure 10: confirmation of N-DBP m/z 222.0156 (2 isomers) in artificial water. A) EIC of m/z 222.0156 (2
isomers) in Phe + 14NO3- after MP UV sample. B) EIC of m/z 222.0156 in artificial water after MP UV. C) MS2
spectrum at RT 17.79 of m/z 222.0156 in Phe + 14NO3_ after MP UV sample. D) MS2 spectrum at RT 17.76 of m/z
222.0156 in artificial water after MP UV. E) MS2 spectrum at RT 18.45 of m/z 222.0156 in Phe + 14NO3_ after MP
UV sample. F) MS2 spectrum at RT 18.42 of m/z 222.0156 in artificial water after MP UV.
Identification of m/z 222.0156
The identification of the two isomers with m/z 222.0156 (C8H5N3O5) containing both a
double nitrogen label started by annotating the MS/MS spectrum and searching for known
losses (See attachment IV for the annotated MS/MS spectra). This showed mainly losses of
NO and OH, meaning that there are probably nitro and hydroxyl functional groups present in
the by-products. Next the formula of the by-products (C8H5N3O5) was compared with that of
phenylalanine (C9H11NO2). This showed there was a loss of one carbon and at least one
oxygen (assuming that the by-product was double nitrated, and also alcohol oxidation had
occurred), indicating that the polar acidic functional group of the amino acid was probably
lost during formation of the by-product. This is also supported by the observed retention
time (17.79 and 18.45 min) of both by-products in comparison with that of phenylalanine
(4.65 min), which means that the by-products are less polar than the parent compound. The
by-products are expected to consist of a benzene ring containing two nitro and one hydroxy
functional group and also containing the remainder of the amine part of the amino acid
(C2HxN). Then a ChemSpider and PubChem database search was performed using the formula
of the by-products which resulted in 37 and 65 hits. The structures of these possible
candidates were thoroughly investigated and finally one good candidate was found: 3,5-
Dinitro-4-hydroxy-benzylcyanid (see figure 11). There were no other structural isomers in
the ChemSpider and Pubchem database, although there are many more structural isomers
possible. The only candidate was checked by computational (in silico) ms/ms fragmentation
using MetFrag [32], in which the computational MS/MS spectrum was compared with the
measured MS/MS spectrum and showed a decent match (8 of 13 fragments explained) with

BTO 2018.035 | March 2018 28 Aromatic amino acids as a source for nitrogen containing by-products formed by
advanced oxidation water treatment
the by-product detected at 18.45min. Unfortunately this candidate was not available for
purchase, and remains therefore unconfirmed. There are many structural isomers possible
for this structure, so synthesis is not option. The only option that remains for identification
is using nuclear magnetic resonance (NMR), but that falls beyond the scope of this study.
Figure 11: structure of 3,5-dinitro-4-hydroxy-benzylcyanid (CAS nr. 55770-69-9)
The basic structure of this by-product is benzyl cyanide, which is a known toxic compound
for which an oral LD50 in mouse was derived at 45.5 mg/kg [33]. Furthermore, Ma et al [34]
demonstrated that benzyl cyanide is the major by-product of phenylalanine chlorination in
drinking water. This means that it is a possibility that the detected by-product with m/z
222.0156 really could be a derivative from benzyl cyanide and makes this by-product
interesting for further research.
3.4 SPE experiments of tryptophan and phenylalanine by-products
A total of three N-DBPs were detected with the tryptophan and phenylalanine MP UV labeling
experiments that were also present in the artificial water sample of the prior study, meaning
that these by-products in the artificial water sample potentially could originate from aromatic
amino acids. However of the top 15 by-products detected with the tryptophan and
phenylalanine labeling experiments, only these three by-products (i.e. 3-nitroindole and two
isomers with m/z 222.0156) were detected in the artificial water sample, of which 3-
nitroindole is a relatively low intensity N-DBP (nr 12). This would imply that other by-
products of the top 15 are not formed by MP UV treatment of artificial water, which makes it
more likely that the three detected by-products could originate from other sources than from
aromatic amino acids. Alternatively, it might be that these other by-products are formed, but
are not sufficiently extracted from the water using the AMES pre-treatment protocol, which
was used as sample pre-treatment in the prior study for the artificial water sample. In order
to investigate if the detected N-DBPs really originate of tryptophan or phenylalanine, SPE
experiments were conducted according to the AMES pre-treatment protocol to determine the
extraction recovery of the top 15 detected N-DBPs.
For the SPE experiments the same samples were used as for the aromatic amino acids
labeling experiments, using the AMES SPE pre-treatment protocol for determining the
recovery of the by-products. All samples for the labeling experiments were stored in the
freezer at -25oC to reduce the risk of degradation. The following samples were used for the
SPE experiment in duplo: UV treated + Trp + 14NO3- sample, UV treated + Phe + 14NO3
- sample
and an ultrapure water sample (blank). In order to compare the by-products in the samples
after the AMES SPE pre-treatment with the samples that were not pre-treated, the final SPE
extracts were diluted again with ultrapure water so that effectively no sample enrichment
had occurred. In this way, a fair comparison could be made between the samples with and
without sample pre-treatment in order to determine the recovery of the by-products. See
attachment V for the applied conditions for the tryptophan and phenylalanine by-products
SPE experiment.

BTO 2018.035 | March 2018 29 Aromatic amino acids as a source for nitrogen containing by-products formed by
advanced oxidation water treatment
Results of SPE experiments
Because quantification of by-products is not possible without knowing their identity, the
recovery was calculated using the intensity of the by-products. The intensity of the by-
products in the samples that were not pre-treated was compared with intensity of the by-
products after SPE treatment, making it possible to calculate the recovery. The recoveries of
the top 15 by-products of tryptophan and phenylalanine are shown in figure 12 and 13.
Figure 12: Recoveries of tryptophan by-products in SPE treated samples. Recoveries were calculated as
the ratios of intensities of each N-DBP after and before pre-treatment. By-product 3-nitroindole indicated
in blue. The dashed line represents the intensity of the by-products when no sample pre-treatment is
applied (direct injection)
Figure 13: Recoveries of phenylalanine by-products in SPE treated samples. Recoveries were calculated as
the ratios of intensities of each N-DBP after and before pre-treatment. The two isomers with m/z
222.0516 are indicated in blue. The dashed line represents the intensity of the by-products when no
sample pre-treatment is applied (direct injection).
The results of the SPE recovery experiment for tryptophan by-products show that there are
six by-products with poor recoveries (< 20%) while the other nine by-products have a
moderate to good recoveries (41 – 134%), including 3-nitroindole (108%). Of those nine by-
0
50000
100000
150000
200000
250000
300000
0
20
40
60
80
100
120
140
Inte
nsi
ty
reco
very
(%
)
Mass (m/z)
0
50000
100000
150000
200000
250000
300000
350000
400000
450000
0
20
40
60
80
100
120In
ten
sity
Re
cove
ry (
%)
Mass (m/z)

BTO 2018.035 | March 2018 30 Aromatic amino acids as a source for nitrogen containing by-products formed by
advanced oxidation water treatment
products only the low intensity by-product 3-nitroindole was detected in the artificial water
of the prior study. This implies that it is quite unlikely that 3-nitroindole present in the
artificial water sample is a MP UV by-product of tryptophan. It is more probable that the 3-
nitroindole in the artificial water sample originates from another source. Using a
retrospective suspect screening it was determined that unnitrated indole is not the source.
The SPE recovery results for the phenylalanine by-products show that there are seven by-
products with poor recoveries (< 25%) and eight others with good recoveries (84 – 114),
including the two unidentified isomers with m/z 222.0156. Of those eight by-products,
initially only the two isomers with m/z 222.0156 were detected in the artificial water sample
of the prior study. However, a suspect screening conducted at a very low intensity also
revealed the presence of two isomers with m/z 177.0311(of the top 15) in the artificial water
samples, just barely above the detection limit (s/n > 3). This means that four of the eight by-
products with a good SPE recovery are present in the artificial water sample. This result
makes it quite probable that the two unidentified isomers with m/z 222.0156 present in the
artificial water sample are really MP UV by-products of phenylalanine and shows that
aromatic amino acids can be responsible for the formation for some of the N-DBPs formed by
MP UV treatment of artificial water.
3.5 Conclusion labeling experiments
It was shown that the labeling strategy involving nitrate, aromatic amino acids and MP UV
worked. Many by-products were detected using this strategy. For tryptophan, one by-product
was detected in the artificial water sample of the prior study and was identified as 3-
nitroindole. However, other high intensity tryptophan by-products were not detected in the
artificial water, meaning that it is quite likely that the 3-nitroindole in the artificial water
sample does not originate from tryptophan, but from another source.
For phenylalanine, two unidentified by-products with m/z 222.0156 (isomers) were initially
detected in the artificial water sample of the prior study. Two other phenylalanine by-
products with m/z 177.0311 (isomers) were detected at a very low intensity in the artificial
water, meaning that four of the eight by-products with a good recovery are detected in the
artificial water sample. This makes it quite probable that the two unidentified isomers with
m/z 222.0156 present in the artificial water sample are really MP UV by-products of
phenylalanine, and shows that aromatic amino acids are probably responsible for some of
the N-DBPs formed by MP UV treatment of artificial water.
None of the tryptophan and phenylalanine by-products were detected in the full-scale MP UV
water treatment sample of the prior study. This could mean that the concentration of
aromatic amino acids in Lake IJssel is just too low in order to detect their by-products. This is
supported in chapter 2, in which the detected the concentrations of tryptophan and
phenylalanine were 6 and 9 times lower in Lake IJssel in comparison with artificial water. This
makes the detected by-products of tryptophan and phenylalanine less relevant for further
research.
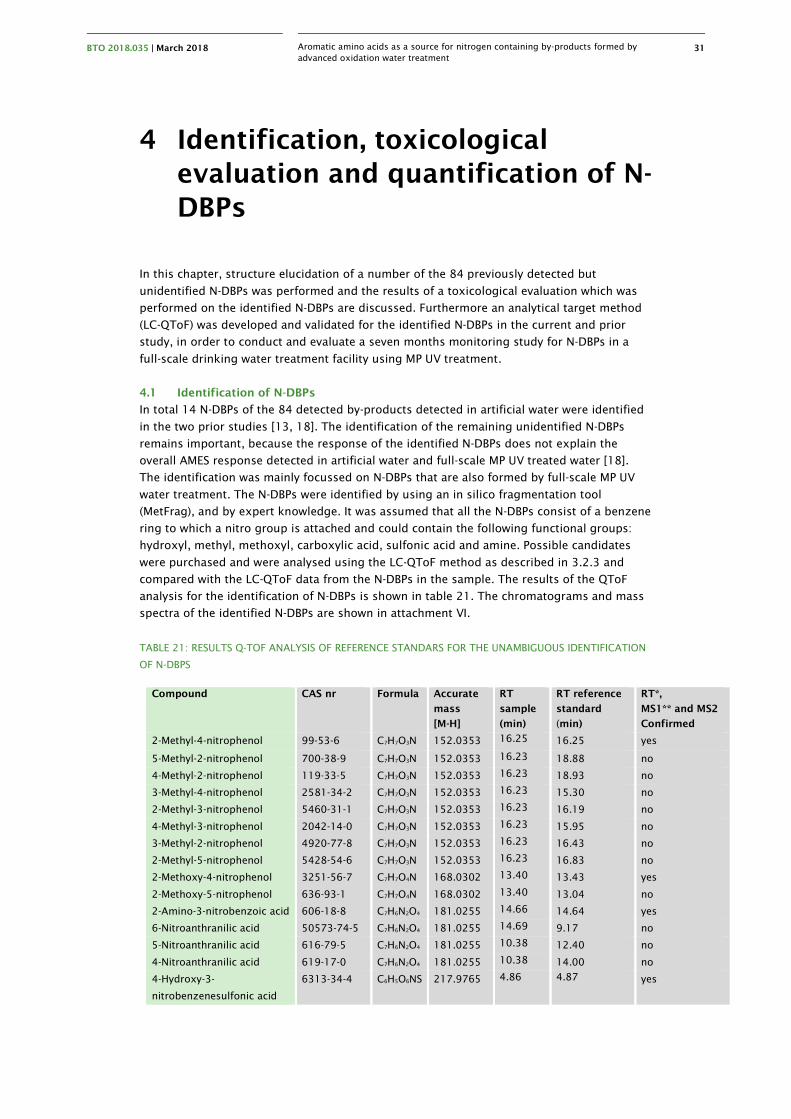
BTO 2018.035 | March 2018 31 Aromatic amino acids as a source for nitrogen containing by-products formed by
advanced oxidation water treatment
4 Identification, toxicological
evaluation and quantification of N-
DBPs
In this chapter, structure elucidation of a number of the 84 previously detected but
unidentified N-DBPs was performed and the results of a toxicological evaluation which was
performed on the identified N-DBPs are discussed. Furthermore an analytical target method
(LC-QToF) was developed and validated for the identified N-DBPs in the current and prior
study, in order to conduct and evaluate a seven months monitoring study for N-DBPs in a
full-scale drinking water treatment facility using MP UV treatment.
4.1 Identification of N-DBPs
In total 14 N-DBPs of the 84 detected by-products detected in artificial water were identified
in the two prior studies [13, 18]. The identification of the remaining unidentified N-DBPs
remains important, because the response of the identified N-DBPs does not explain the
overall AMES response detected in artificial water and full-scale MP UV treated water [18].
The identification was mainly focussed on N-DBPs that are also formed by full-scale MP UV
water treatment. The N-DBPs were identified by using an in silico fragmentation tool
(MetFrag), and by expert knowledge. It was assumed that all the N-DBPs consist of a benzene
ring to which a nitro group is attached and could contain the following functional groups:
hydroxyl, methyl, methoxyl, carboxylic acid, sulfonic acid and amine. Possible candidates
were purchased and were analysed using the LC-QToF method as described in 3.2.3 and
compared with the LC-QToF data from the N-DBPs in the sample. The results of the QToF
analysis for the identification of N-DBPs is shown in table 21. The chromatograms and mass
spectra of the identified N-DBPs are shown in attachment VI.
TABLE 21: RESULTS Q-TOF ANALYSIS OF REFERENCE STANDARS FOR THE UNAMBIGUOUS IDENTIFICATION
OF N-DBPS
Compound CAS nr Formula Accurate
mass
[M-H]
RT
sample
(min)
RT reference
standard
(min)
RT*,
MS1** and MS2
Confirmed
2-Methyl-4-nitrophenol 99-53-6 C7H7O3N 152.0353 16.25 16.25 yes
5-Methyl-2-nitrophenol 700-38-9 C7H7O3N 152.0353 16.23 18.88 no
4-Methyl-2-nitrophenol 119-33-5 C7H7O3N 152.0353 16.23 18.93 no
3-Methyl-4-nitrophenol 2581-34-2 C7H7O3N 152.0353 16.23 15.30 no
2-Methyl-3-nitrophenol 5460-31-1 C7H7O3N 152.0353 16.23 16.19 no
4-Methyl-3-nitrophenol 2042-14-0 C7H7O3N 152.0353 16.23 15.95 no
3-Methyl-2-nitrophenol 4920-77-8 C7H7O3N 152.0353 16.23 16.43 no
2-Methyl-5-nitrophenol 5428-54-6 C7H7O3N 152.0353 16.23 16.83 no
2-Methoxy-4-nitrophenol 3251-56-7 C7H7O4N 168.0302 13.40 13.43 yes
2-Methoxy-5-nitrophenol 636-93-1 C7H7O4N 168.0302 13.40 13.04 no
2-Amino-3-nitrobenzoic acid 606-18-8 C7H6N2O4 181.0255 14.66 14.64 yes
6-Nitroanthranilic acid 50573-74-5 C7H6N2O4 181.0255 14.69 9.17 no
5-Nitroanthranilic acid 616-79-5 C7H6N2O4 181.0255 10.38 12.40 no
4-Nitroanthranilic acid 619-17-0 C7H6N2O4 181.0255 10.38 14.00 no
4-Hydroxy-3-
nitrobenzenesulfonic acid
6313-34-4 C6H5O6NS 217.9765 4.86 4.87 yes

BTO 2018.035 | March 2018 32 Aromatic amino acids as a source for nitrogen containing by-products formed by
advanced oxidation water treatment
* Retention time differs less than 0.10 min relative to the reference standard
** Measured accurate mass falls within a 5 ppm mass range of the theoretical mass
Four N-DBPs were unambiguously identified by analysing the reference standards and
matching the accurate mass, retention time, and MS/MS fragmentation spectra of the
reference standard with the N-DBPs detected in the artificial water sample. The identities of
2-metyl-4-nitrophenol, 2-methoxy-4-nitrophenol, 2-amino-3-nitrobenzoic acid and 4-hydroxy-
3-nitrobenzenesulfonic acid were thus confirmed.
4.2 Toxicological evaluation of the identified N-DBPs
Five N-DBPs were newly identified (one in chapter 3 and four in chapter 4) for which it is now
possible to conduct a toxicity evaluation. For the toxicity evaluation the following sources
were consulted:
Organizations: European Food Safety Authority (EFSA), European Chemicals Agency
(ECHA), US Environmental Protection Agency (EPA), Food and Drug Administration,
and Dutch National Institute for Environment and Health (RIVM);
Toxicological meta-databases: International Toxicity Estimates for Risk (ITER)
comprising data from the WHO International Programme on Chemical Safety (IPCS),
U.S. EPA, Agency for Toxic Substances and Disease Registry (ATSDR), Health Canada,
International Agency for Research on Cancer (IARC), en RIVM; TOXNET; and the OECD
eChemPortal linking to e.g. ACToR, ECHA, HSDB, INCHEM, UNEP and IRIS;
OECD QSAR Toolbox v3.4.0.17 software.
For none of the substances, toxicological study results or human health risk assessments
were retrieved from any of the information sources. Additional literature search by name and
CAS number of all chemicals using PubMed and Scopus resulted in only two publications,
reporting anti-androgenic activity [35] and vasodilating properties [36] of 2-methyl-4-
nitrophenol.
Two chemicals, 2-methyl-4-nitrophenol and 2-methoxy-4-nitrophenol (which is in use as a
hair dye ingredient), are present in the ECHA database. ECHA labeled these chemicals as eye,
skin and respiratory irritants. Both substances have not been REACH registered, but are
listed in the REACH Annex III inventory of indications for hazardous toxicological or
ecotoxicological properties. The REACH inventory and chemical profiling using the OECD
QSAR Toolbox show potential mutagenic and carcinogenic activity for these substances
based on their chemical structure (see Appendix VII). The other substances were not
included in the OECD QSAR Toolbox. Their InChI identifiers were imported for chemical
profiling; structural alerts for mutagenicity and/or carcinogenicity were identified in these
chemicals as well (see Appendix VIII). In addition, the OECD QSAR Toolbox reports structural
alerts for additional endpoints for all substances (Appendix VII and VIII). Read across was
performed to predict mutagenicity, carcinogenicity, and chronic toxicity based on measured
data for identified structural analogues included in the OECD QSAR Toolbox. Table 22
summarizes all findings.

BTO 2018.035 | March 2018 33 Aromatic amino acids as a source for nitrogen containing by-products formed by
advanced oxidation water treatment
TABLE 22: SUMMARY OF TOXICOLOGICAL EVALUATION OF N-DBPS OF WHICH THE IDENTITY WAS
CONFIRMED
Substance Toxicity data Structural alerts Read across
2-Amino-3-nitrobenzoic acid - mutagenicity
carcinogenicity
reproductive and developmental toxicity
positive for in vitro mutagenicity
negative for in vivo genotoxicity
negative for carcinogenicity
3-Nitroindole - mutagenicity
skin sensitization
positive for in vitro mutagenicity
negative for in vivo genotoxicity
negative for carcinogenicity
positive for reproductive toxicity
2-Methyl-4-nitrophenol anti-androgenic
activity
vasodilation
mutagenicity
carcinogenicity
hemolytic anemia & hepatotoxicity
or energy metabolism dysfunction
positive/negative for in vitro mutagenicity
positive for carcinogenicity
positive for developmental toxicity
2-Methoxy-4-nitrophenol
(4-Nitroguaiacol)
- mutagenicity
carcinogenicity
energy metabolism dysfunction
negative for in vitro mutagenicity
positive for carcinogenicity
positive for developmental toxicity
4-Hydroxy-3-
nitrobenzenesulfonic acid
- mutagenicity
estrogen receptor binding
energy metabolism dysfunction
negative for in vitro mutagenicity
Conclusion toxicological evaluation
Because limited toxicity data was available for the toxicological evaluation of the by-products
identified, the prediction of DNA binding and/or genotoxic potential was based on structural
characteristics. For all five N-DBPs the OECD QSAR Toolbox indicated a potential for DNA
binding and mutagenicity, and potential carcinogenicity was indicated for 2-amino-3-
nitrobenzoic acid, 2-methyl-4-nitrophenol and 2-methoxy-4-nitrophenol. Although these
predictions may indicate mutagenic potency, it is not certain that these N-DBPS show a
positive response in the Ames test. Therefore it remains uncertain if the identified N-DBPS
have contributed to the overall Ames response detected in artificial water and full-scale MP
UV treated water in the prior study [13]. In the end, this can be determined by applying the
identified N-DBPs for Ames testing.
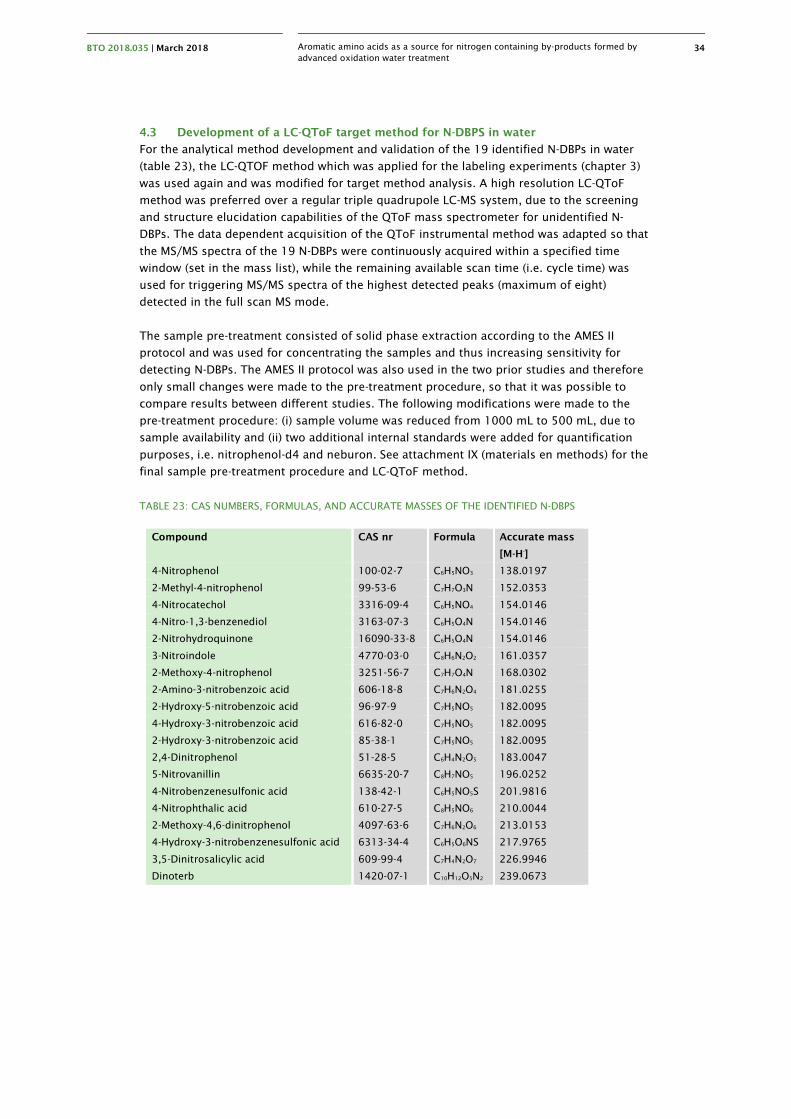
BTO 2018.035 | March 2018 34 Aromatic amino acids as a source for nitrogen containing by-products formed by
advanced oxidation water treatment
4.3 Development of a LC-QToF target method for N-DBPS in water
For the analytical method development and validation of the 19 identified N-DBPs in water
(table 23), the LC-QTOF method which was applied for the labeling experiments (chapter 3)
was used again and was modified for target method analysis. A high resolution LC-QToF
method was preferred over a regular triple quadrupole LC-MS system, due to the screening
and structure elucidation capabilities of the QToF mass spectrometer for unidentified N-
DBPs. The data dependent acquisition of the QToF instrumental method was adapted so that
the MS/MS spectra of the 19 N-DBPs were continuously acquired within a specified time
window (set in the mass list), while the remaining available scan time (i.e. cycle time) was
used for triggering MS/MS spectra of the highest detected peaks (maximum of eight)
detected in the full scan MS mode.
The sample pre-treatment consisted of solid phase extraction according to the AMES II
protocol and was used for concentrating the samples and thus increasing sensitivity for
detecting N-DBPs. The AMES II protocol was also used in the two prior studies and therefore
only small changes were made to the pre-treatment procedure, so that it was possible to
compare results between different studies. The following modifications were made to the
pre-treatment procedure: (i) sample volume was reduced from 1000 mL to 500 mL, due to
sample availability and (ii) two additional internal standards were added for quantification
purposes, i.e. nitrophenol-d4 and neburon. See attachment IX (materials en methods) for the
final sample pre-treatment procedure and LC-QToF method.
TABLE 23: CAS NUMBERS, FORMULAS, AND ACCURATE MASSES OF THE IDENTIFIED N-DBPS
Compound CAS nr Formula Accurate mass
[M-H-]
4-Nitrophenol 100-02-7 C6H5NO3 138.0197
2-Methyl-4-nitrophenol 99-53-6 C7H7O3N 152.0353
4-Nitrocatechol 3316-09-4 C6H5NO4 154.0146
4-Nitro-1,3-benzenediol 3163-07-3 C6H5O4N 154.0146
2-Nitrohydroquinone 16090-33-8 C6H5O4N 154.0146
3-Nitroindole 4770-03-0 C8H6N2O2 161.0357
2-Methoxy-4-nitrophenol 3251-56-7 C7H7O4N 168.0302
2-Amino-3-nitrobenzoic acid 606-18-8 C7H6N2O4 181.0255
2-Hydroxy-5-nitrobenzoic acid 96-97-9 C7H5NO5 182.0095
4-Hydroxy-3-nitrobenzoic acid 616-82-0 C7H5NO5 182.0095
2-Hydroxy-3-nitrobenzoic acid 85-38-1 C7H5NO5 182.0095
2,4-Dinitrophenol 51-28-5 C6H4N2O5 183.0047
5-Nitrovanillin 6635-20-7 C8H7NO5 196.0252
4-Nitrobenzenesulfonic acid 138-42-1 C6H5NO5S 201.9816
4-Nitrophthalic acid 610-27-5 C8H5NO6 210.0044
2-Methoxy-4,6-dinitrophenol 4097-63-6 C7H6N2O6 213.0153
4-Hydroxy-3-nitrobenzenesulfonic acid 6313-34-4 C6H5O6NS 217.9765
3,5-Dinitrosalicylic acid 609-99-4 C7H4N2O7 226.9946
Dinoterb 1420-07-1 C10H12O5N2 239.0673

BTO 2018.035 | March 2018 35 Aromatic amino acids as a source for nitrogen containing by-products formed by
advanced oxidation water treatment
4.4 Method validation in ultrapure water
The developed LC-QToF target method for the determination of 19 N-DBPs in water was
validated in ultrapure water first. The validation was performed including SPE sample pre-
treatment (n=5). The limit of detection (LOD), limit of quantification (LOQ), repeatability,
recovery and instrumental repeatability were determined for all N-DBPs. The instrumental
repeatability was determined by analysing a calibration standard in eightfold (no SPE). The
validation results are shown in table 24.
TABLE 24: SPE VALIDATION RESULTS (N=5) FOR N-DBPS IN ULTRAPURE WATER AND INSTRUMENTAL
REPEATABILITY RESULTS
Compound LOD
(ng/L)
LOQ
(ng/L)
Recovery
25 ng/L
(%)
Repeatability
25 ng/L
(%)
Instrumental
repeatability
25 ng/L
(%) (n=8)
2-Methoxy-4,6-dinitrophenol 0.26 1.0 105.2 2.4 1.6
4-Nitrophenol 1.7 5.0 91.9 3.0 2.0
4-Nitrocatechol 0.89 2.0 82.6* 6.2* 2.5
2-Hydroxy-5-nitrobenzoic acid 0.65 2.0 92.3 0.9 1.4
5-Nitrovanillin 0.36 1.0 100.9 6.5 2.8
4-Nitrophthalic acid 1.01 10 119.5 7.9 1.7
2,4-Dinitrophenol 0.39 1.0 95.5 3.1 2.5
4-Nitro-1,3-benzenediol 0.61 2.0 94.1 2.7 1.7
2-Nitrohydroquinone 1.95 5.0 71.7* 14.5* 3.5
4-Nitrobenzenesulfonic acid 0.69 3.0 24.2 14.1 1.5
4-Hydroxy-3-nitrobenzoic acid 0.42 2.0 109.5 1.9 1.3
2-Hydroxy-3-nitrobenzoic acid 0.66 2.0 88.8 0.9 1.7
Dinoterb 0.64 2.0 94.1 4.4 2.0
3,5-Dinitrosalicylic acid 0.39 3.0 45.2 13.6 2.9
2-Methyl-4-nitrophenol 0.06 1.0 92.1 1.9 1.6
2-Methoxy-4-nitrophenol 1.33 3.0 95.2 2.7 2.5
4-Hydroxy-3-
nitrobenzenesulfonic acid
0.43 2.0 26.2 6.2 1.6
2-Amino-3-nitrobenzoic acid 0.84 2.0 92.1 2.2 2.2
3-Nitroindole 0.33 2.0 90.2 1.7 1.2
* n=4
Satisfactory LOD and LOQ results were obtained for all N-DBPs in ultrapure water, resulting in
a LOQ between 1.0 – 10 ng/L in ultrapure water. The recoveries for most N-DBPs are between
71.1 – 119.5 % and are within acceptable range, except for 4-nitrobenzenesulfonic acid, 4-
hydroxy-3-nitrobenzenesulfonic acid and 3,5-dinitrosalicylic acid which have a recovery of
24.2, 26.2 and 45.2%, respectively. The repeatability for all compounds is lower than 15%
and is satisfactory. The instrumental repeatability is good and for all N-DBPs lower than 3.6%.
The low recovery for 4-nitrobenzenesulfonic acid and 4-hydroxy-3-nitrobenzenesulfonic acid
was expected in advance, due to hydrophilic nature (logP = -1.35 and -1.25) of both
compounds and therefore limited retention was expected with the applied SPE cartridge. In
the end, good validation results are obtained for ultrapure water which can be used to
compare to the validation results in drinking- and surface water (4.4.1).

BTO 2018.035 | March 2018 36 Aromatic amino acids as a source for nitrogen containing by-products formed by
advanced oxidation water treatment
Method validation for drinking- and surface water
For the monitoring study of Heemskerk full-scale drinking water treatment facility the LC-
QToF method was also validated for drinking- and surface water. For the preparation of
validation samples, drinking water was obtained from the tap at KWR and surface water was
obtained from the Lekkanaal. The limit of detection (LOD), limit of quantification (LOQ),
repeatability and recovery were determined for all N-DBPs in both drinking- and surface
water. The validation results are shown in table 25 and 26.
TABLE 25: SPE VALIDATION RESULTS (N=5) FOR N-DBPS IN DRINKING WATER
Compound LOD
(ng/L)
LOQ
(ng/L)
Recovery
25 ng/L
(%)
Repeatability
25 ng/L
(%)
2-Methoxy-4,6-dinitrophenol 0.29 1.0 74.4 1.7
4-Nitrophenol 0.79 5.0 91.1 7.4
4-Nitrocatechol 0.18 2.0 87.2 6.6
2-Hydroxy-5-nitrobenzoic acid 0.50 2.0 93.1 0.7
5-Nitrovanillin 0.38 1.0 112.2 3.8
4-Nitrophthalic acid 5.9 10 275.0 3.0
2,4-Dinitrophenol 0.27 1.0 132.9 6.9
4-Nitro-1,3-benzenediol 0.45 2.0 86.6 5.0
2-Nitrohydroquinone 2.6 5.0 78.0 3.8
4-Nitrobenzenesulfonic acid 1.2 3.0 80.9 19.2
4-Hydroxy-3-nitrobenzoic acid 0.64 2.0 43.4 2.5
2-Hydroxy-3-nitrobenzoic acid 0.19 2.0 80.2 2.3
Dinoterb 0.44 2.0 109.3 2.8
3,5-Dinitrosalicylic acid 1.33 3.0 63.8* 18*
2-Methyl-4-nitrophenol 0.49 1.0 137.7 6.0
2-Methoxy-4-nitrophenol 0.40 3.0 107.0 3.2
4-Hydroxy-3-nitrobenzenesulfonic
acid
0.31 2.0 58.5 13.8
2-Amino-3-nitrobenzoic acid 0.47 2.0 48.3 3.1
3-Nitroindole 0.48 2.0 130.0 4.5
* n=4
TABLE 26: SPE VALIDATION RESULTS (N=5) FOR N-DBPS IN SURFACE WATER
Compound LOD
(ng/L)
LOQ
(ng/L)
Recovery
25 ng/L
(%)
Repeatability
25 ng/L
(%)
2-Methoxy-4,6-dinitrophenol * 1.0 87.4 1.2
4-Nitrophenol * 5.0 111.4 5.3
4-Nitrocatechol * 2.0 91.9 2.8
2-Hydroxy-5-nitrobenzoic acid * 2.0 114.8 2.3
5-Nitrovanillin * 1.0 116.0 2.0
4-Nitrophthalic acid * 10 245.1 2.5
2,4-Dinitrophenol * 1.0 137.6 2.0
4-Nitro-1,3-benzenediol 0.66 2.0 99.2 4.1
2-Nitrohydroquinone * 5.0 87.9 6.4
4-Nitrobenzenesulfonic acid * 3.0 80.2 5.4

BTO 2018.035 | March 2018 37 Aromatic amino acids as a source for nitrogen containing by-products formed by
advanced oxidation water treatment
4-Hydroxy-3-nitrobenzoic acid * 2.0 57.1 2.4
2-Hydroxy-3-nitrobenzoic acid * 2.0 95.0 0.7
Dinoterb 0.99 2.0 124.7 3.2
3,5-Dinitrosalicylic acid * 3.0 71.8** 26.4**
2-Methyl-4-nitrophenol * 1.0 154.8 3.7
2-Methoxy-4-nitrophenol * 3.0 118.7 4.0
4-Hydroxy-3-nitrobenzenesulfonic
acid
0.69 2.0 43.2 12.4
2-Amino-3-nitrobenzoic acid 0.63 2.0 62.5 2.0
3-Nitroindole 0.49 2.0 134.0 3.7
* Due to the presence of the N-DBPs in surface water, it is not possible to determine all validation
characteristics. The validation results of drinking water can then be used as reference.
** n=4
Satisfactory LOD and LOQ results were obtained for the N-DBPs in drinking- and surface
water, which results in LOQs between 1.0 – 10 ng/L. The recoveries in drinking and surface
water for almost all N-DBPs are between 43.2 – 154.8 % and are within acceptable range,
excluding 4-nitrophthalic acid which has a recovery of 275.0 and 245.1 for surface and
drinking water. The repeatability for almost all compounds is lower than 20% and is
satisfactory. Only the repeatability for 3,5-dinitrosalicylic acid is relatively high, and was
determined at 26.4%. The high recovery for 4-nitrophthalic acid is was not observed with the
validation in ultrapure water and might therefore be caused by severe ion enhancement in
the mass spectrometer. This can possibly solved by using an isotopically labeled internal
standard, although it is not commercially available for 4-nitrophthalic acid.
The results of the validation of N-DBPs in drinking- and surface water is satisfactory and
show that the LC-QToF target method can be applied for the monitoring study of a full-scale
drinking water treatment facility.
4.5 Monitoring study full-scale drinking water treatment facility
For the monitoring of N-DBPs formed by MP UV treatment, the Heemskerk full-scale
treatment facility was selected (PWN, Heemskerk, The Netherlands). In the prior study, 22 N-
DBPs were detected after MP UV/H2O2 treatment in this facility. At this facility surface water
from Lake IJssel is treated by applying advanced oxidation and adds H2O2 before MP UV
treatment. After MP UV/H2O2 treatment, granulated active carbon (GAC) filtration is applied
for quenching the excess of H2O2 and is followed by infiltration into the dunes. Artificial
dune recharge water is reclaimed after at least > 21 days, which is first aerated and filtrated
(i.e. rapid sand filtration) before drinking water distribution.
For the monitoring study three types of samples were selected:
Influent MP UV/H2O2 treatment
Effluent MP UV/H2O2 treatment (before GAC filtration)
Aerated reclaimed dune infiltration water
The sampling campaign was conducted from July 2016 until January 2017 with a sampling
frequency of once a month. In total seven samples were collected per sampling point. The
samples were collected and stored (1-5 oC) in 1L glass sample bottles upon arrival at KWR.
Then the samples were transferred to 1L HDPE bottles and stored in a freezer (-25 oC) until
LC-QToF analysis.

BTO 2018.035 | March 2018 38 Aromatic amino acids as a source for nitrogen containing by-products formed by
advanced oxidation water treatment
4.6 Results monitoring study
The results of the monitoring study for the influent MP UV/H2O2 and effluent MP UV/H2O2
samples are presented in table 27 and 28. No N-DBPs were detected in the aerated reclaimed
dune infiltration water sample and the results for this sample can be found in attachment X.
TABLE 27: RESULTS MONITORING STUDY - INFLUENT MP UV/H2O2 TREATMENT SAMPLE
Compound Influent MP UV/H2O2 treatment
27/07/16 05/09/16 21/09/16 20/10/16 21/11/16 14/12/16 11/01/17
ng/L ng/L ng/L ng/L ng/L ng/L ng/L
2-Methoxy-4,6-dinitrophenol < 1.0 5.9 6.8 < 1.0 < 1.0 1.0 1.2
4-Nitrophenol < 5.0 < 5.0 < 5.0 < 5.0 5.8 5.5 8.8
4-Nitrocatechol < 2.0 < 2.0 < 2.0 < 2.0 < 2.0 < 2.0 < 2.0
2-Hydroxy-5-nitrobenzoic acid < 2.0 < 2.0 < 2.0 < 2.0 < 2.0 < 2.0 < 2.0
5-Nitrovanillin < 1.0 7.5 5.6 < 1.0 < 1.0 < 1.0 < 1.0
4-Nitrophthalic acid < 10 < 10 < 10 < 10 < 10 < 10 < 10
2,4-Dinitrophenol 4.2 5.0 8.8 8.0 7.3 7.7 8.7
4-Nitro-1,3-benzenediol < 2.0 < 2.0 < 2.0 < 2.0 < 2.0 < 2.0 < 2.0
2-Nitrohydroquinone < 5.0 < 5.0 < 5.0 < 5.0 < 5.0 < 5.0 < 5.0
4-Nitrobenzenesulfonic acid < 3.0 < 3.0 < 3.0 < 3.0 < 3.0 < 3.0 3.0
4-Hydroxy-3-nitrobenzoic acid < 2.0 2.2 < 2.0 < 2.0 < 2.0 < 2.0 2.0
2-Hydroxy-3-nitrobenzoic acid < 2.0 < 2.0 < 2.0 < 2.0 < 2.0 4.3 2.2
Dinoterb < 2.0 < 2.0 < 2.0 < 2.0 < 2.0 < 2.0 < 2.0
3,5-Dinitrosalicylic acid < 3.0 < 3.0 < 3.0 < 3.0 < 3.0 < 3.0 < 3.0
2-Methyl-4-nitrophenol 1.4 1.6 2.4 2.5 6.5 7.1 10.2
2-Methoxy-4-nitrophenol < 3.0 < 3.0 < 3.0 < 3.0 < 3.0 < 3.0 < 3.0
4-Hydroxy-3-
nitrobenzenesulfonic acid
< 2.0 < 2.0 < 2.0 < 2.0 < 2.0 < 2.0 < 2.0
2-Amino-3-nitrobenzoic acid < 2.0 < 2.0 < 2.0 < 2.0 < 2.0 < 2.0 < 2.0
3-Nitroindole < 2.0 < 2.0 < 2.0 < 2.0 < 2.0 < 2.0 < 2.0
Summed concentration 5.6 22 24 11 20 26 36
TABLE 28: RESULTS MONITORING STUDY - EFFLUENT MP UV/H2O2 TREATMENT SAMPLE
Compound Effluent MP UV/H2O2 treatment
27/07/16 05/09/16 21/09/16 20/10/16 21/11/16 14/12/16 11/01/17
ng/L ng/L ng/L ng/L ng/L ng/L ng/L
2-Methoxy-4,6-dinitrophenol < 1.0 2.6 6.9 1.4 22 21 41
4-Nitrophenol < 5.0 7.2 9.2 6.6 25 29 31
4-Nitrocatechol < 2.0 < 2.0 < 2.0 < 2.0 2.1 3.1 3.7
2-Hydroxy-5-nitrobenzoic acid < 2.0 15 16 11 28 44 44
5-Nitrovanillin < 1.0 < 1.0 1.4 < 1.0 < 1.0 < 1.0 < 1.0
4-Nitrophthalic acid < 10 35 28 19 26 42 39
2,4-Dinitrophenol 4.5 1.0 1.2 < 1.0 4.7 3.1 5.6
4-Nitro-1,3-benzenediol < 2.0 < 2.0 < 2.0 < 2.0 < 2.0 < 2.0 < 2.0
2-Nitrohydroquinone < 5.0 < 5.0 < 5.0 < 5.0 < 5.0 < 5.0 < 5.0
4-Nitrobenzenesulfonic acid < 3.0 9.7 8.1 12 28 29 40
4-Hydroxy-3-nitrobenzoic acid < 2.0 3.5 5.8 3.6 11 16 16
2-Hydroxy-3-nitrobenzoic acid < 2.0 2.4 < 2.0 2.3 5.6 8.8 8.6
Dinoterb < 2.0 < 2.0 < 2.0 < 2.0 < 2.0 < 2.0 < 2.0
3,5-Dinitrosalicylic acid < 3.0 < 3.0 < 3.0 < 3.0 3.0 5.6 4.6
2-Methyl-4-nitrophenol 1.3 < 1.0 1.2 < 1.0 1.3 2.3 2.3

BTO 2018.035 | March 2018 39 Aromatic amino acids as a source for nitrogen containing by-products formed by
advanced oxidation water treatment
2-Methoxy-4-nitrophenol < 3.0 < 3.0 < 3.0 < 3.0 < 3.0 < 3.0 < 3.0
4-Hydroxy-3-
nitrobenzenesulfonic acid
< 2.0 < 2.0 < 2.0 < 2.0 16 7.3 23
2-Amino-3-nitrobenzoic acid < 2.0 < 2.0 < 2.0 < 2.0 < 2.0 2.4 2.9
3-Nitroindole < 2.0 < 2.0 < 2.0 < 2.0 < 2.0 2.0 2.3
Summed concentration 5.8 76 78 55 174 216 263
Fifteen of the 19 N-DBPs were detected during the monitoring study in MP UV/H2O2 treated
water, with concentrations ranging from 1.0 to 44 ng/L. Five N-DBPs were detected at a
relatively high concentrations in MP UV treated water; 2-methoxy-4,6-dinitrophenol (41
ng/L), 4-nitrophenol (31 ng/L), 2-hydroxy-5-nitrobenzoic acid (44 ng/L), 4-nitrophthalic acid
(42 ng/L) and 4-nitrobenzenesulfonic acid (40 ng/L). As expected, the highest
concentrations of N-DBPs were detected in the MP UV treated water, while much lower
concentrations were detected in the influent sample. Three N-DBPs (5-nitrovanillin, 2,4-
dintrophenol, and 2-methyl-4-nitrophenol) were detected in higher concentrations in the
influent sample than in the MP UV treated sample, which suggest that these N-DBPs are
probably not formed by MP UV in the full-scale treatment facility. Furthermore, there were no
N-DBPs detected in the sample after dune infiltration, meaning that there are no N-DBPs
present in the final drinking water.
3-Nitroindole, a by-product detected in the tryptophan labeling experiments, was also
detected in the MP UV/H2O2 treated water, although at low concentrations of 2.0 - 2.3 ng/L in
two of the seven samples. A suspect screening was performed for detection of other by-
products of tryptophan, but none were found. A suspect screening was also performed for
by-products of phenylalanine, but yielded no results. These results show that the N-DBPs of
aromatic amino acids play a limited role in in the Heemskerk full-scale treatment facility.
In order to obtain a good overview of the detected N-DBPs in the monitoring study, the
concentrations were summed per sample (see figure 14).
Figure 14: Summed concentrations of the detected by-products in the Heemskerk full-scale water
treatment facility in influent MP UV/H2O2, effluent MP UV/H2O2 and after dune infiltration water, analysed
using the QToF N-DBP target method.
A clear trend is visible when looking at the total amount of detected by-products per month.
Low summed concentrations of N-DBPs were detected in July (sum is 5.8 ng/L) but increases
considerably during the year, with a maximum of 263 ng/L detected in January. This trend
cannot be explained by the concentration of dissolved organic carbon (DOC) or nitrate
present in the water. The concentration of DOC does not fluctuate much during the year (5-7
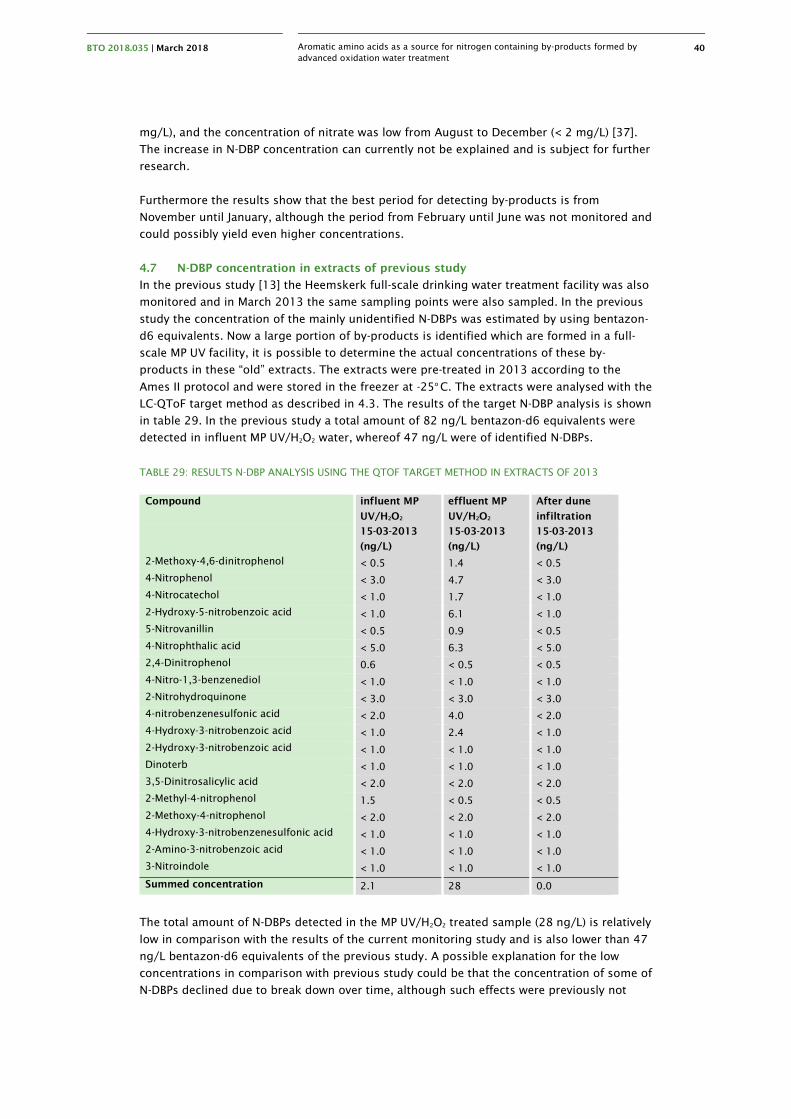
BTO 2018.035 | March 2018 40 Aromatic amino acids as a source for nitrogen containing by-products formed by
advanced oxidation water treatment
mg/L), and the concentration of nitrate was low from August to December (< 2 mg/L) [37].
The increase in N-DBP concentration can currently not be explained and is subject for further
research.
Furthermore the results show that the best period for detecting by-products is from
November until January, although the period from February until June was not monitored and
could possibly yield even higher concentrations.
4.7 N-DBP concentration in extracts of previous study
In the previous study [13] the Heemskerk full-scale drinking water treatment facility was also
monitored and in March 2013 the same sampling points were also sampled. In the previous
study the concentration of the mainly unidentified N-DBPs was estimated by using bentazon-
d6 equivalents. Now a large portion of by-products is identified which are formed in a full-
scale MP UV facility, it is possible to determine the actual concentrations of these by-
products in these “old” extracts. The extracts were pre-treated in 2013 according to the
Ames II protocol and were stored in the freezer at -25o C. The extracts were analysed with the
LC-QToF target method as described in 4.3. The results of the target N-DBP analysis is shown
in table 29. In the previous study a total amount of 82 ng/L bentazon-d6 equivalents were
detected in influent MP UV/H2O2 water, whereof 47 ng/L were of identified N-DBPs.
TABLE 29: RESULTS N-DBP ANALYSIS USING THE QTOF TARGET METHOD IN EXTRACTS OF 2013
Compound influent MP
UV/H2O2
effluent MP
UV/H2O2
After dune
infiltration
15-03-2013 15-03-2013 15-03-2013
(ng/L) (ng/L) (ng/L)
2-Methoxy-4,6-dinitrophenol < 0.5 1.4 < 0.5
4-Nitrophenol < 3.0 4.7 < 3.0
4-Nitrocatechol < 1.0 1.7 < 1.0
2-Hydroxy-5-nitrobenzoic acid < 1.0 6.1 < 1.0
5-Nitrovanillin < 0.5 0.9 < 0.5
4-Nitrophthalic acid < 5.0 6.3 < 5.0
2,4-Dinitrophenol 0.6 < 0.5 < 0.5
4-Nitro-1,3-benzenediol < 1.0 < 1.0 < 1.0
2-Nitrohydroquinone < 3.0 < 3.0 < 3.0
4-nitrobenzenesulfonic acid < 2.0 4.0 < 2.0
4-Hydroxy-3-nitrobenzoic acid < 1.0 2.4 < 1.0
2-Hydroxy-3-nitrobenzoic acid < 1.0 < 1.0 < 1.0
Dinoterb < 1.0 < 1.0 < 1.0
3,5-Dinitrosalicylic acid < 2.0 < 2.0 < 2.0
2-Methyl-4-nitrophenol 1.5 < 0.5 < 0.5
2-Methoxy-4-nitrophenol < 2.0 < 2.0 < 2.0
4-Hydroxy-3-nitrobenzenesulfonic acid < 1.0 < 1.0 < 1.0
2-Amino-3-nitrobenzoic acid < 1.0 < 1.0 < 1.0
3-Nitroindole < 1.0 < 1.0 < 1.0
Summed concentration 2.1 28 0.0
The total amount of N-DBPs detected in the MP UV/H2O2 treated sample (28 ng/L) is relatively
low in comparison with the results of the current monitoring study and is also lower than 47
ng/L bentazon-d6 equivalents of the previous study. A possible explanation for the low
concentrations in comparison with previous study could be that the concentration of some of
N-DBPs declined due to break down over time, although such effects were previously not

BTO 2018.035 | March 2018 41 Aromatic amino acids as a source for nitrogen containing by-products formed by
advanced oxidation water treatment
observed. Another explanation is due to the quantification with bentazon-d6, which yield a
different ionisation response [38] in comparison with the individual N-DBP.
Conclusion
In the end it is good to finally confirm the presence of several N-DBPs in the samples of the
previous study and that it is finally possible to quantify them. Because the identity and
concentration is now known for many N-DBPs detected in full-scale drinking water treatment
facility using MP UV, it is now possible to test the identified N-DBPs (or mixture of) in the
Amest test and to gain more insight in the relation between the observed mutagenicity and
the identified N-DBPs.
BTO 2018.035 | March 2018 42 Aromatic amino acids as a source for nitrogen containing by-products formed by
advanced oxidation water treatment
5 Conclusion & recommendations
In this study a LC-QToF method was developed for the determination of aromatic amino
acids for which satisfactory LOD and LOQ results were obtained for both drinking- and
surface water. Aromatic amino acids were detected in Lake IJssel source water and artificial
water, indicating that they can be a potential source for the formation of N-DBPs.
Labeling experiments were conducted using a non-target screening LC-QToF method and it
was demonstrated that the labeling strategy involving nitrate, aromatic amino acids and MP
UV treatment worked and many by-products were detected using this strategy. For
tryptophan, one by-product was detected in the artificial water sample and was identified as
3-nitroindole. However, other high intensity tryptophan by-products were not detected in
artificial water, suggesting that 3-nitroindole in the artificial water sample does not originate
from tryptophan, but originates from another source. For phenylalanine, four unidentified
phenylalanine N-DBPs were detected in artificial water, for which was shown that these N-
DBPs are truly MP UV by-products of phenylalanine. This demonstrates that aromatic amino
acids are probably responsible for some of the N-DBPs formed by MP UV treatment of
artificial water. However, none of the tryptophan and phenylalanine by-products were
detected in the full-scale MP UV water treatment sample of the prior study, making the
detected by-products of tryptophan and phenylalanine less relevant for further research.
Of the 84 by-products detected in artificial water (prior study), five N-DBPs were
unambiguously identified during this study, bringing the total of identified N-DBPs in
artificial water to 19. For all of the newly identified N-DBPs an indication for DNA binding and
mutagenicity was obtained and an indication for potential carcinogenicity for 2-amino-3-
nitrobenzoic acid, 2-methyl-4-nitrophenol and 2-methoxy-4-nitrophenol.
A LC-QToF target method was developed for determination of the 19 identified N-DBPs in
drinking- and surface water and satisfactory LOD and LOQ results were obtained. The
method was applied for a seven months monitoring study of a full-scale drinking water
facility using MP UV treatment. Fifteen of the 19 known N-DBPs were detected during the
monitoring study in MP UV/H2O2 treated water, with concentrations ranging from 1.0 to 44
ng/L. Five N-DBPs were detected at relatively high concentrations in MP UV treated water; 2-
methoxy-4,6-dinitrophenol (41 ng/L), 4-nitrophenol (31 ng/L), 2-hydroxy-5-nitrobenzoic acid
(44 ng/L), 4-nitrophthalic acid (42 ng/L) and 4-nitrobenzenesulfonic acid (40 ng/L). The
monitory study showed a large seasonal variation in the summed concentration of detected
N-DBPs (5.8 ng/L in July and 263 ng/L in January) and also showed there were no N-DBPs
detected in the samples after dune infiltration. The amount of detected N-DBPs in a full-scale
treatment facility demonstrates the relevance of the identified N-DBPs and the developed N-
DBP target method.
Because the identity and concentration is now known for many N-DBPs detected in a full-
scale drinking water treatment facility using MP UV; it is recommended to conduct N-DBP
target analysis of MP UV treated water of a drinking water facility, and then to perform Ames
testing with and without (mixtures of) identified N-DBPs at their detected concentration, in
order to gain more insight between the relation of identified N-DBPs and observed
mutagenicity in MP UV treated water.

BTO 2018.035 | March 2018 43 Aromatic amino acids as a source for nitrogen containing by-products formed by
advanced oxidation water treatment
Other recommendations:
Conducting a monitoring study of a year for a full-scale drinking water treatment
facility using MP UV in order to obtain a good overview of the concentrations of the N-
DBPs per month and to find an explanation between the concentration differences per
month
Performing labeling experiments in MP UV influent water, in order to detect other
types of N-DBPs, such as N-DBPs formed from organic micro pollutants.

BTO 2018.035 | March 2018 44 Aromatic amino acids as a source for nitrogen containing by-products formed by
advanced oxidation water treatment
6 References
1. Kruithof, J.C. and J.C. Schippers, Drinking water treatment in the 1990s. Water Supply,
1994. 12(1-2): p. SS51-SS54.
2. Homem, V. and L. Santos, Degradation and removal methods of antibiotics from aqueous
matrices - A review. Journal of Environmental Management, 2011. 92(10): p. 2304-2347.
3. Lekkerkerker-Teunissen, K., et al., Transformation of atrazine, carbamazepine,
diclofenac and sulfamethoxazole by low and medium pressure UV and UV/H2O2
treatment. Separation and Purification Technology, 2012. 96: p. 33-43.
4. Yang, W., H. Zhou, and N. Cicek, Treatment of organic micropollutants in water and
wastewater by UV-based processes: A literature review. Critical Reviews in Environmental
Science and Technology, 2014. 44(13): p. 1443-1476.
5. Heringa, M.B., et al., Formation and removal of genotoxic activity during UV/H2O2–GAC
treatment of drinking water. Water Res, 2011. 45(1): p. 366-374.
6. Hofman-Caris, R.C.H.M., et al., Influence of process conditions and water quality on the
formation of mutagenic byproducts in UV/H2O2 processes. Water Research, 2015. 74: p.
191-202.
7. Martijn, A.J. and J.C. Kruithof, UV and UV/H2O2 Treatment: The Silver Bullet for By-
product and Genotoxicity Formation in Water Production. Ozone: Science & Engineering,
2012. 34(2): p. 92-100.
8. Richardson, S.D. and S.Y. Kimura, Water Analysis: Emerging Contaminants and Current
Issues. Analytical Chemistry, 2016. 88(1): p. 546-582.
9. Richardson, S.D., et al., Occurrence, genotoxicity, and carcinogenicity of regulated and
emerging disinfection by-products in drinking water: A review and roadmap for research.
Mutation Research - Reviews in Mutation Research, 2007. 636(1-3): p. 178-242.
10. Bond, T., et al., Occurrence and control of nitrogenous disinfection by-products in
drinking water - A review. Water Research, 2011. 45(15): p. 4341-4354.
11. Bond, T., M.R. Templeton, and N. Graham, Precursors of nitrogenous disinfection by-
products in drinking water--A critical review and analysis. Journal of Hazardous
Materials, 2012. 235-236: p. 1-16.
12. Shah, A.D. and W.A. Mitch, Halonitroalkanes, halonitriles, haloamides, and N-
nitrosamines: A critical review of nitrogenous disinfection byproduct formation pathways.
Environmental Science and Technology, 2012. 46(1): p. 119-131.
13. Kolkman, A., et al., Tracing Nitrogenous Disinfection Byproducts after Medium Pressure
UV Water Treatment by Stable Isotope Labeling and High Resolution Mass Spectrometry.
Environ Sci Technol, 2015. 49(7): p. 4458-4465.
14. Thorn, K.A. and L.G. Cox, Ultraviolet irradiation effects incorporation of nitrate and
nitrite nitrogen into aquatic natural organic matter. Journal of Environmental Quality,
2012. 41(3): p. 865-881.
15. Goldstein, S. and J. Rabani, Mechanism of nitrite formation by nitrate photolysis in
aqueous solutions: The role of peroxynitrite, nitrogen dioxide, and hydroxyl radical.
Journal of the American Chemical Society, 2007. 129(34): p. 10597-10601.
16. Mack, J. and J.R. Bolton, Photochemistry of nitrite and nitrate in aqueous solution: A
review. Journal of Photochemistry and Photobiology A: Chemistry, 1999. 128(1-3): p. 1-
13.
17. Monarca, S., et al., The influence of different disinfectants on mutagenicity and toxicity of
urban wastewater. Water Research, 2000. 34(17): p. 4261-4269.
18. Vughs, D., et al., Application of effect-directed analysis to identify mutagenic nitrogenous
disinfection by-products of advanced oxidation drinking water treatment. Environmental
Science and Pollution Research, 2016.

BTO 2018.035 | March 2018 45 Aromatic amino acids as a source for nitrogen containing by-products formed by
advanced oxidation water treatment
19. Dotson, A. and P. Westerhoff, Occurrence and removal of amino acids during drinking
water treatment. Journal (American Water Works Association), 2009. 101(9): p. 101-115.
20. How, Z.T., et al., Analysis of free amino acids in natural waters by liquid
chromatography-tandem mass spectrometry. Journal of Chromatography A, 2014. 1370:
p. 135-146.
21. Suzuki, J., et al., Formation of mutagens by photolysis of amino acids in neutral aqueous
solution containing nitrite or nitrate ion. Chemosphere, 1985. 14(5): p. 493-500.
22. Aljammaz, M., Identification of Genotoxic Reaction Products Formed Upon Drinking Water
Treatment by Medium Pressure Ultra Violet Light with Hydrogen Peroxide (MP UV/H2O2).
PWN, 2014.
23. Wu, F.C. and E. Tanoue, Tryptophan in the sediments of lakes from Southwestern China
Plateau. Chemical Geology, 2002. 184(1): p. 139-149.
24. Desiderio, C., et al., Capillary electrophoresis-mass spectrometry for the analysis of
amino acids. Journal of Separation Science, 2010. 33(16): p. 2385-2393.
25. Martens, D.A. and K.L. Loeffelmann, Soil Amino Acid Composition Quantified by Acid
Hydrolysis and Anion Chromatography−Pulsed Amperometry. Journal of Agricultural and
Food Chemistry, 2003. 51(22): p. 6521-6529.
26. Piraud, M., et al., Ion-pairing reversed-phase liquid chromatography/electrospray
ionization mass spectrometric analysis of 76 underivatized amino acids of biological
interest: A new tool for the diagnosis of inherited disorders of amino acid metabolism.
Rapid Communications in Mass Spectrometry, 2005. 19(12): p. 1587-1602.
27. Gao, J., et al., Robust analysis of underivatized free amino acids in soil by hydrophilic
interaction liquid chromatography coupled with electrospray tandem mass spectrometry.
Journal of Chromatography A, 2016. 1449: p. 78-88.
28. Harris, B.D., et al., Characterization of Disinfection By-Products from
Chromatographically Isolated NOM through High-Resolution Mass Spectrometry.
Environmental Science & Technology, 2015. 49(24): p. 14239-14248.
29. Bolton, J.R. and K.G. Linden, Standardization of methods for fluence (UV Dose)
determination in bench-scale UV experiments. Journal of Environmental Engineering,
2003. 129(3): p. 209-215.
30. Nuriel, T., A. Hansler, and S.S. Gross, Protein nitrotryptophan: Formation, significance
and identification. Journal of Proteomics, 2011. 74(11): p. 2300-2312.
31. Schymanski, E.L., et al., Identifying Small Molecules via High Resolution Mass
Spectrometry: Communicating Confidence. Environ Sci Technol, 2014.
32. Ruttkies, C., et al., MetFrag relaunched: incorporating strategies beyond in silico
fragmentation. Journal of Cheminformatics, 2016. 8(1): p. 3.
33. Tanii, H. and K. Hashimoto, Studies on the mechanism of acute toxicity of nitriles in mice.
Archives of Toxicology, 1984. 55(1): p. 47-54.
34. Ma, X., et al., Identification and characterization of phenylacetonitrile as a nitrogenous
disinfection byproduct derived from chlorination of phenylalanine in drinking water.
Water Research, 2016. 102(Supplement C): p. 202-210.
35. Taneda, S., et al., Estrogenic and Anti-androgenic Activity of Nitrophenols in Diesel
Exhaust Particles (DEP). Biological and Pharmaceutical Bulletin, 2004. 27(6): p. 835-837.
36. Mori, Y., et al., Isolation of Nitrophenols from Diesel Exhaust Particles (DEP) as
Vasodilatation Compounds. Biological and Pharmaceutical Bulletin, 2003. 26(3): p. 394-
395.
37. RIWA-Rijn annual report 2016.
38. van Leerdam, J.A., et al., Exploring the boundaries of non-target screening with Liquid
Chromatography coupled to ESI-MS 2017, KWR: Nieuwegein. p. 89.

BTO 2018.035 | March 2018 46 Aromatic amino acids as a source for nitrogen containing by-products formed by
advanced oxidation water treatment
Attachment I MS/MS spectra of
aromatic amino acids
TYROSINE MS/MS SPECTRUM (20, 35 AND 50 EV, AVERAGED)
50 60 70 80 90 100 110 120 130 140 150 160 170 180 190
Mass/Charge, Da
0
100
200
300
400
500
600
700
800
900
1000
1100
1200
1300
1400
1500
1600
1700
1800
1900
2000
2100
2200
2300
2400
Inte
nsity
91.0533
136.0744
119.0479
123.0428
95.0480
77.0379
107.047865.0383
147.0429 165.0536
PHENYLALANINE MS/MS SPECTRUM (20, 35 AND 50 EV, AVERAGED)
50 60 70 80 90 100 110 120 130 140 150 160 170
Mass/Charge, Da
0
500
1000
1500
2000
2500
3000
3500
4000
4500
5000
5500
6000
6500
7000
7500
Inte
nsity
120.0801
103.0535
77.0384
91.053579.0538
93.0691
TRYPTOPHAN MS/MS SPECTRUM (20, 35 AND 50 EV, AVERAGED)
70 80 90 100 110 120 130 140 150 160 170 180 190 200
Mass/Charge, Da
0
200
400
600
800
1000
1200
1400
1600
1800
2000
2200
2400
2600
2800
3000
3200
Inte
nsity
118.0642
146.0593
188.0702115.0532
91.0534 144.0797
132.0796117.0563
142.0641130.0639
170.0592159.0908117.0683
127.0530
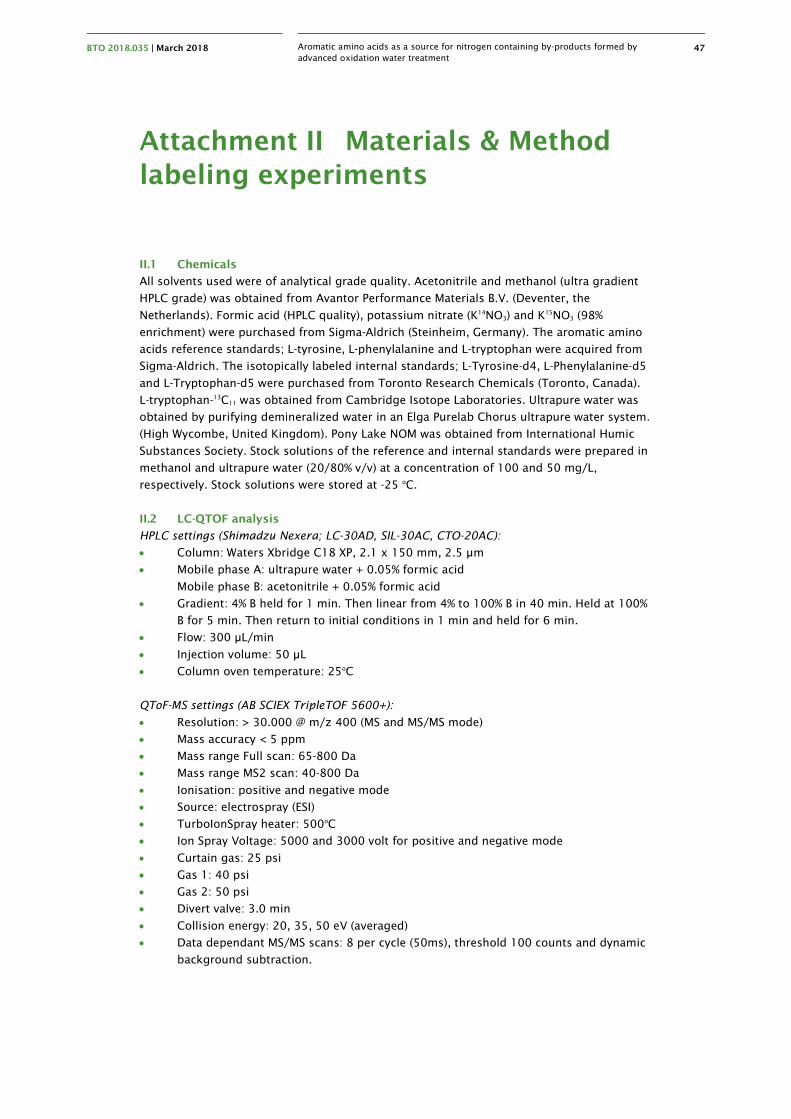
BTO 2018.035 | March 2018 47 Aromatic amino acids as a source for nitrogen containing by-products formed by
advanced oxidation water treatment
Attachment II Materials & Method
labeling experiments
II.1 Chemicals
All solvents used were of analytical grade quality. Acetonitrile and methanol (ultra gradient
HPLC grade) was obtained from Avantor Performance Materials B.V. (Deventer, the
Netherlands). Formic acid (HPLC quality), potassium nitrate (K14NO3) and K15NO3 (98%
enrichment) were purchased from Sigma-Aldrich (Steinheim, Germany). The aromatic amino
acids reference standards; L-tyrosine, L-phenylalanine and L-tryptophan were acquired from
Sigma-Aldrich. The isotopically labeled internal standards; L-Tyrosine-d4, L-Phenylalanine-d5
and L-Tryptophan-d5 were purchased from Toronto Research Chemicals (Toronto, Canada).
L-tryptophan-13C11 was obtained from Cambridge Isotope Laboratories. Ultrapure water was
obtained by purifying demineralized water in an Elga Purelab Chorus ultrapure water system.
(High Wycombe, United Kingdom). Pony Lake NOM was obtained from International Humic
Substances Society. Stock solutions of the reference and internal standards were prepared in
methanol and ultrapure water (20/80% v/v) at a concentration of 100 and 50 mg/L,
respectively. Stock solutions were stored at -25 oC.
II.2 LC-QTOF analysis
HPLC settings (Shimadzu Nexera; LC-30AD, SIL-30AC, CTO-20AC):
Column: Waters Xbridge C18 XP, 2.1 x 150 mm, 2.5 µm
Mobile phase A: ultrapure water + 0.05% formic acid
Mobile phase B: acetonitrile + 0.05% formic acid
Gradient: 4% B held for 1 min. Then linear from 4% to 100% B in 40 min. Held at 100%
B for 5 min. Then return to initial conditions in 1 min and held for 6 min.
Flow: 300 µL/min
Injection volume: 50 µL
Column oven temperature: 25oC
QToF-MS settings (AB SCIEX TripleTOF 5600+):
Resolution: > 30.000 @ m/z 400 (MS and MS/MS mode)
Mass accuracy < 5 ppm
Mass range Full scan: 65-800 Da
Mass range MS2 scan: 40-800 Da
Ionisation: positive and negative mode
Source: electrospray (ESI)
TurboIonSpray heater: 500oC
Ion Spray Voltage: 5000 and 3000 volt for positive and negative mode
Curtain gas: 25 psi
Gas 1: 40 psi
Gas 2: 50 psi
Divert valve: 3.0 min
Collision energy: 20, 35, 50 eV (averaged)
Data dependant MS/MS scans: 8 per cycle (50ms), threshold 100 counts and dynamic
background subtraction.

BTO 2018.035 | March 2018 48 Aromatic amino acids as a source for nitrogen containing by-products formed by
advanced oxidation water treatment
Attachment III Screening list of
nitrogenous disinfection by-products
Accurate Retention Positive/ Most Detected in Detected in Compound
mass time*
(min)
Negative
mode
probable
formula
fractionated
samples
unfractionated
samples
138.0199 11.79 Negative C6H5O3N yes yes 4-nitrophenol
152.0359 (1) 10.10 negative C7H7O3N yes yes
152.0361 (2) 15.18 negative C7H7O3N yes yes
153.0073 10.54 negative yes yes
154.0148 (1) 9.23 negative C6H5O4N yes yes 4-nitrocatechol
154.0148 (2) 10.06 negative C6H5O4N yes yes 2-nitrohydroquinone
154.0148 (3) ** negative C6H5O4N yes? yes 4-nitro-1,3-benzenediol
161.0364 15.06 negative C8H6O2N2 yes no
168.0306 12.23 negative C7H7O4N yes yes
179.0101 10.62 negative C7H4O4N2 yes yes
181.0263 13.59 negative C7H7O4N2 yes yes
182.0098 (2) 10.21 negative C7H5O5N yes yes 4-hydroxy-3-nitrobenzoic acid
182.0098 (3) 12.81 negative C7H5O5N yes yes 2-hydroxy-5-nitrobenzoic acid
182.0098 (4) ** negative C7H5O5N yes yes 2-hydroxy-3-nitrobenzoic acid
183.0055 14.03 negative C6H4O5N2 yes yes 2,4-dinitrophenol
195.0055 10.97 negative C7H4O5N2 yes yes
196.0254 7.68 negative C8H7O5N yes yes
196.0258 (1) 10.10 negative yes yes
196.0259 (2) 11.51 negative yes yes 5-nitrovanillin
196.0260 (3) 12.89 negative yes yes
198.0047 7.88 negative C7H5O6N yes yes
201.9818 5.00 negative C6H5NO5S yes yes 4-nitrobenzenesulfonic acid
208.0255 11.77 negative C9H7O5N yes yes
210.0048 (1) 7.48 negative C8H5O6N yes yes 4-nitrophthalic acid
210.0048 (2) 8.90 negative C8H5O6N yes yes
211.0004 12.90 negative C7H4O6N2 yes yes
212.0204 10.55 negative C8H7O6N yes yes Structural isomer of 5-
Hydroxy-4-methoxy-2-
nitrobenzoic acid
213.0154 14.58 negative C7H6O6N2 yes yes 2-methoxy-4,6-dinitrophenol
216.0268 11.53 positive yes yes
216.0268 6.81 positive yes yes
217.9767 5.73 negative yes yes
222.0165 16.75 negative C8H5O5N3 yes yes
223.0005 10.63 negative C8H4O6N2 yes yes
223.9957 13.52 negative C7H3O6N3 yes yes
225.9994 (1) 6.37 negative C8H5O7N yes yes
225.9996 (2) 7.39 negative C8H5O7N yes yes
226.9948 13.28 negative C7H4O7N2 yes yes 3,5-dinitrosalicylic acid
238.0726 17.84 negative C11H13O5N yes yes
239.0677 25.87 negative C10H12O5N2 yes yes dinoterb
240.0151 7.67 negative C9H7O7N yes yes
243.9923 5.20 negative no no
252.0153 8.74 negative C10H7O7N yes yes
254.0314 10.64 negative C10H9O7N yes yes
266.1037 22.94 negative C13H17O5N yes yes
270.0755 (1) 11.32 negative yes yes
270.0755 (2) 11.61 negative yes yes
272.0891 11.53 positive yes yes
274.0935 13.89 negative C11H17O7N yes yes

BTO 2018.035 | March 2018 49 Aromatic amino acids as a source for nitrogen containing by-products formed by
advanced oxidation water treatment
298.0940 13.10 negative C13H17O7N yes yes
316.1413 (1) 18.35 negative C14H23O7N yes yes
316.1417 (2) 19.00 negative C14H23O7N yes yes
316.1417 (3) 19.74 negative C14H23O7N yes yes
318.1550 (1) 19.80 positive C14H23O7N yes yes
318.1550 (2) 18.42 positive C14H23O7N yes yes
319.0209 16.16 negative yes yes
331.0554 (1) 12.39 negative yes yes
331.0554 (2) 12.57 negative yes yes
331.0554 (3) 13.08 negative yes yes
335.0534 18.95 negative yes yes
340.1388 27.36 positive C16H21O7N yes yes
340.1388 26.99 positive C16H21O7N yes yes
340.1388 28.08 positive C16H21O7N yes yes
372.1491 24.10 negative yes yes
386.1096 (1) 10.94 negative yes yes
386.1096 (2) 11.84 negative yes yes
386.1653 26.10 negative yes yes
387.1091 20.87 negative yes no
400.1262 (1) 11.24 negative yes yes
400.1262 (2) 12.19 negative yes yes
400.1802 28.34 negative yes yes
404.2758 (1) 17.34 positive C19H37O8N3 yes yes
404.2758 (2) 17.54 positive C19H37O8N3 yes no
404.2758 (3) 17.72 positive C19H37O8N3 yes no
404.2758 (4) 18.02 positive C19H37O8N3 yes yes
404.2758 (5) 18.36 positive C19H37O8N3 yes yes
404.2758 (6) 18.86 positive C19H37O8N3 no no
404.2758 (7) 20.40 positive C19H37O8N3 yes no
408.1308 (1) 11.70 negative yes yes
408.1310 (2) 13.21 negative yes yes
410.1468 14.46 negative yes yes
414.1418 (1) 11.48 negative yes yes
414.1421 (2) 12.57 negative yes yes
428.1213 10.26 negative yes yes
442.1365 (1) 9.49 negative yes yes
442.1365 (2) 10.19 negative yes yes
447.1455 24.00 negative no no
474.1501 11.66 positive yes yes
448.2675 (1) 17.32 negative C20H39O8N3 no no
448.2675 (2) 17.52 negative C20H39O8N3 no no
448.2675 (3) 17.70 negative C20H39O8N3 no no
448.2675 (4) 17.99 negative C20H39O8N3 no no
448.2675 (5) 18.35 negative C20H39O8N3 no no
448.2675 (6) 18.86 negative C20H39O8N3 no no
448.2675 (7) 20.40 negative C20H39O8N3 no no
452.1203 (1) 11.12 negative yes yes
452.1210 (2) 12.44 negative yes yes
* Retention time of the by-products as determined with stable isotope labeling using the Orbitrap mass
spectrometer
** These N-DBPs were not detected during the initial isotope labeling experiment, but in the follow-up
study by Vughs et al.
For more information about the detection and identification of the by-products, see publication:
Kolkman, A.; Martijn, B. J.; Vughs, D.; Baken, K. A.; van Wezel, A. P., Tracing Nitrogenous Disinfection
Byproducts after Medium Pressure UV Water Treatment by Stable Isotope Labeling and High Resolution
Mass Spectrometry. Environmental Science & Technology 2015, 49, (7), 4458-4465.

BTO 2018.035 | March 2018 50 Aromatic amino acids as a source for nitrogen containing by-products formed by
advanced oxidation water treatment
Attachment IV Annotated MS/MS
spectra of phenylalanine N-DBPs
ANNOTATED MS/MS SPECTRUM (20, 35 AND 50 EV, AVERAGED) OF BY-PRODUCT MZ 222.0156 (RT 18.45)
60 70 80 90 100 110 120 130 140 150 160 170 180 190 200 210 220
m/z
0
500
1000
1500
2000
2500
3000
3500
4000
C8H4O5N3222.0166
C8H3O4N3205.0131
C8H4O2N146.0246C6H4N
90.0351
C8H4O3N162.0196
C8H3O3N2175.0148
C7H3ON117.0223
C7H4O2N134.0252
C8H4O4N2192.0183
C5H2ON2106.0172
Inte
nsi
ty
-OH
-NO
-NO
-N2O2
-N
ANNOTATED MS/MS SPECTRUM (20, 35 AND 50 EV, AVERAGED) OF BY-PRODUCT MZ 222.0156 (RT 17.79)
60 70 80 90 100 110 120 130 140 150 160 170 180 190 200 210 220
m/z
0
500
1000
1500
2000
2500
3000
3500
4000
C8H3O4N3205.0128
C8H4O5N3222.0159
C6H3N2103.0300 C8H3O3N2
175.0144C7H3ON2131.0244
C7H3ON2115.0297
117.0217C6H2N88.0197
Inte
nsi
ty
-OH
-NO-CO2

BTO 2018.035 | March 2018 51 Aromatic amino acids as a source for nitrogen containing by-products formed by
advanced oxidation water treatment
Attachment VTryptophan and
phenylalanine N-DBPs SPE
experiment conditions
V.1 Samples tryptophan and phenylalanine N-DBPs SPE experiment
The following samples were used for the SPE experiment in duplo: UV treated + Trp + 14NO3-
sample, UV treated + Phe + 14NO3- sample and an ultrapure water sample (blank). Ten mL of
sample was diluted with 990 ml of ultrapure water prior the SPE sample pre-treatment.
V.2 AMES SPE pre-treatment protocol
For the AMES sample pre-treatment, 1L of sample was acidified to pH 2.3 using hydrochloric
acid and loaded on a 200 mg Waters OASIS HLB glass SPE cartridge (Etten-Leur, Netherlands).
Then the SPE column was dried for 1 hour by air and elution was performed with 7.5 mL of
8:2 (v/v) acetonitrile/methanol. The eluate was evaporated using a Barkey optocontrol
(Leopoldshöhe, Germany) with a gentle nitrogen stream at circa 75 oC (block temperature at
300 oC) until a volume of 250 µL was reached. In order to compare the by-products in the
samples after the AMES SPE pre-treatment with the samples that were not pre-treated, 9750
µL of ultrapure water added to the extract, so that effectively no sample enrichment had
occurred (10 mL before SPE to 10 mL after SPE). In this way, a fair comparison could be made
between the samples with and without sample pre-treatment in order to determine the
recovery of the by-products. Finally, the samples were analysed using the LC-QToF as
described in paragraph 3.2.3.

BTO 2018.035 | March 2018 52 Aromatic amino acids as a source for nitrogen containing by-products formed by
advanced oxidation water treatment
Attachment VI Confirmation of
identified N-DBPs
CONFIRMATION OF 2-METHYL-4-NITROPHENOL IN ARTIFICIAL WATER
15.0 15.5 16.0 16.5 17.0 17.5 18.00
2000
4000
6000
8000
10000
12000
16.25
15.0 15.5 16.0 16.5 17.0 17.5 18.00.0e0
2.0e5
4.0e5
6.0e5
8.0e5
1.0e6
1.2e6
1.4e616.25
50 60 70 80 90 100 110 120 130 140 150 1600
50
100
150
200
250
122.0361
152.0349
121.0293
45.9991
106.0468123.0382
50 60 70 80 90 100 110 120 130 140 150 1600
2000
4000
6000
8000
10000
12000
14000
16000
18000122.0378
152.0357
121.0293
45.9985106.0428
93.0349 123.0396
93.0329
Inte
nsity
Inte
nsit
y
Inte
nsity
Inte
nsit
yTime (min)
Time (min)
A)
B)
C)
D)
m/z
m/z
A) EIC of m/z 152.0353 in artificial water after MP UV. B) EIC of 2-methyl-4-nitrophenol reference
standard (m/z 152.0353). C) MS2 spectrum of m/z 152.0353 in artificial water after MP UV. D) MS2
spectrum of 2-methyl-4-nitrophenol reference standard.
CONFIRMATION OF 2-METHOXY-4-NITROPHENOL IN ARTIFICIAL WATER
12.0 12.5 13.0 13.5 14.0 14.5 15.00
1000
2000
3000
4000
5000
6000
7000
8000
9000
10000
1100013.40
12.0 12.5 13.0 13.5 14.0 14.5 15.00e0
1e5
2e5
3e5
4e5
5e5
6e5
7e5
8e5
9e513.43
50 60 70 80 90 100 110 120 130 140 150 160 1700
50
100
150
200
250
300
350153.0058
123.0081
95.012746.0096
168.986151.0339
50 60 70 80 90 100 110 120 130 140 150 160 1700
1000
2000
3000
4000
5000
6000
7000
8000
9000
153.0069
123.0086
95.0142
45.9976 168.030151.0276
Time (min)
Time (min)
Inte
nsity
Inte
nsit
y
A)
B)
C)
D)
Inte
nsity
Inte
nsit
y
m/z
m/z
A) EIC of m/z 168.0302 in artificial water after MP UV. B) EIC of 2-methoxy-4-nitrophenol reference
standard (m/z 168.0302). C) MS2 spectrum of m/z 168.0302 in artificial water after MP UV. D) MS2
spectrum of 2-methoxy-4-nitrophenol reference standard.
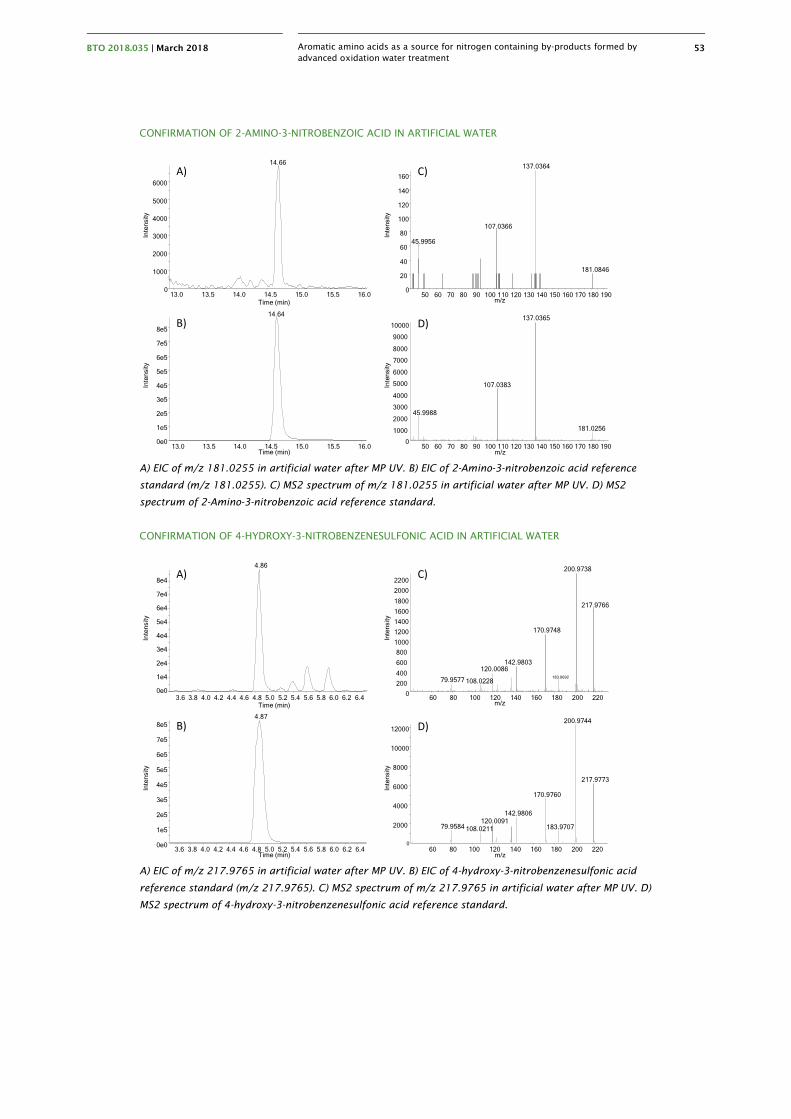
BTO 2018.035 | March 2018 53 Aromatic amino acids as a source for nitrogen containing by-products formed by
advanced oxidation water treatment
CONFIRMATION OF 2-AMINO-3-NITROBENZOIC ACID IN ARTIFICIAL WATER
13.0 13.5 14.0 14.5 15.0 15.5 16.00
1000
2000
3000
4000
5000
6000
14.66
13.0 13.5 14.0 14.5 15.0 15.5 16.00e0
1e5
2e5
3e5
4e5
5e5
6e5
7e5
8e5
14.64
50 60 70 80 90 100 110 120 130 140 150 160 170 180 1900
20
40
60
80
100
120
140
160
137.0364
107.0366
45.9956
181.0846
50 60 70 80 90 100 110 120 130 140 150 160 170 180 1900
1000
2000
3000
4000
5000
6000
7000
8000
9000
10000137.0365
107.0383
45.9988
181.0256
Inte
nsity
Inte
nsit
y
Time (min)
Time (min)
m/z
m/z
A)
B)
C)
D)
Inte
nsity
Inte
nsit
y
A) EIC of m/z 181.0255 in artificial water after MP UV. B) EIC of 2-Amino-3-nitrobenzoic acid reference
standard (m/z 181.0255). C) MS2 spectrum of m/z 181.0255 in artificial water after MP UV. D) MS2
spectrum of 2-Amino-3-nitrobenzoic acid reference standard.
CONFIRMATION OF 4-HYDROXY-3-NITROBENZENESULFONIC ACID IN ARTIFICIAL WATER
3.6 3.8 4.0 4.2 4.4 4.6 4.8 5.0 5.2 5.4 5.6 5.8 6.0 6.2 6.40e0
1e4
2e4
3e4
4e4
5e4
6e4
7e4
8e4
4.86
3.6 3.8 4.0 4.2 4.4 4.6 4.8 5.0 5.2 5.4 5.6 5.8 6.0 6.2 6.40e0
1e5
2e5
3e5
4e5
5e5
6e5
7e5
8e54.87
60 80 100 120 140 160 180 200 2200
200
400
600
800
1000
1200
1400
1600
1800
2000
2200
200.9738
217.9766
170.9748
142.9803120.0086
183.969279.9577 108.0228
60 80 100 120 140 160 180 200 2200
2000
4000
6000
8000
10000
12000200.9744
217.9773
170.9760
142.9806120.0091
79.9584 183.9707108.0211
Inte
nsity
Inte
nsit
y
Inte
nsity
Inte
nsit
y
Time (min)
Time (min)
m/z
m/z
A)
B)
C)
D)
A) EIC of m/z 217.9765 in artificial water after MP UV. B) EIC of 4-hydroxy-3-nitrobenzenesulfonic acid
reference standard (m/z 217.9765). C) MS2 spectrum of m/z 217.9765 in artificial water after MP UV. D)
MS2 spectrum of 4-hydroxy-3-nitrobenzenesulfonic acid reference standard.

BTO 2018.035 | March 2018 54 Aromatic amino acids as a source for nitrogen containing by-products formed by
advanced oxidation water treatment
Attachment VII Structural alerts reported by ECHA and the
OECD QSAR Toolbox
CAS Substance ECHA database OECD QSAR Toolbox
99-53-61 2-Methyl-4-nitrophenol
Suspected mutagen: The Toolbox profiler 'DNA alerts for AMES, MN and CA by OASIS v.1.3' gives an alert for mutagenicity; The Toolbox profiler 'in vitro mutagenicity (Ames test) alerts by ISS' gives an alert for mutagenicity; ISS Mutagenicity model in VEGA (Q)SAR platform predicts that the chemical is Mutagen (moderate reliability) Suspected carcinogen: The Toolbox profiler 'Carcinogenicity (genotox and nongenotox) alerts by ISS' gives an alert for carcinogenicity; ISS Carcinogenicity model in VEGA (Q)SAR platform predicts that the chemical is Carcinogen (moderate reliability) Suspected persistent in the environment: Ready biodegradability model (IRFMN) in VEGA (Q)SAR platform predicts that the chemical is Possible NON Readily Biodegradable (good reliability);The Danish QSAR database contains information indicating that the substance is predicted as non readily biodegradable2
DNA Binding & DNA alerts for AMES, CA and MNT by OASIS v.1.4: Radical >> Radical mechanism via ROS formation (indirect) >> Nitrophenols, Nitrophenyl Ethers and Nitrobenzoic Acids SN1 >> Nucleophilic attack after reduction and nitrenium ion formation >> Nitrophenols, Nitrophenyl Ethers and Nitrobenzoic Acids DNA Binding by OECD:SN1 >> Nitrenium Ion formation >> Aromatic nitro Carcinogenicity (genotox and nongenotox) alerts by ISS: Nitro-aromatic (Genotox) Structural alert for genotoxic carcinogenicity in vitro mutagenicity (Ames test) alerts by ISS Nitro-aromaticin vitro mutagenicity (Micronucleus) alerts by ISS Nitro-aromatic Oncologic Primary Classification Aromatic Amine Type Compounds Repeated dose (HESS) Nitrobenzenes (Hemolytic anemia with methemoglobinemia) Rank A Nitrobenzenes (Hepatotoxicity) Rank C
DNA Binding by OASIS v.1.4: Radical >> Radical mechanism via ROS formation (indirect) >> Nitrophenols, Nitrophenyl Ethers and Nitrobenzoic Acids SN1 >> Nucleophilic attack after reduction and nitrenium ion formation >> Nitrophenols, Nitrophenyl Ethers and Nitrobenzoic AcidsDNA Binding by OECD:Michael addition >> P450 Mediated Activation to Quinones and Quinone-type Chemicals >> Alkyl phenols SN1 >> Nitrenium Ion formation >> Aromatic nitro Carcinogenicity (genotox and nongenotox) alerts by ISS: Nitro-aromatic (Genotox)
CH3
N
O
O
O CH3

BTO 2018.035 | March 2018 55 Aromatic amino acids as a source for nitrogen containing by-products formed by
advanced oxidation water treatment
Structural alert for genotoxic carcinogenicity in vitro mutagenicity (Ames test) alerts by ISS Nitro-aromaticin vitro mutagenicity (Micronucleus) alerts by ISS Nitro-aromatic Oncologic Primary Classification Aromatic Amine Type Compounds Phenol Type Compounds Repeated dose (HESS) Nitrophenols/ Halophenols (Energy metabolism dysfunction) Rank B
3251-56-7 2-Methoxy-4-nitrophenol
Suspected mutagen: The Toolbox profiler 'DNA alerts for AMES, MN and CA by OASIS v.1.3' gives an alert for mutagenicity; The Toolbox profiler 'in vitro mutagenicity (Ames test) alerts by ISS' gives an alert for mutagenicity; CAESAR Mutagenicity model in VEGA (Q)SAR platform predicts that the chemical is Suspect Mutagen (moderate reliability); ISS Mutagenicity model in VEGA (Q)SAR platform predicts that the chemical is Mutagen (good reliability); KNN Mutagenicity model in VEGA (Q)SAR platform predicts that the chemical is Mutagen (moderate reliability) Suspected carcinogen: The Toolbox profiler 'Carcinogenicity (genotox and nongenotox) alerts by ISS' gives an alert for carcinogenicity; CAESAR Carcinogenicity model in VEGA (Q)SAR platform predicts that the chemical is Carcinogen (good reliability); ISS Carcinogenicity model in VEGA (Q)SAR platform predicts that the chemical is Carcinogen (good reliability) Suspected persistent in the environment: Ready biodegradability model (IRFMN) in VEGA (Q)SAR platform predicts that the chemical is Possible NON Readily Biodegradable (good reliability);The Danish QSAR database contains information indicating that the substance is predicted as non-readily biodegradable3
DNA Binding & DNA alerts for AMES, CA and MNT by OASIS v.1.4: Radical >> Radical mechanism via ROS formation (indirect) >> Nitrophenols, Nitrophenyl Ethers and Nitrobenzoic Acids SN1 >> Nucleophilic attack after reduction and nitrenium ion formation >> Nitrophenols, Nitrophenyl Ethers and Nitrobenzoic Acids DNA Binding by OECD:Michael addition >> P450 Mediated Activation to Quinones and Quinone-type Chemicals >> Hydroquinones SN1 >> Nitrenium Ion formation >> Aromatic nitro in vitro mutagenicity (Ames test) alerts by ISS Nitro-aromaticin vitro mutagenicity (Micronucleus) alerts by ISS H-acceptor-path3-H-acceptor Nitro-aromatic Carcinogenicity (genotox and nongenotox) alerts by ISS: Nitro-aromatic (Genotox) Structural alert for genotoxic carcinogenicity Oncologic Primary Classification Aromatic Amine Type Compounds Phenol Type Compounds Repeated dose (HESS) Nitrophenols/ Halophenols (Energy metabolism dysfunction) Rank B
1 OECD QSAR Toolbox reports two structures for the same CAS number
2 https://echa.europa.eu/nl/information-on-chemicals/annex-iii-inventory/-/dislist/details/AIII-100.002.512
3 https://echa.europa.eu/nl/information-on-chemicals/annex-iii-inventory/-/dislist/details/AIII-100.019.854
BTO 2018.035 | March 2018 56 Aromatic amino acids as a source for nitrogen containing by-products formed by
advanced oxidation water treatment
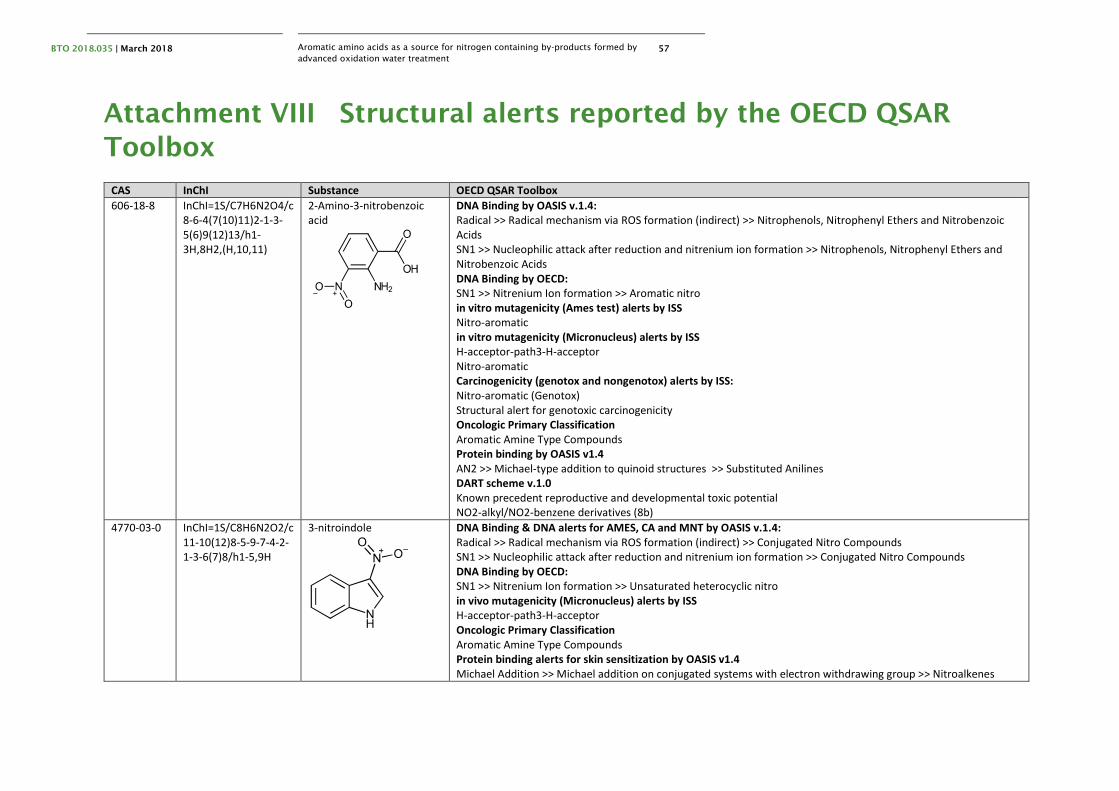
BTO 2018.035 | March 2018 57 Aromatic amino acids as a source for nitrogen containing by-products formed by
advanced oxidation water treatment
Attachment VIII Structural alerts reported by the OECD QSAR
Toolbox
CAS InChI Substance OECD QSAR Toolbox
606-18-8 InChI=1S/C7H6N2O4/c8-6-4(7(10)11)2-1-3-5(6)9(12)13/h1-3H,8H2,(H,10,11)
2-Amino-3-nitrobenzoic acid
DNA Binding by OASIS v.1.4: Radical >> Radical mechanism via ROS formation (indirect) >> Nitrophenols, Nitrophenyl Ethers and Nitrobenzoic Acids SN1 >> Nucleophilic attack after reduction and nitrenium ion formation >> Nitrophenols, Nitrophenyl Ethers and Nitrobenzoic Acids DNA Binding by OECD:SN1 >> Nitrenium Ion formation >> Aromatic nitro in vitro mutagenicity (Ames test) alerts by ISS Nitro-aromaticin vitro mutagenicity (Micronucleus) alerts by ISS H-acceptor-path3-H-acceptor Nitro-aromatic Carcinogenicity (genotox and nongenotox) alerts by ISS: Nitro-aromatic (Genotox) Structural alert for genotoxic carcinogenicity Oncologic Primary Classification Aromatic Amine Type Compounds Protein binding by OASIS v1.4 AN2 >> Michael-type addition to quinoid structures >> Substituted Anilines DART scheme v.1.0 Known precedent reproductive and developmental toxic potential NO2-alkyl/NO2-benzene derivatives (8b)
4770-03-0 InChI=1S/C8H6N2O2/c11-10(12)8-5-9-7-4-2-1-3-6(7)8/h1-5,9H
3-nitroindole DNA Binding & DNA alerts for AMES, CA and MNT by OASIS v.1.4: Radical >> Radical mechanism via ROS formation (indirect) >> Conjugated Nitro Compounds SN1 >> Nucleophilic attack after reduction and nitrenium ion formation >> Conjugated Nitro Compounds DNA Binding by OECD:SN1 >> Nitrenium Ion formation >> Unsaturated heterocyclic nitro in vivo mutagenicity (Micronucleus) alerts by ISS H-acceptor-path3-H-acceptor Oncologic Primary Classification Aromatic Amine Type Compounds Protein binding alerts for skin sensitization by OASIS v1.4 Michael Addition >> Michael addition on conjugated systems with electron withdrawing group >> Nitroalkenes

BTO 2018.035 | March 2018 58 Aromatic amino acids as a source for nitrogen containing by-products formed by
advanced oxidation water treatment
6313-34-4 InChI=1S/C6H5NO6S.Na/c8-6-2-1-4(14(11,12)13)3-5(6)7(9)10;/h1-3,8H,(H,11,12,13);/q;+1
sodium;4-hydroxy-3-nitrobenzenesulfonic acid
DNA Binding by OASIS v.1.4: Radical >> Radical mechanism via ROS formation (indirect) >> Nitrophenols, Nitrophenyl Ethers and Nitrobenzoic Acids SN1 >> Nucleophilic attack after reduction and nitrenium ion formation >> Nitrophenols, Nitrophenyl Ethers and Nitrobenzoic Acids in vivo mutagenicity (Micronucleus) alerts by ISS H-acceptor-path3-H-acceptor Oncologic Primary Classification Aromatic Amine Type Compounds Phenol Type Compounds Estrogen Receptor Binding Strong binder, OH group Repeated dose (HESS) Benzene/ Naphthalene sulfonic acids (Less susceptible) Rank C Nitrophenols/ Halophenols (Energy metabolism dysfuntion) Rank B
616-85-3 In OECD QSAR Toolbox database
4-hydroxy-3-nitrobenzenesulphonic acid
BTO | September 2017 59 Investigation of aromatic amino acids as a source for nitrogen containing by-
products formed by advanced oxidation water treatment
Attachment IX Materials &
Methods LC-QToF N-DBPs target
method
IX.1 Chemicals
All solvents used were of analytical grade quality. Acetonitrile and methanol (ultra gradient
HPLC grade) was obtained from Avantor Performance Materials B.V. (Deventer, the
Netherlands). Formic acid (HPLC quality) and hydrochloric acid 30% suprapur were purchased
from Sigma-Aldrich (Steinheim, Germany) and Merck (Darmstadt, Germany), respectively. The
internal standards 4-nitrophenol and neburon were obtained from Sigma-Aldrich and
bentazon-d6 was obtained from LGC Standards GmbH (Wesel, Germany). The following N-
DBPs were purchased from Sigma-Aldrich, 4-nitrophenol, 4-nitrocatechol, 2-hydroxy-5-
nitrobenzoic acid, 5-nitrovanillin, 4-nitrophthalic acid, 2,4-dinitrophenol, 4-hydroxy-3-
nitrobenzoic acid, 2-hydroxy-3-nitrobenzoic acid, dinoterb, 3,5-dinitrosalicylic acid, 2-
methyl-4-nitrophenol, 2-methoxy-4-nitrophenol and 2-amino-3-nitrobenzoic acid. 2-methoxy-
4,6-dinitrophenol and 4-hydroxy-3-nitrobenzenesulfonic acid were obtained from Vitas-M
laboratory (Moscow, Russia). 4-nitro-1,3-benzenediol was purchased from Santa Cruz
Biotechnology. 2-nitrohydroquinone and 3-nitroindole were obtained from Chemos GmbH
(Regenstauf, Germany) and Oxchem (Wood Dale, IL, USA), respectively. 4-
nitrobenzenesulfonic acid was obtained from TCI Europe (Zwijndrecht, Belgium).Ultrapure
water was obtained by purifying demineralized water in an Elga Purelab Chorus ultrapure
water system. (High Wycombe, United Kingdom). Stock solutions of the reference and
internal standards were prepared in methanol and ultrapure water (20/80% v/v) at a
concentration of 100 and 50 mg/L, respectively. Stock solutions were stored at -25 oC.
IX.2 Sample pre-treatment
For the sample pre-treatment, 500 mL of sample was acidified to pH 2.3 using hydrochloric
acid and was loaded onto a SPE cartridge (OASIS HLB, 200 mg, glass, 6 cc) obtained from
Waters (Etten-Leur, Netherlands). Then the SPE column was dried for 1 hour by air and
elution was performed with 7.5 mL of 8:2 (v/v) acetonitrile/methanol. The eluate was
evaporated using a Barkey optocontrol (Leopoldshöhe, Germany) with a gentle nitrogen
stream at circa 75 oC (block temperature at 300 oC) until a volume of 250 µL was reached.
Then 750 µL ultrapure water was added to extract, containing nitrophenol-d4, bentazon-d6
and neburon internal standards at a concentration of 13.33 µg/L. Then the extracted was
filtered using a 0.2 µm Phenomenex Phenex regenerated cellulose filter (Utrecht,
Netherlands) and was transferred to a 1.8 mL autosampler vial for LC-QToF analysis.
IX.3 LC-QTOF analysis
HPLC settings (Shimadzu Nexera; LC-30AD, SIL-30AC, CTO-20AC):
Column: Waters Xbridge C18 XP, 2.1 x 150 mm, 2.5 µm
Mobile phase A: ultrapure water + 0.05% formic acid
Mobile phase B: acetonitrile + 0.05% formic acid
Gradient: linear from 5% to 100% B in 40 min. Held at 100% B for 5 min. Then return
to initial conditions in 1 min and held for 6 min.
Flow: 300 µL/min
Injection volume: 10 µL

BTO | September 2017 60 Investigation of aromatic amino acids as a source for nitrogen containing by-
products formed by advanced oxidation water treatment
Column oven temperature: 25oC
QToF-MS settings (AB SCIEX TripleTOF 5600+):
Resolution: > 30.000 @ m/z 400 (MS and MS/MS mode)
Mass accuracy < 5 ppm
Mass range Full scan: 120-500 Da
Mass range MS2 scan: 40-460 Da
Ionisation: negative mode
Source: electrospray (ESI)
TurboIonSpray heater: 500oC
Ion Spray Voltage: 3000 volt
Curtain gas: 25 psi
Gas 1: 40 psi
Gas 2: 50 psi
Divert valve:0 - 3.0 min to waste
Collision energy: 20, 35, 50 eV (averaged)
Data dependant MS/MS scans: 8 per cycle (50ms), threshold 100 counts and dynamic
background subtraction.
MS/MS inclusion list, see table below
MS/MS INCLUSIONLIST (2 MINUTE WINDOW)
Mass
(Da)
Retention time
(min)
213.0153 15.56
138.0197 12.95
154.0146 10.46
182.0100 13.56
196.0252 12.68
210.0040 8.46
183.0047 15.10
154.0146 13.04
154.0146 11.25
201.9816 6.31
182.0095 11.32
192.0095 10.97
239.0673 26.68
226.9946 14.69
152.0353 16.26
168.0302 13.40
217.9765 4.83
181.0255 14.64
161.0357 16.18

BTO | September 2017 61 Investigation of aromatic amino acids as a source for nitrogen containing by-
products formed by advanced oxidation water treatment
Attachment X Result monitoring
study
RESULTS MONITORING STUDY - AERATED RECLAIMED DUNE INFILTRATION WATER SAMPLE
Compound Aerated reclaimed dune infiltration water
27/07/16 05/09/16 21/09/16 20/10/16 21/11/16 14/12/16 11/01/17
ng/L ng/L ng/L ng/L ng/L ng/L ng/L
2-Methoxy-4,6-dinitrophenol < 1.0 < 1.0 < 1.0 < 1.0 < 1.0 < 1.0 < 1.0
4-Nitrophenol < 5.0 < 5.0 < 5.0 < 5.0 < 5.0 < 5.0 < 5.0
4-Nitrocatechol < 2.0 < 2.0 < 2.0 < 2.0 < 2.0 < 2.0 < 2.0
2-Hydroxy-5-nitrobenzoic acid < 2.0 < 2.0 < 2.0 < 2.0 < 2.0 < 2.0 < 2.0
5-Nitrovanillin < 1.0 < 1.0 < 1.0 < 1.0 < 1.0 < 1.0 < 1.0
4-Nitrophthalic acid < 10 < 10 < 10 < 10 < 10 < 10 < 10
2,4-Dinitrophenol < 1.0 < 1.0 < 1.0 < 1.0 < 1.0 < 1.0 < 1.0
4-Nitro-1,3-benzenediol < 2.0 < 2.0 < 2.0 < 2.0 < 2.0 < 2.0 < 2.0
2-Nitrohydroquinone < 5.0 < 5.0 < 5.0 < 5.0 < 5.0 < 5.0 < 5.0
4-Nitrobenzenesulfonic acid < 3.0 < 3.0 < 3.0 < 3.0 < 3.0 < 3.0 < 3.0
4-Hydroxy-3-nitrobenzoic acid < 2.0 < 2.0 < 2.0 < 2.0 < 2.0 < 2.0 < 2.0
2-Hydroxy-3-nitrobenzoic acid < 2.0 < 2.0 < 2.0 < 2.0 < 2.0 < 2.0 < 2.0
Dinoterb < 2.0 < 2.0 < 2.0 < 2.0 < 2.0 < 2.0 < 2.0
3,5-Dinitrosalicylic acid < 3.0 < 3.0 < 3.0 < 3.0 < 3.0 < 3.0 < 3.0
2-Methyl-4-nitrophenol < 1.0 < 1.0 < 1.0 < 1.0 < 1.0 < 1.0 < 1.0
2-Methoxy-4-nitrophenol < 3.0 < 3.0 < 3.0 < 3.0 < 3.0 < 3.0 < 3.0
4-Hydroxy-3-
nitrobenzenesulfonic acid < 2.0 < 2.0 < 2.0 < 2.0 < 2.0 < 2.0 < 2.0
2-Amino-3-nitrobenzoic acid < 2.0 < 2.0 < 2.0 < 2.0 < 2.0 < 2.0 < 2.0
3-Nitroindole < 2.0 < 2.0 < 2.0 < 2.0 < 2.0 < 2.0 < 2.0
Summed concentration 0.0 0.0 0.0 0.0 0.0 0.0 0.0