concentration of research funding leads to decreasing … · et al. (2004) reported that one of the...
TRANSCRIPT

Concentration of research funding leads to decreasing marginal
returns
Philippe Mongeon1, Christine Brodeur2, Catherine Beaudry3 and Vincent Larivière1,4
1École de bibliothéconomie et des sciences de l’information, Université de Montréal
C.P. 6128, Succ. Centre-Ville, Montréal, QC. H3C 3J7 Canada
2Bibliothèque, École Polytechnique de Montréal
C.P. 6079, Succ. Centre-Ville, Montréal, QC. H3C 3A7 Canada
3Département de mathématiques et de génie industriel, École Polytechnique de Montréal
C.P. 6079, Succ. Centre-Ville, Montréal, QC. H3C 3A7 Canada
Centre Interuniversitaire de Recherche sur la Science et la Technologie (CIRST)
Université du Québec à Montréal
CP 8888, Succ. Centre-Ville, H3C 3P8 Montreal, Qc. (Canada)
4Observatoire des Sciences et des Technologies (OST), Centre Interuniversitaire de Recherche sur la Science et
la Technologie (CIRST), Université du Québec à Montréal
CP 8888, Succ. Centre-Ville, H3C 3P8 Montreal, Qc. (Canada)
Corresponding author
Philippe Mongeon [email protected]
Acknowledgements
This work is funded by the Canada Research Chairs program, as well as by the Social Sciences and Humanities
Research Council of Canada. The authors also wish to thank the two anonymous referees for their useful
comments and suggestions.

Abstract
In most countries, basic research is supported by research councils that select, after peer
review, the individuals or teams that are to receive funding. Unfortunately, the number of
grants these research councils can allocate is not infinite and, in most cases, a minority of the
researchers receive the majority of the funds. However, evidence as to whether this is an
optimal way of distributing available funds is mixed. The purpose of this study is to measure
the relation between the amount of funding provided to 12,720 researchers in Québec over a
fifteen year period (1998-2012) and their scientific output and impact from 2000 to 2013. Our
results show that both in terms of the quantity of papers produced and of their scientific
impact, the concentration of research funding in the hands of a so-called ‘elite’ of researchers
generally produces diminishing marginal returns. Also, we find that the most funded
researchers do not stand out in terms of output and scientific impact.
Introduction
In most countries, basic research is supported by governmental research councils that select,
after peer review, the individuals or teams that are to receive funding. In Québec, for example,
70.5% of external research funding comes from three provincial and three national research
councils (Robitaille & Laframboise 2013). Unfortunately, the budgets of these research
councils are limited and, thus, a large proportion of grant proposals—as well as scholars—
remain unfunded. For example, a previous study showed that 20% to 45% of Québec’s
researchers, depending on the discipline, had no external funding between 1999 and 2006
(Larivière et al. 2010). Along these lines, national scientific agencies, including the National
Science Foundation (NSF – United States) and the Canadian Institutes of Health (CIHR) tend
to give fewer grants of a higher value, which leads to high rejection rates (Joós 2012; CIHR
2012; NSF 2013) as well as to an increased concentration of available funds in the hands of a
few researchers. More specifically, 10% of the researchers funded by the Social Sciences and
Humanities Research Council of Canada (SSHRC) accumulate 80% of available funds, 10%
of those funded by the Canadian Institutes of Health Research (CIHR) obtain 50% of the
funds, and 10% of those funded by the NSERC accumulate 57% of the funds1. The situation is
similar in Québec when we combine funding from the national and provincial agencies: 20%
of researchers obtain 80% of the funds in social sciences and humanities (SSH), 50% of the
funds in health, and 57% of the funds in natural sciences and engineering (NSE) (Larivière et
al. 2010).
In an attempt to ensure that the funds are effectively used, the NIH started doing special
analyses of applicants who are already receiving more than one million dollars in grants. At
the National Institute of General Medical Sciences (NIGMS), this practice of special review
for researchers who are already holding a large sum of funding has been going on for more
than 20 years (Berg 2012). Still, with a few researchers receiving most of the funds available
and many not receiving any, it seems legitimate to ask whether this concentration of funds
leads to better collective gains than funding policies that promote a more even distribution of
funding.
1 Data compiled by the Observatoire des Sciences et Technologies (OST) using results of competition for each of
the councils, and the Almanac of Post-Secondary Education in Canada, of the Canadian Association of
University Teachers.

This study aims to contribute to the discussion on the optimal level of research funding by
analysing the relationship between all funding received by all of Québec’s researchers over a
period of 15 years (1998-2012) and their research output and impact from 2000 to 2013. More
specifically, it aims at answering two questions: 1) how do research productivity and
scientific impact of individual researchers vary with the amount of funding they receive? 2) is
this variation similar in the three general fields of science that are health, natural sciences and
engineering, and social sciences?
Theoretical framework
The scientific community is a field (i.e. a social space) involving agents that share a common
goal (the production of knowledge) and compete against each other for their peers’
recognition (Bourdieu 1976). In order to work efficiently (i.e., to maximise knowledge
production), the scientific community developed a reward system which provides different
forms of recognition to scientists who best achieved this goal (Merton 1957). This results in a
social stratification of the scientific community (Cole & Cole 1973), which in turns leads to
what Zuckerman (1998) described as an effect of accumulation of advantages and
disadvantages. This process starts at the very beginning of scientists’ careers, as those with
the most potential are given more resources (e.g., obtain scholarships, get accepted in
prestigious departments, etc.) which will have both short and long term effects on their
scientific career and thus will help acquire even more resources. When such a system is
working optimally, it should yield exponential returns in terms of knowledge production since
the best researchers have more resources and can, moreover, use them more efficiently than
their colleagues with fewer resources (Zuckerman 1998). If we consider research funding, the
reward system should, in theory, give more resources to the best researchers who will, in turn,
produce more or better output.
However, some elements within of the reward system itself may have a negative impact on its
efficiency, one of them being the Matthew effect described by Merton (1968). As highlighted
by Laudel (2005), funding decisions are based not only on the quality of the research proposal
but also on the quality of the researchers, which is to a large extent assessed by the
researcher’s past accomplishments. We may thus wonder if, and to what extent, research
funding becomes less of an instrumental reward, geared towards maximizing knowledge
production, and more of an honorific reward. According to Schmoch & Schubert (2009), this
shift is a consequence of the growing scarcity of research funds.
Also, in practice, a number of factors (e.g., limited time, administrative and teaching
responsibility) may limit individual researchers’ productivity, so that such exponential returns
can hardly be expected. Larger projects requiring more resources and more people may also
require more coordination effort, and getting more funding also requires spending more time
writing grant proposals. Thus, we might expect that lower amounts of funding will yield
greater returns in terms of scientific output and impact, and that these returns will start
decreasing with higher amounts of funding.
Literature review
Despite the central role of research funding in the current research system, its relation to
research outcomes has not been extensively studied. Some studies have looked at the
influence of funding—using funding acknowledgements as an indicator—on the scientific

impact of articles. For instance, Zhao (2010) analysed a small sample of articles published in
7 core LIS journal and found that funded articles had, in general, a higher impact and, on
average, were cited faster than non-funded articles. She, however, observed that the two most
cited articles did not disclose any funding. A similar study using a subset of Iranian
publication concluded that the average citation rate of funded articles (as determined by
acknowledgements) is higher than that of unfunded papers (Jowkar et al. 2011). Other studies
have examined the impact and productivity of scientists who see their application granted
versus the ones whose applications are rejected. Two studies, one from Canada (Campbell et
al. 2010) and the other from the Netherlands (van Leeuwen & Moed 2012), found that
researchers who receive a grant tend to have higher citation impact than applicants who did
not receive funding. A third study, focused more on research productivity than scientific
impact, found that professors with external funding published more than the ones with no
external funding (Gulbrandsen and Smeby 2005). These studies suggest that receiving
funding has a positive effect on a researcher’s scientific output.
Other studies have investigated the relationship between the amount of funding received and
research productivity and scientific impact, first at high levels of aggregation. Towards the
end of the 1970’s, the relationship between R&D expenditure and the number of papers was
investigated at the level of universities, for 11 different fields (McAllister and Wagner 1981).
A strong indication of a linear relationship was found. In the 1990’s, Moed and colleagues
(1998) analysed the productivity of Flemish university departments, finding that those with
the highest externally funded capacity2 had a strong decrease in publication productivity.
More recently, the effect of the amount of funding was studied at the individual level. Heale
et al. (2004) reported that one of the strongest determinants of the number of papers published
was the amount of funding received. Moreover, they concluded that an increase in funding
was associated with an increase in the number of articles, but not proportionally. Nag et al.
(2013) reached a similar conclusion regarding the number of publications after studying a
sample of 720 American bioscientists. More precisely, the authors calculated that increasing a
laboratory’s budget by 10% lifts article output by only 7.5%, thus suggesting decreasing
marginal returns. Fortin and Currie (2013) also found decreasing marginal returns when they
looked at the number of publications of Canadian researchers in Integrative Animal Biology,
Inorganic & Organic Chemistry and Evolution & Ecology who received NSERC funding.
Along these lines, Berg (2010) observed that the number of publications of NIGMS grantees
did not increase linearly with the amount of funding they received, but rather appeared to
reach a plateau (Berg 2010). Lastly, a few studies discussing the validity of external funding
as an indicator to evaluate researchers have also found that the output typically rises with
funding until a point where it reaches a plateau and eventually starts decreasing (e.g., Laudel
2005; Schmoch & Schubert 2009; Schmoch et al. 2010). For low values of third-party funds,
increasing them also increases efficiency. However, when the funding reaches a certain
threshold value, its efficiency stops increasing and starts decreasing (Schmoch & Schubert
2009). On the whole, evidence on the relationship between research funding and various
output of research does not converge—mainly because of different methods used and
population studied—although many papers seem to suggest that the relationship between
funding and research outputs is not linear.
2 Moed et al (1998) define the research capacity as the number of full-time equivalents (FTE) spent on scientific
research, the externally funded research capacity being funded by external sources (i.e. other than the
researchers’ basic allowance).

Data
Data on funding for all Québec’s academic researchers from 1998 to 2012 were obtained from
the Information System on University Research (SIRU), an administrative database from the
Québec provincial government that covers all funded research in Québec’s universities.
Access to this data was provided by the Observatoire des sciences et des technologies (OST).
The funding data includes different types of funding (e.g., grants, contracts and internal
funding), but we chose to include only grants as they represent the bulk of university funding
and are awarded through peer-review. Those grants were given out by more than 900 hundred
organizations and amounted to $8.1 Billion, most funds (about 50%) being given out by the
three Federal research councils of Canada (the Social Sciences and Humanities Research
Council [SSHRC], the Natural Sciences and Engineering Research Council [NSERC] and the
Canadian Institutes of Health Research [CIHR]), as well as the three research councils in
Québec (The Fonds de recherche du Québec – Société et culture [FRQ-SC], the Fonds de
recherche du Québec – Nature et Technologie [FRQ-NT] and the Fonds de recherche du
Québec – Santé [FRQ-S]).
Publication data for each researcher were obtained from Thomson Reuters’ Web of Science
for the 2000-2013 period. The Web of Science data was also provided by the OST, which
maintains up to date disambiguated publication data for all Québec researchers since 2000.
Then, researchers were divided into four broad research disciplines: Arts and Humanities
(AH), Social Sciences (SS), Natural Sciences and Engineering (NSE) and Health. Researchers
were associated with the discipline in which most of their papers are published. Researchers
for which no publications were found as well as those with the same number of publications
in two or more disciplines were categorized according to their department. We decided to
exclude AH researchers from our analysis considering the poor coverage of Arts and
Humanities publications in the Web of Science described in previous studies (e.g., Larivière
et al. 2006; Mongeon & Paul-Hus 2015). Therefore, this paper focuses on the remaining three
disciplines: SS, NSE and Health. The number of researchers in each field, as well as the total
number of papers and citations, is shown in Table 1. For each researcher, we calculated the
total amount of funding received. The total funds attributed to each project were divided by
the number of researchers on the application, each of them receiving an equal share.
Three indicators were used to measure research outcomes of researchers: the total number of
articles, the average relative citations (ARC) and the number of top cited articles (top 10%
most cited in the sub-discipline). The ARC of individual papers is calculated by dividing the
number of citations received by the paper by the average number of citations received by all
papers of the same sub-discipline published in the same year. The sub-discipline is defined by
the journal in which the paper is published, and the journal classification is based on the NSF
classification which contains 144 sub-disciplines. This allows us to account for the time of
publication and disciplinary differences in terms of citations. The amount of funding received
as well the five outcome indicators were annualized to be able to compare researchers who
were not active at the same time over the 1998 and 2013 period. To do this, we looked at the
year of researchers’ first grant and the year of their first publication. The earliest of these two
years was considered the first active year of the researcher. For example, if a researcher
received his first grant in 2002 and published an article in 1999, he or she was considered
active since 1999. Similarly, researchers were considered active until the year of their last
publication or grant. The number of researchers, papers and citations included in our dataset is
shown in Table 1.
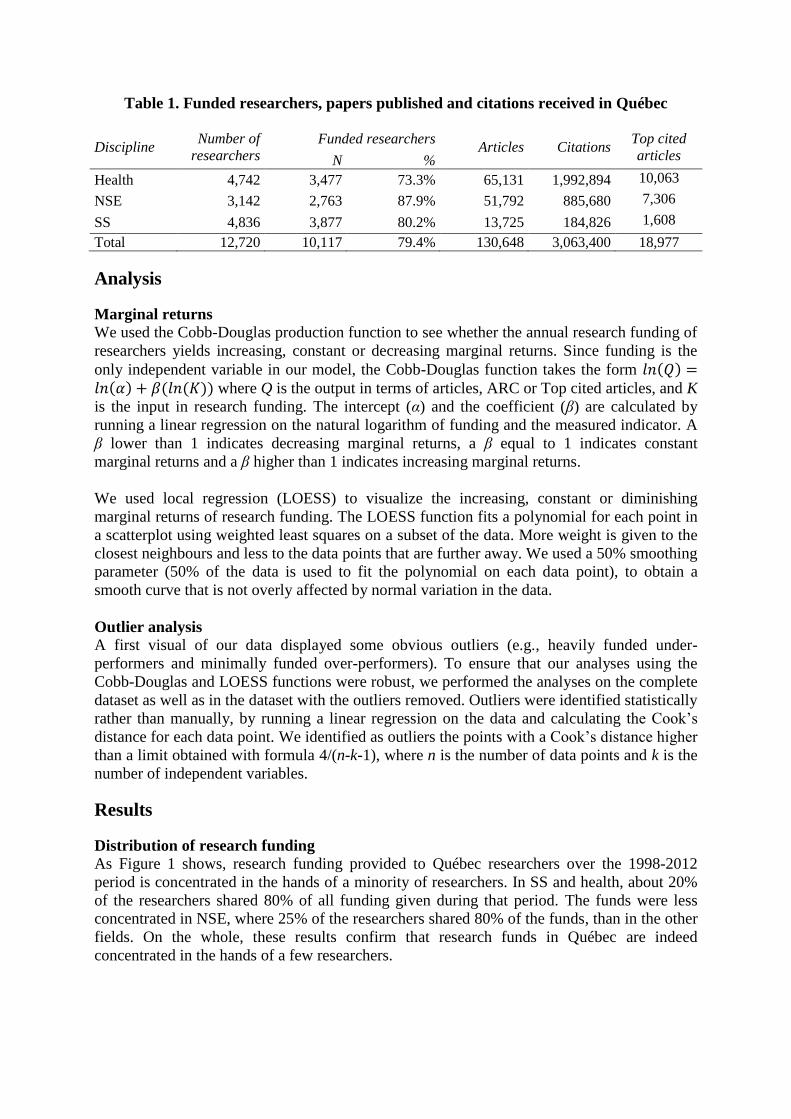
Table 1. Funded researchers, papers published and citations received in Québec
Discipline Number of
researchers
Funded researchers Articles Citations
Top cited
articles N %
Health 4,742 3,477 73.3% 65,131 1,992,894 10,063
NSE 3,142 2,763 87.9% 51,792 885,680 7,306
SS 4,836 3,877 80.2% 13,725 184,826 1,608
Total 12,720 10,117 79.4% 130,648 3,063,400 18,977
Analysis
Marginal returns
We used the Cobb-Douglas production function to see whether the annual research funding of
researchers yields increasing, constant or decreasing marginal returns. Since funding is the
only independent variable in our model, the Cobb-Douglas function takes the form 𝑙𝑛(𝑄) =𝑙𝑛(𝛼) + 𝛽(𝑙𝑛(𝐾)) where Q is the output in terms of articles, ARC or Top cited articles, and K
is the input in research funding. The intercept (α) and the coefficient (β) are calculated by
running a linear regression on the natural logarithm of funding and the measured indicator. A
β lower than 1 indicates decreasing marginal returns, a β equal to 1 indicates constant
marginal returns and a β higher than 1 indicates increasing marginal returns.
We used local regression (LOESS) to visualize the increasing, constant or diminishing
marginal returns of research funding. The LOESS function fits a polynomial for each point in
a scatterplot using weighted least squares on a subset of the data. More weight is given to the
closest neighbours and less to the data points that are further away. We used a 50% smoothing
parameter (50% of the data is used to fit the polynomial on each data point), to obtain a
smooth curve that is not overly affected by normal variation in the data.
Outlier analysis
A first visual of our data displayed some obvious outliers (e.g., heavily funded under-
performers and minimally funded over-performers). To ensure that our analyses using the
Cobb-Douglas and LOESS functions were robust, we performed the analyses on the complete
dataset as well as in the dataset with the outliers removed. Outliers were identified statistically
rather than manually, by running a linear regression on the data and calculating the Cook’s
distance for each data point. We identified as outliers the points with a Cook’s distance higher
than a limit obtained with formula 4/(n-k-1), where n is the number of data points and k is the
number of independent variables.
Results
Distribution of research funding As Figure 1 shows, research funding provided to Québec researchers over the 1998-2012
period is concentrated in the hands of a minority of researchers. In SS and health, about 20%
of the researchers shared 80% of all funding given during that period. The funds were less
concentrated in NSE, where 25% of the researchers shared 80% of the funds, than in the other
fields. On the whole, these results confirm that research funds in Québec are indeed
concentrated in the hands of a few researchers.

Figure 1. Distribution of research funds among all researchers (1998-2012)
Since we used articles published before 2013, our results could be affected if a
disproportionately large amounts of funding had been awarded in recent years when the full
output from those grants (in terms of both productivity and impact) will not yet have been
achieved. Thus, we looked the evolution of the total amount of grants received by Québec’s
researchers over the 1998-2012 period (Figure 2). We observe that funding in Health as
greatly increased between 1998 and 2005, and has been relatively stable since then. In NSE,
we observe a steady increase, going from 81 to 239 million $CAN over the same period. SS
researchers received less funding than their colleagues in Health and NSE. Their total funding
increased from 33 to 72 million $CAN between 1998 and 2004 and has been stable since
then.
Figure 2. Total amount of funding by discipline (1998-2012)
We also looked at the 50 largest grants in each field to see if a larger share of them were
obtained in the 2010-2013 period. Since it was not the case, it seems reasonable to conclude
that the possibly missing output from grants awarded in the last years of the period will not
affect our results.
Marginal returns of research funding
The results of the Cobb-Douglas function used to determine whether increased research
funding yields increasing, constant or decreasing marginal returns, are shown in Table 2. It
provides the results in terms of the number of articles, the ARC and the number of top cited
0%
20%
40%
60%
80%
100%
Pro
po
rtio
n o
f fu
nd
sHealth
0%
20%
40%
60%
80%
100%
Proportion of researchers
NSE
0%
20%
40%
60%
80%
100%
SS
0
50
100
150
200
250
300
350
400
450
To
tal f
un
din
g in
mill
ion
Can
$
Health
NSE
SS

articles for each field, as well as for both the complete data set and the data set without
outliers.
Table 2. Relation between the amount of funding and the research output and impact as
measured by the Cobb-Douglas production function.
For the complete dataset, the coefficients are all below 1, which means that, in each field and
for each indicator, research funding yields decreasing marginal returns. Furthermore, this
decrease is quite sharp given that the values of the coefficients are very small, ranging from
0.079 for the top 10% most cited articles in social sciences to 0.321 for the number of articles
in Natural Sciences and Engineering. However, outliers appear to have and important effect
on these coefficients, especially in NSE and Health. Indeed, while we can still observe
coefficients below 1 for most indicators once we remove the outliers, the coefficient are much
higher for those fields, and it even becomes positive for top cited articles in NSE. Thus, in this
field, the decreasing marginal returns observed in terms of top cited articles might be caused
by the presence of highly influential outliers, who obtain a lot of funding and publish an
important number of important papers.
Figure 3 shows the scatterplots with a fitted a LOESS curve for each field and indicator. It
excludes outliers, as they affect the trends. However, the outlier themselves might provide
interesting insights on the relation between funding and performance, which will be discussed
later in the paper. The distribution of the points on the graphs show a few interesting
elements. First, the points are very densely concentrated on the left of the y-axis, and the
density decreases as the funding increases. This is coherent with the funding landscape
presented above, with most researchers obtaining relatively small amounts of funding, and
around 20% obtaining no funding at all. Another interesting element is that researchers who
get the highest scores for each indicator are also situated on the left of the y-axis. Conversely,
apart from a few exception, researchers who receive large amounts of funding do not appear
to get particularly high scores. Also, the scatterplots show a high variability in the indicators
at any level of funding, which suggest that the performance of researchers depends only
partially on the funding they receive and that other factors are likely to play an important role.
N Coefficient Standard Error t Stat P-Value N Coefficient Standard Error t Stat P-Value
Intercept -2.723 0.052 -52.451 0.000 -4.355 0.216 -20.186 0.000
Funding 0.252 0.005 48.845 0.000 0.404 0.021 19.144 0.000
Intercept -3.053 0.052 -58.187 0.000 -3.493 0.222 -15.709 0.000
Funding 0.233 0.005 44.602 0.000 0.273 0.022 12.676 0.000
Intercept -6.065 0.057 -106.299 0.000 -10.351 0.317 -32.608 0.000
Funding 0.240 0.006 42.370 0.000 0.643 0.031 20.705 0.000
Intercept -4.049 0.087 -46.566 0.000 -10.214 0.402 -25.432 0.000
Funding 0.321 0.009 37.112 0.000 0.924 0.040 23.289 0.000
Intercept -4.691 0.095 -49.498 0.000 -10.567 0.458 -23.076 0.000
Funding 0.295 0.009 31.359 0.000 0.868 0.045 19.230 0.000
Intercept -7.335 0.103 -71.108 0.000 -17.351 0.509 -34.059 0.000
Funding 0.242 0.010 23.569 0.000 1.220 0.050 24.239 0.000
Intercept -6.123 0.071 -86.189 0.000 -10.425 0.398 -26.222 0.000
Funding 0.192 0.008 24.999 0.000 0.644 0.043 14.842 0.000
Intercept -6.554 0.073 -89.714 0.000 -11.496 0.412 -27.935 0.000
Funding 0.197 0.008 24.856 0.000 0.718 0.045 16.077 0.000
Intercept -8.521 0.047 -182.785 0.000 -11.521 0.252 -45.729 0.000
Funding 0.079 0.005 15.599 0.000 0.380 0.027 13.844 0.000
NSE
Articles
ARC
Top cited
articles
Complete data set
Articles
ARC
Top cited
articles
Health
SS
Articles
ARC
Top cited
articles
4836
4836
4836
3142
4706
4742
4742
4742
3142
3142
3082
3066
3082
4705
4723
Without outliers
4570
4657
4579
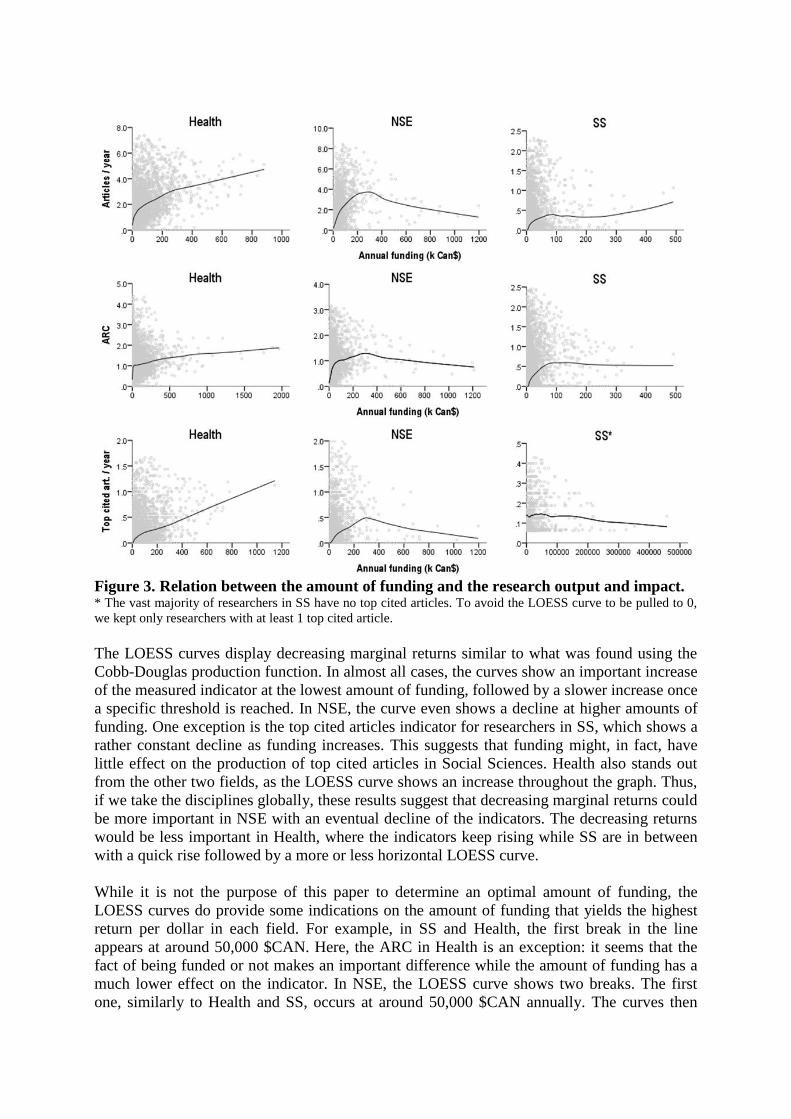
Figure 3. Relation between the amount of funding and the research output and impact. * The vast majority of researchers in SS have no top cited articles. To avoid the LOESS curve to be pulled to 0,
we kept only researchers with at least 1 top cited article.
The LOESS curves display decreasing marginal returns similar to what was found using the
Cobb-Douglas production function. In almost all cases, the curves show an important increase
of the measured indicator at the lowest amount of funding, followed by a slower increase once
a specific threshold is reached. In NSE, the curve even shows a decline at higher amounts of
funding. One exception is the top cited articles indicator for researchers in SS, which shows a
rather constant decline as funding increases. This suggests that funding might, in fact, have
little effect on the production of top cited articles in Social Sciences. Health also stands out
from the other two fields, as the LOESS curve shows an increase throughout the graph. Thus,
if we take the disciplines globally, these results suggest that decreasing marginal returns could
be more important in NSE with an eventual decline of the indicators. The decreasing returns
would be less important in Health, where the indicators keep rising while SS are in between
with a quick rise followed by a more or less horizontal LOESS curve.
While it is not the purpose of this paper to determine an optimal amount of funding, the
LOESS curves do provide some indications on the amount of funding that yields the highest
return per dollar in each field. For example, in SS and Health, the first break in the line
appears at around 50,000 $CAN. Here, the ARC in Health is an exception: it seems that the
fact of being funded or not makes an important difference while the amount of funding has a
much lower effect on the indicator. In NSE, the LOESS curve shows two breaks. The first
one, similarly to Health and SS, occurs at around 50,000 $CAN annually. The curves then

keep rising until they reach a point where they start decreasing, at around 300,000 $CAN
annually. Some potential explanations for this specificity of NSE are provided in the
discussion below.
Discussion
Our results show that funding is strongly related with the research productivity and scientific
impact of individual researchers, although there are decreasing marginal returns for most of
the indicators. Indeed, the number of articles, the average relative citations and the number of
top cited articles showed a non-proportional increase with an increase in funding, until a
certain point where they start to decrease. Moreover, when both inputs and outputs increase,
the growth of outputs is not proportional to that of inputs, and decreasing marginal returns can
be observed in that part of the LOESS curve. For the average relative citation rates (ARC), we
observe a rapid growth until a plateau is reached. This also implies decreasing marginal
returns.
Most of the results presented above did not include outliers because of their potentially high
influence on the trends observed. However, outliers provide important insights on the
relationship between funding and outcomes. For example, many of the outliers were the most
funded researchers in their field. More specifically, the 20 most funded researchers (who
shared 13% of the total funding in their field over the whole 15 years period) in Health were
kept out of the analysis, same for the 20 most funded scholars in NSE and SS, who shared
22% and 14% of the total funding in the field, respectively. On average these outliers received
27 times, 40 times and 32 times more funding than the rest of the researchers in Health, NSE
and SS respectively, yet they “only” published on average 6, 5 and 19 times more than their
average colleague. Moreover, from a scientific impact point of view, the 20 most funded
scholars in Health and SS obtained citation rates that are respectively 1.68 and 1.15 times
greater than the average scholar of their discipline, while they had on average a slightly lower
ARC (0.732) than their average colleague (0.786) in NSE. On the other hand, many
researchers with low funding but high output or impact were also identified as outliers. These
two groups of outliers help to highlight the fact that having a lot of funding does not
necessarily lead to a higher output or impact and that even researchers with low amounts of
funding can achieve a high level of output and impact. Hence, at least from a bibliometric
standpoint, this concentration of research funding in the hands of a minority of researchers
brings no clear collective advantages in terms of output and impact, suggesting that such
funding policies might not be efficient. Indeed, as decreasing marginal returns are observed,
one may wonder what could justify awarding millions of dollars to a few researchers while
many others receive nothing. Thus, in terms of funding policy, our results, along with those of
Fortin and Currie (2013), support an approach where a higher number of smaller grants are
given to a higher number of researchers rather than one where the funds are concentrated
among a minority of researchers who obtain very large grants.
There are many factors that could explain some of the decreasing marginal returns observed.
One of them might be a change in the amount of time researchers have to spend on tasks other
than research. For instance, one might argue that drafting grant proposals takes time and that
obtaining higher amounts of funding might require researchers to spend more time writing
grant proposals and less time performing research. Furthermore, highly funded researchers
might be leading larger projects that require more coordination effort and time, which also
reduce the amount of time left to do research. Moed et al. (1998) observed, in the 1980s, a
decrease in the number of publications from Flemish universities that had the strongest

increase in competitively acquired funding. They suggest that this might be because highly
funded departments attract a large number of young scientists, which may require more
supervision from the departments’ senior scientists. This reduces the time such experienced
researchers (i.e. potentially more productive) spend on research, therefore decreasing their
output. Similarly, Moed et al. (1998), pointed out that young foreign scientists were more
likely to work in the highly funded departments. They suggested that those scientists were
typically visiting for short periods and mostly for learning rather than publishing articles,
which might, in turn, result in lower time for research for senior researchers because of their
supervisory role. Some research projects may also require important investments in
equipment or infrastructure, which do not necessarily lead to an increased output or impact.
However, this factor should have little effect on the results of this study because, in Canada,
infrastructure investments are typically funded by a specific organisation (Canadian
Foundation for Innovation), and those grants were not included in our data. Furthermore, as
Laudel (2005) suggests, the quality of a research proposal and the past performance of a
researcher do not guarantee the success of external funding, which is also determined by
factors that have little to do with quality and performance. Therefore, while receiving funding
does provide researchers with the means to carry on their research projects, it does not
guarantee that they will succeed at achieving publishable results. Also, a research project may
simply be failing despite researchers asking for more and more funds to make it succeed.
Another possibility is that, as we hypothesised, there is a Matthew effect in research funding.
In a context where competition for research funding and the concentration of funds are both
increasing, researchers who have acquired the esteem of their community from their past
achievements have more facility than others to obtain funding, and moreover, to obtain larger
ones. However, a large number of previous studies have found, researchers tend to be more
productive early in their career (e.g., Cole 1979; Dennis 1956; Lehman 1953; Levin &
Stephan 1991). This could partly explain the decreasing marginal returns observed. Also,
research grants are sometimes used as a performance indicator, which encourages researchers
to apply for more (and bigger) grants (Hornbostel 2001) that they might not necessarily need
to perform their research. This could lead to an inefficient use of the funds received (Sousa
2008). Finally, we may be observing a shift from research funding as an instrumental reward
to research funding as an honorary reward as we move towards higher levels of funding.
Smaller amounts of funding would be given to promising researchers and projects that
produce higher returns while receiving funding beyond this point would be more likely related
to past performance. Furthermore, some highly funded researchers might have relatively low
scores in terms of output and impact because their work has different characteristics and
because they play a different role (one that cannot be observed using bibliometric methods) in
the scientific community. For example, Schmoch & Schubert (2009) and Schmoch et al.
(2010) divided researchers in four main groups (networkers, educators, high producers and
high impact researchers), all of them being, in their view, essential to the sustainability of the
scientific system. While high producers publish many articles and high impact researchers are
focused on high impact articles, networkers and educators focus on different aspect of the
academic life. The existence of these different types of researchers could explain some of the
variability in the results in general, and it may also be the case that some researchers of the
non-publication focused types are overrepresented in among the most funded researchers. It
could also be the case that researchers receiving larger grants do not always participate
directly in the research funded by those grants (Boyack & Jordan 2011). To assess the extent
to which these factors could have affected our results, we searched the top 20 most funded
researchers in our dataset on the Web and looked at their academic profile. A majority of
them were older researchers with important administrative functions. This was especially the

case in NSE, where many deans and heads of departments were found among the top funded
researchers. One possibility that would require further investigation is that, for example, these
researchers might participate in the grant applications, using their reputation to improve the
applications’ chances of success, while it is more their co-applicants who will use the funds to
produce scientific output.
Limitations
In the present study, we used the entire population of Québec university researchers to analyse
the relation between funding and the scientific output and impact. Our results show that
researchers with a moderate amount of funding seem to provide better returns in terms of
output or impact per dollar. In the discussion, many hypotheses regarding the different factors
that could explain these observations have been suggested. This is the main limitation of this
study: it does not take into account some of those potentially important confounding factors.
Thus, further research should validate some of the hypotheses raised in our discussion by
taking into account other independent variables such as the academic age of researchers, their
role in the scientific community, the size and composition of teams, and some specificities of
the funded projects. This will require a different design based on a subsample of our
population for which this additional data will be needed. Further qualitative research could
also focus on highly funded researchers to better understand the way they work and
participate in the scholarly communication process.
Other limitations of this study should also be acknowledged. Firstly, we only took into
account the date at which funding was received and papers published to determine the period
during which researchers were active and to annualize the indicators. We can conclude that
funding is related with output and impact and that each indicator has in most cases a rapid
growth followed by a slower growth and sometimes even a decline when funding increases.
However, we cannot infer any causal mechanisms. Along these lines, some of the potential
outcomes of funding and research cannot be measured with bibliometric indicators (e.g., the
number of students trained and social outcomes). Also, the funding received is sometimes
linked to a particular project, and our study does not focus on the research output linked such
specific grants. Thus, further research could aim at comparing research output and impact of
funded projects specifically using funding acknowledgements, for example. Our study also
didn’t look at indicators of technology transfer (i.e. patents). As Bolli and Somogyi (2011)
have found, technology transfer activities can have an impact on the relation observed
between third party funding and basic research output. Another limitation comes from the
lower coverage of the SS research output in the Web of Science (Archambault et al. 2006;
Larivière et al. 2006; Mongeon & Paul-Hus 2015). Since researchers in SS are more likely
than those in Health or NSE to write books or publish in local journals not included in the
Web of Science, a significant part of their output could not be taken into account in this study.
Furthermore, the timeframe of the analysis (1998-2013) involves that not all articles had the
same time to accumulate citations. An article published in 2001, for example, might have
accumulated more citation than a more recent article just because it had more time to do so.
Conclusion
In a context where financial resources devoted to research are declining in constant dollars in
many countries, it is important to ask whether the manner through which research funding is
allocated is optimal. The results presented in this paper suggest that it might not be the case.
Both in terms of the quantity of papers produced and of their scientific impact, the

concentration of research funding in the hands of a so-called ‘elite’ of researchers produces
diminishing marginal returns. From a policy perspective, this suggests that even though more
funding does in general lead to a higher number of publications, giving bigger grants to fewer
individuals may not be optimal. If the objective is to maximize output, then giving smaller
grants to more researchers seems to be a better policy. In terms of scientific impact, the
quickly reached plateau indicates that increasing funding has a very small effect on the
average relative citations. Again, if the goal of research funding is to generate research that
has a greater impact overall, our results suggest that giving smaller grants to a larger number
of researchers may be a better decision, leading to more publications and citations overall.
Thus, our results support the idea that a more egalitarian distribution of funds would yield
greater collective gains for the scientific community. However, it should be stressed here that
research output and impact do not necessarily equate with societal impact, so our findings do
not support the claim that a more egalitarian distribution of funds would be better for society
as a whole. Nonetheless, it should be understood that the main determinant of scientific
production is not so much the money invested but rather the number of researchers at work
(Abt 2007), and that by funding a greater number of researchers, we increase the overall
research productivity. Furthermore, there is a certain degree of serendipity associated with
scientific discoveries and funding the work of as many researchers as possible increases the
likelihood that some of them make major discoveries.
References
Abt, H. (2007) ‘The publication rate of scientific papers depends only on the number of
scientists’, Scientometrics, 73/3: 281–288.
Archambault, É., Vignola-Gagné, É., Côté, G., Larivière, V., & Gingras, Y. (2006).
‘Benchmarking scientific output in the social sciences and humanities: The limits of
existing databases’, Scientometrics, 68/3: 329–42.
Berg, J. (2010) ‘Measuring the scientific output and impact of NIGMS grants’. NIGMS
Feedback Loop Blog. Retrieved from http://loop.nigms.nih.gov/2010/09/measuring-the-
scientific-output-and-impact-of-nigms-grants/
Berg, J. M. (2012) ‘Science policy: Well-funded investigators should receive extra scrutiny’,
Nature, 489/7415: 203–203.
Bolli, T., & Somogyi, F. (2011). ‘Do competitively acquired funds induce universities to
increase productivity? ’, Research Policy, 40/1: 136–47.
Bourdieu, P. (1976). ‘Le champ scientifique’, Actes de la recherche en sciences sociales,
2/2-3: 88–104.
Boyack, K. W, & Paul, J. (2011) ‘Metrics Associated with NIH Funding: A High-Level
View’, Journal of the American Medical Informatics Association, 18/4: 423–431.
Campbell, D. et al. (2010) ‘Bibliometrics as a performance measurement tool for research
evaluation: the case of research funded by the National Cancer Institute of Canada’,
American Journal of Evaluation, 31/1: 66–83.
CIHR (2012) ‘Evaluation of the Open Operating Grant Program’, Retrieved from
http://www.cihr-irsc.gc.ca/e/documents/oogp_evaluation_report_2012_e.pdf.
Cole, J. R., & Cole, S. (1973). Social stratification in science. Chiago, IL: University of
Chicago Press.
Cole, S. (1979). ‘Age and Scientific Performance’, American Journal of Sociology, 84/4:
958–77.
Dennis, W. (1956). ‘Age and Productivity among Scientists’, Science, 123/3200: 724–5.
Fortin, J. M. & Currie, D. J. (2013) ‘Big science vs. little science: how scientific impact scales
with funding’, PLoS ONE, 8/6: e65263.

Gulbrandsen, M. & Smeby, J. C. (2005) ‘Industry funding and university professors' research
performance’, Research Policy, 34/6: 932–950.
Heale, J. P., Shapiro, D. & Egri, C. P. (2004) ‘The determinants of research output in
academic biomedical laboratories’, International Journal of Biotechnology, 6/2–3: 134–
154.
Hornbostel, S. (2001) ‘Third party funding of German universities. An indicator of research
activity?’, Scientometrics, 50/3: 523–537.
Joós, B. (2012) ‘NSERC’s discovery grant program: disquieting changes & why they matter
to Canadian science’, CAUT Bulletin, 59/1.
Jowkar, A., Didegah, F. & Gazni, A. (2011) ‘The effect of funding on academic research
impact: a case study of Iranian publications’, Aslib Proceedings, 63/6: 593–602.
Larivière, V., Archambault, É., Gingras, Y., & Vignola‐Gagné, É. (2006). ‘The place of
serials in referencing practices: Comparing natural sciences and engineering with social
sciences and humanities’, Journal of the American Society for Information Science and
Technology, 57/8: 997–1004.
Larivière, V., Macaluso, B., Archambault, É. & Gingras, Y. (2010) ‘Which scientific elites?
On the concentration of research funds, publications and citations’, Research Evaluation,
19/1: 45–53.
Laudel, G. (2005). ‘Is external research funding a valid indicator for research performance? ’,
Research Evaluation, 14/1: 27–34.
Lehman, H. C. (1953). Age and achievement. Princeton, NJ: Princeton University Press.
Levin, S. G., & Stephan, P. E. (1991). ‘Research Productivity Over the Life Cycle: Evidence
for Academic Scientists’, The American Economic Review, 81/1: 114–32.
McAllister, P. R. & Wagner, D. A. (1981) ‘Relationship between r-and-d expenditures and
publication output for United-States colleges and universities’, Research in Higher
Education, 15/1: 3–30.
Merton, R. K. (1957). ‘Priorities in scientific discovery: a chapter in the sociology of science’,
American sociological review, 22/6: 635–59.
Merton, R. K. (1968). ‘The Matthew effect in science’. Science, 159(3810), 56–63.
Moed, H. F. et al. (1998) ‘The effects of changes in the funding structure of the Flemish
universities on their research capacity, productivity and impact during the 1980's and early
1990's’, Scientometrics, 43/2: 231–255.
Mongeon, P., & Paul-Hus, A. (2015). ‘The journal coverage of Web of Science and Scopus: a
comparative analysis, Scientometrics.
Nag, S., Yang, H., Buccola, S. & Ervin, D. (2013) ‘Productivity and financial support in
academic bioscience’, Applied Economics, 45/19: 2817–2826.
Nicholson, J. M. & Ioannidis, J. P. A. (2012) ‘Research Grants: Conform and be Funded’,
Nature, 492/7427: 34–36.
NSERC. (2012) ‘2012 Competition Statistics Discovery Grants Program’, Retrieved from
http://www.nserc-crsng.gc.ca/_doc/Funding-Financement/DGStat2012-
SDStat2012_eng.pdf.
NSF. (2013) ‘Summary Proposal and Award Information (Funding Rate) by State and
Organization’, Retrieved from http://dellweb.bfa.nsf.gov/awdfr3/default.asp.
Robitaille, J.-P. & Laframboise, M.-C. (2013) Le Québec en recherche, portrait statistique,
Québec, Observatoire des sciences et des technologies (OST).
Schmoch, U., & Schubert, T. (2009). ‘Sustainability of incentives for excellent research —
The German case’, Scientometrics, 81/1: 195–218.
Schmoch, U., Schubert, T., Jansen, D., Heidler, R., & von Görtz, R. (2010). ‘How to use
indicators to measure scientific performance: a balanced approach’, Research Evaluation,
19/1: 2–18.

Sousa, R. (2008) ‘Research funding: less should be more’, Science, 322/5906: 1324–1325.
van Leeuwen, T. N.& Moed, H. F. (2012) ‘Funding decisions, peer review, and scientific
excellence in physical sciences, chemistry, and geosciences’, Research Evaluation, 21/3:
189–198.
Zhao, D. Z. (2010) ‘Characteristics and impact of grant-funded research: a case study of the
library and information science field’, Scientometrics, 84/2: 293–306.
Zuckerman, H. A. (1998). ‘Accumulation of advantage and disadvantage: The theory and its
intellectual biography’, Mongardini C. & Tabboni S. (eds) Robert K. Merton and
Contemporary Sociology, pp. 139–61. Transaction Publishers: New Brunswick, N.J.