concentration of market power in the eu …study-1.pdf · average american farmer. ... as american...
TRANSCRIPT

1
CONCENTRATION OF MARKET POWER IN
THE EU SEED MARKET
AUTHOR: IVAN MAMMANASTUDY COMMISSIONED BY THE GREENS/EFA GROUP
IN THE EUROPEAN PARLIAMENT

CONCENTRATION OF MARKET POWER IN
THE EU SEED MARKET
Concentration of market power in the EU seed market
INTRODUCTION
This study sheds light upon the increasing concentration of the EU seed market. It uses industry data to show that the mantra of the seed lobby and giant seed companies, that the EU market is healthy and diversified and there are some 7000 mainly small and medium enterprises (SMEs), is misleading. Notably, in the absence of freely available data and independently verifiable statistics, the European Commission is forced to rely upon industry statistics and further promotes the industry myth. This allows the corporations to dominate the narrative and manipulate the arguments to the general public on what is in their best interest.
The European Commission has been accused of drafting the seed marketing law 1 to benefit the big seed lobby, who in turn claim they are not a big lobby but a multitude of some 7000 medium and small players. The DG SANCO of the European Commission routinely contradicts itself when its representatives state quote industry figures that there is no concentration in the EU market(s), while in their own impact assessment for the Seed marketing regulation they state that 95% of the vegetable seed sector is controlled by a mere 5 companies.In the case of maize, just 5 seed companies control around 75% of the EU market share. In the case of sugar beet, just 4 companies control around 86% of the market and 8 companies together control 99% of EU market.2 In the vegetable sector for example, the agro-chemical/seed company Monsanto already controlled around 24% of the EU market.
Why is it important not to have a concentrated market dominated by a few major players? Firstly, because a concentrated sector is not a healthy sector, in terms of competition and openness of the market. Secondly, because of the effects on the diversity of players in the seed sector and of the biological, especially genetic, diversity of our crops: Globally, we have been seeing a steady decrease in agricultural and horticultural genetic diversity, both in terms of i) genetic variation within strains and also ii) the absolute numbers available for farmers and gardeners: Indeed, the UN’s food and agricultural organisation, the FAO, estimates that the diversity of cultivated crops declined by 75% during the 20th century and that a third of today’s diversity could disappear by 2050. According to the FAO 3 , more than 7000 species have been used in the history of humanity to feed us and meet basic human needs. At present, only 30 crops constitute 90% of the calories in the human diet, and only three species (rice, wheat, maize) account for more than half of the human calorie supply. The wealth of species that have contributed to humanity’s balanced nutrition has therefore been severely eroded.
3
3
1. Proposal for a regulation of the European Parliament and the Council on the production and making available on the market of plant reproductive material (plant reproductive material law), COM(2013) 262 final, 2013/0137 (COD)
2. http://eur-lex.europa.eu/LexUriServ/LexUriServ.do?uri=COM:2013:0262:FIN:EN:PDF
3. First Report of the State of the World’s Plant Genetic Resources for Food and Agriculture (1997). http://apps3.fao.org/wiews/docs/SWRFULL2.PDF

SOMMAIRE
4
As Shiva et al write in “Law of the Seed 4 ” : “Currently no more than 120 cultivated species provide 90% of human food supplied by plants, and 12 plant species and five animal species alone provide more than 70% of all human food. A mere four plant species (potatoes, rice, maize and wheat) and three animal species (cattle, swine and chickens) provide more than half. Hundreds of thousands of farmers’ heterogeneous plant varieties and landraces, that existed for generations in farmers’ fields until the beginning of the twentieth century, have been substituted by a small number of modern and highly uniform commercial varieties. The loss of agricultural biodiversity has drastically reduced the capability of present and future generations to face unpredictable environmental changes and human needs.”
Commenting on the why biodiversity is important, they continue: “… meta-analyses published since 2005 5 a have shown that, as a general rule, reductions in the number of genes, species and functional groups of organisms reduce the efficiency by which whole [ecological] communities capture biologically essential resources (nutrients, water, light, prey), and convert those resources into biomass. Thus biodiversity increases the stability of ecosystem functions through time.”
We need that rapidly-eroding genetic diversity, a vital part of agro-biodiversity, for our long term food security, in order to mitigate risks of pest attack and crop failure from increased extreme weather events, and also to maintain genetic capital to adapt around challenges like climate change. We see breeding moving out of the hands of the users, the farmers who for many centuries have adapted seed to their own local climatic needs, and instead innovation is being reserved only for the corporations, who are intent on promoting and providing for a market of industrial scale production, with tailor-made dependency on agrochemicals. The same interests who own the seed monopolies are those of the agro-chemical sector, indeed in some cases they are the same companies, in others the money used to develop seeds comes from the agro-chemical sector in an open collaboration.If we look to the USA, we can see what a really concentrated seed market dominated by a few players looks like. One of the consequences is increased input costs for farmers, particularly the price of seeds: USA’s Department of Agriculture figures show there have been real increases in seed prices paid by farmers in the USA. The 2009 report “Out of Hand” of the “National Family Farm Coalition” stated: “This level of concentration has proven problematic, reducing choice and increasing prices for the average American farmer.”
There are also consequences for research and development. According to a study by the USA’s Department of Agriculture: “The most rapid increase in R&D was in crop breeding/biotechnology. Generally, the largest four to eight firms in each sector accounted for about three-fourths of the R&D in that sector ($19.7 billion in 2007), with larger firms spending more than smaller firms on R&D as a
CONCENTRATION OF MARKET POWER IN THE EU SEED MARKET
4. Shiva et al, 2013: http://www.navdanya.org/attachments/lawofseed.pdf
5a. Cardinale BJ, Duffy JE, Gonzalez A, Hooper DU, Perrings C, Venail P, Narwani A, Mace GM, Tilman D, Wardle DA, Kinzig AP, Daily GC, Loreau M, Grace JB, Larigauderie A, Srivastava DS, Naeem S, 2012, Biodiversity loss and its impact on humanity, Nature 486: 59-67

Concentration of market power in the EU seed market
5
percentage of product sales (with the exception of small biotechnology firms). Typically, the large firms are multinational operations with global R&D and marketing networks.”
The U.S. Department of Justice (DOJ) announced in August 2009 that it would investigate alleged anticompetitive conduct in the seed industry largely because a few dominant companies control too much of the seed supply. The case was dropped at the end of 2012 without any explanation. The report “Out of Hand” states: “USDA figures show that the most substantial price increases occurred parallel with the rise of GM crop plantings, with the most significant price increases occurring within the last few years. ... corn [maize] seed prices in 2009 were more than 30% higher, and soybean seed nearly 25% higher, than 2008 prices. These mark the steepest year-to-year increases to date. Monsanto’s dramatic price increases are unmatched.”
In the EU the prices of seed and planting stock have also increased rapidly recent years: they rose by an average of 30.2% between 2000 and 2008 for the EU (based on Eurostat figures) 5 b. As stated in a European Parliament briefing of 2011: “The increase in seed prices differed widely among Member States. Faced with these figures and with price increases for other inputs, some farmers are looking for ways to reduce their seed costs.” This study shows that the EU market – in reality a number of smaller Member State (MS) markets - is undergoing a concentration process, with some MS becoming much more concentrated than others. We use examples to illustrate this, by describing snapshots in two MS markets in different stages along this process, France and Poland. Using the seed lobby’s own information, we can also see that the demarcation of an EU market as such is slightly illusionary, as dominant global seed companies, in close collaboration with dominant global agro-chemical companies, tailor seeds to be dependent on those agro-chemical inputs. It is without doubt a globalised market, where arms of global corporations use their worldwide networks to obtain, breed, multiply and distribute their seed: for example, source material may come from Italy, breeding and testing with pesticides may happen in Germany, multiplication may occur in Mexico, packaging in USA, and finally retail in the EU. Given this, we must not lose sight of the global picture which provides cause for concern, as the biggest 10 companies own up to 75% of the worldwide market share.
This study also reveals that the misleading figure of “7000 seed companies”, quoted extensively by the corporations and politicians to imply so many breeders, applies not only to breeders, but also to multipliers, processing/treating companies and traders, collectively labelled the ‘European seed industry’.
5
5b. Seed use by farmers in the European Union, European Parliament Library Briefing 28/10/2011 http://www.europarl.europa.eu/RegData/bibliotheque/briefing/2011/110229/LDM_BRI(2011)110229_REV1_EN.pdf
Report of the European Parliament on the farm input supply chain: structure and implications 2011/2114(INI)) (rapporteur José Bové) http://www.europarl.europa.eu/sides/getDoc.do?type=REPORT&reference=A7-2011-0421&language=EN
“ total input costs for EU farmers climbed on average by almost 40% between 2000 and 2010: ... the increase in input costs within that decade reached ... almost 80% for synthetic fertilisers and soil improvers, ... almost 30% for seeds and planting stock and nearly 13% for plant protection products”

SOMMAIRE
6
It sheds light upon some of the markets for individual crops or groups of crops within the seed sector, where different rates of concentration can be seen. For example, although the wheat market is dominated to a lesser degree, in the extreme case of the UK, 45% of the market share belongs to a single company; meanwhile 95% of the EU vegetable seed market is in the hands of just 5 companies.
As American scholar Philip H. Howard wrote in 2009 6 : “In the last 40 years, the commercial seed industry has transformed dramatically. It has shifted from a competitive sector of agribusiness, composed primarily of small, family-owned firms, to an industry dominated by a small number of transnational pharmaceutical/chemical corporations. These corporations entered the industry by acquiring numerous smaller seed companies, and merging with large competitors. This consolidation is associated with a number of impacts that constrain the opportunities for renewable agriculture. Some of these include declining rates of saving and replanting seeds, as firms successfully convince a growing percentage of farmers to purchase their products year after year; a shift in both public and private research toward the most profitable proprietary crops and varieties, but away from the improvement of varieties that farmers can easily replant; and a reduction in seed diversity, as remaining firms eliminate less profitable lines from newly acquired subsidiaries.”
The question is therefore: is the EU seed market really as diversified as the European Commission wants lawmakers and the general public to believe? Or is this market in fact transforming rapidly from a seed sector with a large number of competing small firms and farmers into an oligopoly, increasingly dominated by a small number of transnational agro-chemical-seed firms?
CONCENTRATION OF MARKET POWER IN THE EU SEED MARKET
6. http://www.mdpi.com/2071-1050/1/4/1266/pdf

Concentration of market power in the EU seed market
77

Busting the myth of diversity in the EU seed marketThis study shows how the seed market in the European Union is currently experiencing an increasingly high level of concentration. In the EU institutional debate, industry and the European Commission’s DG SANCO (health and consumer affairs, the service of the European Commission leading on this dossier) often argue that the EU seed sector does not suffer from high concentration, and involves some 7000 small and medium sized companies. This study will show that contrary to these claims, the largest global seed companies are dominating the EU market, and among them three are EU based. The idea of an “EU market” as such can be considered as rather an abstraction, as it is a de facto globalised market made up of smaller markets delimited by EU Member State (MS), or by crop species or groups of crop species (e.g. maize, grain, vegetables, etc), with mergers and acquisitions of those sub-markets occurring between the giants. There is little transparency in the sector, as data and information on the biggest companies in the sector is considered to be commercially sensitive, and so it is difficult to obtain. As there are no freely available, independently verifiable figures, the Commission could be forgiven for peddling the myth of the sector lobby, ESA( European Seed association), as theirs is the only meta-data available. Since the Commission published the proposal for the new seed marketing legislation on May 20137 this has been one of the most controversial issues: During the European Parliament’s committee on agriculture and rural development (COM AGRI) meeting on 30th September 2013, a representative of the Commission stated that there are figures confirming that 30% of the total European seed market value is covered by multinational seed corporations, and that the rest of the market is covered by small and medium enterprises. This statement has never officially been backed up by any studies or data: indeed, confidential industry sources paint a different picture, stating that in Europe (including Turkey), the top 5 companies8 control more than 50 % of the market. In a subsequent meeting of the European Parliament’s COM AGRI on 26th November 20139, the Commission stated that the high number of the small and medium enterprises operating in the EU seed sector was indicative of a low-concentration market.
CONCENTRATION OF MARKET POWER IN THE EU SEED MARKET

9
The most important argument as to why the Commission statement is flawed is that even though seed production and marketing involves actors in many stages (plant breeding, seed production, seed conditioning, trading, retail, etc), in the end it is a few companies that control the seed market shares of the economically most important crops. It should also be considered that eleven Member States joined the EU only relatively recently and those Member States’ agricultural markets were not yet integrated in the common market, meaning that existing EU directives on seed marketing were transposed differently into national laws. In addition, some Member States also allowed some leniency in the implementation of the directives, and made certain exemptions. This has created a complex picture of the EU seed market10.
The first part of this study gives a general description of the concentration phenomenon in the EU, with two snapshots from two EU Member States, one focusing on market concentration and the other focusing on the structure of the seed sector and the kind of enterprises active within it. The second part of the study focuses on three particular crops: maize, wheat and tomato. Those crops represent a large economic value for the EU11 and also give three different perspectives on concentration trends.
Methodology of the studyIn order to understand the concentration and consolidation dynamic in such a complex sector, this study focuses on the real market shares of the seed giants in different EU seed markets and describes the structure of the EU seed chain. In the second part of the study, the focus is mainly on who controls the commercialised seed varieties and on the real market shares of the mega-companies who own those varieties. As mentioned above, there is little transparency in the sector. Clear data about the companies operating in the seed sector and their market share are not available because they are not published. The only actors who have information about market shares are the mega-companies themselves, and they rarely release such data into the public domain because they consider it to be commercially sensitive. Indeed, most of the data, information and figures used to determine market share for this study come from the analysis of financial reports, annual reports, investor presentations, articles and studies released by those companies. Other data comes from sources such
7. The legislative proposal by the Commission was published only in May 3013: Proposal for a Regulation of the European Parliament and the Council on the production and making available on the market of plant reproductive material, COM(2013) 262 (final), http://ec.europa.eu/dgs/health_consumer/pressroom/docs/proposal_aphp_en.pdf
8. Pioneer, Syngenta, Monsanto, Limagrain and Kws.
9. For more information see: http://www.europarl.europa.eu/ep-live/it/committees/video?event=20131126-1500-COMMITTEE-AGRI
10. Some civil society and sector organisations are also questioning the Commission line:
- Closing in on our seeds, Corporate Europe Observatory, June 2013, http://corporateeurope.org/news/closing-our-seeds
- Don’t tow the corporate line on seed: MEPs must protect public goods. Seed is too important to leave to vested interests, Press Release of the International Federation of Organic Agriculture Movements – EU Regional Group, November 27th, 2013, http://www.ifoam-eu.org/sites/default/files/page/files/ifoameu_policy_seed_pr_20131127.pdf
11. Maize alone represents a whole 26% of the economic value of the EU seed market. Wheat is the most widely cultivated agricultural crop in Europe and tomato is the most produced vegetable in the EU.

10
as seed sector organisations12 , NGOs, academics and intergovernmental organisations such as the ETC Group and the EU institutions.This study has consolidated those limited sources of data and information available for some sections of the seed sector, since data or information on concentration at all levels is not available, be that in different crop species or groupings of seeds or in different Member State sub-markets of the EU “market”, or indeed on the EU/European level. The analyses of the varieties of three crop species, - maize, wheat and tomato - are based on data on varieties registered in the EU common seed catalogue13 and assess what proportion of those varieties are maintained by the five biggest companies in the seed sector. The information coming from these analyses of the catalogue data was then compared with the real market shares of these companies in the markets of the three crop species. The research supporting this study was carried out in November and December 2013.
The EU seed business is an international seed business A c - cording to a r e - cent publica-t i o n of the Euro-pean Parliament’s inter- nal policies d e - partment:
12. For the purposes of this study, “seed sector organisations” refers to umbrella organisations that represent categories or group of companies working in that sector; for example, the European Seed Association, a lobby group, and the French seed interprofessional seed organisation, GNIS.
13. “The common catalogues of varieties of agricultural plant and vegetable species list the varieties which can be marketed in the EU. Catalogues are based on the registration of plant varieties in EU countries after they have been technically examined there and notified to the Commission. They are published in the Official Journal”, http://ec.europa.eu/food/plant/plant_propagation_material/plant_variety_catalogues_databases/index_en.htm
14. The EU Seed and Plant Reproductive Material market in perspective: a focus on companies and market shares, Directorate-general for internal policies of the European Parliament, November 2013, Brussels, p. 9, http://www.europarl.europa.eu/RegData/etudes/note/join/2013/513994/IPOL-AGRI_NT(2013)513994_EN.pdf
15. Ibid., p. 9
“In 2012, the value of the EU seed market reached around ¤ 7 billion. The EU market
represents 20% of the global market. It ranks n°3 after the United States (27%) and
China (22%), well ahead of the fourth market (Brazil, 6%) ... In an expanding world seeds
market (+76%), the EU market grew by +45% between 2005 and 2012. France is by far
the biggest market of the EU (nearly one third). A group of Å^M�5MUJMZ�;\I\M[ (France,
Germany, Italy, Spain and the Netherlands) represents \_W�\PQZL[ of the EU market.” 14
0,00,20,40,60,81,0
Grasses - 210 - 3%
Sugar Beet - 210 - 3%
Oil and Fibre CroPs - 280 - 4%
Vegetables - 770 - 11%
Seed potatoes - 980 - 14%
Maize - 1820 - 26%
Cereals and pulses - 2730 - 39%
€ million
EU SEED Market
Figure 1: Breakdown of the EU seed market per crop per crop. 15 (million €) �

Concentration of market power in the EU seed market
11
The increase in size of the EU seed market and its role as the first global exporter of seed has put Europe at the centre of the international seed sector 17. As observed by different intergovernmental institutions and studies at an international level, a large part of the market lies in the hands of a very small number of companies. This consolidation has happened in the last 15-20 years, starting in the nineties (table 1).
Two recent studies show that the largest 10 companies have a worldwide market share of between 62% 18 and 75.3% 19 : note that five of them are companies that produce both seeds and agro-chemicals, and the biggest has a market share between 48.2 % and 58.2% according to the same studies.
With Europe being the world’s leading exporter in seeds and the third biggest world market for seeds, the question of dominance of just a few players is a highly relevant one. It would be naïve to consider that such an important market is not highly interesting for the seed giants. Additionally, from a legislative perspective, critics claim that “ for the past 50 years Europe has been a laboratory for seed laws that it subsequently imposes on the entire planet through free trade agreements ” 20. Indeed, the EU has both an economic footprint on the rest of the world because of its strong export role, and also a legislative footprint because of states outside the EU copying its laws in order to ease trade with the block.
16. KWS 2013 data for vegetables, maize and sugar beet, European Commission 2013.
17. France is currently the first world seed exporter and the Netherlands the third (La filière des semences affiche un excédent record de 836 M d’euros, Agra Presse hebdo, Semaine du 25 novembre 2013 – N° 3423).
18. ETC group, Putting the Cartel before the Horse ... and Farm, Seeds, Soil, Peasants, etc. Who Will Control Agricultural Inputs?, ETC Group, September 2013, http://www.etcgroup.org/sites/www.etcgroup.org/files/CartelBeforeHorse11Sep2013.pdf
19. Fugeray-Scarbel et Lemarie, 2013: Évolution de l’organisation de la recherche et du secteur des semences.
20. Position on the marketing of seeds, plant health and controls, European Coordination Via Campesina, December 2012, http://www.eurovia.org/spip.php?article711
Based on available information on market shares, 40% of the total EU seed market corresponds to
extremely concentrated markets.
75% of market share controlled by the top 5 companies of the sector
maize
86% of market share controlled by the top 4 companies of the sector
Sugar beet
95% of market share controlled by the top 5 companies of the sector
vegetables
Figure 2: EU market shares of the top com-panies in the maize, sugar beet and vegetable seed markets 16
Based on available information on market shares, 40% of the total EU seed market corresponds to
extremely concentrated markets.
75% of market share controlled by the top 5 companies of the sector
maize
86% of market share controlled by the top 4 companies of the sector
Sugar beet
95% of market share controlled by the top 5 companies of the sector
vegetables

12
21. The EU Seed and Plant Reproductive Material market in perspective: a focus on companies and market shares, Directorate-general for internal policies of the European Parliament, November 2013, Brussels, p. 19
SHARE IN GLOBALSEED MARKET ( GSM )
COMPANY COMPANY COMPANY COMPANY
1985 $M
SHARE OF GLOBAL SEEDMARKET
NETSALES
1996 $M
SHARE OF GLOBAL SEEDMARKET
NETSALES
2009 $M
SHARE OF GLOBAL SEEDMARKET
NETSALES
2012 $M
SHARE OF GLOBAL SEEDMARKET
NETSALES
KWS
DEKALB
CIBA GEIGY
VANDERHAVE
PIONEER PIONEER
NOVARTIS
LIMAGRAIN
ADVANTA
SEMINIS
TAKII
SAKATA
SANDOZ
DEKALB
UPJOHNASGROW
LIMAGRAIN
SHELLNICXERSON
TAKII
MONSANTO
DUPONTPIONEER
SYNGENTA
LIMAGRAIN
KWS
BAYER
DOW
SAKATA
LANDO’LAKES
MONSANTO( USA )
DUPONTPIONEER( USA )
SYNGENTA( CH )
LIMAGRAIN( FRANCE )
WINFIELD( USA )
KWS( DENMARK )
DOW( USA )
BAYER( GERMANY )
SAKATA( JAPAN )
735
290
201
200
180
175
175
152
150
4.1%
1.6%
1.1%
1.1%
1.0%
1.0%
1.0%
0.8%
0.8%
12.5% 16.7% ›43.8% 62%
5.0%
3.0%
2.2%
1.5%
1.3%
1.1%
1.0%
0.9%
0.8%
17.4%
11.2%
6.1%
2.8%
2.2%
1.5%
1.5%
1.2%
?
21.8%
15.5%
7.1%
3.8%
3.5%
2.9%
2.9%
2.2%
1.0%
1500
900
650
460
375
320
300
255
250
7297
4700
2564
1155
920
645
635
485
?
9800
7000
3200
1700
1300
1300
1000
0.4
0.4
Table 1: Evolution of the market shares of the biggest seed companies in the world 21

Concentration of market power in the EU seed market
13
Mergers and acquisitions in the seed breeding and marketing sector The consolidation of the seed giants is dependent on a complex of factors. One of the ways to expand control over the market is to invest in the hybridisation of certain crops, or in biotech products protected by patents. Generally, private companies working with varieties designed for industrial-scale production such as F1 hybrids need on average between 7 and 15 years to breed a new variety and place it on the market 22. Indeed, if they are not backed up with public funds, actors need to invest considerable time and money to enter into the sector, especially at the beginning of the process. This creates a barrier impeding access to newcomers.However for the largest seed giants, the breeding experience and the value of genetic resources can be easily acquired through the merging and the acquisition of companies already in the market. In the last 20 years, the biggest seed companies have acquired smaller local seed companies all over the world. This strategy is an effective way to enlarge their market share but also to diversify their breeding and genetic know-how. A good example of this process is the history of the Limagrain group, which has acquired or taken over 14 large seed companies since the 1990s 23.
In addition, the biggest companies in the seed sector also build alliances 24, often under the form of a joint venture or partnership, creating non-transparent oligopolies 25. Such alliances include so-called “cross-licensing agreements”. This kind of agreement is used in particular for transgenic seed traits, creating a network of relationships between seed companies.
“These agreements have increased with the development of adding multiple transgenes in crops.
As stated by MONSANTO in its 2012 annual report: «With the exception of competitors in our
Seminis and De Ruiter vegetable seed business, most of our seed competitors are also licensees of our
germplasm or biotechnology traits»” . 26
Some of the interconnections between the largest companies at international level can be seen in annex.
22 “Plant breeding is the process in which different genetic varieties are combined (via amongst others crossing), following on from which the progeny displaying the best combination of traits are chosen (selection). In order to create a commercial variety, this process of crossing and selection has to be repeated several times, meaning that it takes on average between 7 and 15 years from the first crossing” (extract from: Plantum NL position on patent- and plant breeders’ rights, Plantum 2009, http://www.plantum.nl/Content/Files/file/Standpunten/Plantum%20Position%20on%20patent-%20and%20plant%20breeders%20rights.pdf)
23. The construction of an international cooperative group, Limagrain 2013, http://www.limagrain.com/limagrain/history/the-construction-of-an-international-cooperative-group/article-20/gb.html
24. Extract from The EU Seed and Plant Reproductive Material (PRM) market in perspective: a focus on companies and market shares, Directorate-general for internal policies of the European Parliament, November 2013, Brussels, p. 5
25. Commission staff working document - impact assessment accompanying the document proposal for a regulation of the European Parliament and of the council on the production and making available on the market of plant reproductive material, European Commission May 2013, Brussels, p. 31, http://ec.europa.eu/dgs/health_consumer/pressroom/docs/proposal_aphp_ia_en.pdf
26. Extract from The EU Seed and Plant Reproductive Material (PRM) market in perspective: a focus on companies and market shares, Directorate-general for internal policies of the European Parliament, November 2013, Brussels, p. 5

14
1942
1965
1975
1986
199219971999
2003
2009
The Limagrain case
Consolidation of seed companies in the EU market
Vilmorin
Clause (fr)
Hazera
Harris moran (USA)
dahico seedsClovis matton
1990Nickerson
+2
+3
+2
Limagrain
UliceBiogemmagenoplante
genective
BioSEMCooperative
2000
AgReliant
2007
longpinghigh-tech
limagrainsouth america
limagrainguerra do
brasil
Limagraincerealseeds
2001
Keygene
20102011
2011
With KWS
2005
Advanta europe
sementesguerra
2006
Mikado seed growers
2012
century seeds
campbell’s seeds
Bisco Bio Sciences
Acquisition of seedcompany
creation of new seed companyor joint venture
participation in another seed company
Source : Limagrain.com, http://www.limagrain.com/limagrain/history/the-construction-of-an-international-cooperative-group/article-20/gb.html#.UtqfIrzjJGG

Concentration of market power in the EU seed market
Seed growers /Multipliers
Seed traders / retailers
Production/treating companies
At the beginning of the seed chain, they create new varieties and produce seeds .
Breeders create the added value in the seed sector, breeding companies own the intellectual property rights on varieties, and benefit from the largest sales margins on the products.
They produce seeds in their fields from seed provided by production companies.
They sell seeds to farmers and other users.
They produce seedss most often under contracts with seed growers.
They can also sort, process, package and market them. Many of the enterprises involved are micro-enterprises located in Poland, Hungary and Romania.
#2
#3#4
only 72/565
of seed enterprises in France
the world's leadingseed exporter and EU’s
biggest seed marketare actually
breeders
The number of seed breeders is very small.
It is not possible to find out which of these
enterprises are independent.
Among the 72 enterprises, Clause, Eurodur, Limagrain Europe and Vilmorin SA belong to the same group. Some of the enterprises are public bodies, such as INRA and CIRAD.
¤
Breeding companies#1
THE STRUCTURE OF THE SEED SECTOR
The seed sector is dominated by giant companies which over time have acquired smaller companies along the seed supply chain, e.g. seed breeders, biotech research companies, etc. (vertical and horizontal integration). They also very often establish alliances with other companies in the sector through outsourcing and partner-ships. Additionally seed giants collaborate with each other in different ways (joint ventures, cross-licensing agreements, etc.).
This means that large corporations operate throughout the whole seed chain.
15
16
The process of concentration in the EU seed market The European Union seed sector has also undergone a concentration process, demonstrated by the acquisition of independent companies operating in the EU by a few large groups over the last 20 years. Smaller companies were bought up both by European and non-European seed giants in close collaboration - or even directly including - agro-chemical companies, in line with the concentration process occurring at the international level. The best examples of acquisitions are the cases of Limagrain buying up Nickerson in 1990, then Bayer buying up Nuhmens in 2002, and Monsanto acquiring Seminis in 2005 and De Ruiters in 2008 27. These cases all concerned plant breeding companies with a large market in the EU.
While those cases are easy to track because they were announced on the websites of the companies, others are hidden behind a complex web of acquisitions and distribution strategies. Further examination of the partners of Seminis and De Ruiter Seeds shows that the company Volmary/Nebelung is mentioned as a trading partner. Volmary/Nebelung owns the garden seed brands Sperli and Kiepenkerl, which were independent companies until a few years ago, and are well-known to hobby gardeners. Volmary/Nebelung therefore sells Monsanto’s and other companies’ seeds without customers being able to know the origin of the seeds they are buying and who controls them. At the same time, very few open-pollinated varieties are now offered through these two brands, despite the fact that until only a few years ago, Kiepenkerl and Sperli offered both hybrids and open-pollinated varieties 28.
27. http://www.limagrain.com/limagrain/history/the-construction-of-an-international-cooperative-group/article-20/gb.html#.Up2kYcRSgYM
- http://www.nunhems.com/www/NunhemsInternet.nsf/id/CW_EN_Nunhems_History
- http://www.seminis.com/global/us/AboutSeminis/Pages/History.aspx
28. http://www.taz.de/1/archiv/archiv/?dig=/2012/05/03/a0113
Concentration of market power in the EU seed market
17
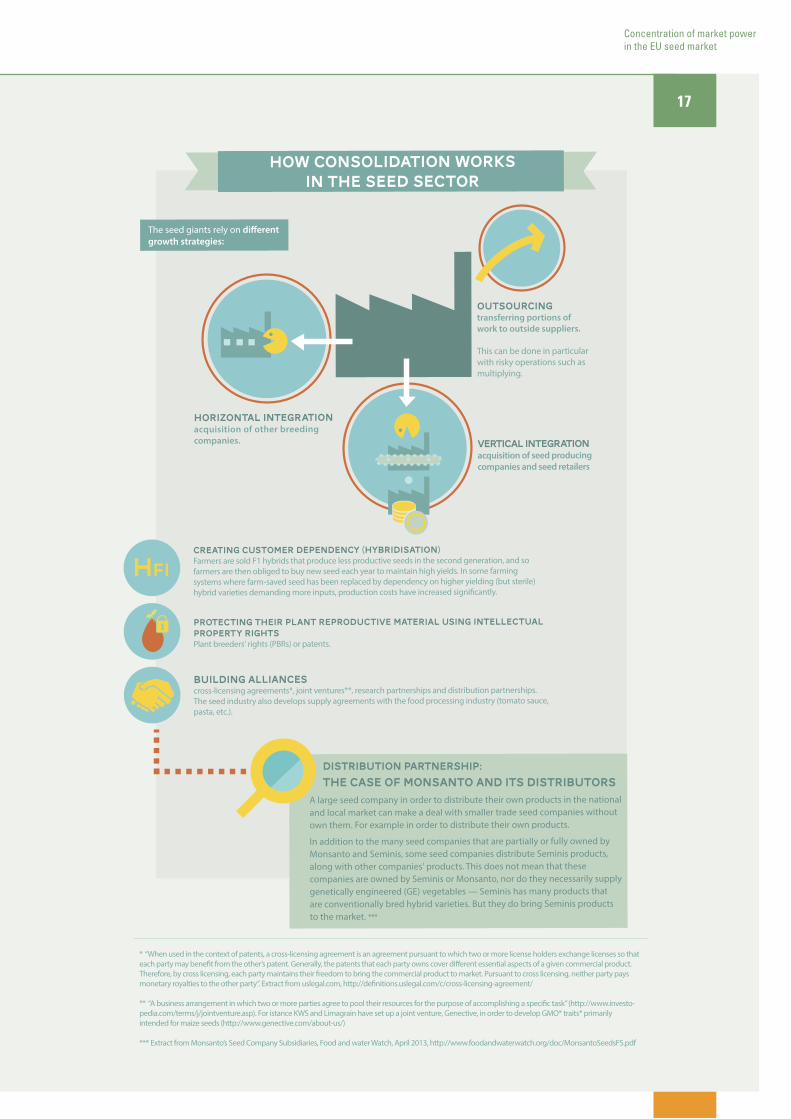
how consolidation worksin the seed sector
The seed giants rely on different growth strategies:
Creating customer dependency (hybridisation) Farmers are sold F1 hybrids that produce less productive seeds in the second generation, and sofarmers are then obliged to buy new seed each year to maintain high yields. In some farming systems where farm-saved seed has been replaced by dependency on higher yielding (but sterile) hybrid varieties demanding more inputs, production costs have increased significantly.
Protecting their plant reproductive material using intellectual property rightsPlant breeders' rights (PBRs) or patents.
Horizontal Integration acquisition of other breeding companies. Vertical integration
acquisition of seed producing companies and seed retailers
Building alliances cross-licensing agreements*, joint ventures**, research partnerships and distribution partnerships. The seed industry also develops supply agreements with the food processing industry (tomato sauce, pasta, etc.).
Outsourcingtransferring portions ofwork to outside suppliers.
This can be done in particular with risky operations such as multiplying.
A large seed company in order to distribute their own products in the national and local market can make a deal with smaller trade seed companies without own them. For example in order to distribute their own products.
In addition to the many seed companies that are partially or fully owned by Monsanto and Seminis, some seed companies distribute Seminis products, along with other companies' products. This does not mean that these companies are owned by Seminis or Monsanto, nor do they necessarily supply genetically engineered (GE) vegetables — Seminis has many products that are conventionally bred hybrid varieties. But they do bring Seminis products to the market. ***
HF1
* “When used in the context of patents, a cross-licensing agreement is an agreement pursuant to which two or more license holders exchange licenses so that each party may benefit from the other’s patent. Generally, the patents that each party owns cover different essential aspects of a given commercial product. Therefore, by cross licensing, each party maintains their freedom to bring the commercial product to market. Pursuant to cross licensing, neither party pays monetary royalties to the other party”. Extract from uslegal.com, http://definitions.uslegal.com/c/cross-licensing-agreement/
** “A business arrangement in which two or more parties agree to pool their resources for the purpose of accomplishing a specific task” (http://www.investo-pedia.com/terms/j/jointventure.asp). For istance KWS and Limagrain have set up a joint venture, Genective, in order to develop GMO* traits* primarily intended for maize seeds (http://www.genective.com/about-us/)
*** Extract from Monsanto’s Seed Company Subsidiaries, Food and water Watch, April 2013, http://www.foodandwaterwatch.org/doc/MonsantoSeedsFS.pdf
distribution partnership: the case of monsanto and its distributors
18
29. “Essentially, hybridization is a traditional breeding process in which inbred lines are crossed to create seed varieties with greater yield potential than exhibited by either parent” . “From the perspective of the seed firms, hybridization had two commercial advantages. First, simple examination of a hybrid seed does not reveal its lineage, thus offering companies proprietary control over the seeds they develop. Second, the enhanced vigor of hybrid seed is not transmitted to its offspring, thereby requiring farmers to buy new seed every year to ensure continued vigor. Crops cultivated from seed saved from a hybrid crop grown in the previous year are typically less vibrant and significantly lower in yield”. Extracts from The Seed Industry in U.S. Agriculture: An Exploration of Data and Information on Crop Seed Markets, Regulation, Industry Structure, and Research and Development, J. Fernandez-Cornejo, 2004, U.S. Department of Agriculture - Agriculture Information Bulletin Number 786, p. 2, http://www.ers.usda.gov/publications/aib-agricultural-information-bulletin/aib786.aspx#.Us02yvTuJ9A
30. Data KWS: http://www.kws.de/global/show_document.asp?id=aaaaaaaaaaffxwn
31. Philip H. Howard, Visualizing Consolidation in the Global Seed Industry: 1996–2008, Sustainability journal, 2009, 1, 1266-1287, Basel.
32. Commission staff working document: impact assessment accompanying the document proposal for a regulation of the European Parliament and of the council on the production and making available on the market of plant reproductive material, European Commission May 2013, Brussels, p. 32, http://ec.europa.eu/dgs/health_consumer/pressroom/docs/proposal_aphp_ia_en.pdf
Concentration in the EU crop seed markets Focusing on the market share, the information available from companies and public institutions shows that the seed markets for economically important crops as maize, sugar beet and vegetables have undergone a considerable level of concentration. In the first two cases, of maize and sugar, this is connected to the capacity of the industrial scale seed companies to produce hybrid varieties of those crops 29. In the case of maize, just 5 seed companies have around 75% of the EU market share. In the case of sugar beet, just 4 companies own around 86% of the market and 8 companies own 99% of EU market 30. In the vegetable sector for example, the agro-chemical/seed company Monsanto already controlled around 24% of the EU market after its acquisition of the Dutch company Seminis in 2008 31. According to the European Commission,“Vegetable seeds are mainly multiplied outside the EU in a wide range of countries in which labour costs are lower than in the EU. The produced seeds are shipped to the EU, mainly to the Netherlands, for treating, sampling and packaging and re-exported to their final destination in the EU or outside the EU. The production has a value of about EUR 1 billion. Main producers are FR, IT, NL, HU DK, PL.The five biggest companies have 95% of the seed market 32”.
This is an astonishingly high level of concentration, especially if those who deny concentration are to be believed: so the vegetable seed market is in fact not at all highly diversified and characterised by many smaller regional and local markets.
This is connected to the big investments that industrial scale seed companies, in particular agrochemical corporations such as Monsanto and Syngenta, have made to create new hybrid varieties in many vegetables, but especially tomatoes.
A lower degree of concentration can be seen in cereals 33 because there are no good hybrids of wheat, the most important cereal market, and farmers can easily reproduce farm-saved seeds and find productive non-hybrid conventional seed on the market 34. However in recent years, some companies (Limagrain, KWS and RAGT) have gained large market shares in this sector 35. For example, Limagrain is the largest wheat seed producer in the world and owns around 16.5 % of the EU-27 market share 36. More information can be found below on the specific paragraph on wheat seed.
“<PM�Å^M�JQOOM[\�KWUXIVQM[�PI^e�!� �WN�\PM�[MML�UIZSM\�”

Concentration of market power in the EU seed market
19
The French caseData at EU level for all crops are not available. However, it is possible to analyse the consolidation of giant seed companies in some EU countries which are important for the sector, such as France: France represents the largest seed market in the EU, at 31% of the EU market. Based on fi gures published by the European Parliament using GNIS 37 data , it can be seen that France is experiencing a high level of market concentration, where only three companies - Limagrain, Dupont, Syngenta (including Maisadour) - own 47% of the French market. The core business of these companies are profi table crops, such as cereals. However, both Limagrain and Syngenta also have large market shares in the vegetable seed market.
33. Defi ned as wheat, barley, oats, rye, rice, i.e. excluding maize, as per the French classifi cation «céréales à paille»
34. While they wait in expectation for the EU to relax its stance on GM and new biotech products, the large seed companies have set their sights on hybridising wheat seeds to gain more market share. In 2011 the Limagrain chief executive stated that “developing hybrid wheat is a huge challenge – the genome is more complicated than that of maize – but if it can be done it has the potential to deliver signifi cant benefi ts.» (http://www.farminguk.com/news/Limagrain-chief-executive-puts-wheat-at-heart-of-group-strategy_21098.html). Therefore developing hybrid wheat seed is the strategic objective of agro-industry, to push out the practice of farm saved seeds from the European farming model, where it is currently very popular with farmers.
35. 2011-2012 annual report, Vilmorin 2012, http://www.vilmorin.info/vilmorin/CMS/Files/publications/publications%20et%20analyses/rapports%20annuels/Vilmorin_annual_report_2011_2012.pdf
36. À propos: Limagrain and wheat, Limagrain March 2013, p. 2, http://limagrainchina.cn/wp-content/uploads/2013/07/a-propos-ble-2012-gb.pdf
37. GNIS, the Groupement National Interprofessionnel des Semences et plants, is the umbrella organisation of the French seed industry.
38. The EU Seed and Plant Reproductive Material (PRM) market in perspective: a focus on companies and market shares, Directorate-general for internal policies of the European Parliament, November 2013, Brussels, P14
COMPANY NAMETotaL turnover
in france( € million )
estimated marketshare
( all crops )cumulated share
limagrain
syngenta
dupont-pioneer
ragt
euralis
desprez
maisadour
caussade
monsanto
413
342
186
135
115
96
85
80
74
19%
16%
8%
6%
5%
4%
4%
4%
3%
19%
35%
43%
49%
54%
58%
62%
66%
69%
source elaboration by ep poldep b , based on gnis data
Table 2: Estimated market shares of seed companies in France (2011) 38

20
Biotech and concentrationThe multinational companies operating in the EU have managed to dominate a large part of the seed market mainly by buying up other seed companies. If the European system seems less affected by the speed of this concentration and consolidation processes than for example the USA 39 , this may be linked to “…the emergence of biotechnologies as the key driver of the consolidation process that has taken place in the global seed industry” 40 . As stated by the European Parliament policy department: because the EU has to some extent protected itself, at least in refraining from cultivating GM crops on a large scale, concentration has so far not been as profound in the EU as in the USA. The European common catalogue itself has not defended the European seed sector against the concentration process, but has obliged multinational companies to adapt their strategies to this market: their strategy has been to focus more on the acquisition of local companies and on improving hybrids of conventional varieties 41. For instance, in July 2013, Monsanto confirmed that they are “actually expanding… [their] operations in the conventional seed business in Europe… we’ll be investing several hundred million dollars there over a decade to expand our conventional seed production and breeding… The EU today is effectively a conventional seed market”. 42
Despite this, many of the giant seed corporations operating in the EU expect that this market will be soon open to GM seeds. This is the case for Limagrain, who are developing research programmes in order to develop new GM varieties specifically for the European market. 43
39. Seed giants vs. U.S. farmers, Center for food safety & Save our Seeds 2013, http://www.centerforfoodsafety.org/files/seed-giants_final_04424.pdf
40. The EU Seed and Plant Reproductive Material market in perspective: a focus on companies and market shares, Directorate-general for internal policies of the European Parliament, November 2013, Brussels, p. 7, http://www.europarl.europa.eu/RegData/etudes/note/join/2013/513994/IPOL-AGRI_NT(2013)513994_EN.pdf
41. In a context of total liberalisation, companies with many patents and high tech portfolios grow more.
42. Monsanto Business in Europe, MonsantoBlog.com July 2013, http://monsantoblog.com/2013/07/18/monsantos-business-in-europe/
43. Document de référence 2012-2013, Vilmorin & Cie November 2013, p. 22, http://www.vilmorin.info/vilmorin/CMS/Files/publications/publications%20et%20ana-lyses/rapports%20annuels/VILMORIN_RA2013_Complet_def.pdf

Concentration of market power in the EU seed market
21
The myth of 7000 European seed companies in the EU The European seed lobby group, the European Seed Association, repeatedly states that the EU seed sector is highly diversified because of the apparently large number of enterprises in the sector - 7000 - and because of the large proportion of micro enterprises among them, more than 70% 44. The same claims are repeated by organisations and individuals lobbied by them, in the absence of alternative and independently verifiable statistics: for example during a recent debate on the review of the seed marketing law in the European Parliament in November 2013, representatives from both the European Parliament and the Commission referred to the same figures.
However, as mentioned above, the seed sector consists of many different sub-sectors, characterised by strong links between enterprises with different tasks along the seed chain. So it is often the case that a big enterprise, breeding a seed variety and selling the seeds under its own brand name, subcontracts smaller enterprises in order to delegate or externalise tasks. Considering the segmentation of the seed sector, the diversity of crop varieties and the differences between climatic and agricultural conditions throughout 28 EU Member States, 7000 companies does not appear to be a huge number, especially as that number not only breeders 45 but also maintainers, multipliers and traders. Therefore it does not seem credible to use this number to counter the claim that very few companies dominate the seed chain. Many of the 7000 companies seem to work for a small number of breeders.
<PQ[� ÅO]ZM� WN� ����� KWUXIVQM[� ZI\PMZ� XZW^QLM[� IV� M`XTIVI\QWV� WN� PW_� \PM� [MK\WZ�_WZS[��J]\�LWM[�VW\�QTT][\ZI\M�\PM�LQ^MZ[Q\a�WN�\PM�[MK\WZ�Q\[MTN��<PMZMNWZM��OQ^MV�\PM�JZMISLW_V�QV\W�ZWTM[�IVL�N]VK\QWV[�WN�\PM������KWUXIVQM[�IVL�\PMQZ�ZMTI\QWV[PQX[�WN�LMXMVLMVKa�IVL�W_VMZ[PQX��\PM�ÅO]ZM�KIVVW\�JM�][ML�I[�IV�QVLQKI\WZ�WN�\PM�PMIT\P�WN�\PM�[MK\WZ��
Without more information available on the role of those 7000 companies, it is not possible to find out exactly how many of them are operational, in which section of the seed sector they work, and who orients and controls their work.
44. Official controls: Impact on food business operators - seeds and plants, the European Seed Association’s presentation to the European Parliament, 14 October 2013, http://www.europarl.europa.eu/meetdocs/2009_2014/documents/envi/dv/envi20131014_doc14_biloni_/envi20131014_doc14_biloni_en.pdf
45. As defined by the OECD “the maintainer of a variety is a person or an organisation responsible for maintaining the variety and ensuring that it remains true to type throughout its full life-span and in the case of hybrid varieties that the formula for hybridisation is followed. Maintenance may be shared.” http://www.oecd.org/agriculture/code/33999126.PDF
46. The EU Seed and Plant Reproductive Material (PRM) market in perspective: a focus on companies and market shares, Directorate-general for internal policies of the European Parliament, november 2013, Brussels, pg. 2.
poland , romania around 2000
around 800
around 600
between 120 and 350
less than 60
hungary
united kingdom
france , italy , germany , netherlands , slovakia
other member states
member states number of seed companies
source: elaboration by ep poldep b , based on data from european commission
impact assessment swd ( 2013 ) 162 , 2013
Table 3: Number of seed companies in EU Member States 46

22
The Polish case - a very small percentage are breeders European Commission data from 2013 shows that the majority of EU seed companies, around 4800 (68%), are located in Poland (around 2000), Romania and Hungary. All these companies taken together represented only 8% of the value of the EU-27 seed market, with a large percentage of them being micro-enterprises 47.Consulting the Polish catalogue for agricultural plant species 48 reveals that from a total number of 124 companies involved in maintaining seed varieties 49, only 18% (23 companies) are Polish. The Polish vegetable species catalogue also shows only 35 Polish registered maintainers. This means that out of the 2000 Polish seed enterprises, only 58 - less than 3% - are involved in breeding (this could be an overestimation since some companies might be involved in maintaining both agricultural and vegetable varieties).50 In addition, the European Commission recognised in the impact assessment of the legislative proposal on its seed marketing law that “companies in the new Member States such as Poland, Hungary and Romania are not research intensive and a large proportion are likely seed multipliers or seed traders.” 51 This shows that a large percentage of these companies are not actually involved in seed and plant breeding as such.
Further analysis of the data on the 7000 EU seed enterprises shows that only a small number of them are actually involved in breeding, where most of the added value of the seed sector is to be found. This means that only a small number of companies are creating new varieties. Therefore the figure of 7000 companies cannot be used as an indicator of the number of breeders contributing to biodiversity. In addition, even when (a small number of) breeders are producing new varieties, this does not necessarily mean more biodiversity in agriculture, as is sometimes claimed, because those varieties may not appear in the fields despite being listed in the EU Common Catalogue. In France, the world’s leading seed exporter and Europe’s biggest seed market, there are only 72 enterprises working on new varieties of all commercial species. Additionally, between 2006 and 2012, the number of seed companies in the whole seed sector in France had decreased by 3.6%. 52 It is not possible to find out which of these enterprises are independent. Among the 72 enterprises working on new varieties, Clause, Eurodur, Limagrain Europe and Vilmorin SA are owned by the same corporation. Some of the enterprises are public bodies: INRA and CIRAD.The concentration in the seed breeding sector can be tracked through the requests of companies for plant breeder rights for commercially important species. For instance, between 2000-2011 just 5 companies applied for 83% of the plant breeder rights (PBR) 53 for tomato varieties (the most profitable vegetable species) in the Netherlands 54 . At EU level this concentration effect was even more pronounced, with the top 5 seed companies applying for 91% of intellectual property right (IPR) protection. In 2011, Monsanto and Syngenta were responsible for 57% of PBR applications for tomato, against only 12 % in 2000. 55
47. The average company has an annual turnover of under 130 000 Euro. The European Commission draft legislation intended to define the niche market as micro enterprises, i.e. any enterprises that have a max. of 10 employees and a yearly turnover of max. 2 million euro, http://ec.europa.eu/enterprise/policies/sme/facts-figures-analysis/sme-definition/
48. For the species covered by EU seed marketing Directives, registration of varieties in the EU Common Catalogue is a precondition for marketing seed. The common catalogue is divided in two sections: one for Agricultural plant species and one for Vegetable species. For Agricultural plant species, every new variety needs to satisfy a variety performance requirement, the so-called value of cultivation and use (VCU), before being registered. For vegetable crops, the VCU tests are not required and seed can be commercialised in the same way as standard seeds.
49. As defined by the OECD “the maintainer of a variety is a person or an organisation responsible for maintaining the variety and ensuring that it remains true to type throughout its full life-span and in the case of hybrid varieties that the formula for hybridisation is followed. Maintenance may be shared”, which means the two different actors, for instance a public body with a private company, can be involved in maintaining the same variety. http://www.oecd.org/agriculture/code/33999126.PDF
50. A similar situation exists in Romania, where 81 maintainers are listed in the national list of agricultural plant species . In that case local maintainers represent 35%. Staff working document of the impact assessment accompanying the proposal for a regulation of the European Parliament and of the Council on the production and making available on the market of plant reproductive material, European Commission, May 2013, Brussels, http://ec.europa.eu/dgs/health_consumer/pressroom/docs/proposal_aphp_ia_en.pdf)

Concentration of market power in the EU seed market
23
Concentration in the EU in figures: the cases of maize, wheat and tomato In this part the study looks at two sets of data:
1) who controls commercialised varieties and
2) what are the real market shares of the companies who own these varieties. The study focuses on three particular crops: maize, soft wheat and tomato.
Analysing the European Common Catalogue and the EU market share As any plant variety marketed in the EU must be listed in the European Common Catalogue (see box ), that catalogue can be used to analyse the companies owning and registering the varieties marketed in the EU (although it contains no data on market shares of each variety). For each variety, the catalogue shows the maintainer (the person or the organisation responsible for maintaining the variety) which normally corresponds to the company selling the variety under its brand name (in some cases maintainers are different from the breeders). The varieties in the catalogue are bred by or belong to private companies, are possibly protected by IPRs, and can be part of the public domain; they can be maintained on behalf of individuals, private companies or public research institutions. Indeed, particularly in the new EU Member States, it is largely public bodies that are involved in breeding new varieties and registering them in the catalogue. 56 This is especially the case for maize and wheat, where different public institutes act as maintainers for some local varieties.
In addition, the number of the varieties present in the catalogue does not correspond to the number of the varieties really marketed in Europe. Experts have suggested that a company or public body could have the interest to maintain certain varieties without commercialising them. 57
Analysing the catalogue could help to understand the market power of a small number of companies that can own hundreds of varieties of the same crop. A company with a larger number of varieties has more opportunities to increase its own market share.
The information available on market share is either somewhat fragmented or not available. Despite this, the information available still has the capacity to show how the seed giants are conquering large portions of the EU seed markets.
51. http://ec.europa.eu/dgs/health_consumer/pressroom/docs/proposal_aphp_ia_en.pdf
52. Estimations based on GNIS figures: Les structures de la profession semencière - Campagne 2011/12, GNIS 2013, http://gnis.fr/index/action/page/id/56.
53. “Plant Breeder’s Rights are intellectual property rights given to a person who has developed a variety”, More information on: http://www.worldseed.org/isf/intellectual_property.html
54. The Netherlands is an emblematic country for vegetable seeds. Around 40% of vegetable seed sold on the world market originates from here. Plant reproduction materials, a Dutch motor for export and innovation, Lei & Wageningen UR, February 2012, http://www.plantum.nl/Content/Files/file/Plant%20reproduction%20materials.pdf
55. Concurrentie in de kiem, V. Kocsis, J. Weda & R. van der Noll, Ministerie van Economische Zaken, February 2013, http://www.rijksoverheid.nl/documenten-en-publicaties/rapporten/2013/06/05/concurrentie-in-de-kiem.html
56. Commission staff working document impact assessment accompanying the document proposal for a regulation of the European Parliament and of the council on the production and making available on the market of plant reproductive material, European Commission May 2013, Brussels, p. 32, http://ec.europa.eu/dgs/health_consumer/pressroom/docs/proposal_aphp_ia_en.pdf
57. The biodiversity perspective, A museum attraction or the future of food security for mankind?, Klaus Rapf, ARCHE NOAH November 2013, http://www.europarl.europa.eu/document/activities/cont/201311/20131129ATT75256/20131129ATT75256EN.pdf
24
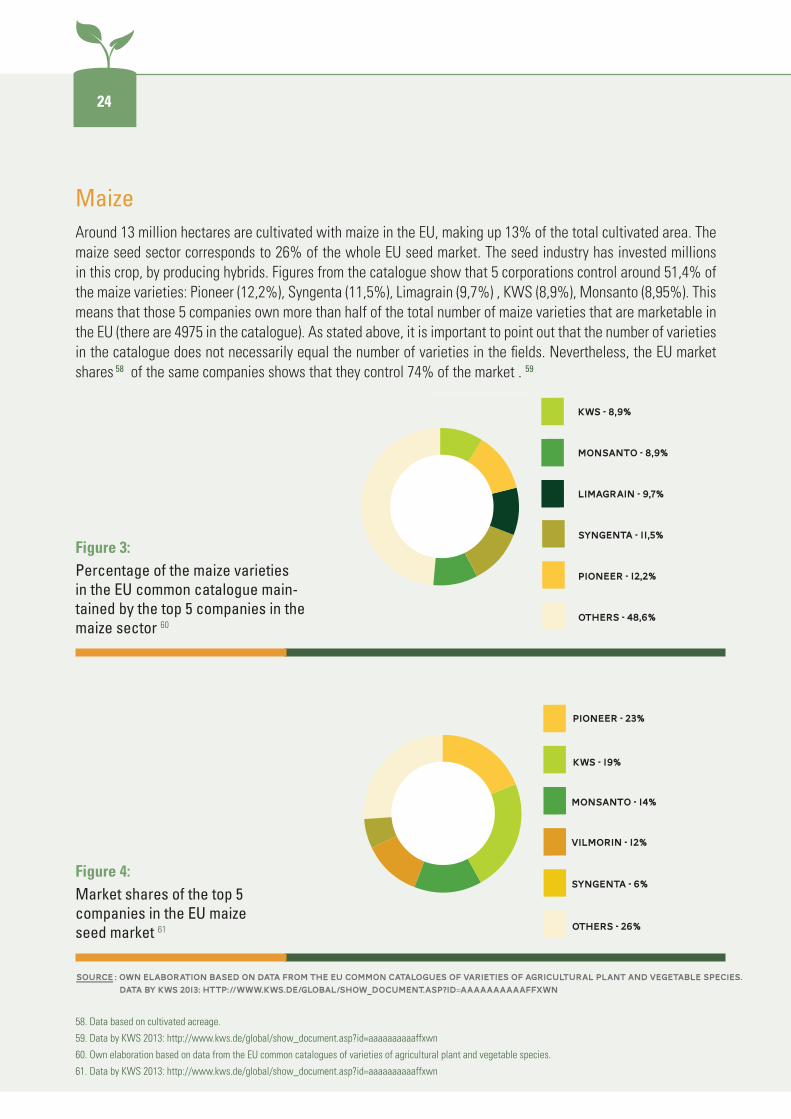
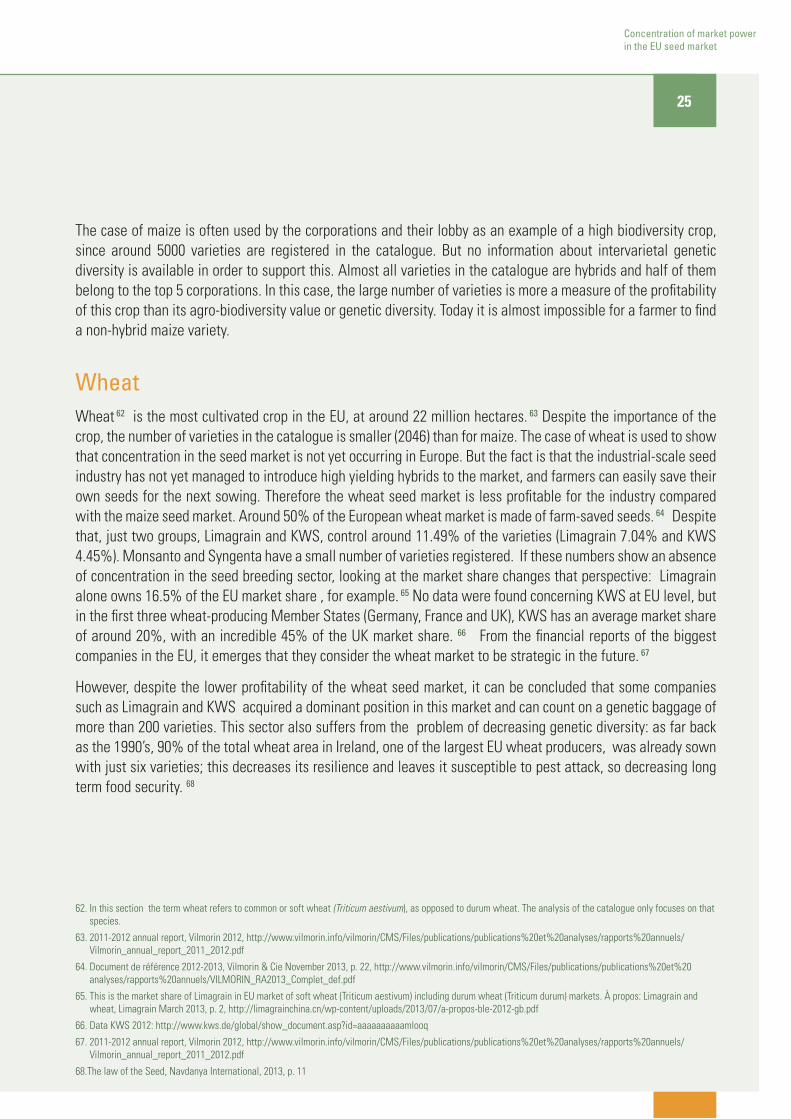
Maize Around 13 million hectares are cultivated with maize in the EU, making up 13% of the total cultivated area. The maize seed sector corresponds to 26% of the whole EU seed market. The seed industry has invested millions in this crop, by producing hybrids. Figures from the catalogue show that 5 corporations control around 51,4% of the maize varieties: Pioneer (12,2%), Syngenta (11,5%), Limagrain (9,7%) , KWS (8,9%), Monsanto (8,95%). This means that those 5 companies own more than half of the total number of maize varieties that are marketable in the EU (there are 4975 in the catalogue). As stated above, it is important to point out that the number of varieties in the catalogue does not necessarily equal the number of varieties in the fields. Nevertheless, the EU market shares 58 of the same companies shows that they control 74% of the market . 59
58. Data based on cultivated acreage.
59. Data by KWS 2013: http://www.kws.de/global/show_document.asp?id=aaaaaaaaaaffxwn
60. Own elaboration based on data from the EU common catalogues of varieties of agricultural plant and vegetable species.
61. Data by KWS 2013: http://www.kws.de/global/show_document.asp?id=aaaaaaaaaaffxwn
0,00,20,40,60,81,0
Others - 26%
Syngenta - 6%
Vilmorin - 12%
Monsanto - 14%
Pioneer - 23%
KWS - 19%
KWS - 8,9%
Monsanto - 8,9%
Limagrain - 9,7%
Syngenta - 11,5%
Pioneer - 12,2%
Others - 48,6%
Control of the maize varieties registrated in the common catalogue
Maize European Market shares
Source : own elaboration based on data from the EU common catalogues of varieties of agricultural plant and vegetable species.
Data by KWS 2013: http://www.kws.de/global/show_document.asp?id=aaaaaaaaaaffxwn
Figure 3: Percentage of the maize varieties in the EU common catalogue main-tained by the top 5 companies in the maize sector 60
0,00,20,40,60,81,0
Others - 26%
Syngenta - 6%
Vilmorin - 12%
Monsanto - 14%
Pioneer - 23%
KWS - 19%
KWS - 8,9%
Monsanto - 8,9%
Limagrain - 9,7%
Syngenta - 11,5%
Pioneer - 12,2%
Others - 48,6%
Control of the maize varieties registrated in the common catalogue
Maize European Market shares
Source : own elaboration based on data from the EU common catalogues of varieties of agricultural plant and vegetable species.
Data by KWS 2013: http://www.kws.de/global/show_document.asp?id=aaaaaaaaaaffxwn
Figure 4: Market shares of the top 5 companies in the EU maize seed market 61
0,00,20,40,60,81,0
Others - 26%
Syngenta - 6%
Vilmorin - 12%
Monsanto - 14%
Pioneer - 23%
KWS - 19%
KWS - 8,9%
Monsanto - 8,9%
Limagrain - 9,7%
Syngenta - 11,5%
Pioneer - 12,2%
Others - 48,6%
Control of the maize varieties registrated in the common catalogue
Maize European Market shares
Source : own elaboration based on data from the EU common catalogues of varieties of agricultural plant and vegetable species.
Data by KWS 2013: http://www.kws.de/global/show_document.asp?id=aaaaaaaaaaffxwn
Concentration of market power in the EU seed market
25
The case of maize is often used by the corporations and their lobby as an example of a high biodiversity crop, since around 5000 varieties are registered in the catalogue. But no information about intervarietal genetic diversity is available in order to support this. Almost all varieties in the catalogue are hybrids and half of them belong to the top 5 corporations. In this case, the large number of varieties is more a measure of the profitability of this crop than its agro-biodiversity value or genetic diversity. Today it is almost impossible for a farmer to find a non-hybrid maize variety.
Wheat Wheat 62 is the most cultivated crop in the EU, at around 22 million hectares. 63 Despite the importance of the crop, the number of varieties in the catalogue is smaller (2046) than for maize. The case of wheat is used to show that concentration in the seed market is not yet occurring in Europe. But the fact is that the industrial-scale seed industry has not yet managed to introduce high yielding hybrids to the market, and farmers can easily save their own seeds for the next sowing. Therefore the wheat seed market is less profitable for the industry compared with the maize seed market. Around 50% of the European wheat market is made of farm-saved seeds. 64 Despite that, just two groups, Limagrain and KWS, control around 11.49% of the varieties (Limagrain 7.04% and KWS 4.45%). Monsanto and Syngenta have a small number of varieties registered. If these numbers show an absence of concentration in the seed breeding sector, looking at the market share changes that perspective: Limagrain alone owns 16.5% of the EU market share , for example. 65 No data were found concerning KWS at EU level, but in the first three wheat-producing Member States (Germany, France and UK), KWS has an average market share of around 20%, with an incredible 45% of the UK market share. 66 From the financial reports of the biggest companies in the EU, it emerges that they consider the wheat market to be strategic in the future. 67
However, despite the lower profitability of the wheat seed market, it can be concluded that some companies such as Limagrain and KWS acquired a dominant position in this market and can count on a genetic baggage of more than 200 varieties. This sector also suffers from the problem of decreasing genetic diversity: as far back as the 1990’s, 90% of the total wheat area in Ireland, one of the largest EU wheat producers, was already sown with just six varieties; this decreases its resilience and leaves it susceptible to pest attack, so decreasing long term food security. 68
62. In this section the term wheat refers to common or soft wheat (Triticum aestivum), as opposed to durum wheat. The analysis of the catalogue only focuses on that species.
63. 2011-2012 annual report, Vilmorin 2012, http://www.vilmorin.info/vilmorin/CMS/Files/publications/publications%20et%20analyses/rapports%20annuels/Vilmorin_annual_report_2011_2012.pdf
64. Document de référence 2012-2013, Vilmorin & Cie November 2013, p. 22, http://www.vilmorin.info/vilmorin/CMS/Files/publications/publications%20et%20analyses/rapports%20annuels/VILMORIN_RA2013_Complet_def.pdf
65. This is the market share of Limagrain in EU market of soft wheat (Triticum aestivum) including durum wheat (Triticum durum) markets. À propos: Limagrain and wheat, Limagrain March 2013, p. 2, http://limagrainchina.cn/wp-content/uploads/2013/07/a-propos-ble-2012-gb.pdf
66. Data KWS 2012: http://www.kws.de/global/show_document.asp?id=aaaaaaaaaamlooq
67. 2011-2012 annual report, Vilmorin 2012, http://www.vilmorin.info/vilmorin/CMS/Files/publications/publications%20et%20analyses/rapports%20annuels/Vilmorin_annual_report_2011_2012.pdf
68.The law of the Seed, Navdanya International, 2013, p. 11

26
69. Own elaboration based on data from the EU common catalogues of varieties of agricultural plant and vegetable species.
70. propos: Limagrain and wheat, Limagrain March 2013, p. 2, http://limagrainchina.cn/wp-content/uploads/2013/07/a-propos-ble-2012-gb.pdf
71. Data KWS 2012: http://www.kws.de/global/show_document.asp?id=aaaaaaaaaamlooq
0,00,20,40,60,81,0
Limagrain - 7,04%
KWS - 4,45%
Others - 88,51%
Control of the wheat varieties registrated in the common catalogue
Limagrain - 16,5%
Others - 83,5%
KWS - 16,5%
Others - 83,5%
KWS - 40%
Others - 60%
Uk wheat market only
Limagrain’s european wheat market shares
KWS’ wheat market shares in France, Germany and UK
Source : KWS 2012: http://www.kws.de/global/show_document.asp?id=aaaaaaaaaamlooq
À propos: Limagrain and wheat, Limagrain March 2013, p. 2, http://limagrainchina.cn/wp-content/uploads/2013/07/a-propos-ble-2012-gb.pdf
Figure 5: Percentage of the wheat varieties in the EU common catalogue main-tained by the top 5 companies in the wheat sector 69
0,00,20,40,60,81,0
Limagrain - 7,04%
KWS - 4,45%
Others - 88,51%
Control of the wheat varieties registrated in the common catalogue
Limagrain - 16,5%
Others - 83,5%
KWS - 16,5%
Others - 83,5%
KWS - 40%
Others - 60%
Uk wheat market only
Limagrain’s european wheat market shares
KWS’ wheat market shares in France, Germany and UK
Source : KWS 2012: http://www.kws.de/global/show_document.asp?id=aaaaaaaaaamlooq
À propos: Limagrain and wheat, Limagrain March 2013, p. 2, http://limagrainchina.cn/wp-content/uploads/2013/07/a-propos-ble-2012-gb.pdf
Figure 6: Limagrain market shares in the EU wheat market 70
0,00,20,40,60,81,0
Limagrain - 7,04%
KWS - 4,45%
Others - 88,51%
Control of the wheat varieties registrated in the common catalogue
Limagrain - 16,5%
Others - 83,5%
KWS - 16,5%
Others - 83,5%
KWS - 40%
Others - 60%
Uk wheat market only
Limagrain’s european wheat market shares
KWS’ wheat market shares in France, Germany and UK
Source : KWS 2012: http://www.kws.de/global/show_document.asp?id=aaaaaaaaaamlooq
À propos: Limagrain and wheat, Limagrain March 2013, p. 2, http://limagrainchina.cn/wp-content/uploads/2013/07/a-propos-ble-2012-gb.pdf
Figure 7: Average market shares in France Germany and UK, and KWS market shares in the UK 71
Concentration of market power in the EU seed market
27
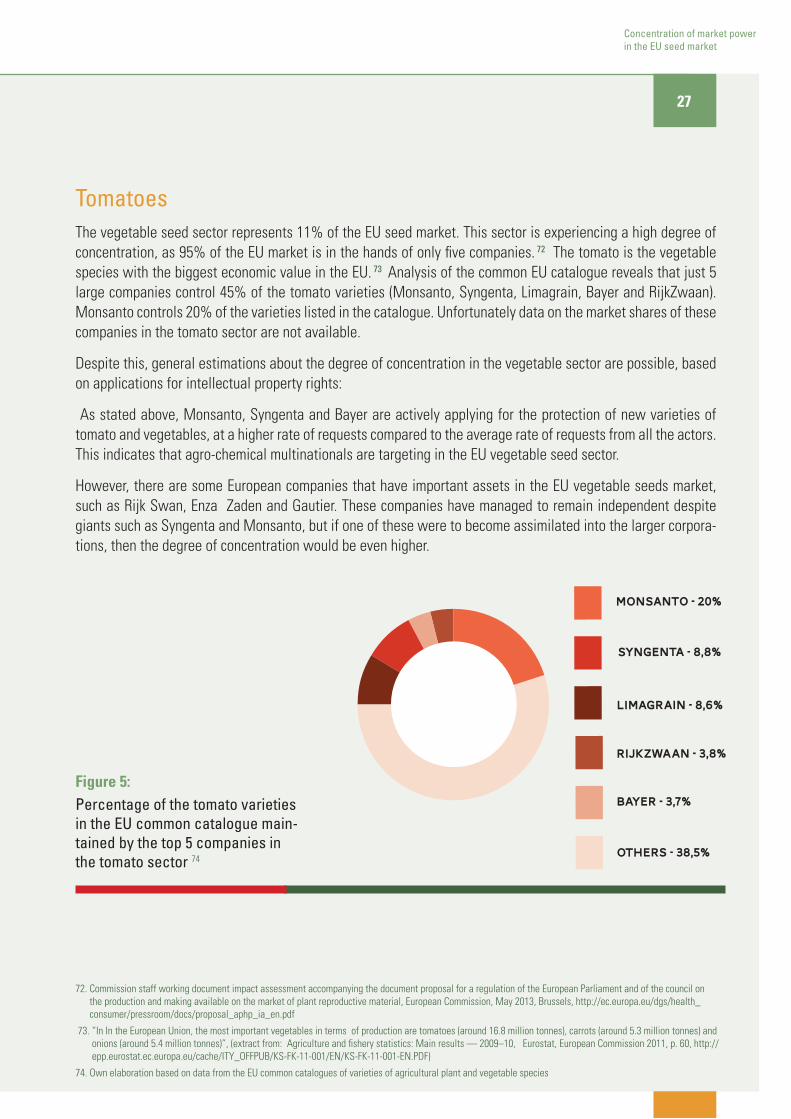
Tomatoes The vegetable seed sector represents 11% of the EU seed market. This sector is experiencing a high degree of concentration, as 95% of the EU market is in the hands of only five companies. 72 The tomato is the vegetable species with the biggest economic value in the EU. 73 Analysis of the common EU catalogue reveals that just 5 large companies control 45% of the tomato varieties (Monsanto, Syngenta, Limagrain, Bayer and RijkZwaan). Monsanto controls 20% of the varieties listed in the catalogue. Unfortunately data on the market shares of these companies in the tomato sector are not available.
Despite this, general estimations about the degree of concentration in the vegetable sector are possible, based on applications for intellectual property rights:
As stated above, Monsanto, Syngenta and Bayer are actively applying for the protection of new varieties of tomato and vegetables, at a higher rate of requests compared to the average rate of requests from all the actors. This indicates that agro-chemical multinationals are targeting in the EU vegetable seed sector.
However, there are some European companies that have important assets in the EU vegetable seeds market, such as Rijk Swan, Enza Zaden and Gautier. These companies have managed to remain independent despite giants such as Syngenta and Monsanto, but if one of these were to become assimilated into the larger corpora-tions, then the degree of concentration would be even higher.
72. Commission staff working document impact assessment accompanying the document proposal for a regulation of the European Parliament and of the council on the production and making available on the market of plant reproductive material, European Commission, May 2013, Brussels, http://ec.europa.eu/dgs/health_consumer/pressroom/docs/proposal_aphp_ia_en.pdf
73. “In In the European Union, the most important vegetables in terms of production are tomatoes (around 16.8 million tonnes), carrots (around 5.3 million tonnes) and onions (around 5.4 million tonnes)”, (extract from: Agriculture and fishery statistics: Main results — 2009–10, Eurostat, European Commission 2011, p. 60, http://epp.eurostat.ec.europa.eu/cache/ITY_OFFPUB/KS-FK-11-001/EN/KS-FK-11-001-EN.PDF)
74. Own elaboration based on data from the EU common catalogues of varieties of agricultural plant and vegetable species
RijkZwaan - 3,8%
Bayer - 3,7%
Limagrain - 8,6%
Syngenta - 8,8%
Others - 38,5%
Monsanto - 20%
Control of the tomato varieties regis-trated in the common catalogue
Source : own elaboration based on data from the EU common catalogues of varieties of agricultural plant and vegetable species.
Figure 5: Percentage of the tomato varieties in the EU common catalogue main-tained by the top 5 companies in the tomato sector 74
28
The common seed variety catalogue and biodiversity As described by the OECD, for species covered by EU Directives,
“the registration of varieties in a Common Catalogue is a precondition for marketing seed of
agricultural and vegetable crops in the EU. For a variety to be registered, it needs to be distinct,
uniform and stable. It also needs to be tested according to national protocols or protocols of the
+WUU]VQ\a�>IZQM\a�:QOP\[�7NÅKM�WZ�=87>��5WZMW^MZ��^IZQM\QM[�WN �IOZQK]T\]ZIT�[XMKQM[�VMML�\W�meet the criteria for value of cultivation and use.” 75
The aim of such legislation was “to ensure seed quality, to protect seed users from false specifications and to promote the use of high yielding varieties that would produce enough food for all European citizens” 76 .This legislation originates from the same time that the Common Agricultural Policy (CAP) was established, a time when Europe was facing the challenge of reconstruction and where the need to increase productivity in agriculture was perceived as a fundamental step to reach food security. At that time there was a solid conviction that a productivist paradigm 77 was the only solution for the agricultural and social challenges facing Europe. The marketing of seeds, from lists of species covered by EU Directives, is limited to registered varieties, and the criteria of registration of these varieties are based on the so-called DUS (distinctness, uniformity and stability) criteria. The problem with this approach is that it only caters for seeds designed for industrial-scale production 78. Indeed the authorities decided to create a legislative system which guaranteed that consumers, i.e. farmers, would be provided with homogenised seed varieties that ensured a high level of productivity under industrial farming conditions, called « conditions de confort » in French 79 . On the other hand, those farmers and breeders who want to work with non-industrial varieties do so with many market uncertainties, mainly due to these legislative constraints. Indeed, the DUS criteria spelled out by the legislation have contributed to industrialising the food system and also to a loss of biodiversity. 80
75. OECD Seed Scheme: a synthesis of International Regulatory Aspects that Affect Seed Trade, OECD, p.5-6, http://www.oecd.org/tad/code/internationalregulato-ryaspectsseedtrade.pdf
76. Towards more crop diversity, adapting market rules for future food security, biodiversity and food culture, IFOAM EU group, May 2013, p. 4.
77. “The Productivity Narrative’s main assumption is that economic growth is the only way forward for human development. Issues such as social inequality, resource scarcities and pollution are not ignored, but rather considered as constraints thus ignoring the underlying complexity of socioecological systems. Demand is considered to be exogenous. The social impacts of new technologies, as reflected in IPR issues and market power, are underestimated.” (extract from Sustainable food consumption and production in a resource-constrained world, A. Freibauer , E. Mathijs, G. Brunori, Z. Damianova, E. Faroult, J. Girona i Gomis, L. O´Brien and S. Treyer, the European Commission’s Standing Committee on Agricultural Research (SCAR), February 2011, http://ec.europa.eu/research/agriculture/scar/pdf/scar_feg_ultimate_version.pdf)
78. The DUS criteria and in general the current rules for the catalogue registration deny farmer varieties (farm-bred or farm farm-saved seeds) a legal status, but otherwise these criteria are very much in demand by the agribusiness industry and by the big retailers.
79. http://www7.inra.fr/dpenv/pdf/KastlerD30.pdf
80. ”By the 1990s in Ireland, 90% of the total wheat area is sown to just six varieties” (The law of the Seed, Navdanya International, 2013, p. 11).
Concentration of market power in the EU seed market
29
For instance, a study published in 2011 by the Fondation pour la biodiversité, shows how “a very strong genetic homogenisation of common wheat in France (…) occurred principally as a result of the decrease in genetic diversity within the varieties cultivated from 1912 to 1964. Landraces 81 , genetically very diverse, have been progressively replaced by «old lines», far more genetically homogeneous, which were themselves replaced by genetically pure varieties. Since 1964, these «modern pure lines» have become the only varieties that can be sold commercially and are the only ones cultivated. This homogenisation raises the issue of the sensitivity of wheat crops with respect to current and future environmental changes (pathogens, drought, sustainable agricultural practices...)”.82 France has been a major wheat growing country for centuries, while other crops such as maize only appeared relatively recently on a large scale in France. At World scale, the FAO estimates that “since the beginning of this century, about 75% of the genetic diversity of agricultural crops has been lost”. 83
It is important to state that simply increasing the number of varieties does not necessarily mean an increase in biodiversity if the genetic diversity between and within the varieties is relatively low. Additionally, the number of varieties in the catalogue is not an indicator of the number of varieties in the field. For example two almost identical varieties with little genetic variation bring no benefits for genetic/biological diversity. The Commission has tried to legislate solutions for biodiversity with two Commission directives published in 2008 and 2009, on conservation varieties 84 and varieties with no intrinsic value 85, respectively. But there have been various problems with these directives, because their implementation has severely constrained the activities of those working with these varieties.
81. “A landrace can be defined as a variable population of cultivated plants, which lacks formal crop improvement and is associated with the traditions of the people who grow it”. Extract from Preserving genetic resources in agriculture, Achievements of the 17 projects of the Community Programme 2006-2011, European Commission, 2013,
82. http://ec.europa.eu/agriculture/genetic-resources/publications/brochure-2013_en.pdf
83. Extract from : Goffaux R., Goldringer I., Bonneuil C., Montalent P. & Bonnin I. (2011). Which indicators for monitoring genetic diversity in cultivated plants? A case study of common wheat cultivated in France during the 20th century. FRB report, 2011
84. Extract from Human Nature: Agricultural Biodiversity and Farm-based Food Security», H. Shand, study prepared by the Rural Advancement Foundation International (RAFI) for the Food and Agriculture Organization of the United Nations, December 1997, http://www.fao.org/sd/epdirect/epre0040.htm.
85. Commission Directive 2008/62/EC of 20 June 2008 providing for certain derogations for acceptance of agricultural landraces and varieties which are naturally adapted to the local and regional conditions and threatened by genetic erosion and for marketing of seed and seed potatoes of those landraces and varieties (Text with EEA relevance), European Commission, 2008, http://eur-lex.europa.eu/LexUriServ/LexUriServ.do?uri=CELEX:32008L0062:EN:NOT
30
CONCLUSION
The EU seed market is a key part of the international seed market and is experiencing increasing concentration in many of its most economically relevant crops (in particular maize, vegetables, sugar beet). This is demonstrated by the high market share owned and controlled by a small number of transnational companies that dominate the specific crop markets. The tendency towards concentration and consolidation, both vertical and horizontal, is facilitated by economic structures and legislation that impede open access to this market by smaller breeders and seed producers, including newcomers.
Large companies such as Limagrain, KWS, Syngenta, Monsanto and Bayer have increased their market power in the European seed market by acquiring over the last 20 years many smaller and independent companies in the EU Member States. For example, Monsanto and Syngenta have acquired an important share of the EU vegetable seed sector. Limagrain and KWS have assumed an important role in cereals. Pioneer is the leader in sales of maize seed in the EU. This concentration process is still on going, especially in the new EU Member States.
These very few and globally relevant seed companies have also succeeded in controlling a large part of the European plant breeding sector.
From our analysis of the common EU catalogue of maize and tomato seeds, it is evident that a small number of companies control a huge percentage of the varieties that can be marketed in the EU. In the case of maize, just
“Who controls the food supply controls the people” Dr. Henry Kissinger
“Who controls the seed sector, controls the food sector” Dr. Vandana Shiva
“ What you’re seeing is not just a consolidation of seed companies,
it’s really a consolidation of the entire food chain” Robert Fraley (Monsanto)

Concentration of market power in the EU seed market
31
5 seed companies have around 75% of the EU market share. In the case of sugar beet, just 4 companies own around 86% of the market and 8 companies together own 99% of the EU market.
Concentration is also evident in the wheat market, which is normally considered as a non-concentrated market. Two companies, Limagrain and KWS, have substantial market shares in this crop. Unfortunately in some sectors data are incomplete, not open for public scrutiny, and so do not permit a full understanding of the market shares of other large operators.
Is the EU seed market too concentrated? According to the American economist Philip H. Howard, a rule of thumb is that when four firms control 40% of a market, it is no longer competitive: “In a number of agricultural input industries this threshold has been exceeded in recent decades. It is estimated, for example, that the top four pesticide firms currently control 59% of the global market, and the top four seed firms control 56% of the global proprietary (e.g. brand-name) seed market ”. 86
Why is this a negative evolution? First of all because of the potential risk of decreased agro-biodiversity on the fields and long-term food security. Secondly it will prevent competition and drive up input prices for farmers, as we have seen in both the EU, the US and elsewhere.
Howard states: “An important consequence is that when concentration reaches a certain threshold, the largest firms are able to ensure stable profits by ceasing to compete on the basis of price. This does not require gathering secretly together to fix prices (though this does occur), because firms of this size are able to simply signal their intention to raise prices or restrict output, with others following suit. The potential for highly concentrated markets to be non-competitive refers primarily to price and/or output, because competition may remain fierce in other arenas, such as expenditures on advertising, and research and development. One motivation for continuing competition in these arenas is that they serve as barriers to entry to other firms, thus protecting an oligopoly‘s high rate of profit.”
Various other recent official reports 87,88 indicate that the level of concentration differ from crop to crop, but nevertheless the so-called Herfindahl Index (HHI, used to calculate the level of market concentration) is under 1000 is for some crops but for some well above 1500, which indicates concentrated markets. 89
86. Visualizing Consolidation in the Global Seed Industry: 1996–2008, P. H. Howard, Sustainability 2009, 1, 1266-1287 Who Owns Nature? Corporate Power and the Final Frontier in the Commodification of Life, ETC Group, Ottawa, CA, USA, 2008.
87. Schenkelaars et al. ‘Drivers of Consolidation in the Seed Industry and its Consequences for Innovation’, 2011
88. Fugeray-Scarbel & Lemarie. Evolution de L’organisation de la recherche et du secteur des semences, 2013
89. If one would calculate the HHI for GMO crops, this would be much higher for the simple reason that the number of biotech-patents are mostly owned by only 4 companies: Monsanto, Dupont, Syngenta and Bayer. It is precisely one of the many reasons why Greens as a political group have always been consistent in their opposition to biotech-agriculture.
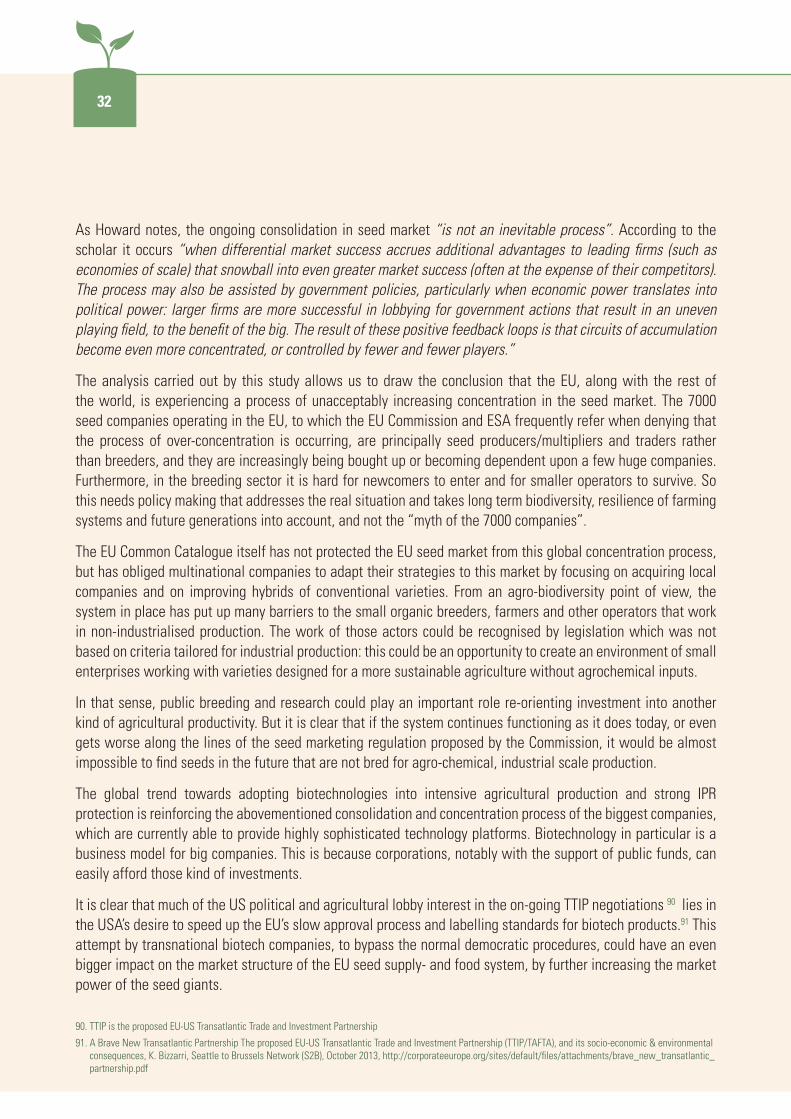
32
As Howard notes, the ongoing consolidation in seed market “is not an inevitable process”. According to the scholar it occurs “when differential market success accrues additional advantages to leading firms (such as economies of scale) that snowball into even greater market success (often at the expense of their competitors). The process may also be assisted by government policies, particularly when economic power translates into political power: larger firms are more successful in lobbying for government actions that result in an uneven playing field, to the benefit of the big. The result of these positive feedback loops is that circuits of accumulation become even more concentrated, or controlled by fewer and fewer players.”
The analysis carried out by this study allows us to draw the conclusion that the EU, along with the rest of the world, is experiencing a process of unacceptably increasing concentration in the seed market. The 7000 seed companies operating in the EU, to which the EU Commission and ESA frequently refer when denying that the process of over-concentration is occurring, are principally seed producers/multipliers and traders rather than breeders, and they are increasingly being bought up or becoming dependent upon a few huge companies. Furthermore, in the breeding sector it is hard for newcomers to enter and for smaller operators to survive. So this needs policy making that addresses the real situation and takes long term biodiversity, resilience of farming systems and future generations into account, and not the “myth of the 7000 companies”.
The EU Common Catalogue itself has not protected the EU seed market from this global concentration process, but has obliged multinational companies to adapt their strategies to this market by focusing on acquiring local companies and on improving hybrids of conventional varieties. From an agro-biodiversity point of view, the system in place has put up many barriers to the small organic breeders, farmers and other operators that work in non-industrialised production. The work of those actors could be recognised by legislation which was not based on criteria tailored for industrial production: this could be an opportunity to create an environment of small enterprises working with varieties designed for a more sustainable agriculture without agrochemical inputs.
In that sense, public breeding and research could play an important role re-orienting investment into another kind of agricultural productivity. But it is clear that if the system continues functioning as it does today, or even gets worse along the lines of the seed marketing regulation proposed by the Commission, it would be almost impossible to find seeds in the future that are not bred for agro-chemical, industrial scale production.
The global trend towards adopting biotechnologies into intensive agricultural production and strong IPR protection is reinforcing the abovementioned consolidation and concentration process of the biggest companies, which are currently able to provide highly sophisticated technology platforms. Biotechnology in particular is a business model for big companies. This is because corporations, notably with the support of public funds, can easily afford those kind of investments.
It is clear that much of the US political and agricultural lobby interest in the on-going TTIP negotiations 90 lies in the USA’s desire to speed up the EU’s slow approval process and labelling standards for biotech products.91 This attempt by transnational biotech companies, to bypass the normal democratic procedures, could have an even bigger impact on the market structure of the EU seed supply- and food system, by further increasing the market power of the seed giants.
90. TTIP is the proposed EU-US Transatlantic Trade and Investment Partnership
91. A Brave New Transatlantic Partnership The proposed EU-US Transatlantic Trade and Investment Partnership (TTIP/TAFTA), and its socio-economic & environmental consequences, K. Bizzarri, Seattle to Brussels Network (S2B), October 2013, http://corporateeurope.org/sites/default/files/attachments/brave_new_transatlantic_partnership.pdf

Concentration of market power in the EU seed market
33
What can we expect in case of a policy status quo? In the absence of significant changes in the forces affecting the global seed industry, Howard expects“consolidation to continue at a rapid pace. Industry analysts note that for remaining independent seed companies � many of them may have to consider strategic alliances or exit strategies. Based on trends in other industries, this will eventually result in a stable oligopoly, with perhaps as few as 2 to 4 firms or clusters of firms. Monsanto is most likely to remain as one of these, due to its dominance in traits with intellectual property protections, and willingness to aggressively and strategically exert their economic and political power to increase profits. The pharmaceutical/chemical/seed oligopoly has already achieved high market shares for major crops in industrialized countries, as well as in countries with large, emerging markets. Strategies of accumulation will continue to extend the commodification process to all seeds, and an increasing number of countries, however. In addition, oligopolies will become even more dominant across multiple farm input and output sectors through the further coalescence of food chain clusters.”
This is clearly not the way to go for a healthy and sustainable European agriculture. Sustainable agricultural or agro-ecological practices of saving seed and replanting on farm level are at direct odds with increasing profits and power of the global seed giants. “Increasing the opportunities for renewable agriculture requires reversing these trends, but such a reversal is unlikely unless major political and economic changes are enacted,” concludes Howard. Given the importance of the issue, EU institutions ought to provide better tools in order to reverse these trends, and could start at the very least by recognising the seriousness of the issue, rather than citing statistics provided by the big players of the seed industry.
EU law making should be done with a clear and transparent picture of a situation. In this case, it is crucial that the European Commission’s competition authorities start a preliminary antitrust investigation into the seed market concentration, as was started by US authorities.
In addition, it should be investigated whether the genetic diversity of varieties on the EU market has increased or decreased, as the Dutch government was advised in March 2011 92 . Furthermore, the European Commission should investigate if the number of varieties in the EU Common Catalogue, rather than being inappropriately used as an indicator of genetic diversity, is not in fact somehow hiding a shrinking genetic base of modern agriculture and food supply.
92. COGEM is the Netherlands Commission on Genetic Modification, an independent scientific advisory committee composed of scientists, who submitted policy suggestions to the Dutch government in March 2011 (www.cogem.net)

34
ANNEX
DeKalb(1995)
HybriTech(1995)
SementesAgroceres
CustomFarmSeed
DeKalbAyalaAyala
AgriProWheat
HybriTechEurope
PauEuralis
Seminis
Cargill's intl. seed division
FirstLine
JacobHartz(1995)
Asgrow
Holdens
Renessen
Cargill
Calgene
CargillNorthAmerica
Agracetus
PBIC
Unilever
Monsoy
FTSementes
DeltaPineLand
Syngenta'sGlobal Cotton Division
Paras
Mahendra
Daehnfeldt
ASI
Crows
MidwestSeedGenetics
WilsonSeeds
GoldCountry
HeritageSeeds
NCPlusHybridsSpecialtyHybrids
Fontanelle
StewartSeeds
TrelaySeeds
StoneSeeds
CornBelt
AdvantaCanola
HubnerSeedLewisHybrids
REA
MoweaquaSeeds
iCORN
Jung
BoCa
InterstateCanola
Sensako
Agroeste
CDMMandiyu
Ciagro
Carnia
Diener
Sieben
KrugerTrisler
CampbellSeed
FieldersChoice
HeartlandHybrids
Hawkeye
NebraskaIrrigated
LimagrainCanada
Poloni
ISG
Western
Peotec
Mahyco
Terrazawa
DeRuiter
AlyParticipacoes(CanaVialis;
Alellyx)
Marmot
CottonStates
Stoneville
CornStatesHybrid
CornStatesIntl
Ecogen
CNDK
ChinaSeed
EIDParryRallis
Gustafson
Nunhems(1995)
Paragon SeedEx
Aventis AgrEvo
Schering
Proagro
SementesRibeiral
SementesFartura
MitlaPesquisa
Granja4Irmaos
AgrEvoCottonPGS
PlanTecBiotech
GeneXSorghum
CottonSeedIntl
Sunseeds
Hoechst
Nunza(1986)
RhonePoulenc
LeenDeMos
RioColorado
CaliforniaPlantingCotton
RelianceGeneticsAssocFarmersDelinting
NideraSemillas
Nidera
Pioneer
CurrySeedShandongDenghaiPioneer
Denghai Dunhuang
DunhuangPioneer
DoisMarcos
Hybrinova
Solae (ProteinTech. Int.)
OptimumQualityGrains
SPS
GoldenHarvest
Goldsmith
ResourceSeeds
ZeraimGedera
Sanbei
Fischer
AdvantaNACornSoybeans
GarstInterstatePayco
AgriPro
PSAGenetics
Gutwein
DiaEngeiNovartis
CibaGeigy
Sandoz
AstraZeneca
AstraZenecaMogen
ExSeed Genetics
Thurston
Maisadour
KoipesolAgrosemAgra
EridaniaBeghinSay/Koipe
SturdyGrow
Agritrading
NorthrupKing
AdvantaEUVegetable
Westhove
HarrisMoran
Clause
BiogemmaRhoBio
AgReliant
Wensman
ProducersHybrids
LochowPetkus(1967)
CPBTwyford
Hazera
CarlSperling
Kyowa
Innoseeds
BioSeeds
VandenBerg
GermainsCotton
HollandCottonseed
�>;C:M180%110�185:@5:3
HelenaCotton
Indusem
Agroceres
Barham
Petoseed(1995)
RoyalSluis(1995)
ChoongAng
Horticeres
Bruinsma(1994)
Genecorp(1994)
Hungnong
GreenLeafGenetics
Danisco
Avesthagen
ConradFafard
LongReach
AWB
Swaghat
CeeKay
AustralianGrainTech
YuanLongping
DairylandSeed
Mycogen
BioPlantResearch
RenzeHybrids
Agromen
MTI
Sudwestsaat
Brodbeck
DuoMaize
Triumph
EmpresaBrasileira
Hytest ABIAlfalfa
SpecialtyGrains
CooperativeBusinessIntl
AgrilianceCenexHarvest
FarmlandIndustries
Cenex
HarvestStates
SOYGENETICS
FFRCoop
NickersonVerneuil
MorganUnitedAgriseeds
HibridosColorado
BiogeneticaDeMilho
DinamilhoCarolPhytogen
JGBoswell
IllinoisFoundation
AdvancedAgriTraits
Seed Industry Structure1996 - 2013
Phil Howard, Associate Professor, Michigan State Universityhttp://www.msu.edu/~howardp
Chemical Companies
Zimmerman
Seed Companies
Other Companies
Partial OwnershipSize proportional to global seed market shareFull Ownership
Sunseeds
CropDesign
(1995)
Roussel-Uclaf
Dahlco
joint research & development
Becker Underwood
Kenfeng-KWS
Kenfeng
Genective
GreatLakes CerealGrains
SunbeamExtract
SemíliaGenética Melhoramento
Riber
DeltaPesquisa
Devgen
%A:M180
Maribo
Pybas
Synergene
Monsanto's global hybrid
?A:N;C1>�?110?MayAgro's vegetable breeding
Metabolon
PasteuriaBioscience
CircleOne Global
Doebler'sPennsylvania
Hybrids
TerralNandi's
cotton business
Pannar
SeedConsultants
NuTech
Nagarjuna's cotton
germplasm
AgVenture
Hoegemeyer Hybrids
Verdia
Warner
AgSource
AnhuiHengji
Link
Eurodur
GeneticaAgricola
BiscoBioSciences
Brasmilho's corn & sorghum seed
Anadolu
Century
MaïcentreDomagri
ClovisMatton
Atash
LSL
K&BDevpt's onion business
SuTarim
Mikado
CampbellSoupCo's vegetable seed
wheat joint venture
DonMario
Cal/West PrairieBrandSeeds
NorthwestPlantBreeding
HRZWheats
GrandValleyHybrids
Hyland
"M?@1>�E.>50?
Floragenex
MelhoramentoAgropastoril's soy
germplasmWehrtec
ProSoyGenetics' germplasm
Abbot&Cobb's melon seed
businessSoyTech
Hornbeck
RapsGBR's canola business
EUROSORT
SORT
Prophyta
Agrauxine
AgraQuestAgroGreen's
BioNem
Athenix
Pannon
InterGrain
Seminium
WestBred
SemillasCristianiBurkard
Divergence
Beeologics
PrecisionPlanting
RaNATherapeutics
GrassrootsBiotechnology
RosettaGreen
SyntheticGenomics
Inc.
EmergentGenetics
Monsanto
Syngenta DuPont
Land O'Lakes
KWS
Limagrain-Vilmorin
Bayer
Dow
BASF
ChannelBio

Concentration of market power in the EU seed market
35
DeKalb(1995)
HybriTech(1995)
SementesAgroceres
CustomFarmSeed
DeKalbAyalaAyala
AgriProWheat
HybriTechEurope
PauEuralis
Seminis
Cargill's intl. seed division
FirstLine
JacobHartz(1995)
Asgrow
Holdens
Renessen
Cargill
Calgene
CargillNorthAmerica
Agracetus
PBIC
Unilever
Monsoy
FTSementes
DeltaPineLand
Syngenta'sGlobal Cotton Division
Paras
Mahendra
Daehnfeldt
ASI
Crows
MidwestSeedGenetics
WilsonSeeds
GoldCountry
HeritageSeeds
NCPlusHybridsSpecialtyHybrids
Fontanelle
StewartSeeds
TrelaySeeds
StoneSeeds
CornBelt
AdvantaCanola
HubnerSeedLewisHybrids
REA
MoweaquaSeeds
iCORN
Jung
BoCa
InterstateCanola
Sensako
Agroeste
CDMMandiyu
Ciagro
Carnia
Diener
Sieben
KrugerTrisler
CampbellSeed
FieldersChoice
HeartlandHybrids
Hawkeye
NebraskaIrrigated
LimagrainCanada
Poloni
ISG
Western
Peotec
Mahyco
Terrazawa
DeRuiter
AlyParticipacoes(CanaVialis;
Alellyx)
Marmot
CottonStates
Stoneville
CornStatesHybrid
CornStatesIntl
Ecogen
CNDK
ChinaSeed
EIDParryRallis
Gustafson
Nunhems(1995)
Paragon SeedEx
Aventis AgrEvo
Schering
Proagro
SementesRibeiral
SementesFartura
MitlaPesquisa
Granja4Irmaos
AgrEvoCottonPGS
PlanTecBiotech
GeneXSorghum
CottonSeedIntl
Sunseeds
Hoechst
Nunza(1986)
RhonePoulenc
LeenDeMos
RioColorado
CaliforniaPlantingCotton
RelianceGeneticsAssocFarmersDelinting
NideraSemillas
Nidera
Pioneer
CurrySeedShandongDenghaiPioneer
Denghai Dunhuang
DunhuangPioneer
DoisMarcos
Hybrinova
Solae (ProteinTech. Int.)
OptimumQualityGrains
SPS
GoldenHarvest
Goldsmith
ResourceSeeds
ZeraimGedera
Sanbei
Fischer
AdvantaNACornSoybeans
GarstInterstatePayco
AgriPro
PSAGenetics
Gutwein
DiaEngeiNovartis
CibaGeigy
Sandoz
AstraZeneca
AstraZenecaMogen
ExSeed Genetics
Thurston
Maisadour
KoipesolAgrosemAgra
EridaniaBeghinSay/Koipe
SturdyGrow
Agritrading
NorthrupKing
AdvantaEUVegetable
Westhove
HarrisMoran
Clause
BiogemmaRhoBio
AgReliant
Wensman
ProducersHybrids
LochowPetkus(1967)
CPBTwyford
Hazera
CarlSperling
Kyowa
Innoseeds
BioSeeds
VandenBerg
GermainsCotton
HollandCottonseed
�>;C:M180%110�185:@5:3
HelenaCotton
Indusem
Agroceres
Barham
Petoseed(1995)
RoyalSluis(1995)
ChoongAng
Horticeres
Bruinsma(1994)
Genecorp(1994)
Hungnong
GreenLeafGenetics
Danisco
Avesthagen
ConradFafard
LongReach
AWB
Swaghat
CeeKay
AustralianGrainTech
YuanLongping
DairylandSeed
Mycogen
BioPlantResearch
RenzeHybrids
Agromen
MTI
Sudwestsaat
Brodbeck
DuoMaize
Triumph
EmpresaBrasileira
Hytest ABIAlfalfa
SpecialtyGrains
CooperativeBusinessIntl
AgrilianceCenexHarvest
FarmlandIndustries
Cenex
HarvestStates
SOYGENETICS
FFRCoop
NickersonVerneuil
MorganUnitedAgriseeds
HibridosColorado
BiogeneticaDeMilho
DinamilhoCarolPhytogen
JGBoswell
IllinoisFoundation
AdvancedAgriTraits
Seed Industry Structure1996 - 2013
Phil Howard, Associate Professor, Michigan State Universityhttp://www.msu.edu/~howardp
Chemical Companies
Zimmerman
Seed Companies
Other Companies
Partial OwnershipSize proportional to global seed market shareFull Ownership
Sunseeds
CropDesign
(1995)
Roussel-Uclaf
Dahlco
joint research & development
Becker Underwood
Kenfeng-KWS
Kenfeng
Genective
GreatLakes CerealGrains
SunbeamExtract
SemíliaGenética Melhoramento
Riber
DeltaPesquisa
Devgen
%A:M180
Maribo
Pybas
Synergene
Monsanto's global hybrid
?A:N;C1>�?110?MayAgro's vegetable breeding
Metabolon
PasteuriaBioscience
CircleOne Global
Doebler'sPennsylvania
Hybrids
TerralNandi's
cotton business
Pannar
SeedConsultants
NuTech
Nagarjuna's cotton
germplasm
AgVenture
Hoegemeyer Hybrids
Verdia
Warner
AgSource
AnhuiHengji
Link
Eurodur
GeneticaAgricola
BiscoBioSciences
Brasmilho's corn & sorghum seed
Anadolu
Century
MaïcentreDomagri
ClovisMatton
Atash
LSL
K&BDevpt's onion business
SuTarim
Mikado
CampbellSoupCo's vegetable seed
wheat joint venture
DonMario
Cal/West PrairieBrandSeeds
NorthwestPlantBreeding
HRZWheats
GrandValleyHybrids
Hyland
"M?@1>�E.>50?
Floragenex
MelhoramentoAgropastoril's soy
germplasmWehrtec
ProSoyGenetics' germplasm
Abbot&Cobb's melon seed
businessSoyTech
Hornbeck
RapsGBR's canola business
EUROSORT
SORT
Prophyta
Agrauxine
AgraQuestAgroGreen's
BioNem
Athenix
Pannon
InterGrain
Seminium
WestBred
SemillasCristianiBurkard
Divergence
Beeologics
PrecisionPlanting
RaNATherapeutics
GrassrootsBiotechnology
RosettaGreen
SyntheticGenomics
Inc.
EmergentGenetics
Monsanto
Syngenta DuPont
Land O'Lakes
KWS
Limagrain-Vilmorin
Bayer
Dow
BASF
ChannelBio

36
ANNEX
BASF
DuPont
Syngenta
MonsantoDow
Bayer
Cross-licensing Agreements for Genetically Engineered
Seed Traits
Phil Howard, Michigan State University September 2013

Concentration of market power in the EU seed market
37
NOTES

38
NOTES

Concentration of market power in the EU seed market
39
NOTES
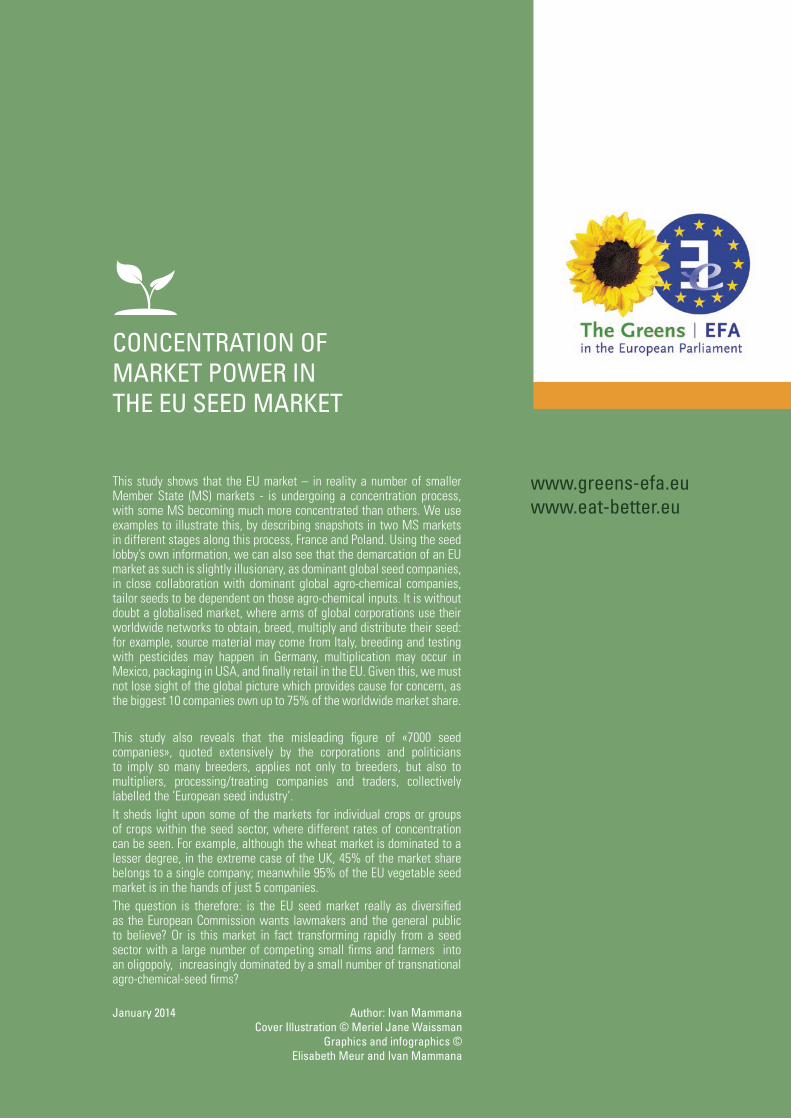
CONCENTRATION OF MARKET POWER IN THE EU SEED MARKET
This study shows that the EU market – in reality a number of smaller Member State (MS) markets - is undergoing a concentration process, with some MS becoming much more concentrated than others. We use examples to illustrate this, by describing snapshots in two MS markets in different stages along this process, France and Poland. Using the seed lobby’s own information, we can also see that the demarcation of an EU market as such is slightly illusionary, as dominant global seed companies, in close collaboration with dominant global agro-chemical companies, tailor seeds to be dependent on those agro-chemical inputs. It is without doubt a globalised market, where arms of global corporations use their worldwide networks to obtain, breed, multiply and distribute their seed: for example, source material may come from Italy, breeding and testing with pesticides may happen in Germany, multiplication may occur in Mexico, packaging in USA, and finally retail in the EU. Given this, we must not lose sight of the global picture which provides cause for concern, as the biggest 10 companies own up to 75% of the worldwide market share.
This study also reveals that the misleading figure of «7000 seed companies», quoted extensively by the corporations and politicians to imply so many breeders, applies not only to breeders, but also to multipliers, processing/treating companies and traders, collectively labelled the ‘European seed industry’. It sheds light upon some of the markets for individual crops or groups of crops within the seed sector, where different rates of concentration can be seen. For example, although the wheat market is dominated to a lesser degree, in the extreme case of the UK, 45% of the market share belongs to a single company; meanwhile 95% of the EU vegetable seed market is in the hands of just 5 companies.The question is therefore: is the EU seed market really as diversified as the European Commission wants lawmakers and the general public to believe? Or is this market in fact transforming rapidly from a seed sector with a large number of competing small firms and farmers into an oligopoly, increasingly dominated by a small number of transnational agro-chemical-seed firms? January 2014 Author: Ivan Mammana Cover Illustration © Meriel Jane Waissman Graphics and infographics © Elisabeth Meur and Ivan Mammana
www.greens-efa.euwww.eat-better.eu