computer-assisted enhanced volumetric segmentation ...oa.upm.es/6138/1/barreiro_58.pdf ·...
TRANSCRIPT

Computer-assisted enhanced volumetric segmentation magnetic resonance imaging data using a mixture of artificial neural networks
Rigoberto Pérez de Alejoa, Jesús Ruiz-Cabelloa'*, Manuel Cortijoa, Ignacio Rodrigueza, Imanol Echaveb, Javier Regadera0, Juan Arrazolad, Pablo Aviles6, Pilar Barreiroa,
Domingo Gargallof, Manuel Grañab
'"Unidad de RMN & Departamento de Físico-Química II, Universidad Complutense de Madrid, Madrid, Spain ""Departamento de Ciencias de la Computación e Inteligencia Artificial, Facultad de Informática, Universidad del País Vasco, San Sebastián, Spain
"Departamento de Morfología, Escuela de Medicina, Universidad Autónoma de Madrid, Madrid, Spain dDepartamento de Diagnóstico por Imagen, Hospital Clínico San Carlos, Madrid, Spain
"Departamento Preclínica, Pharmamar, Tres Cantos, Madrid, Spain departamento de Investigación de Quimioterapia, GSK, Tres Cantos, Madrid, Spain
Abstract
An accurate computer-assisted method able to perform regional segmentation on 3D single modality images and measure its volume is designed using a mixture of unsupervised and supervised artificial neural networks. Firstly, an unsupervised artificial neural network is used to estímate representative textures that appear in the images. The región of interest of the resultant images is selected by means of a multi-layer perceptron after a training using a single sample slice, which contains a central portion of the 3D región of interest.
The method was applied to magnetic resonance imaging data collected from an experimental acute inflammatory model (T2 weighted) and from a clinical study of human Alzheimer's disease (Tj weighted) to evalúate the proposed method. In the first case, a high correlation and parallelism was registered between the volumetric measurements, of the injured and healthy tissue, by the proposed method with respect to the manual measurements (r = 0.82 and/> < 0.05) and to the histopathological studies (r = 0.87 and/> < 0.05). The method was also applied to the clinical studies, and similar results were derived of the manual and semi-automatic volumetric measurement of both hippocampus and the corpus callosum (0.95 and 0.88).
1. Introduction
Current imaging techniques have demonstrated high re-liability for differential diagnosis and for evaluating the response to therapy of some pathologies. Their additional combination with digital image processing and automated recognition techniques increases the accuracy in quantifying the size of different lesions and their feature extraction [1,2]. This results in shorter analysis time, a reduction of operator bias, and consistent identification of tissue types. A
final goal is to establish automated and accurate methodol-ogy for performing segmentation and volume measurement of images. Moreover, non-subjective methods are especially useful when the decisions must be taken by consensus among several clinicians [1]. Inthis regard, Artificial Neural Networks (ANN) [3-5] and Statistical Pattern Recognition [6,7] are appropriate tools for building automated image analysis systems. ANNs have already been recognized as a decisión aid [1] based on qualitative and quantitative fea-tures extracted from medical images: i. e., mammography diagnosis [8] and segmentation of brain structure [9,10]. One intrinsic problem to all these fully automatic segmentation methods is their final ability to cope with complex shapes and tissue size variability. Thus, an interactive or supervised part is generally included in the classification process to ensure a more reliable result. In this line, other very flexible approaches for segmentation and quantifica-tion of the shape and size of regions of interest, such as snakes or deformable shape models, have been introduced

to provide a priori knowledge of location and shape [11]. These methods yield in some cases excellent results al-though the general procedure for the placement of needed human landmarks is time-consuming and the long posterior computational surface fitting is known to be very sensitive to the initial positions [12].
Clinical therapeutic studies (e.g., brain tumor volume) are highly demanding for these types of imaging procedures and automated image analysis tools, which may allow non-invasive monitoring of some disease processes and of the effects of a given pharmacological treatment on tissue mor-phology, physiology or biochemistry [13]. These procedures may help to speed up the evaluation of the mechanism and the pharmacokinetic, pharmacodynamic and safety pro-files of a candidate drug in pre-clinical research involving animal models [14]. The possibility of performing longitudinal studies is attractive from the economic point of view and has direct consequences on the experiment design. The consequent reduction in the number of experimental sub-jects required is spectacular. Moreover, automated analysis and recognition procedures might also increase the role of these non-invasive techniques, since the amount of data necessary to reach statistical significance is still enormous.
Several diagnostic approaches to some neurodegenera-tive diseases are supported by the volumetric measurements of different structures in the human brain; e.g., the volumes of the hippocampus and parahippocampal gyrus have been observed to be significantly different in patients with Alz-heimer's disease versus healthy people, and these observa-tions were correlated with the overall measurement of some cognitive functions [15]. Moreover, the determination of 3D volumes of the hippocampus is an excellent candidate for assessing the limits of any new automated method for imaging quantification, due to its small size and lack of struc-ture definition [9,16]. The corpus callosum is recognized as an indicator of interhemispheric connectivity. Its volume measurement is also of interest for the study of some neu-ropathologies.
The Kohonen's Self Organizing Map (SOM) [17] has been used to process clinical multi-spectral, and functional MRI data with the aim of obtaining a clustering of pixel or voxel profiles. SOM and Multi-Layer Perceptron (MLP) have been used in hybrid ANN approaches for the detection of osteosarcoma [18]. Besides this method, other clustering techniques, i.e., fuzzy clustering, have been applied to Mag-netic Resonance Imaging (MRI) segmentation [19-21]. Most of the works on MRI segmentation are applied to multiecho (multispectral) images [22,23], however the higher acquisition time of the multiecho images and the need for fine registration between images justifies the research on segmentation of single modality images.
In this study, we describe the theoretical basis and some applications of an innovative combination of two ANNs, one with unsupervised training and the other one with su-pervised training, addressing the problem of the segmenta
tion of anatomic structures in MRI, and that allows its accurate volumetric measurements.
2. Material and methods
2.1. Experimental animal moclel data
Serial studies of mice (n = 16) intramuscularly (i.m.) inoculated with Aspergillus fumigatus (suspensions with final concentration approximately 1010 spores/ml in phos-phate buffer saline) were carried out with each animal at different days of acute infection, ranging from Days 0 to 14 post-inoculation This research complied with European legislatura on the care and use of animáis, the National Institutes of Health (NIH) guidelines for the use of labora-tory animáis and related codes of practice.
Imaging was performed using a Bruker Biospec 47/40 spectrometer (Ettlingen, Germany) with a customized-bird-cage resonator. Animáis were prone and similarly located in each experiment. The animáis were placed in such a way that the two legs were inserted side by side into the coil. After a first scout sequence, fast T2-weighted 3D data sets (256 X 256 X 32) of axial images were acquired with TR/TEeffeotlve valúes of 2000/67.5 ms and 40 X 40 X 22 mm field of view.
The proposed method was applied to quantify the volume of innamed muscle and necrosis in an abscessing lesión with an acute and chronic innammation course. Manual and semi-automatic detection and segmentation of the damaged tissues of all animáis were used to test our computer analysis methodology. The results were correlated to histologic analysis. Only images corresponding to Days 3, 7 and 14 after inoculation were used for image processing, since the corresponding animáis were only histologically studied on these days. After finishing MRI experiments, both infected and contralateral control extremities were dissected and placed in 10% formalin buffered solution for at least 48 h, followed by transverse sectioning at 2 mm intervals along the length of the limb. We tried to ensure that each plañe of these histologic sections closely corresponded to the same level of an axial slice in MRI. Six sections from both the infected and control pieces were embedded in paraffin wax for histologic studies. Histologic sections were stained with hematoxylin-eosin and Masson's trichrome stain, as well as Periodic Acid of Schiff for the histochemical detection of spores and hyphae of A. fumigatus.
2.2. Clinical data
In this clinical study, patients were voluntarily enrolled in a blind magnetic resonance (MR) imaging study of Alz-heimer's disease. In accordance with the institutional re-view board requirements, written informed consent was obtained from all subjects after they were made aware of the procedures involved in this study. The hippocampus and

Most representative slice out of 3D stack
Manually
Región of interest ¡n the most representative slice
3D-Original image Set
3D-Classified image Set m
N=9 M=[5,7]
H
MLP
P=27 H=12 0=1
3D-segmented región of interest
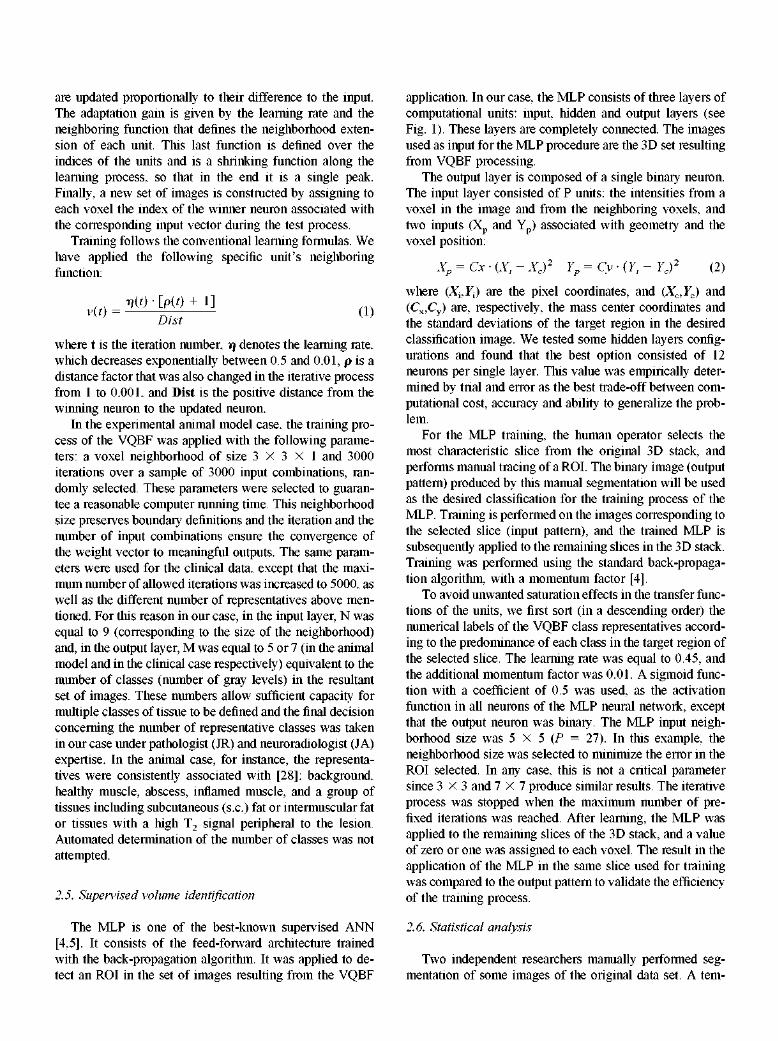
Fig. 1. Scheme showing the ANNs in the computer-assisted 3D-image segmentation. The intensity of each voxel and its área were used to input data in both ANN and two additional neurons to yield some implicit geometric information about the voxel in the MLP. The VQBF computes a set of representatives from the original data set. The number of neurons in the output layer was equal to the number of classes (5 for the animal model and 7 for the clinical case). Subsequently, the MLP is trained using the VQBF classification of a single characteristic image and the manual outlining of the ROÍ in this image. The result of the MLP training is applied to the VQBF-classified 3D-images, and the 3D-ROIs are obtained in all of them.
corpus callosum (four of these subjects) were segmented on the total brain image data as excellent candidate structures for possible differences. MRI was performed using a Signa General Electric 1.5T Medical System scanner. A standard General Electric quadrature-birdcage resonator was em-ployed for imaging acquisition. After a first scout sequence, fast-spoiled-gradient-recalled acquisition in the steady-state 3D data set (256 X 192 X 124) images were acquired in the axial plañe with TR/TE valúes of 14.6/3.1 ms and 240 X 180 X 160 mm field of view.
2.3. Methodology of the data processing
Our proposal consists in a semi-automatic process that applies two types of ANN to isolate and classify the 3D structures and allow the measurement of its volume. The original data sets were initially preprocessed by means of an ANN based on the Vector Quantization (VQ) [24]. Prepro-cessing consists inthe classification of each voxel according to its neighborhood, where a voxel's neighborhood is a block centered on that voxel. We cali this method Vector Quantization Bayesian Filtering (VQBF) [25-27]. A new set of gray scale images, with the same spatial dimensión of the original set, is the result of the application of this ANN. The number of gray levéis depends on the number of representative classes desired to characterize the tissue in the MRI.
Ensuing semi-automatic identification of the lesión or the región of interest (ROÍ) was attained by an MLP. The result
of this ANN is another new set of binary images with the same dimensión, where the valué equal to one represents the ROÍ in the 3D set.
In one of the applications discussed here, after selecting the ROÍ, a new unsupervised VQBF segmentation may be necessary, e.g., the discrimination of necrotic and edema-tous tissues in the inflamed región [28]. A detailed expla-nation of the procedures and parameter settings follows. Fig. 1 illustrates the whole process.
2.4. Unsupervised segmentation: VQBF
The VQBF may be visualized as the application of the VQ to overlapping voxel neighborhoods, selected by a slid-ing window. The VQBF is a two-layer ANN with N neurons in the input layer and M in the output layer. Each input neuron is connected with the output neurons through feed-forward connections. Each neuron in the output layer has some influence over its neighboring units, depending on the distance in the index space between them (see Fig. 1). The voxel neighborhoods are defined in three dimensions be-cause we deal with 3D data: (nx, nY, nz) gives the neighborhood size in each dimensión, with Z meaning the slice number. The learning mechanism is unsupervised, stochas-tic and competitive.
The adaptation of the ANN units to new input data starts with detection of the cluster to which the input data belongs, searching for the closest unit in the Euclidean distance sense. Subsequently, the winning unit and its neighbor units
are updated proportionally to their difference to the input. The adaptation gain is given by the learning rate and the neighboring function that defines the neighborhood extensión of each unit. This last function is defined over the Índices of the units and is a shrinking function along the learning process, so that in the end it is a single peak. Finally, a new set of images is constructed by assigning to each voxel the index of the winner neuron associated with the corresponding input vector during the test process.
Training follows the conventional learning formulas. We have applied the following specific unit's neighboring function:
where t is the iteration number, rj denotes the learning rate, which decreases exponentially between 0.5 and 0.01, p is a distance factor that was also changed in the iterative process from 1 to 0.001, and Dist is the positive distance from the winning neuron to the updated neuron.
In the experimental animal model case, the training process of the VQBF was applied with the following parame-ters: a voxel neighborhood of size 3 X 3 X 1 and 3000 iterations over a sample of 3000 input combinations, ran-domly selected. These parameters were selected to guaran-tee a reasonable computer running time. This neighborhood size preserves boundary definitions and the iteration and the number of input combinations ensure the convergence of the weight vector to meaningful outputs. The same parameters were used for the clinical data, except that the máximum number of allowed iterations was increased to 5000, as well as the different number of representatives above men-tioned. For this reason in our case, in the input layer, N was equal to 9 (corresponding to the size of the neighborhood) and, in the output layer, M was equal to 5 or 7 (in the animal model and in the clinical case respectively) equivalent to the number of classes (number of gray levéis) in the resultant set of images. These numbers allow sufficient capacity for múltiple classes of tissue to be defined and the final decisión concerning the number of representative classes was taken in our case under pathologist (JR) and neuroradiologist (JA) expertise. In the animal case, for instance, the representatives were consistently associated with [28]: background, healthy muscle, abscess, innamed muscle, and a group of tissues including subcutaneous (s.c.) fat or intermuscular fat or tissues with a high T2 signal peripheral to the lesión. Automated determination of the number of classes was not attempted.
2.5. Supervisen volume identification
The MLP is one of the best-known supervised ANN [4,5]. It consists of the feed-forward architecture trained with the back-propagation algorithm. It was applied to de-tect an ROÍ in the set of images resulting from the VQBF
application. In our case, the MLP consists of three layers of computational units: input, hidden and output layers (see Fig. 1). These layers are completely connected. The images used as input for the MLP procedure are the 3D set resulting from VQBF processing.
The output layer is composed of a single binary neuron. The input layer consisted of P units: the intensities from a voxel in the image and from the neighboring voxels, and two inputs (Xp and Y ) associated with geometry and the voxel position:
X ^ = C x - ( X , - X c ) 2 Y^CyiYt-Yf (2)
where (X^F;) are the pixel coordinates, and (XC,YC) and (Cx,Cy) are, respectively, the mass center coordinates and the standard deviations of the target región in the desired classification image. We tested some hidden layers config-urations and found that the best option consisted of 12 neurons per single layer. This valué was empirically deter-mined by trial and error as the best trade-off between computational cost, accuracy and ability to generalize the prob-lem.
For the MLP training, the human operator selects the most characteristic slice from the original 3D stack, and performs manual tracing of a ROL The binary image (output pattern) produced by this manual segmentation will be used as the desired classification for the training process of the MLP. Training is performed on the images corresponding to the selected slice (input pattern), and the trained MLP is subsequently applied to the remaining slices in the 3D stack. Training was performed using the standard back-propagation algorithm, with a momentum factor [4].
To avoid unwanted saturation effects in the transfer func-tions of the units, we first sort (in a descending order) the numerical labels of the VQBF class representatives accord-ing to the predominance of each class in the target región of the selected slice. The learning rate was equal to 0.45, and the additional momentum factor was 0.01. A sigmoid function with a coefficient of 0.5 was used, as the activation function in all neurons of the MLP neural network, except that the output neuron was binary. The MLP input neighborhood size was 5 X 5 (P = 27). In this example, the neighborhood size was selected to minimize the error in the ROÍ selected. In any case, this is not a critical parameter since 3 X 3 and 7 X 7 produce similar results. The iterative process was stopped when the máximum number of pre-fixed iterations was reached. After learning, the MLP was applied to the remaining slices of the 3D stack, and a valué of zero or one was assigned to each voxel. The result in the application of the MLP in the same slice used for training was compared to the output pattern to validate the efficiency of the training process.
2.6. Statistical analysis
Two independent researchers manually performed segmentation of some images of the original data set. A tem-

poral inter-measurement lag, never less than one hour, was chosen to minimize error from the subjective boundary placement relative to the anatomic landmarks. The traces were outlined on each slice in a non-consecutive order again to avoid memory influence.
All slices from three animáis were manually segmented in triplicate. In addition, the whole set of original slices was manually segmented for all animáis studied with the aim of performing a detailed statistical analysis of the influence of the characteristic slice chosen to feed the MLP training on the final results. For manual drawing and pixel counting of each región (both in histopathological images and in MRI), Adobe Photoshop v. 5.5 for Macintosh was used. In the case of the histologic images, the pixel counting of each sketched área was done after gray scale transformation and binary conversión by histogram thresholding.
The data were analyzed by ANOVA or correlation pro-cedures using SPSS for Windows, reléase 10.0.6, in order to determine any possible statistically significant difference among the áreas (for each slice of the ROÍ) and volumes (for the whole ROÍ). For all comparisons, tests for parallel measurements were performed by verifying that both means (Student's / test with/? < 0.01) and variances (F of Snede-cor test with/? < 0.01) were statistically equal.
However, the comparison between manual and comput-er-assisted results may be misleading, because the absolute áreas or volumes may be similar by both methods and yet not include the same voxels and therefore the same tissue. For this reason, we have also performed a statistical analysis of the computer-assisted method versus the manual segmen-tation. This analysis is based on a simplified Receiver Op-erating Characteristic (ROC) analysis [29,30]. The follow-ing Índices were evaluated:
i. Overlapping áreas or volumes (S), also called sim-ilarity or repeatability, defined as follows [31-33,16]:
where A n B stands for the intersection and A U B for the corresponding unión between the A and B áreas or volumes determined manually and by the computer, respectively.
ii. The similarity Kappa index (Ki), defined as follows [34-36,16]:
Other indexes were also computed [16]
iii. The trae positive fraction (TPF), which gives a measurement of the sensitivity of the method, corresponding to the probability of detection:
A HB TPF = Sensitivity = —-— (5)
B
iv. The false positive fraction (FPF), which is related to the probability of false alarm and gives a mea-sure of the specificity (specificity = 1 - FPF)
\A - B\ FPF = ]—^- (6)
where Bc is the complement of B.
2.7. Platform and computing time efficiency
The whole process has been programmed in IDL 5.4 (Research Systems Inc, Boulder, Co) on a Macintosh Pow-erBook G3 500. The computing time for all automatic steps in each 3D data set of, for example, 256 X 256 X 32 voxels was about 2 min for the VQBF and about 9 min for the MLP procedure. The time taken for manual drawing of the target región in the most characteristic slice was approximately two minutes. The time taken for a whole manual segmen-tation of a typical 3D-set containing 20 slices was about 40 min.
3. Results
3.1. Experimental animal data
The methodological approach followed in all cases can be seen in the example given in Fig. 2. Fig. 2A shows a chosen slice from the central lesión of the original MRI volume, while Fig. 2B displays the result of the VQBF classification. The damaged área is well segmented and includes several tissue lesions. The manual drawing to clas-sify the ROÍ in affected and unaffected áreas (ground truth) as specified by the specialist for the image in Fig. 2A is shown in Fig. 2C. The images in the Fig. 2B (input pattern) and 2C (output pattern) were used for training of the MLP, which was applied to this and all other slices from the 3D data set corresponding to this animal. Fig. 2D shows the result after a second application of the VQBF on the original images masked with the MLP result. The automated voxel counting per each of the different classes multiplied by the volume of the individual voxel, yields the corresponding volumes.
For statistical reasons, we selected only ten slices for this study (always those surrounding the central lesion-slice) of three different mice. We alternatively used each of them as the characteristic slices (10 segmentations per mouse) for MLP training. An ANOVA was applied with the number of pixels resulting both from the proposed method, 10 X 10 slices, and with the manually measured, 6 X 10 slices (see Material and Methods), in an attempt to determine whether the differences observed were due to random errors or to

Fig. 2. Axial images of the inflamed lesión corresponding to a mouse seven days after inoculation with A fumigatus. A. One of the original MRI T2-weighted slices centrally located to the lesión. B. The same slice after the application of the first VQBF. C. Target image manually sketched delimiting the total inflamed área. D. Segmentation of the ROÍ after application of the MLP and a second VQBF.
trae differences between the two methodologies. No signif-icant differences for any of the three selected animáis (p < 0.05) was observed either between the áreas measured using the two methodologies or within the valúes obtained from the three manual assessments. There were, as expected, statistically significant differences between the valúes measured for these three different mice.
The next step was planned to determine the sensitivity of the computer-assisted method to the slice selected for the MLP training. The results from the ten possible (one for each slice) outlined targets were divided into three sets corresponding to: the first three slices, the four central ones and the final three slices. Fig. 3 shows the comparison of the average number of pixels manually segmented for the inflamed área (solid squares) to those determined by the computer (solid cheles). Each column of graphs in the figure corresponds to the use of the three sets (initial, middle and final slices) in the MLP training process, and each row corresponds to the results of a mouse. The differences between the manually and computer calculated valúes dimin-ish when the middle set of slices is used for the MLP training, as may be expected given the probably smaller experimental error associated with these central slices dur-ing the manual drawing step. Nevertheless, a clear conclusión from Fig. 3 and the ANO VA results is that the agree-ment between both types of measurements is lost when the slices corresponding to the extremes of the lesión are used for training of the MLP. When the best slice is used for
training of the MLP, the highest discrepaney between manual and computer segmentation was observed in the bound-aries of the lesión, where the inflammatory lesión is less defined and poorly delimited-as is shown in Fig. 4, which includes all data (sixteen mice). We cannot totally exelude the possibility that the differences are also due to the fact that the segmented valúes manually obtained for these pe-ripheral slices consequently imply greater experimental er-rors. Perhaps both factors contribute to the observed differences.
The correlations within the manual segmentations measured several times were usually higher than 0.9 (except for one of the animáis studied), with statistical significances of less than 0.01 (one-tailed). Similar correlations were obtained (except for this anomalous animal) between the manual and computed-assisted measurements. The number of pixels within the global inflammatory lesión determined for all animáis (n = 16) both manually and by the computer led to a correlation coefficient of 0.78, with a high statistical significance (a < 0.001). Previous checks for parallel measurements indicated a high reliability of our calculations and measurements. It should be expected that better agreement is to be found when volume valúes (the sum of the ten slice valúes) are used instead, because error averaging from individual slices is expected with this sum. This was in fact the case, though the valúes of the corresponding statistical parameters were only slightly higher, is now 0.82.
A step further in the feasibility studies was made by

4000
3000
2000
1000
Initial Middle Final
I I I
-H+
r G "ílina:
I ! I I I ! I
T T
B I I I
I I I
H m 1±L _LLÍ
TT
+R-
+++-
I -Li-L _Lx±
O
0 2 4 6 8 100 2 4 6 8 100 2 4 6 8 10
Slice number Fig. 3. Average number of pixels belonging to the inflamed área of each of the indicated slices determined manually (•) and by the computer-assisted methodology (•), using during the training process the three initial slices (cases A, D and G), the four middle ones (cases B, E and H) or the three final slices (C, F and I). Cases A, B and C correspond to an animal studied six days after inoculation with A. fumigatus. Cases D, E and F correspond to another animal inoculated seven days before the image was taken, and cases G, H and I correspond to another animal also studied seven days after inoculation.
comparing the percentage of inflammatory tissue (or necrosis) as determined by the hybrid neural network to that identified by the histopathological analysis of the dissected tissue (see Table 1). In this case, only nine animáis and two sections or slices for each of them were selected, because it is very difficult to match both MRI and the histopathologic samples-especially the different slicing angle. The means and standard deviations given in Table 1 indicate that we are again dealing with parallel measurements, and therefore the high correlation coefficient determined, 0.87 (p < 0.01), indicates the high reliability of the calculated percentage of inflammatory tissue revealed by the algorithm.
3.2. Clinical data
The result of the above-described computer-assisted pro-cedure for 3D hippocampal segmentation in one of the four clinical cases is presented in Fig. 5 by superimposing the identified hippocampus áreas (white pixels) on the corre-
3000 [
J2 o "H. *§ 2000 [
1000 h-
I
[" T T i i i L
•
•
h-
1 1 ' 1
1 i É
-
é
i + • * '
-
> — •
• manual
• computer-assisted
. I . I i I , I , I
0 2 4 6 8 10
Slice number Fig. 4. Average number of pixels belonging to the inflamed área of each of the indicated slices determined manually (•) and by the proposal methodology (•), using during the training process the same slice manually sketched.
sponding slices. Only a small part of the total field of view has been displayed for better visualization. These images appear to indicate that the proposed method is also able to perform segmentation of the target región with an accuracy that approximates that of the human eye and brain. Visual inspection of this figure allows recognition that the greatest differences of this computer-assisted method relative to the manual segmentation are found in the last displayed slices, Le., the anatomic anterior regions cióse to the amygdaloid nucleus. The main source of over-segmentation error in this área may be the well-known partial volume effects in MRI. Furthermore, the MLP was trained with the central slices and posed some problems in generalizing to the peripheral región, as we have already seen in the animal model case.
The calculated volumes for the four patients are given in Table 2, where a cióse agreement with the manual segmentation can be seen. These measurements are parallel, as in the animal model study. The correlation coefficient between manual and computed valúes is very high (r = 0.95 for both hippocampi), thus confirming the high reliability observed. Similar conclusions are obtained from the corresponding ANOVA.
We have also measured the volumes of the corpus cal-losum. Fig. 6A presents one slice of the results of corpus callosum segmentation by the computer-assisted method. A satisfactory detection is observed of the target región, with some spurious pixels well-detached from the target región. Such spurious detection corresponds to white matter voxels with a spatial distribution and quantitative Tx valué similar to that of the corpus callosum. These similarities caused these voxels to be initially mapped by the VQBF into the same class as the corpus callosum of the total seven tissue

Table 1 Comparison of the inflamed muscle (in %) as measured by histopathological analysis (H) and using the computer-assisted methods (ANN)
Day
Mouse
Slice 1
Slice 2
H ANN H ANN
3
A
63.1 68.9 64.2 72.8
3
B
63.5 82.1 78.9 86.6
3
C
88.7 76.6 65.9 65.4
7
D
67.9 71.1 56.9 65.7
7
E
91.5 89.0 92.9 88.9
7
F
64.4 71.6 50.4 53.0
14
G
44.1 35.8 46.3 45.4
14
H
76.3 71.6 80.7 79.3
14
I
80.0 77.6 51.6 38.4
Mean
71.1 71.6 65.3 66.2
S.D.
13.9 14.0 15.0 16.8
Summary of the percentages of inter-lesion inflammatory tissues (the remaining tissues are considered either necrosis or spore accumulations) in nine animáis (two histological slices each) inoculated with A. fumigatus. The "Day" column indicates the number of days after inoculation. S.D. = standard deviation.
types used. As these false detection voxels are spatially distará from the target región, they can be easily removed. Fig. 6B shows different views of 3D rendering of the corpus callosum after suppressing false positive pixels (we esti-mated them at around 14%) with the aid of region-growing methods [37]. The characteristic concave shape of this an-atomic structure, in which the fibers located at its edges extend upward, can be easily distinguished. The quantitative valúes, given in Table 2, indicate that the volumes measured manually are also very similar to those calculated by the computer, as was the case with both hippocampi. These measurements are also parallel, though the correlation co-efficient is now slightly lower, r = 0.88, which could be expected from the greater experimental difficulty involved.
We have performed a more detailed study using the
results obtained with one of the patients, who had the lowest hippocampal volume valúes (Patient 4 in Table 2). Three different slices were used (each in duplicate) to the MLP training procedure. The calculated and manually measured (see Material and Methods) volumes are given in Table 3. An ANO VA test with all data from this table was performed to determine whether the observed differences were due to the fact that each method really measures differently or whether they were attributable to random errors. We then calculated both mean squared valúes (within and between) and their variances, yielding an F(3 8) valué of 1.73. We can therefore conclude (with/? < 0.05) that there are no statis-tically significant differences between the two methods in evaluating the hippocampal volumes. All measurements are again parallel, with statistically equal means and variances
Fig. 5. Segmentation of the left-hippocampus images, corresponding to 28 slices, obtained using standard ^-gradient-echo pulse sequences in a patient (Case 2 in Table 2). The áreas obtained from the MLP were superposed on each corresponding sagittal MRI slice.

Table 2 Comparison of hippocampal volumes (in cm3) measured either manually or using the described computer-assisted method
Patient
1 2 3 4 Mean SD
left hippocampus
Manual
2.50 2.19 2.34 1.83 2.21 0.29
ANN
2.55 2.23 2.29 1.94 2.25 0.25
right hippocampus
Manual
2.56 2.35 2.75 1.62 2.32 0.49
ANN
2.31 2.23 2.71 1.72 2.24 0.41
corpus callosum
Manual
10.44 9.93 8.34
12.16 10.2 1.6
ANN
9.17 10.67 8.96
11.65 10.1
1.3
Cases were selected from a blind study of Alzheimer-type dementia. A neuroradiologist using standard outlining software performed the manual measurements off-line. SD = standard deviation.
of the manual (¡x = 1.93, <r = 0.11) and computer measurements (ju, = 1.75, <T = 0.12). The correlation coefficient between the manual and semi-automatic data given in Table 3 is r = 0.75, thus also indicating a high reliability.
3.3. Results based on a simplified receiver operating characteristic (ROC)
The four indexes whose definition was reproduced in Material and Methods have been calculated for all possible combinations of slice áreas and volumes measured in all animáis and hippocampi. These results are summarized in Table 4, showing the high sensitivity and specificity of the computer measurements. These indexes are almost equal, both on comparing áreas or volumes and the animal model or hippocampus. They possess high valúes with low standard deviations. The similarity or repeatability index, S, and the Kappa index, K¡ range from 0 to 1, with zero indicating
Fig. 6. A. Selected hemi-sagittal área of the corpus callosum obtained from the MLP. B. 3D renderings of corpus callosum after suppressing mis-classified pixels with the aid of a region-growing algorithm. The views were obtained using standard reconstruction methods with the results obtained from the MLP.
no overlap and one indicating perfect matching between the regions determined by both methods. The S index is a stronger test than K¡ since for example two voxel cubes of a volume of 10 X 10 X 10, shifted by one voxel along the space diagonal direction results in only 57% overlap [16]. Our S and K¡ valúes are lower than others measured with some standard phantoms, while our valúes for trae and false positive fractions are higher than those measured with the same phantoms [16].
4. Discusión and conclusión*
In this paper we have chosen three important and diffi-cult problems to apply our interactive segmentation meth-odology, performing MRI segmentation, evaluating the seg-mented volumes, comparing these volumes with those obtained manually and histologically (when possible). Our work attempts the detection of 3D ROIs corresponding to tissue stractures with high robustness against translations and deformations, both between slices in the 3D MR volume data and between different MR images of the same stracture. It is very useful to clinical, biologic and pharma-ceutical applications.
The inflammatory process in one of our experimental animal models showed complex intermixed tissues with a poorly delimited shape that was difficult to segment by conventional methods [28]. The adequacy of our ANN approach for identifying the total lesión and quantifying its pathologic findings is clearly shown in this report. More-over, the reliability and validation of the methodology for this data are satisfactorily confirmed by comparison with both manual measured images and subsequent pathologic studies-thus indicating that it can be used in future longitudinal studies in this animal model.
Hippocampal segmentation is of special interest and dif-ficulty, since this stracture appears poorly defined in the routine clinical images acquired from fast 3D sequences. Outlining of the sub-regions in this stracture is usually established either in coronal or sagittal planes. In both orientations, the separation of gray matter from the adjacent parahippocampal gyras and amygdaloid nucleus is not ob-

Table 3 Hippocampal volumes (in cm3) obtained manually by two experts (M¡ and M2) and by the computer (Cj and C2) using the three central slices of the 3d-stack measured in M, and M2 to MLP training procedure
Slice
1 2 3
M,
1.83 1.90 1.94
M2
2.03 2.10 1.76
1.71 1.60 1.93
1.81 1.60 1.82
vious, but would be very convenient, because this structure is of continuing importance to research in dementia. Spe-cifically, sagittal slices were used for an improved MLP training on central slices (in which amygdale appears) and so, a better separation from the surrounding tissues was obtained. We have demonstrated in this article that our methodology can be satisfactorily applied to this problem, affording highly reliable measurements and calculations.
The structure of the corpus callosum exhibits a charac-teristically elongated shape in sagittal MRI planes. A complete volumetric delineation of the corpus callosum is not straightforward by automatic or semi-automatic tri-dimen-sional procedures without incorporating a priori anatomic knowledge [16]. The common practice is to manually mea-sure its length, shape and área in the central hemi-sagittal slice only, although other latent morphologic features are being characterized and quantified to capture features in-trinsic to the corpus callosum, which are not accessible by these conventional measures of size and shape [18]. This lack of quantitative results probably derives from its natural morphology and from the inherent poor contrast differences obtained in several slices with clinically standard gradient echo Tj weighted 3D sequences, due to the presence of adjacent white matter tissues. Atrophy of this structure may be related to in vivo neuronal loss in the neocortex. In this sense, the 3D measurement of this structure could provide an effective diagnostic criterion, being of particular importance in patients with neurodegenerative diseases. We have also shown the adequacy of our methodology in application to this difficult and challenging problem.
The first step of our method is the VQBF classification of spatial blocks of the image, using representative texture elements generated by a clustering procedure, on single-parameter MRI. The results show that segmentation of MRI may be done on the basis of spatial information when there is not available multi-parametric data. The VQBF produces smoothing in the processing images that depends on the size of the área, but preserves the edges and boundaries of the regions inthe image, as can be easily appreciated inFig. 6B. It shows image edge and región preservation comparable to other approaches to image filtering, i.e., anisotropic filtering [38]. The VQBF has two interesting properties: (i) It is a very robust learning algorithm due to its low sensitivity to the initial conditions, and (ii) the resulting representatives tend to be ordered, due to the topological preservation property. This ordering is of interest for the subsequent
Table 4 Calculated Índices for a simplied ROC analysis
Animal Model
Áreas S 0.67(0.14) K¡ 0.79(0.12) TPF 0.76(0.14) FPF 0.83(0.17)
Volumes 0.68 (0.09) 0.80 (0.07) 0.77 (0.09) 0.87(0.07)
Hippocampus
Volumes 0.67 (0.09) 0.80 (0.07) 0.79 (0.09) 0.90 (0.06)
The equations used for the calculation of each Índex are given in Material and Methods (The valúes in the parentheses are standard devia-tions).
processes. The role of the VQBF was to reduce the vari-ability of signal intensity across individual image sets [9], yielding a voxel classification that boosts the performance of further analysis and recognition. The well-known poten-tial side-effect of this quantization step was minimized in this work using the frequency of the classes in the target región in the training image, thus avoiding mis-ordering problems.
The second step is the specific training of the MLP based on the manual selection and outlining of the desired structure in one of the central slices. This specific MLP training overeóme the effect of uncontrolled translations and defor-mations due to poor positioning and to evolution of the structure in time. For example, the localization and shape of the innammatory lesión change considerably from one slice to another and along the serial study in the animal model.
The use of the x, y-standard deviations, from the mass center of the central structure as one of the inputs for the MLP, can be used to argüe that this feature selection makes our approach very sensitive to deviations from circular or ellipsoid shapes. In contrast, the elongated and concave shape of the corpus callosum has been detected with excel-lent reliability.
Some authors have performed classification of the cor-pus callosum and hippocampus with ANN, but the input images were previously warped to a standard atlas [9]. In this work, the basic problem of robust image segmentation against object deformation was avoided [9] by performing registration and normalization based on manual detection of landmarks that allow computation of the object deformation.
Some MR image segmentation studies are restricted to the target región and assume good image alignment and homogeneous signal intensity [39]. This alleviates the problem of the unbalanced class samples for the training of the classifiers and avoids the need of discriminating classes unrelated to the segmentation aim. On the contrary, our approach copes with these extra difficulties of treating the entire data volume, eluding the need of a manual cropping of the image.
Three practical concerns should be taken into account in any computer-assisted method dealing with segmentation and volumetric determinations. Firstly, the reduction in the máximum time for computer training and processing. Sec-

ondly, the employment of single modality images in the segmentation process; and finally, the robustness of the segmentation procedure against the often-found slice-to-slice variation in anatomy or shape.
The first point may be critically decisive, particularly because we are considering using these algorithms with large data sets, and in certain clinical situations. The theo-retical time saving equals the number of slices minus one (the characteristic image used for computer training) mul-tiplied by the time taken to outline the ROÍ in one slice, because the radiologist can carry out other work in the meantime. Nevertheless, a final time performance compar-ison is quite difficult and requires the consideration of many factors, such as algorithm and computer efficiency, the number of cases and images per case, anatomic structure, etc. Independently of these and other features, a high time saving is expected even for a small number of images, and should be enough for a clinician to use it-especially if he/she is confident of the segmentation results and volume calcu-lations. These periods are considerably shorter than others employed by other semi-automatic methods [40], as well as by slice-by-slice delineation methods, which take more than one hour for the segmentation of structures similar to those studied here.
The second concern is consistent with day-to-day radio-logic practice. Radiologists normally study a large number of patients, and for evident reasons high quality and/or multi-parametric data are not broadly available in current clinical practice. We have shown here that the segmentation and volumetric determinations performed with single modality MRI data are reliable in the studied cases; nevertheless, we agree that is necessary to work with multi-parametric images to truly discrimínate tissue composition. For our case, it can be argued that using the distance from the center point as an MLP input could bias the algorithm toward finding regions with the same size as the training image. This is evident from results displayed in Fig. 4. However, it is clear that although this option is not as flexible as global shape models, the method produced, as is easily verified in the same figure, results in a satisfactory agreement when central slices were used for training. In any case, deformable models are not lacking in similar limita-tions, due to the sensitivity to initial positions and difficul-ties to coping with significant protrusions and topological changes. Our strategy, although it is not the optimal solu-tion, is not computer time consuming, and helps to mini-mize the interactive part and, what is more important, produces reliable results in different applications in which a large number of images needs to be processed. In our modest opinión, the main contribution of this work (besides the specific use of VQBF and MLP methods) is the empiric demonstration of the power of spatial processing and how it can yield meaningful segmentations of the MRI.
Third, the segmentation procedure described here is suf-ficiently robust versus the frequent slice-to-slice variation in anatomy or shape, at least in the cases studied here, where
it is clearly shown that the methodology allowed detection of the áreas of interest with relatively few misclassified voxels. Contrary to other procedures, our method does not ensure a globally smooth surface between image slices. As we see in the reconstruction of the corpus callosum, the resulting surface reconstruction contains inconsistencies that affect to the final conformation but are negligible to the final volume quantization.
In summary, the main innovations of this work lie in the judicious interactive use of a mixture of supervised and unsupervised neural networks on single parameter images. The potential side-effects of the quantization step was avoided using the frequency of the classes in the target región in the training image. The classification in the MLP was based on the voxel neighborhood and the incorporation of prior shape information. The MLP training was performed using a stochastic gradient descent minimization of the sum-squared error and the results were satisfactory. Obviously, other minimization procedures, such as Quasi-Netwon method can derive quicker results. The results with three non-trivial and difficult systems are very encouraging, and allow the use of this methodology in further studies with the same or similar examples. In principie, the methodology proposed here can be applied to any MRI data, as well as to the images obtained by any other imaging tech-nique. The primary purpose of this report is to contribute in the development of computer -assisted methods to the eval-uation of the MRI used in clinical, biomedical and pharma-ceutical applications. Nevertheless, more work and computer and statistical analyses are necessary with other problems or systems for the global validation of the proposed method.
Acknowledgments
We are grateful to Palmira Villa for her excellent tech-nical assistance, and to the Spanish Agencia Española de Cooperación Internacional (AECI) for financial support for RPA. This research was supported by grants from the Spanish Comisión Interministerial de Ciencia y Tecnología (CICYT, SAF2000-0115)) and from the EC (PHIL, QLG1-2000-01559).
References
[1] Kahn CE. Decisión aids in radiology. Radiol Clin North Am 1996; 34:607-28.
[2] Kohn MI, Tanna NK, Hermán GT, Resnick SM, Mozley PD, Gur RE, Alavi A. Analysis of brain and cerebrospinal fluid volumes with MR imaging. Radiology 1991;178:115-22.
[3] Boone JM. Neural networks at the crossroads. Radiology 1993;189: 357-9.
[4] Hertz J, Krogh A, Palmer RG. Introduction to the theory of neural computation. Santa Fe Institute studies in the sciences of complexity. Lectores Notes, vol 1. Addison Wesley, Redwood City, CA, pp. 327, 1991.

[5] Patterson DW. Artificial neural networks. Theory and applications. Prentice Hall 1998.
[6] Duda RO, Hart PE. In: Pattern classification and scene analysis. New York: John Wiley & Sons, 1973. pp. 482.
[7] Bezdek JC, Hall LO, Clarke LP. Review of MR image segmentation using Statistical Pattern Recognition. Med Phys 1993;20:1033-48.
[8] Wu Y, Giger ML, Doi K, Vyborni CJ, Schmidt RA, Metz CE. Artificial Neural Networks in mammography: applications to decisión making in the diagnosis of breast cáncer. Radiology 1993;187:81-7.
[9] Magnotta VA, Heckel D, Andreasen NC, Cizadlo T, Corson PW, Ehrhardt JC, Yuh WTC. Measurement of brain structures with artificial neural networks: two- and three-dimensional applications. Radiology 1999;211:781-90.
[10] Glass JO, Reddick WE, Goloubeva O, Yo V, Steen RG. Hybrid artificial neural network segmentation of precise and accurate inversión recovery (PAIR) images from normal human brain. Magn Reson Imaging 2000;18:1245-53.
[11] Mcinerney T, Terzzopoulos D. Deformable models in medical images analysis: a survey. Medial Image analysis 1996;1:91-108.
[12] Shen D, Moffat S, Renick SM, Davatzikos Ch. Measuring size and shape of the hippocampus in MR images using a deformable shape model. Neuroimages 2002;15:422-34.
[13] Kusuzaki K, Shinjo H, Murata H, Takeshita H, Hashiguchi S, Nozaki T, Emoto K, Ashihara T, Hirasawa Y. Relationship between doxo-rubicin binding ability and tumor volume decrease after chemother-apy in adult malignant soft tissue tumors in the extremities. Antican-cer Res 2000;20:3813-6.
[14] Rudin M, Beckmann N, Porszasz R, Reese T, Bochelen D, Sauter A. In vivo magnetic resonance methods in pharmaceutical research: current status and perspectives. NMR Biomed 1999;12:69-97.
[15] Rusinek H, de León MJ, George AE, Stylopoulos LA, Chandra R, Smith G, Rand T, Mourino M, Kowalski H. Alzheimer's disease: measuring loss of cerebral gray matter with MR images. Radiology 1991;178:109-14.
[16] Bueno G, Musse O, Heitz F, Armspach JP. Three-dimensional segmentation of anatomical structures in MR images on large data base. Magn Reson Imaging 2001;19:73-88.
[17] Kohonen T. Self-Organizing Maps. Berlin: Springer, 1997. [18] Peterson BS, Feineigle PA, Staib LH, Gore JC. Automated measure
ment of latent morphological features in the human corpus callosum. Human Brain Mapp 2001;12:232-45.
[19] Clarke LP, Velthuizen RP, Camacho MA, Heine JJ, Vaidyanathan Hall LO, Thatcher RW, Silbiger ML. MRI segmentation: methods and applications. Magn Reson Imaging 1995;13:343-68.
[20] Saeed N. Magnetic resonance image segmentation using pattern recognition, and applied to image registration and quantitation. NMR Biomed 1998;11:157-67.
[21] Baumgartner R, Ryner L, Richter W, Summers R, Jarmasz M, So-morjai R. Comparison of two exploratory data analysis methods for fMRI: fuzzy clustering vs. principal component analysis. Magn Reson Imaging 2002;18:89-94.
[22] Soltanian-Zadeh H, Peck DJ, Windham JP, Mikkelsen T. Brain tumor segmentation and characterization by pattern analysis of multispectral NMR images. NMR Biomed 11:201-8.
[23] Jacobs MA, Knight RA, Soltanian-Zadeh H, Zheng ZG, Goussev AV, Peck DJ, Windham JP, Chopp M. Unsupervised segmentation of multiparameter MRI in experimental cerebral Ischemia with compar
ison to T2, Diffusion, and ADC MRI parameters and histopatological validation. J Magn Reson Imaging 2000;11:425-37.
[24] Cosman PC, Oeshler KL, Riskin EA, Gray RM. Using vector quan-tization for image processing. IEEE Proceedings 1993;81:1326-41.
[25] González AI, Grana M, Echave I, Ruiz-Cabello J. Bayesian VQ image filtering design with fast adaptation competitive neural network. In: Engineering applications of bio-inspired artificial neural networks 1999. Vol. II: Springer, Berlin. 341-49.
[26] González AI, Grana M, Ruiz-Cabello J, d'Anjou A, Albizuri X. Experimental results of an evolution-based adaptation strategy for VQ Bayesian Filtering. Inform Sci 2001;133:249-66.
[27] Grana M, Echave I, Ruiz-Cabello J, Cortijo M. Segmentation of infected tissues in IRI using VQBF filtering. Proc ICSP 2002, Beijing, China, IEEE Press.
[28] Ruiz-Cabello J, Regadera J, Santisteban C, Grana M, Pérez de Alejo R, Echave I, Aviles P, Rodríguez I, Santos I, Gargallo D, Cortijo M. Monitoring acute inflammatory processes in the mouse muscle by MR imaging and spectroscopy: a comparison with pathological results. NMR Biomed 2002;15:204-14.
[29] Metz CE. Some practical issues of experimental design and data analysis in radiological ROC studies. Invest Radiology 1989;24:234-45.
[30] Zeng X, Staib L, Schultz R, Duncan J. Segmentation and measurement of the cortex from 3D MR images using coupled-surfaces propagation. IEEE Trans Med Imaging 1999;18:927-37.
[31] Kelemen A, Székely G, Gerig G. Elastic model-based segmentation of 3D neuroradiological data sets. IEEE Tran Med Imaging 1999;18: 828-39.
[32] Rizzo G, Scifo P, Gilardi M, Bettinardi V, Grassi F, Cerutti S, Fazio F. Matching a computerized brain atlas to multimodal medical images. Neuroimage 1997;6:59-69.
[33] Duda N, Sonka M. Segmentation and interpretation of MR brain images: an improved active shape model. IEEE Tran Med Imaging 1998;17:1049-62.
[34] Dawant BM, Hanmann SL, Thirion JP, Maes F, Vandermeulen D, Demaerel P. Automatic 3D segmentation of internal structures of the head in MR images using a combination of similarity and free-form transformations: Part 1. Methodology and validation on normal sub-jects. IEEE Tran Med Imaging 1999;18:909-26.
[35] Atkins M, Mackicwich B. Fully automated segmentation of the brain in magnetic resonance imaging. IEEE Tran Med Imaging 1998;17: 98-107.
[36] Zijdenbos A, Dawant B, Margolin R, Palmer A. Morphometric análisis of white matter lesions in MR images: method and validation. IEEE Tran Med Imaging 1994;13:716-24.
[37] Cline HE, Lorensen WE, Kikinis R, Jolesz F. Three-dimensional segmentation of MR images of the head using probability and con-nectivity. J Comput Assist Tomog 1990;14:1037-75.
[38] Gerig G, Kübler O, Rikinis R, Jolesz FA. Nonlinear anisotropic filtering o MRI data. IEEE Trans Med Imaging 1992;11:221-32.
[39] Glass JO, Reddick WE. Hybrid artificial neural network segmentation and classification of dynamic contrast-enhanced MR imaging (DEMRI) of Osteosarcoma. Magn Reson Imaging 1998;16:1075-83.
[40] Freeborough P, Fox N, Kitney R. Interactive algorithms for the segmentation and quantitation of 3D MRI brain scans. Comp Meth Programs Biomed 1997;53:15-25.