computer aided factorial analysis of the - sphinxsai.comsphinxsai.com/ctvol4/ct_pdf_vol_4/ct=101...
TRANSCRIPT
International Journal of ChemTech Research CODEN( USA): IJCRGG ISSN : 0974-4290
Vol.1, No.4, pp 1403-1414, Oct-Dec 2009
Computer Aided Factorial Analysis of theAdsorption of Calcium ion (Ca2+) on Manganese
(IV) oxide used in Leclanche dry cell
Duncan Folorunsho Aloko,*Kamoru Adio Salam and Emmanuel Okali OklobiaChemical Engineering Department, University of Abuja, Abuja, Nigeria.
*Corres. Author: [email protected]
Abstract: The adsorption of calcium ions on manganese (IV) oxide was investigated by pH measurement inpotentiometric titration of 1M, 0.1M, 0.01M, and 0.001M solutions of the ions without and with 2g of manganese (IV)oxide at temperatures of 28oC and 30oC; using 0.1M trioxonitrate (V) acid solution as titrant. The factorial method ofdesign; using Minitab® was employed to obtain the effects of each factor on adsorption, the effects of the interactions ofthe factors on adsorption and a linear model equation in terms of the factors and their interactions, for the ion. Theresults show that increasing temperature and concentration, and decreasing pH increases adsorption of calcium ions. Thelinear model equation is:
The optimization of the equations with the target value of 1 for electric surface charge yielded the optimal values oftemperature, concentration and pH as 29.1250oC, 0.001M, 2.5 respectively.
Key words: Leclanche dry cell; Calcium ion; Manganese (IV) oxide; Factorial design; Minitab®; Electric surface.
Introduction and ExperimentMathematical modelling is a mathematical representationof subsystems. It is a general characterization of aprocess in terms of mathematics and the equationsobtained to describe the existing relationships among setof variables usually ordinary or partial differential,integration or integral differential in nature1 .Adsorptionis the process of selective affinity of an ion to a solidfrom a liquid bulk. In other words, adsorption is theselective transfer of one or more solutes from a fluidphase to a batch of rigid particles (adsorbents)1.
It was noted that multiple linear ordinary differentialequation of the form:
Y=ao+a1x1+a2x2+a12x1x2 1
was a good model to represent the adsorption of somecations on manganese dioxide (MnO2)2.
Leclanche dry cell-a primary cell3, has become a familiarhousehold item and has a major influence in our ways oflife since it was invented in the 1860s.It is an ingeniouslyengineer device that has a rather unusual half reactionsand half-cell but it operates through electrochemicalprinciples4. Some other improvements made onLeclanche dry cell have their shortcomings. Alkalinebattery and silver (Button) battery are veryexpensive4.Mercury cells release toxic metal whendiscarded4.Several attempts have been made to correctthe polarisation effect as well as to improve the capacityof dry cell. Zinc chloride was included in electrolyte withthe aim of reducing the polarisation process5.
The general chemical reaction taking place in Leclanchedry cell is as follows5.
Zn+2MnO2→ZnO+Mn2O3 2
Zn+2MH4Cl→ZnCl2+2NH3+H2 3

Kamoru Adio Salam et al /Int.J. ChemTech Res.2009,1(4) 1404
The hydrogen gas produced from equation3 seriouslyreduces the efficiency of the dry cells in two ways:
a) It increases the electrical resistance of the system.
b) It forms a back electromotive force (E.M.F) with Zinccathode.
The two effects combined to reduce the life span of aLeclanche dry cell.The manganese dioxide in the cellserves to minimise the effect by depolarising H2formation as given in Equation 4
H2+2MnO2→H2O+Mn2O3 4
However, MnO2 does not totally eliminate the hydrogengas produced and water is also forming which make thebattery swells up with time. The inclusion of Calciumchloride in the electrolyte was suggested to improve theionic conductivity of the electrolyte6, 7.
Hence, this research aims at optimise some variables thatinfluence the rate of adsorption of Ca2+ on Manganese(iv) oxide used in Leclanche dry cell using computerAided Factorial Analysis inbuilt in Minitab® in order toimprove the depolarising effect of Manganese(iv) oxide.
Procedure for the Determination of Surfacearea of Manganese (IV) OxideTo seven clean and well labelled 250ml Erlenmeyerflasks, 100ml of acetic acid solution each ofconcentration 0.015M, 0.03M, 0.06M, 0.09M, 0.12M and0.15M were measured with a pipette and added to theirseparate flask. Then 2g of the manganese (IV) oxide wasadded to the flasks containing the given concentrations ofthe acetic acid but the seventh flask contained 0.015acetic and served as a control. The seven flasks were thenstoppered and each flask was shaken periodically forthirty (30) minutes and was allowed to stand in a waterbath at 25oC for 24 hours. When equilibrium has beenreached (after 24 hours), the solutions were filtered intoclean conical flask, but the first 10ml of the filtrate foreach of the mixtures was discarded as a precautionagainst adsorption of the acid by the filter paper.
Two 25ml portions of the filtrate (aliquots) were takenwith a pipette and titrated against 0.1M sodium hydroxidesolution using phenolphthalein as an indicator. The sameprocedure was repeated for the remaining concentrationsof the acetic acid solutions. From the titre values, the newconcentrations of the acetic acid solutions werecalculated and the difference obtained. These values were
used to calculate values for C/N and hence plot C/Nagainst C. the slope of the straight line obtained wascalculated and used for the calculation of the adsorptionarea of manganese (IV) oxide8.
PotentiometricTitration Procedure1M, 0.1M, 0.01M and 0.001M solutions of calciumnitrate [Ca (NO3)2] were prepared and 50ml of eachsolution for the salt per time was measured into a cleandry 100ml beaker into which; a magnetic stirrer followerfor continuous stirring; a nitrogen gas jet to provide aninert environment and a reference electrode connected toa calibrated and stabilized pH meter were placed. Themagnetic stirrer and gas jet were turned on and eachsolution of the salt without manganese dioxide(depolarizer) at 28oC and 30oC and with 2g of manganesedioxide (depolarizer) at 28oC and 30oC was titratedagainst 0.1M trioxonitrate (V) acid (HNO3) placed in aburette by addition of 0.5ml of the acid per time for atotal volume of 10ml addition of the acid. In each case,the pH meter reading before titration and 1 minute aftereach 0.5ml addition of the titrant was recorded. The pHversus the volume of the titrant obtained was plotted bothfor the adsorption of cations without and with MnO2 onthe same graph. At a given pH, the difference in volume(ΔV) between the two graphs was used to calculateadsorption. The value of absorption (Ψ) is calculatedusing:
Ψ (mole/cm2) 5
Where C= Conc. of HNO3 in mole/litre and A= Surfacearea in m2/g
The electric surface charge of [Ca (NO3)2] adsorbed, E inCoulomb/cm2 is given by:
E 6
n= absolute no of ionic charge and F = Faraday’sconstant
The same experiment procedures was repeatedfor different concentration (1M, 0.1M, 0.01Mand0.001M) of [Ca (NO3)2]8.
Results and DiscussionThe experimental results obtained for the determinationof surface area of Manganese (IV) oxide are shown inTable1.
Kamoru Adio Salam et al /Int.J. ChemTech Res.2009,1(4) 1405
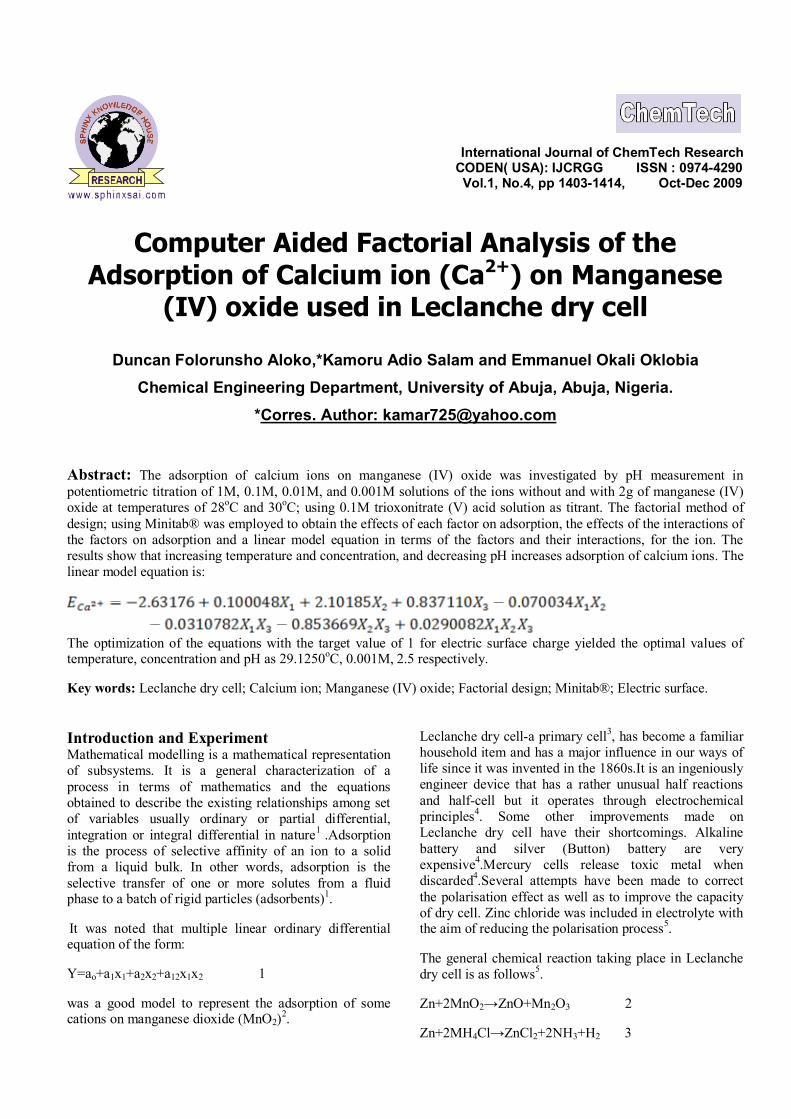
Table 1: Results for the determination of surface area of MNO2
S/NInitial acetic acid
conc. Cavol. of 0.1M
NaOH VB (ml)final Aceticacid conc. C
Conc.Difference, N C/N
1 0.015 1.2 0.0048 0.0102 0.4705882 0.03 6 0.024 0.006 43 0.06 13.4 0.0536 0.0064 8.3754 0.09 18.7 0.0748 0.0152 4.9210535 0.12 24.8 0.0992 0.0208 4.7692316 0.15 32.5 0.13 0.02 6.5
Figure 1: Plot of C/N against C
Specific surface areaSpecific surface area of adsorption,
7Nm = number of moles per gram required to form amonolayer =0.006143No = Avogadro’s number =
σ = Area occupied by an adsorbed molecule on thesurface = 21Å2 =
From fig.1, the slope of the plot which is equal to 1/ Nmwas found to be 162.79On substitution to equation 7, the specific surface areawas calculated to be 776.9851m2/g From fig.1 the change in concentration of acetic acid ishighest for initial concentration of 0.12M and lowest forinitial acetic acid concentration of 0.03M.This is due tothe fact that the rate of adsorption of adsorbate isproportional to external surface area of the solid andconcentration difference across the boundary film9.

Kamoru Adio Salam et al /Int.J. ChemTech Res.2009,1(4) 1406
Figure 2: Plot of pH against Volume of titrant for 1M Ca (NO3)2 at 28oC
Figure 3: Plot of pH against Volume of titrant for 1M Ca (NO3)2 at 30oC
Kamoru Adio Salam et al /Int.J. ChemTech Res.2009,1(4) 1407
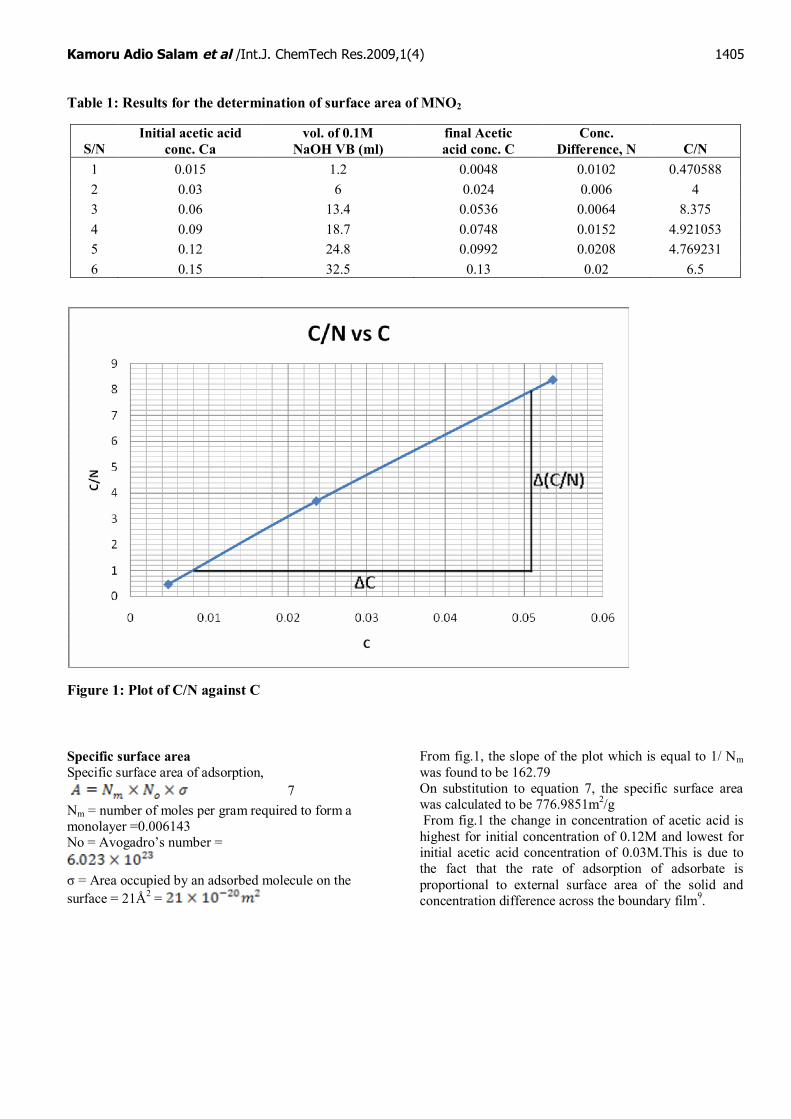
Figure 4: Plot of pH against Volume of titrant for 0.1M Ca (NO3)2 at 28oC
Figure 5: Plot of pH against Volume of titrant for 0.1M Ca (NO3)2 at 30oC
Kamoru Adio Salam et al /Int.J. ChemTech Res.2009,1(4) 1408
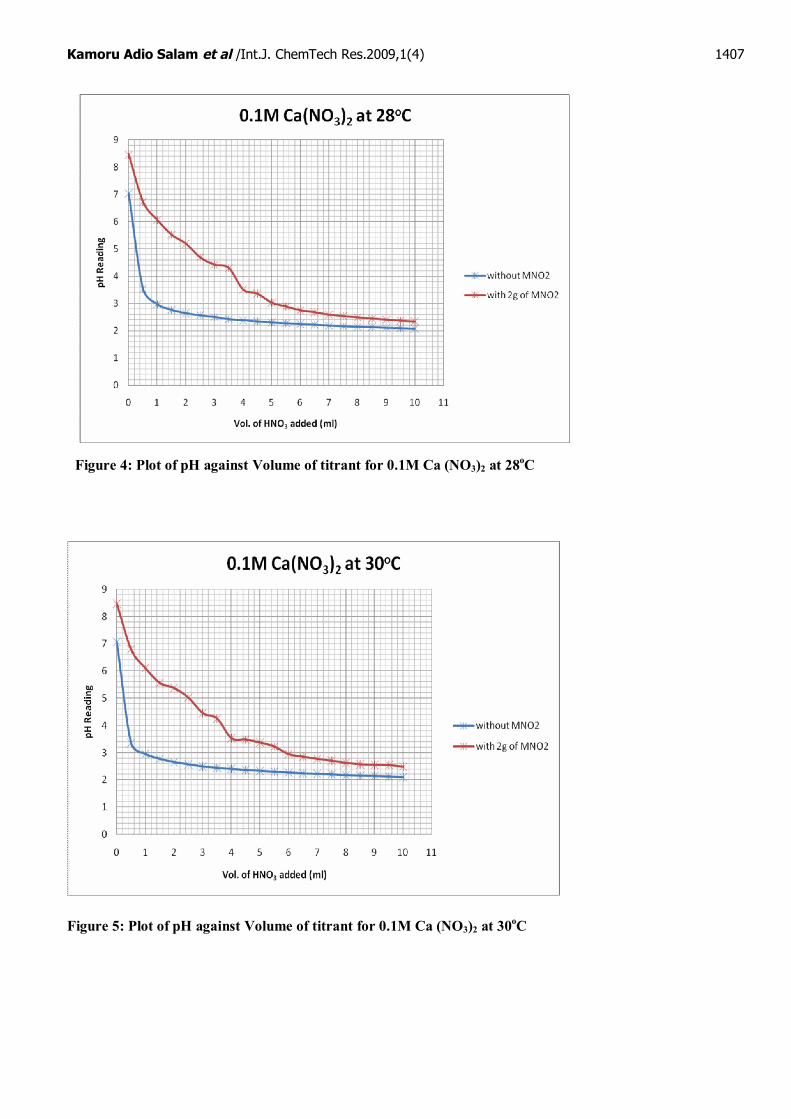
Figure 6: Plot of pH against Volume of titrant for 0.01M Ca (NO3)2 at 28o
Figure 7: Plot of pH against Volume of titrant for 0.01M Ca (NO3)2 at 30o

Kamoru Adio Salam et al /Int.J. ChemTech Res.2009,1(4) 1409
Figure 8: Plot of pH against Volume of titrant for 0.001M Ca (NO3)2 at 28oC
Figure 9: Plot of pH against Volume of titrant for 0.001M Ca (NO3)2 at 30o

Kamoru Adio Salam et al /Int.J. ChemTech Res.2009,1(4) 1410
pH responses during potentiometric titrationFrom fig.2-9, it was observed that as more volume oftitrants (HNO3) was added to the solution, the pH valueof the solution tends toward acidity. It was also noted thatat any given equal volume of titrant added, the pH valueof the solution with MnO2 was higher than those withoutMnO2.The reason was that from the depolarizingequation3,Ca2+ ions react with water produced and one of
products of that reaction is a base which increases thealkalinity of the solution. It was also observed that thechange in pH with successive addition of titrant (HNO3)to the solution decreases as the titration progresses. Thiswas true for both solution with and without MnO2.Thiswas due to the fact that as the adsorption of Ca2+
progresses, the number of available sites left for furtheradsorption decreases. This result is in conformity with8.
Table 2: Electric surface charge of 1M Ca (NO3)2 and adsorption on MNO2
Table 3: Electric surface charge of 0.1M Ca (NO3)2 and adsorption on MNO2
Table 4: Electric surface charge of 0.01M Ca (NO3)2 and adsorption on MNO2
0.01M Ca(NO3)2 at 28oC 0.01M Ca(NO3)2 at 30oC
S/N pHΔV(ml)
ΨE
ΔV(ml)
ΨE
1 2.5 6.5 8.36567E-07 0.161457 4.8 6.17772E-07 0.119232 2.8 5.7 7.33605E-07 0.141586 4.1 5.27681E-07 0.1018423 3.1 4 5.1481E-07 0.099358 3.7 4.762E-07 0.091907
Table 5: Electric surface charge of 0.001M Ca (NO3)2 and adsorption on MNO2
0.001M Ca(NO3)2 at 28oC 0.001M Ca(NO3)2 at 30oC
S/N pHΔV(ml)
ΨE
ΔV(ml)
ΨE
1 2.5 3.5 4.50459E-07 0.086939 5.3 6.82124E-07 0.131652 2.8 3.2 4.11848E-07 0.079487 4.3 5.53421E-07 0.106813 3.1 2.7 3.47497E-07 0.067067 3 3.86108E-07 0.074519
Optimization results for Ca2+
Selecting temperature, concentration, pH as the factors;each of two levels denoted by + (the highest value of afactor) and – (the lowest value of a factor), and electric
surface charge as the response denoted by E, the actualdesign matrix and the values of the factors at the twolevels are shown in Table 6 and Table 7 respectively.
1M Ca(NO3)2 at 28oC 1M Ca(NO3)2 at 30oC
S/N pHΔV(ml)
ΨE
ΔV(ml)
ΨE
1 2.5 5 6.43513E-07 0.124198 7 9.00918E-07 0.1738772 2.8 4.4 5.66291E-07 0.109294 5.4 6.94994E-07 0.1341343 3.1 3.2 4.11848E-07 0.079487 5.1 6.56383E-07 0.126682
0.1M Ca(NO3)2 at 28oC 0.1M Ca(NO3)2 at 30oC
S/N pHΔV(ml)
ΨE
ΔV(ml)
ΨE
1 2.5 5.2 6.69254E-07 0.129166 7 9.00918E-07 0.1738772 2.8 4.4 5.66291E-07 0.109294 5.3 6.82124E-07 0.131653 3.1 4.1 5.27681E-07 0.101842 5 6.43513E-07 0.124198
Kamoru Adio Salam et al /Int.J. ChemTech Res.2009,1(4) 1411
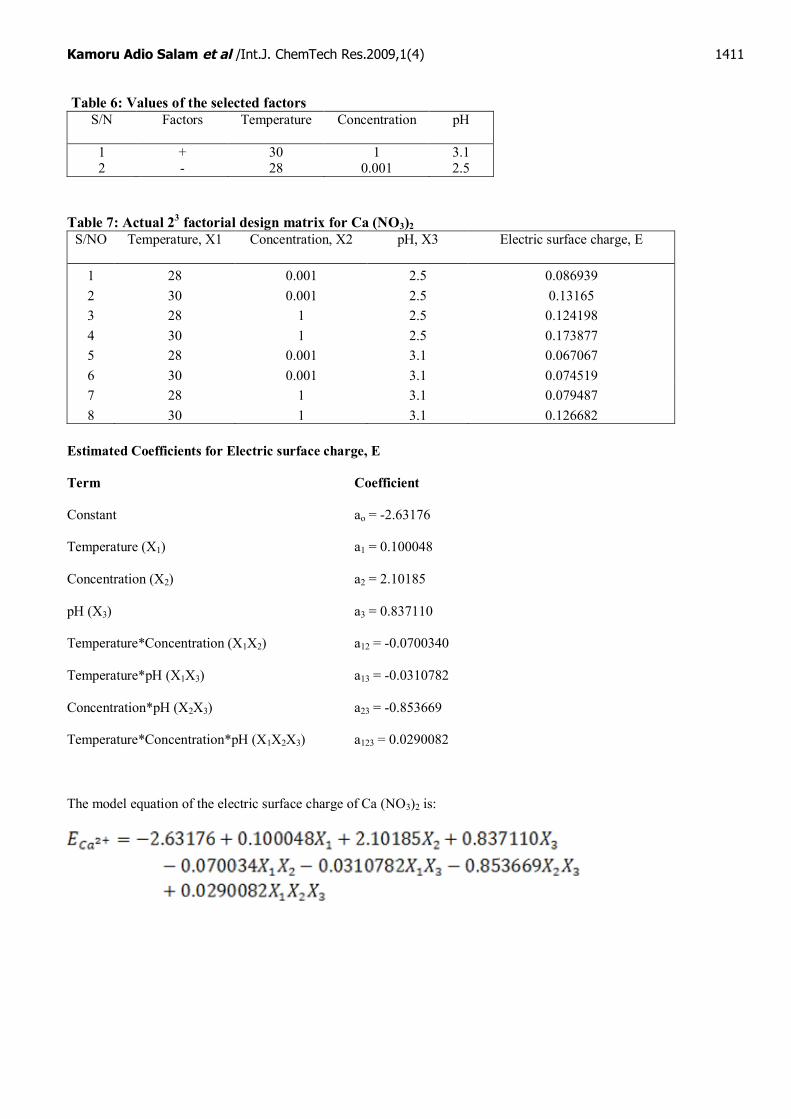
Table 6: Values of the selected factorsS/N Factors Temperature Concentration pH
1 + 30 1 3.12 - 28 0.001 2.5
Table 7: Actual 23 factorial design matrix for Ca (NO3)2S/NO Temperature, X1 Concentration, X2 pH, X3 Electric surface charge, E
1 28 0.001 2.5 0.0869392 30 0.001 2.5 0.131653 28 1 2.5 0.1241984 30 1 2.5 0.1738775 28 0.001 3.1 0.0670676 30 0.001 3.1 0.0745197 28 1 3.1 0.0794878 30 1 3.1 0.126682
Estimated Coefficients for Electric surface charge, E
Term Coefficient
Constant ao = -2.63176
Temperature (X1) a1 = 0.100048
Concentration (X2) a2 = 2.10185
pH (X3) a3 = 0.837110
Temperature*Concentration (X1X2) a12 = -0.0700340
Temperature*pH (X1X3) a13 = -0.0310782
Concentration*pH (X2X3) a23 = -0.853669
Temperature*Concentration*pH (X1X2X3) a123 = 0.0290082
The model equation of the electric surface charge of Ca (NO3)2 is:

Kamoru Adio Salam et al /Int.J. ChemTech Res.2009,1(4) 1412
Factorial plots for Ca2+
Mea
n o
f El
ectr
ic s
urfa
ce c
har
ge, E
3028
0.13
0.12
0.11
0.10
0.09
1.0000.001
3.12.5
0.13
0.12
0.11
0.10
0.09
Temperature Concentration
pH
Main Effects Plot (data means) for Electric surface charge, E of Ca(NO3)2
Figure10: Effects plot for electric surface charge of Ca (NO3)2
T emperature
0.16
0.12
0.08
Concentration
pH
3.12.5
1.0000.001
0.16
0.12
0.08
3028
0.16
0.12
0.08
Temperature2830
Concentration0.0011.000
pH2.53.1
Interaction Plot (data means) for Electric surface charge, E of Ca(NO3)2
Figure 11: Interaction plot for electric surface charge of Ca (NO3)2
Kamoru Adio Salam et al /Int.J. ChemTech Res.2009,1(4) 1413
3.1
2.5
1
0.0013028
pH
Concentration
Temperature
0.12668
0.074520.06707
0.07949
0.17388
0.131650.08694
0.12420
Cube Plot (data means) for Electric surface charge, E of Ca(NO3)2
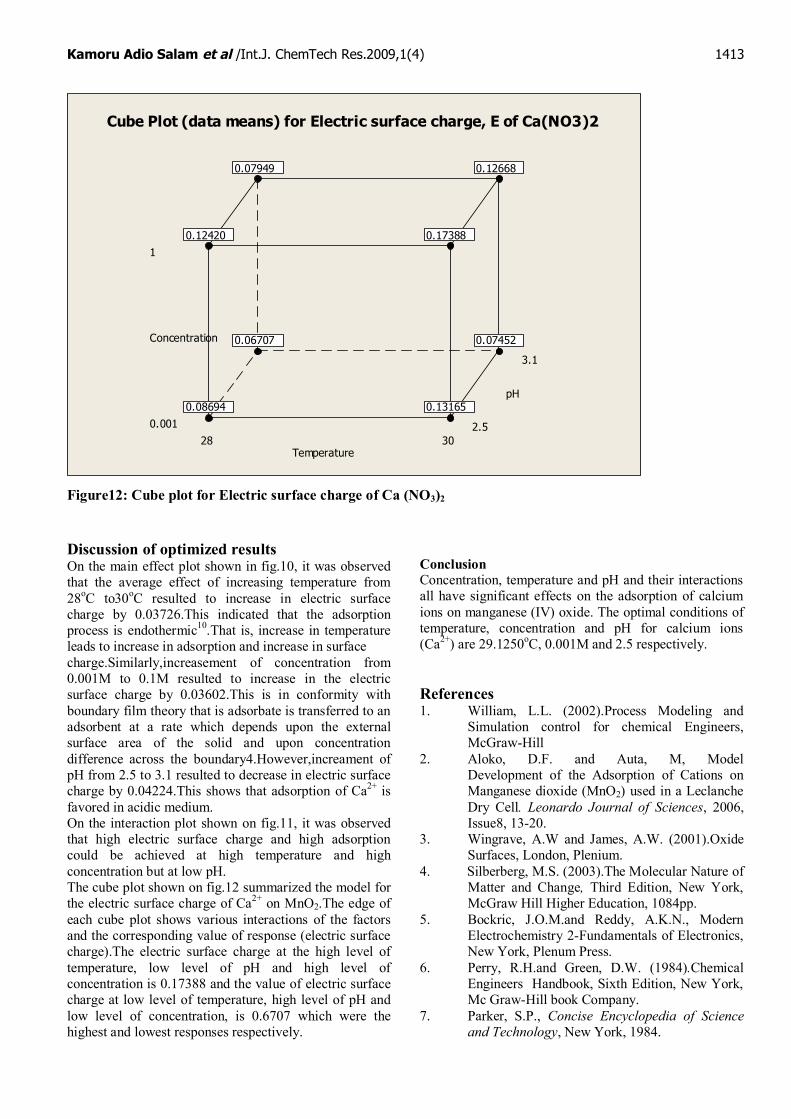
Figure12: Cube plot for Electric surface charge of Ca (NO3)2
Discussion of optimized resultsOn the main effect plot shown in fig.10, it was observedthat the average effect of increasing temperature from28oC to30oC resulted to increase in electric surfacecharge by 0.03726.This indicated that the adsorptionprocess is endothermic10.That is, increase in temperatureleads to increase in adsorption and increase in surfacecharge.Similarly,increasement of concentration from0.001M to 0.1M resulted to increase in the electricsurface charge by 0.03602.This is in conformity withboundary film theory that is adsorbate is transferred to anadsorbent at a rate which depends upon the externalsurface area of the solid and upon concentrationdifference across the boundary4.However,increament ofpH from 2.5 to 3.1 resulted to decrease in electric surfacecharge by 0.04224.This shows that adsorption of Ca2+ isfavored in acidic medium.On the interaction plot shown on fig.11, it was observedthat high electric surface charge and high adsorptioncould be achieved at high temperature and highconcentration but at low pH.The cube plot shown on fig.12 summarized the model forthe electric surface charge of Ca2+ on MnO2.The edge ofeach cube plot shows various interactions of the factorsand the corresponding value of response (electric surfacecharge).The electric surface charge at the high level oftemperature, low level of pH and high level ofconcentration is 0.17388 and the value of electric surfacecharge at low level of temperature, high level of pH andlow level of concentration, is 0.6707 which were thehighest and lowest responses respectively.
ConclusionConcentration, temperature and pH and their interactionsall have significant effects on the adsorption of calciumions on manganese (IV) oxide. The optimal conditions oftemperature, concentration and pH for calcium ions(Ca2+) are 29.1250oC, 0.001M and 2.5 respectively.
References1. William, L.L. (2002).Process Modeling and
Simulation control for chemical Engineers,McGraw-Hill
2. Aloko, D.F. and Auta, M, ModelDevelopment of the Adsorption of Cations onManganese dioxide (MnO2) used in a LeclancheDry Cell. Leonardo Journal of Sciences, 2006,Issue8, 13-20.
3. Wingrave, A.W and James, A.W. (2001).OxideSurfaces, London, Plenium.
4. Silberberg, M.S. (2003).The Molecular Nature ofMatter and Change, Third Edition, New York,McGraw Hill Higher Education, 1084pp.
5. Bockric, J.O.M.and Reddy, A.K.N., ModernElectrochemistry 2-Fundamentals of Electronics,New York, Plenum Press.
6. Perry, R.H.and Green, D.W. (1984).ChemicalEngineers Handbook, Sixth Edition, New York,Mc Graw-Hill book Company.
7. Parker, S.P., Concise Encyclopedia of Scienceand Technology, New York, 1984.

Kamoru Adio Salam et al /Int.J. ChemTech Res.2009,1(4) 1414
8. Aloko, D. and Afolabi, E.A Titanium Dioxide asa Cathode Material in a Dry Cell. LeonardoElectronics Journal of Practices andTechnologies, 2007, Issue 11, 97-108.
9. Richardson, J.F., Harker, J.H. and Backhurst,J.R. (2002).Chemical Engineering-Particle
Technology and Separation processes, FifthEdition, New Delhi, Elsevier, Vol.2, 1229p.
10. Somboon, W. Removal of Metal in Aqueous solution using Natural Material: 1Removal Capability and Efficiency,J.of Environmental Research, 1990, 1,58-74.
*****