computational study of flow interactions over a close
TRANSCRIPT

International Journal of Aviation, International Journal of Aviation,
Aeronautics, and Aerospace Aeronautics, and Aerospace
Volume 6 Issue 1 Article 5
2019
Computational Study of Flow Interactions over a Close Coupled Computational Study of Flow Interactions over a Close Coupled
Canard-Wing on Fighter Canard-Wing on Fighter
Setyawan Bekti Wibowo Universitas Gadjah Mada, Indonesia, [email protected] Sutrisno Sutrisno Universitas Gadjah Mada, [email protected] Tri Agung Rohmat Universitas Gadjah Mada, [email protected]
Follow this and additional works at: https://commons.erau.edu/ijaaa
Part of the Aerodynamics and Fluid Mechanics Commons, and the Computer-Aided Engineering and
Design Commons
Scholarly Commons Citation Scholarly Commons Citation Wibowo, S. B., Sutrisno, S., & Rohmat, T. A. (2019). Computational Study of Flow Interactions over a Close Coupled Canard-Wing on Fighter. International Journal of Aviation, Aeronautics, and Aerospace, 6(1). https://doi.org/10.15394/ijaaa.2019.1306
This Article is brought to you for free and open access by the Journals at Scholarly Commons. It has been accepted for inclusion in International Journal of Aviation, Aeronautics, and Aerospace by an authorized administrator of Scholarly Commons. For more information, please contact [email protected].

Introduction
Aircraft technology is always evolving to improve efficiency and flight ability.
One of the improvement efforts is by modifying the flow along the fuselage by
adding a canard to the front of the aircraft wing. Canard is a part of an airplane that
functions as a stabilizer or elevator and is placed in front of the main wing (Crane,
2012). The addition of a pair of canard wings will increase the lift force while
delaying the occurrence of a stall at high angles. On the wing form of a fighter wing
in the form of a delta wing will produce a rolled-up vortex that will produce lift
force on the wing of the aircraft.
The delta wing configuration as the basic shape of the wing and canard on a
fighter aircraft will produce the rolled-up vortex that will add the lifting force
(Polhamus, 1966; Polhamus & Polhamus, 1966). Rolled-up vortex has an area in
the center which has very high velocity and low pressure as a lifting force called
the vortex core. On delta aircraft, this vortex core is the place where the
concentration of lift is formed. The addition of forewings such as canard or Leading
Edge Extension (LEX) also produces a strong vortex core leading backward and
influencing airflow along the main wing.
The existence of a very complex flow interaction from the vortex which is
formed from the canard to the air flow in the main wing makes the characteristics
of the plane change; this condition is very important to be observed. Several flow
phenomena that occur, such as rolled-up vortex, vortex core, vortex breakdown,
flow separation, and vortex merging require special analysis for further
observations to uncover airflow phenomena in fighter aircraft to be able to improve
the ability of aircraft.
Several previous studies have conducted studies on the use of canard in aircraft
which in general can illustrate an increase in flight performance. Most of this
research takes the subsonic velocity area to characterize canard use on aircraft.
Several studies demonstrate the significant increase in lift (Ali, Kuntjoro, &
Wisnoe, 2012, 2013; Anand, & Kulkarni, 2014; Davari, Hadidoolabi, Soltani, &
Izadkhah, 2015; Desharnais, 2014; Jindeog, Tahwan, & Bongzoo, 2002; Lopes &
da Mota Girardi, 2005; Manshadi, Sharafi, & Soltani, 2012; Nasir, Kuntjoro, &
Wisnoe, 2014; Reduan et al., 2010; Rizzi, 2011; Wibowo & Basuki, 2014). The
total lift force of the aircraft is produced together by the main wing and canard.
Therefore, this increase in lift can increase the efficiency of aircraft or wing loading
to be smaller.
Aerodynamic force analysis will show an increase in the ability of aerodynamic
characters such as an increase in lift force and the ability to withstand the
occurrence of the stall. Analysis of this phenomenon needs to be further supported
1
Wibowo et al.: Flow Interactions over a Close Coupled Canard
Published by Scholarly Commons, 2019

by a study of airflow and vortex dynamics that occur. The addition of a canard on
the front of the wing will positively affect the airflow that will pass through the
main wing. Flow interference that occurs due to the vortex produced by the canard
will be used to characterize the flow in the main wing so that the analysis of the
phenomenon of flow patterns that occur becomes very important. The position of
the canard towards the main wing will significantly influence the pattern of flow
interactions that arise so that the flying character and vortex dynamics that occur
will also change. Analysis of vortex dynamics in canard-main wing pairs needs to
be done to find the optimal configuration of a fighter aircraft. To analyze vortex
phenomena and their interaction on the main canard-wing pair, the use of
visualization techniques is very instrumental in uncovering the phenomenon.
Visualization using the Computational Fluid Dynamics (CFD) method will provide
complete results both quantitatively and qualitatively. The simulation results
obtained need to be validated on the experimental results to ensure good simulation
results. Also, it is also necessary to first conduct a computational feasibility study
including the study of mesh independence and convergence. The use of the
experimental method using a water tunnel will provide good results to get detailed
visualization results and aerodynamic forces that occur.
The use of water tunnels (WaTu) has long been used to see the visualization of
flow testing on moving objects or fluid flow such as fighter aircraft. The method of
water tunnel to understand the flow dynamics that occur in aircraft is very visible
and is an advantage compared to the wind tunnel system (Cai, Cui, & Tsai, 2007;
Cobleigh & Delfrate, 1994; Frate, 1995; Frink, Lamar, Lamar, Cowley, & Gouws,
1980; Jaroszewicz, Stachow, Sibilski, & Zyluk, 2011; Kerho, 2007; Kim, 1991;
Sandlin & Ramirez, 1991; Sutrisno et al., 2018; Thompson, 1990; Wibowo,
Sutrisno, & Rohmat, 2018). Water tunnels are very powerful for researching fighter
planes such as the joint strike fighter, missiles, unmanned aerial vehicles, UAVs,
ships, and submarines. In many ways, water tunnels are a better choice than testing
models in low-speed wind tunnels. For testing visualization - the use of flow with
coloring, water is a test media that is far better than air (Erickson, 1982; Erm & Ol,
2012; Sohn, Lee, & Chang, 2004; Sohn, Lee, & Chang, 2008).
Materials and Methods
In this research, an aircraft model with a delta wing base was created with a
swap angle value of 600 as shown in Figure 1. Configuring canard additions is
arranged in horizontal and vertical directions. Canard position change based on
changes in the horizontal direction within each ¼ chord length canard, while
changes in the vertical direction are adjusted according to canard thickness.
Experimental testing using a water tunnel is carried out as a comparison of
flow analysis to the visualization test and lift force for the basic configuration of
2
International Journal of Aviation, Aeronautics, and Aerospace, Vol. 6 [2019], Iss. 1, Art. 5
https://commons.erau.edu/ijaaa/vol6/iss1/5DOI: https://doi.org/10.15394/ijaaa.2019.1306

the shape of the aircraft. The configuration of the water tunnel testing and
parameters refers to Wibowo et al. (2018) with a flow rate of 0.1-0.23 m/s as shown
in Figure 2. The experimental results are used to obtain visualization by injecting
ink and calculating the lift coefficient (Cl) by measuring the lift force occurs using
load balance water tunnel (Firmansyah, Wibowo, & Mareta, 2017). Injection ink is
used to identify the occurrence of vortex cores in aircraft models. The test is done
by adjusting the angle of attack from α = 00 to 600 with step 100.
In the simulation using the Computational Fluid Dynamics (CFD) method, the
computational model is made symmetrically with size referring to the water tunnel
experiment. The size of the domain is made based on several references so that the
inlet, outlet, and wall will not affect the flow in the simulation model. The size and
configuration of the computational domain are shown in Figure 3.
Figure 1. Model configuration and variation in canard position changes.
3
Wibowo et al.: Flow Interactions over a Close Coupled Canard
Published by Scholarly Commons, 2019
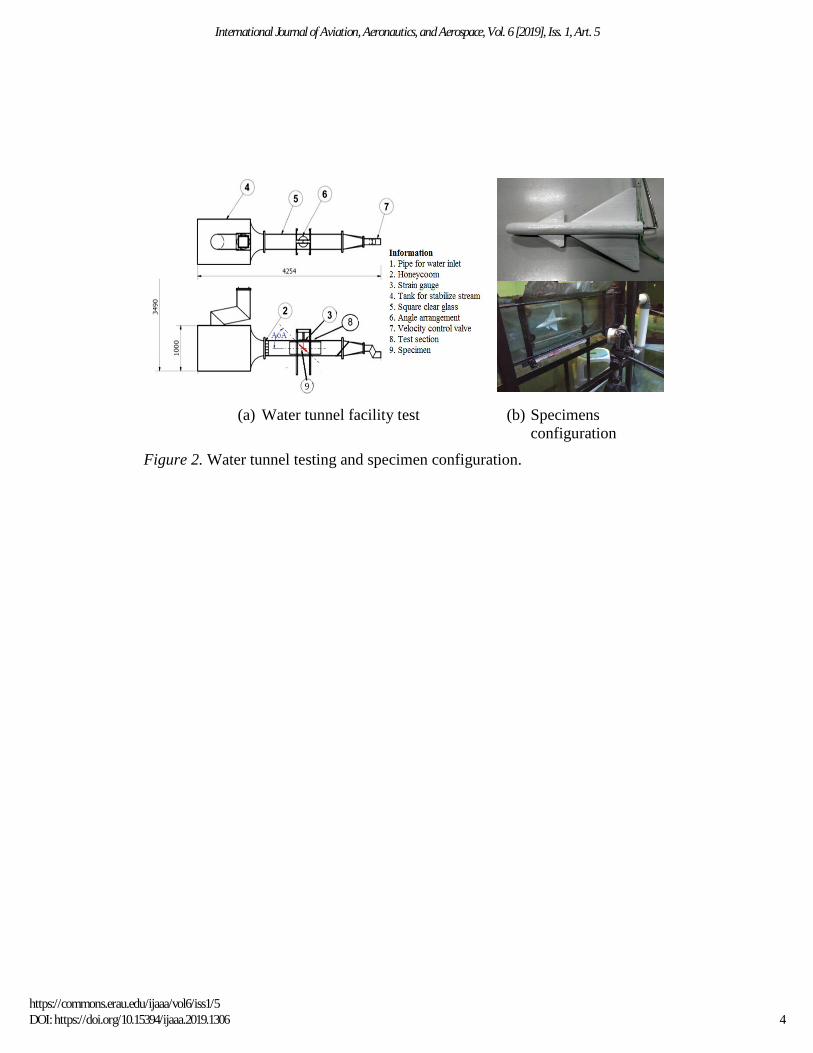
(a) Water tunnel facility test (b) Specimens
configuration
Figure 2. Water tunnel testing and specimen configuration.
4
International Journal of Aviation, Aeronautics, and Aerospace, Vol. 6 [2019], Iss. 1, Art. 5
https://commons.erau.edu/ijaaa/vol6/iss1/5DOI: https://doi.org/10.15394/ijaaa.2019.1306

(a) computational domain
(b) Mesh model isometric view (c) Mesh model top view
Figure 3. Domain and computational mesh configuration.
The configuration of the computational cells uses the H-structured mesh type.
Mesh independency study needs to be done to determine the smallest mesh size and
number of the required mesh so that the optimal simulation results are obtained.
The mesh independency study based on a previous study (Wibowo, Sutrisno, &
Rohmat, in press). The essential factor to get a good rolled-up vortex and vortex
core is in determining the smallest cell. The smallest cell is obtained from the use
of dimensionless wall distance (y+) with y+ value taken for y+ = 1. As for the
results of the mesh independency study, the number of cells with convergence
values on the qualitative value of Cl is 5 million cells. In this study used 5.4 million
cells with the smallest cell size of 0.00061m.
Identification of the occurrence of rolled-up vortex phenomena and the vortex
breakdown is essential in revealing the characteristics of fighter aircraft. To obtain
computational completion, the use of turbulence models considerably influences
the vortex pattern that occurs. Based on previous research, the use of the D-DES
5
Wibowo et al.: Flow Interactions over a Close Coupled Canard
Published by Scholarly Commons, 2019

turbulence model was able to detect vortex phenomena very well (Wibowo et al.,
2018). For this study, the D-DES method was used for the turbulence equation.
Results
The results of the study are presented in the lift coefficient (Cl) value from the
CFD compared to the results of the water tunnel experiment as shown in Figure 4.
In the picture can be seen the effect of increasing the lifting force on the addition
of canard in all positions. Overall, the addition of a canard will increase the lift
coefficient of the aircraft model by up to 12%. In the low angle of attack (AoA)
(under 200) the Cl value for each model has the same value. After AoA is higher
than 200, there is a difference in lift coefficient value. In aircraft models without
using canard, the Cl value increases up to AoA 350 and after that decreases the
value of Cl. The picture also shows that the simulation results have good similarity
to the Cl value compared to the experimental results using a water tunnel (WaTu).
Figure 4. Lifting coefficient (Cl) on canard position variations against AoA from
the CFD and experiment results (no-canard).
In configurations with canard additions, the lift coefficient still increases to Cl
maximum for AoA over 400. The increase in AoA at maximum Cl in the canard
configuration shows that there is still a lift force compared to conditions without
canard. The rise in AoA at maximum Cl also indicates that the stall condition is
delayed more at higher AoA. Almost all canard configuration configurations used
can delay the occurrence of stall, but in detail, there are differences in the
6
International Journal of Aviation, Aeronautics, and Aerospace, Vol. 6 [2019], Iss. 1, Art. 5
https://commons.erau.edu/ijaaa/vol6/iss1/5DOI: https://doi.org/10.15394/ijaaa.2019.1306

characteristics of the Cl value for each configuration. To see in detail the changes
that are at a higher angle, then at 300-500 AoA, detailed observation of the lift
coefficient value is carried out.
Figure 5 shows the difference in lift coefficient in detail at 300-500 AoA for
coplanar/horizontal and vertical canard position changes on the main wing. Figure
5a shows the difference in Cl values for coplanar/horizontal canard position. In the
coplanar position, the canard position approaching the main wing (case A0) will
produce the highest Cl value. This condition causes the AoA value at maximum Cl
to shift at a higher angle of attack so that this configuration will be better able to
maintain lift. Figure 5b shows the lift coefficient value in AoA detail with vertical
canard position variation. It can be seen that from the parallel position to the main
wing then shifts upwards causing a slight increase in lift. However, increasing
position does not always increase Cl, in vertical distance configurations ½ tc and tc
(cases A1 and A2) show the highest increase in Cl value, and after that, it decreases
again.
(a) coplanar position (b) vertical position
Figure 5. Cl value in detail at AoA 300 and 400 on canard position variations.
The results of the computational model need to be validated with the results of
the water tunnel experiment. Experiments using the GAMA water tunnel test
facility that has been configured refer to previous studies (Wibowo et al., 2018).
Validation was carried out by measuring Cl and observing the core vortex
phenomenon and the occurrence of vortex damage along the main wing in non-
canard models, then comparing the results between simulation and experimental
results both qualitatively (Cl value) and quantitative (vortex visualization). Figure
4 shows the good similarity for the Cl value, while the results of visualization of
the vortex core and the position of vortex damage can be seen in Figure 6 with good
similarities.
7
Wibowo et al.: Flow Interactions over a Close Coupled Canard
Published by Scholarly Commons, 2019

(a) Side view
visualization with CFD
(b) Top view
visualization with CFD
(c) visualization from
water tunnel (experiment)
Figure 6. Visualization of vortex core path-line and vortex breakdown location
(VBL) at no-canard configuration
Flow characteristics of the fighter model were analyzed using CFD by
observing vortex core formation, contour velocity distribution, and flow pathline
along the canard and main wing as shown in Figure 7. From the airflow character,
it can be determined the formation of the vortex core, flow interactions that occur
or vortex damage.
8
International Journal of Aviation, Aeronautics, and Aerospace, Vol. 6 [2019], Iss. 1, Art. 5
https://commons.erau.edu/ijaaa/vol6/iss1/5DOI: https://doi.org/10.15394/ijaaa.2019.1306

Figure 7. Visualization of velocity contours and the development of vortex cores
based on Q-criterion.
The vortex core is shown through visualization of vortex core based on Q-
criteria, direction, and value of flow vortex speed, and form of the velocity
distribution. While vortex breakdown is shown by sudden vortex core enlargement,
velocity contour breakage, and backflow. The kind of flow interaction is reflected
in the direction of flow and velocity distribution above the main wing.
Changes in canard position in both horizontal and vertical directions cause
differentiation of the lift coefficient force (Cl) This condition is affected by the
formation of flow interactions from the canard. Figure 8 and Figure 9 show the
visualization of the flow of the canard and the main wing in forming rolled-up
vortex using CFD technique at AoAs 300 and 500. In the figure also shows how
the flow of each flow interacts in the formation of a vortex core as a source of lift
force on the wing. In the higher AoA (500), it is seen that the location of vortex
breakdown progresses closer to the leading edge. In the comparison of canard
locations horizontally (Cases A0, B0, C0, and D0 as well as in cases A2, C2, and
B2) shows the vortex core trajectory going up above the main wing, causing the
flow interaction to decrease.
9
Wibowo et al.: Flow Interactions over a Close Coupled Canard
Published by Scholarly Commons, 2019

(a) A0 case (d) A0 case
(b) A4 case (e) A4 case
(c) C0 case (f) C0 case
Figure 8. Visualization of flow interactions from a side and top view for canard
position variations at AoA 300.
10
International Journal of Aviation, Aeronautics, and Aerospace, Vol. 6 [2019], Iss. 1, Art. 5
https://commons.erau.edu/ijaaa/vol6/iss1/5DOI: https://doi.org/10.15394/ijaaa.2019.1306

(a) A0 case (d) A0 case
(b) A4 case (e) A4 case
(c) C0 case (f) C0 case
Figure 9. Visualization of flow interactions from a side and top view for canard
position variations at AoA 500.
Figure 10 shows in detail the vortex core trajectory on the main wing from the
side and top views for the AoA 300. At low attack angles (AoA<300), the canard
position configuration that is parallel and close to the main wing (cases A0, A1,
and B0) results in a low vortex core path as shown in Figure 10a. However, the
condition of the canard position farther away from the main wing causes the
vortex's core trajectory to rise upward and has the effect of reducing the formation
of lift force on the aircraft wing.
11
Wibowo et al.: Flow Interactions over a Close Coupled Canard
Published by Scholarly Commons, 2019

(a) The height of the vortex core
trajectory, AoA 300
(b) Vortex core trajectory across
the wing, AoA 300
(c) The height of the vortex core
trajectory, AoA 500
(d) Vortex core trajectory across
the wing, AoA 500
Figure 10. Vortex core trajectory in the vertical and transverse direction above the
main wing for variations in canard position at AoA 300 and 500.
Figure 10b shows the position of the vortex core in a horizontal direction above
the wing of the plane. In the canard position configuration approaching the main
wing will cause the tendency of the trajectory to widen on near the leading edge of
the main wing (Cases A0 and A1). While in the canard position that is far from the
main wing will produce a trajectory that tends to approach the fuselage. Figure 10.c
and 10.d show the details of the vortex core trajectory in the main wing for AoA
500. At a high angle of attack (AoA> 400). With the higher AoA, the vortex core
also changes both the canard and the main wing. Figure 10.c shows the height of
the formation of a vortex core on the main wing in the vertical direction. The vortex
core in the configuration for the canard adjacent to the main wing (case A0) results
in a higher trajectory compared to the configuration of the further canard position.
The farthest canard position still produces the highest trajectory. The lowest path
occurs in B2 and C0 position configurations. In high AoA conditions for the canard
12
International Journal of Aviation, Aeronautics, and Aerospace, Vol. 6 [2019], Iss. 1, Art. 5
https://commons.erau.edu/ijaaa/vol6/iss1/5DOI: https://doi.org/10.15394/ijaaa.2019.1306

location configuration which is near the main wing causes airflow to be obstructed
on the main wing producing vortex instability and causing the vortex core to be
breakdown quickly. In AoA, the high canard position in front of and above the main
wing (cases B2 and C2) gives flow space, so that vortex interaction is better.
While in Figure 10.d shows the vortex core trajectory horizontally at the angle
of attack 500. In the high angle of attack, the effect of horizontal trajectory also
changes. In areas near the leading edge or the front area of the wing have a similar
trajectory tendency up to 0.4 wing length. After this location, there is a different
path because there has been a vortex core damage based on the visualization results
in Figure 9.
Figure 11 shows a picture of the pressure distribution on the main wing surface
for the location of the root mean chord (x / L) at 21%, 43% and 60% with AoA 300,
400, and 500. The pressure distribution shows the pressure difference on the upper
and lower surfaces on the wing section with a certain distance. From the different
pressures that indicate the concentration of the lifting force that occurs. At AoA 300
conditions and close to the leading edge (x / L = 21%), it can be seen that the highest
pressure on the wing surface occurs in the upper canard position (cases A4, B4, and
B2).
The more to the rear of the wing, the pressure distribution of each canard
configuration also changes. At x / L = 43%, the pressure difference in the canard
configuration B2 case remains large followed by the C0 case, while the A4 and B4
cases start to shrink. Similarly, on the back of the wing (x / L = 60%), the difference
in surface pressure is still seen in the cases C0 and B2. The pressure difference in
other canard case configurations shows that in the upper part of the wing it has
begun to spread evenly, this indicates that it has already started to diminish or the
loss of vortex core influences. While in the case without canard, this condition has
begun to fluctuate in different pressures along the plane of the wing, this indicates
the start of a high vorticity intensity or damage to the vortex core.
At an increase of AoA 400 and x / L = 21%, the greatest difference in wing
surface pressure is seen in the cases of B2 A4, and B4 followed in other cases. In a
more backward location x / L = 43% there is a decrease in pressure difference in
the case of B2, A4, and B4 approaching the same value, while for other canard
configurations the pressure difference above the wing is smaller. While in the case
without canard the pressure difference above the wing has fluctuated which
indicates that the vortex breakdown has occurred. Next at the back of the location
at x / L = 60%, there was a decrease in the whole case except in the case of C0 it
persisted. For the case of A0, A1 and without canard it has fluctuated pressure
above the wing.
13
Wibowo et al.: Flow Interactions over a Close Coupled Canard
Published by Scholarly Commons, 2019

(a) 21% mac wing AoA
300
(b) 21% mac wing AoA
400
(c) 21% mac wing AoA
500
(d) 43% mac wing AoA
300
(e) 43% mac wing AoA
400
(f) 43% mac wing AoA
500
(g) 60% mac wing AoA
300
(h) 60% mac wing AoA
400
(i) 60% mac wing AoA
500
Figure 11. Pressure distribution for the wings locations 21%, 43%, and 60% mean
aerodynamics chords (mac) with AoA 300,400, and 500.
At the AoA 500 for the position on the front x / L = 21% the biggest pressure
difference is seen in the case of A4 and B2, followed by another case canard
14
International Journal of Aviation, Aeronautics, and Aerospace, Vol. 6 [2019], Iss. 1, Art. 5
https://commons.erau.edu/ijaaa/vol6/iss1/5DOI: https://doi.org/10.15394/ijaaa.2019.1306

configuration. In the no-canard configuration, it has shown fluctuating symptoms,
thus indicating the occurrence of vortex breakdown. In a more backward location
(x / L = 43%), the B2 case shows the pressure difference is still quite large, while
the A4 and B4 cases have begun to decline followed by the C0 case. The other case
configurations are seen starting the fluctuating phase of pressure. At the location of
x / L = 60% configuration of the canard position which still shows the pressure
difference on the wing surface is in the B2 case and C0, while in other cases it has
experienced a fluctuating pressure which indicates a vortex breakdown.
Discussion
In the case of changes in canard position horizontally (Cases A0, B0, C0, and
D0) each has a different characteristic interaction between canard vortex and wing
vortex. Figure 8 shows the formation of vortex core path-lines from the canard for
the changes of horizontal canard position from the side and upper side views. The
vortex core formed from the canard will interact with the main wing vortex core
and became merge. In the canard position closest to the main wing, flow
interactions occur faster and closer above the main wing. The farther canard
position causes the vortex core trajectory to move upwards, the interaction
decreases and the vortex core's merging location retreats to the main wing.
Similarly, in the comparison of canard position horizontally (Cases A2, B2,
and C2), the canard position closer to the main wing will result in greater
interaction. The formation of a rolled-up vortex from the further canard position to
the main wing will be easily lifted up, so the interaction effect becomes less. While
the roll-up vortex formation from the canard with a closer position will remain in a
low position above the main wing, this is seen in the cases A0, B0, A2, and B2. In
lower canard vortex formation, the main wing flow is more maintained in a
streamlined form and thus better flow stability. Flow stability makes the vortex core
more stable and more difficult to breakdown. In other words, the lower the vortex
flow from the canard above the main wing will delay vortex breakdown in the main
wing.
Changes in the canard position vertically also produce differences in the vortex
trajectory of the canard (Cases A0, A1, A2, and A4; and in the Cases B0, B2, and
B4). In general, the increase in canard position causes the trajectory of the canard's
vortex to rise above the main wing, thereby reducing interaction. However, the
increase in flow height in the case of A1 is not significant in reducing flow
interactions because the canard position is still low. This condition is shown in
cases A0 and A1 which have no differences in location of the interaction of the
flow between the canard's vortex and the main wing. While at a higher position
than A1 (A2 and so on) the merging of the flow between vortices is more backward
due to the reduction in flow interaction.
15
Wibowo et al.: Flow Interactions over a Close Coupled Canard
Published by Scholarly Commons, 2019

The pressure distribution on the wing and fuselage surface can indicate the
strength of the interaction between the canard's vortex and the main wing. The
strength of vortex interaction will cause the rolled-vortex structure to expand on the
outer side of the main wing (away from the fuselage wall). This condition causes
the focus of lift to be on the wing of the plane as shown in Figure 8. The closer
position of the vortex core to the fuselage causes the influence of negative pressure
on the wall due to the pulling force of the vortex core generated by the aircraft body.
In Figure 8 it can be seen that in the canard position which is far or too high towards
the main wing causes the vortex flow interaction to decrease. The weak vortex
interaction causes the vortex core trajectory to be close to the fuselage. This
phenomenon will cause a negative pressure on the vertical fuselage wall which
indicates energy losses that are not needed in the fuselage. While at the location of
good vortex interactions (cases A0, A1, A2, B0, B1, B2) focus on the occurrence
of negative pressure on the wing resulting in an effective lift force.
Similarly, with the length of the vortex core above the main wing, the influence
of the canard's vortex above the wing will make the flow more stable. In cases that
have good flow interactions, the vortex core above the main wing is longer and
more stable. This indicates the formation of the lifting force at the larger vortex
core. By looking at the results of path-line visualization of the vortex core from the
side and top is obtained in the cases of A0, A1, B0, B1, B2, and C0 to produce a
longer vortex core than in the other cases.
With the increasing of AoA up to 500 causes the canard position close to the
main wing (case A0) there will be an increase in fluctuating flow and vortex core
instability. This condition causes easier vortex breakdown. The more moving
forward of the location of vortex breakdown on the main wing, the resulting lift
force will decrease. So that at a high attack angle the location is too close to disturb
the flow and faster in the occurrence of damage to the vortex core. The best
conditions for high AoA occur in a position that is a little further away (Case B0 or
C0).
Likewise, in Figure 7 that shows the top view of the flow formed. In the
configuration of the canard position with a location closer to the main wing causes
an increase in interaction. The increased interaction causes the direction of the flow
of the main wing vortex core to expand outward away from the fuselage. This
condition causes the concentration of negative pressure as a source of more lifting
force on the outside of the wing. With the increase in AoA at 400 and 500, the
formation of vortex nuclei is increasingly advanced and causes the concentration
of negative pressure also progressing forward.
In the low AoA, the closest canard position easier to interact with the flow
above the wing so that it can withstand the occurrence of the vortex breakdown.
16
International Journal of Aviation, Aeronautics, and Aerospace, Vol. 6 [2019], Iss. 1, Art. 5
https://commons.erau.edu/ijaaa/vol6/iss1/5DOI: https://doi.org/10.15394/ijaaa.2019.1306

However, at higher AoA the location that is too close speeds up the damage of the
vortex core. Likewise, for vertical positions, at the lowest AoA, the lowest position
results in good flow interaction, with the highest attack angle of the canard location
to the main wing resulting in a higher vortex core flow which further reduces flow
interaction. The ideal configuration is in the position above and adjacent to the main
wing (Cases A1, A2, B2) for low and medium AoA. Whereas for high AoA, the
ideal position is in the parallel and front position of the wing (Case C0, B0, B2).
At low angles of attack, the canard position with a location adjacent to the main
wing will give a low trajectory and widens out over the main wing. This condition
will provide maximum value in generating lift and reduce the negative pressure on
the fuselage vertical wall. The vortex core is formed up to the back of the wing for
all configurations. At the front end of the wing, there begins to be a considerable
difference in pressure distribution between the top and bottom of the wing, then
shrinks along with the location that is increasingly distant from the leading edge.
Whereas in the high AoA, the canard position parallel to the main wing produces a
lower trajectory approaching the main wing. The lower the path of the vortex core
causes the flow to maintain lift. While at the canard location which is closest
(coinciding) to the main wing causes flow disruption so that faster flow damage can
occur which is characterized by fluctuating flow paths that occur. So that in the
high AoA condition the best trajectory happens in the configuration of the canard
position with the location parallel to the main wing with a distance of ½ canard
chord in front of the main wing of the aircraft.
The canard configuration above the wing tends to produce a significant
pressure difference on the front of the wing, but rapidly decreases the pressure
difference on the back of the wing. While the configuration of the canard position
approaches the main wing, the lateral position is better able to withstand the
pressure difference to the rear of the wing, although the difference in pressure is
not as large as the canard position above the wing. This canard position
configuration character also applies to different AoA values.
The increase in AoA value causes an increase in the amount of pressure
difference, especially on the front of the wing. This shows an increase in the
strength of the vortex core in forming lift on the front of the wing. However, an
increase in AoA causes pressure fluctuations especially on the back of the wing to
occur more quickly as shown in Figure 11.e-f, h-i. In the figures show the location
of x / L = 43% and 60% many canard configurations that experience pressure
fluctuations due to the addition of AoA. It can be shown that the higher the AoA
causes the vortex breakdown location to progress.
The canard position configuration at the top of the main wing produces a good
lift force at low attack angles. While with the increase in AoA values the canard
17
Wibowo et al.: Flow Interactions over a Close Coupled Canard
Published by Scholarly Commons, 2019
position further down until parallel to the main wing can maintain lift. The position
of the canard far apart from the main wing reduces the level of vortex wing-canard
interaction. While at a distance closer to the main wing can provide good flow
interaction, especially at low attack angles. At higher attack angles (AoA> 400), the
flow interaction in the canard configuration coincides (case A0) becomes disrupted
so that the forward canard position configuration (case B or C) will give better
results. The canard position slightly in front of and above the main wing (case B2)
can maintain the stability of the vortex core until the angle of attack is high and the
position of the back of the main wing.
Conclusion
The results of the analysis of all tests found that the addition of canard will be
able to increase the lift coefficient up to 12%. The canard position on the main wing
affects the interaction of vortex flow, lift coefficient value, and maximum AoA. On
the canard position above the main wing gives a good lift force at low attack angles,
while at higher AoA the canard parallel to the main wing is better able to withstand
the lifting force before the vortex breakdown.
The canard position which is far from the main wing does not provide a useful
contribution in maintaining the stability of the vortex core, while the close
(coincident) position with the main wing can only produce good flow interaction at
low AoA. The most optimal results in all AoA conditions are obtained in the canard
position above and front (Case B2). While at the high AoA, canard configuration
in front of the main wing (Case C0) also gives good results. In the canard position
on the top and front of the main wing gives the best value for the shift in the
maximum Cl value between 5-10 degrees which indicates stall delay.
18
International Journal of Aviation, Aeronautics, and Aerospace, Vol. 6 [2019], Iss. 1, Art. 5
https://commons.erau.edu/ijaaa/vol6/iss1/5DOI: https://doi.org/10.15394/ijaaa.2019.1306

Nomenclature
α = angle of attacks (AoA/deg)
cc = canard chord length (mm)
H = canard horizontal distance (mm)
L = wing length (mm)
tc = canard thickness (mm)
V = canard vertical distance (mm)
y+ = dimensionless wall distance
CL = lift coefficient
Cp = pressure coefficient
P = total pressure loss (Pa)
mac = mean aerodynamic chord
U∞ = free stream velocity (m/s)
VBL = vortex breakdown location
x = axial axis
x/L = nondimensional location at axial axis
Y = spanwise axis
Z = the model aircraft hight (mm)
19
Wibowo et al.: Flow Interactions over a Close Coupled Canard
Published by Scholarly Commons, 2019

References
Ali, Z. M., Kuntjoro, W., & Wisnoe, W. (2012). Effect of canard to the
aerodynamic characteristics of blended wing body airplane. Paper presented
to the 2012 IEEE Symposium on Business, Engineering and Industrial
Applications (Vol. 1, pp. 696–700). doi: 10.1109/ISBEIA.2012.6422979
Ali, Z. M., Kuntjoro, W., & Wisnoe, W. (2013). The effect of canard on
aerodynamics of blended wing body. Applied Mechanics and Materials,
7(5), 912-916. https://doi.org/10.4028/www.scientific.net/AMM.110-
116.4156
Anand S. R. & Kulkarni, P. S. (2014). Aerodynamic performance of the canard
wing configuration-A CFD Study. In 16th Annual CFD Symposium.
Cai, J. S., Cui, Y. D., & Tsai, H. M. (2007). A combined experimental and
analytical investigation of the vortex stability over sharp-edged slender
bodies. Physics of Fluids, 19, 1-14. https://doi.org/10.1063/1.2766739
Cobleigh, B. R., & Delfrate, J. (1994). Water tunnel flow visualization study of a
4.4% scale X-31 forebody. Retrieved from https://www.nasa.gov/centers/
dryden/pdf/88336main_H-1997.pdf
Crane, D. (2012). Dictionary of aeronautical terms (5th ed.). Newcaste, WA:
Aviation Supplies & Academics.
Davari, A. R., Hadidoolabi, M., Soltani, M. R., & Izadkhah, M. (2015). Aspects
of canard-wing vortices interaction in subsonic Flow. SCIENTIA IRANICA,
22(3), 743-755.
Desharnais, O. (2014). Aircraft conceptual design study of the canard and
threesurface unconventional configurations for the purposes of reducing
environmental impacts. École de technologie supérieure (Masters thesis).
Retrieved from http://adsabs.harvard.edu/abs/2014PhDT.......166D. (No.
AAT 1570787
Erickson, G. (1982). Water-tunnel studies of leading-edge vortices. Journal of
Aircraft, 19(6), 442-448. https://doi.org/10.2514/3.57414
Erm, L. P., & Ol, M. V. (2012). An assessment of the usefulness of water tunnels
for aerodynamic investigations (AR Number AR-015-530 No. DSTO-TR-
2803, Air Vehicles Division DSTO Defence Science and Technology
Organisation). Retrieved from http://dspace.dsto.defence.gov.au/dspace/
Firmansyah, R. D., Wibowo, S. B., & Mareta, R. (2017). The application of
measurement instrument of three degrees of freedom of aerodynamic force in
20
International Journal of Aviation, Aeronautics, and Aerospace, Vol. 6 [2019], Iss. 1, Art. 5
https://commons.erau.edu/ijaaa/vol6/iss1/5DOI: https://doi.org/10.15394/ijaaa.2019.1306

water tunnel. Jurnal Sains Dan Teknologi, 6(2), Universitas Pendidikan
Ganesha (in Indonesian).
Frate, J. H. Del. (1995). NASA Dryden flow visualization facility (No. H-1972,
NASA Dryden Flight Research Center). Edwards AFB, CA: NASA
Technical Memorandum.
Frink, N. T., E. Lamar, J., Lamar, J. E., Cowley, J., & Gouws, T. (1980). Water-
tunnel and analytical investigation of the effect of strake design variables on
strake vortex breakdown characteristic. Langely, VA: NASA. Retrieved
from https://ntrs.nasa.gov/archive/nasa/casi.ntrs.nasa.gov/19800019803.pdf
Jaroszewicz, A., Stachow, J., Sibilski, K., & Zyluk, A. (2011). Water tunnel
experimental studies of leading edge vortex control on delta wing MAV. In
49th AIAA Aerospace Sciences Meeting including the New Horizons Forum
and Aerospace Exposition (pp. 1-11). https://doi.org/10.2514/6.2011-1158
Jindeog, C., Tahwan, C., J, L., & Bongzoo, S. (2002). Wind tunnel test of a
canard airplane. KSME International Journal, 16(I), 125-131.
Kerho, M. (2007). Ultra low reynolds number airfoil testing facility. In 45th AIAA
Aerospace Sciences Meeting (pp. 1-13). American Institute of Aeronautics
and Astronautics, Inc. Retrieved from http://www.rollinghillsresearch.com/
Aero_Research/Files/AIAA-2007-0959_Low_RN_Airfoil_Testing.pdf
Kim, C. H. (1991). Flow visualization studies of a sideslipping, canard-
configured X-31A-like fighter aircraft model. Monterey, CA: Naval
Postgraduate School.
Lopes, V. M. L., & da Mota Girardi, R. (2005). Analysis of the aerodynamics
characteristics of a wing-canard configuration with canard deflection using
panel method. In Proceedings of COBEM 2005, 18th International Congress
of Mechanical Engineering. Ouro Preto, MG: ABCM.
Manshadi, M. D., Sharafi, A., & Soltani, M. R. (2012). An experimental
investigation of the effects of canard position on the aerodynamic forces of a
fighter configuration model. Journal of Aerospace Science & Technology,
9(2), 15–23. 9. Retrieved from http://jast.ias.ir/ article_51618_
c939fafe9f8c09dd0b9903645827d341.pdf
Nasir, R. E. M., Kuntjoro, W., & Wisnoe, W. (2014). Aerodynamic, stability and
flying quality evaluation on a small blended wing-body aircraft with canard
foreplanes. Procedia Technology, 15, 783-791. https://doi.org/10.1016/
j.protcy.2014.09.051
21
Wibowo et al.: Flow Interactions over a Close Coupled Canard
Published by Scholarly Commons, 2019
Polhamus, E. C. (1966). Vortex lift research: Early contributions and some
current challenges. In J. F. Campbell, R. F. Osborn, & J. Foughner, J. T.
(Eds.), Vortex flow aerodynamics (Vol. 1, pp. 1-30). Hampton, VA: NASA-
CP-2416-VOL-1, L-16117, NAS 1.55:2416-VOL-1.
Polhamus, E. C. (1966). A concept of the vortex lift of sharp-edge delta wings
based on a leading-edge-suction analogy (NASA technical note D-3767 No.
NASA TN D-3767). NASA Technical Note (Vol. TN-D-3767). Washington,
D.C. : National Aeronautics and Space Administration. Retrieved from
https://ntrs.nasa.gov/archive/ nasa/ casi.ntrs.nasa.gov/19670003842.pdf
Reduan, N. F., Wisnoe, W., Kuntjoro, W., Nasir, R. E. M., Mohamad, F., & Ali,
Z. (2010). Aerodynamics characteristic of UiTM’s BWB UAV Baseline-II at
different canard deflection angles at low pitching angle. CSSR 2010 - 2010
International Conference on Science and Social Research, (CSSR), 1005-
1009.
Rizzi, A. (2011). Modeling and simulating aircraft stability and control - The
SimSAC project. Progress in Aerospace Sciences, 47(8), 573-588.
https://doi.org/10.1016/j.paerosci.2011.08.004
Sandlin, D. R., & Ramirez, E. J. (1991). Water tunnel flow visualization study of
the vortex flow structures on the F/A-18 aircraft (No. NASA-CR-186938,
NAS 1.26:186938). Retrieved from https://ntrs.nasa.gov/archive/ nasa/
casi.ntrs.nasa.gov/19910017812.pdf
Sohn, M. H., Lee, K. Y., & Chang, J. W. (2004). Vortex flow visualization of a
yawed delta wing with leading edge extension. Journal of Aircraft, 41(2),
231-237. https://doi.org/10.2514/1.9281
Sohn, M. H., Lee, K. Y., & Chang, J. W. (2008). Delta-wing vortex visualization
using micro-sized water droplets generated by an ultrasonic humidifier.
Journal of Visualization, 11(4), 337–346. https://doi.org/10.1007/
BF03182202
Sutrisno, Rochmat, T. A., Wibowo, S. B., Iswahyudi, S., Wiratama, C., &
Kartika, W. (2018). The flow visualization CFD studies of the fuselage and
rolled-up vortex effects of the Chengdu J-10-like fighter canard. Modern
Applied Science, 12(2), 148. https://doi.org/10.5539/mas.v12n2p148
Thompson, D. H. (1990). Water tunnel flow visualisation of vortex breakdown
over the F/A-18 (AR-005-007 No. DST 88/034, Defence Science And
Technology Organisation Aeronautical Research Laboratory). Melbourne,
Victoria: Department of Defense.
22
International Journal of Aviation, Aeronautics, and Aerospace, Vol. 6 [2019], Iss. 1, Art. 5
https://commons.erau.edu/ijaaa/vol6/iss1/5DOI: https://doi.org/10.15394/ijaaa.2019.1306
Wibowo, S. B., & Basuki, B. (2014). Numerical study of canard effect on
aerodynamic characteristics of drone unmanned aerial vehicle. In S. V. Ugm
(Ed.), Seminar Nasional Teknologi Terapan (p. 11-15 (in Indonesian)).
Yogyakarta, Indonesia: ISBN 978-602-1159-06-4.
Wibowo, S. B., Sutrisno, & Rohmat, T. A. (in press). Study of mesh
independence on the computational model of the roll-up vortex phenomena
on fighter and delta wing model. International Journal of Fluid Mechanics
Research.
Wibowo, S. B., Sutrisno, & Rohmat, T. A. (2018). An evaluation of turbulence
model for vortex breakdown detection over delta wing. Archive of
Mechanical Engineering, LXV(3), 399-415. https://doi.org/10.24425/124489
Wibowo, S. B., Sutrisno, Rohmat, T. A., Anwar, Z., Syadi, F. R., Mahardika, R.,
& Naufal, W. F. (2018). An investigation into the use of GAMA water
tunnel for visualization of vortex breakdown on the delta wing. In 9th
International Conference on Thermofluids (p. 050007). Yogyakarta,
Indonesia: AIP Conference Proceedings. https://doi.org/10.1063/1.5049998
23
Wibowo et al.: Flow Interactions over a Close Coupled Canard
Published by Scholarly Commons, 2019