computational approaches in molecular and systems
TRANSCRIPT

TITLE PAGE
Computational Approaches in Molecular and Systems Pharmacology:
Application to Neurosignaling Membrane Proteins
by
Chang Liu
Bachelor of Science, Shandong University, China, 2012
Submitted to the Graduate Faculty of
School of Medicine in partial fulfillment
of the requirements for the degree of
Master of Science
University of Pittsburgh
2014

ii
THESIS COMMITTEE PAGE
UNIVERSITY OF PITTSBURGH
School of Medicine
This thesis was presented
by
Chang Liu
It was defended on
July 29th
, 2014
and approved by
Dr. Takis Benos, Associate Professor, Department of Computational and Systems biology,
University of Pittsburgh
Dr. Donald DeFranco, Professor, Department of Pharmacology and Chemical Biology,
University of Pittsburgh
Thesis Advisor: Dr. Ivet Bahar, Professor, Department of Computational and Systems
Biology, University of Pittsburgh

iii
Computational Approaches in Molecular and Systems Pharmacology:
Application to Neurosignaling Membrane Proteins
Chang Liu, MS
University of Pittsburgh, 2014
Submitted to the Graduate Faculty of
School of Medicine in partial fulfillment
of the requirements for the degree of
Master of Science
University of Pittsburgh
2014
Copyright © by Chang Liu
2014

iv
ABSTRACT PAGE
Computer-aided drug discovery methods have played a major role in the development of
therapeutically important molecules for decades, and some more advanced and effective methods
have been introduced in recent years. Those methods are generally classified as either molecular
pharmacology methods or quantitative systems pharmacology methods.
In this thesis, with regard to molecular pharmacology computations, we assess the
druggability of ionotropic glutamate receptors (iGluRs) N-terminal domains (NTDs) using
molecular dynamics (MD) simulations. The simulations are performed in the presence of probe
molecules that contain fragments shared by drug-like molecules. iGluRs are ligand-gated ion
channels that mediate excitatory neurotransmission events in the central nervous system.
Alterations in those receptors, especially in AMPA receptors (AMPARs) and NMDA receptors
(NMDARs), are responsible for many neuron diseases like Huntington’s diseases and
Parkinson’s diseases. Our study provides insights into the ligand-binding landscape of iGluR
NTD dimers and monomers. Moreover, we build PMs for AMPARs and NMDARs, which are
then used in a virtual screening scheme to identify lead compounds.
Our quantitative systems pharmacology studies focus on drug repurposing upon
computational analysis of known drug-target interactions. We use the probabilistic matrix
factorization (PMF) method for this purpose, which is particularly useful for analyzing large
interaction networks. Our method is shown to outperform those recently introduced for
identifying new drug-target associations. Finally, we integrate the results from our druggability
Computational Approaches in Molecular and Systems Pharmacology: Application to
Neurosignaling Membrane Proteins
Chang Liu, M.S.
University of Pittsburgh, 2014

v
simulations and PMF calculations by comparing the drug candidates predicted to bind AMPARs
or NMDARs by either of those methods.
In addition, we analyzed the structure and dynamics of sodium-coupled neurotransmitter
transporters that share the leucine transporter (LeuT) fold. We explore how the collective
motions predicted for LeuT using the elastic network models agree with the structural changes
experimentally observed upon ligand binding.

vi
TABLE OF CONTENTS
PREFACE .................................................................................................................................. XII
1.0 INTRODUCTION ........................................................................................................ 1
1.1 COMPUTATIONAL METHODS IN MOLECULAR PHARMACOLOGY 4
1.1.1 CADD in the drug discovery pipeline ............................................................ 5
1.1.2 Use of MD simulations in CADD.................................................................... 6
1.1.3 Pharmacophore modeling (PM) in CADD .................................................... 8
1.2 COMPUTATIONAL METHODS IN SYSTEMS PHARMACOLOGY ........ 9
1.2.1 Drug-target networks ...................................................................................... 9
1.2.2 Predictions of drug-target interactions ........................................................ 10
1.2.3 Predictions of drug combinations ................................................................ 11
1.2.4 Drug repurposing .......................................................................................... 12
1.2.5 Exploring the side effects of drugs ............................................................... 13
2.0 ELASTIC NETWORK MODELS: THEORY AND APPLICATION TO
LEUCINE TRANSPORTER ..................................................................................................... 15
2.1 ELASTIC NETWORK MODELS ................................................................... 16
2.1.1 Theory and methods ...................................................................................... 16
2.1.2 ANM-based evaluation of global modes of motion ..................................... 17

vii
2.2 LEUCINE TRANSPORTER: A MODEL SYSTEM FOR EXPLORING
SODIUM-COUPLED NEUROTRANSMITTER TRANSPORT .................................. 19
2.2.1 Structure of LeuT .......................................................................................... 19
2.2.2 Transport cycle and alternating access in LeuT ......................................... 21
2.2.3 Pharmacological properties of LeuT ........................................................... 24
2.3 APPLICATION OF ENM TO LEUCINE TRANSPORTER ....................... 26
2.3.1 Metrics for comparing experimental data and ANM predictions ............ 26
2.3.2 Comparison of ANM soft modes with PC modes derived from
experiments ................................................................................................................. 30
2.3.3 Comparison of ANM-predicted conformers with the conformations
sampled in MD simulations ....................................................................................... 32
2.4 CONCLUSION AND FUTURE WORK ......................................................... 34
3.0 DRUGGABILITY ASSESSMENT: APLLICATION TO IONOTROPIC
GLUTAMATE RECEPTORS (IGLUR) N-TERMINAL DOMAIN AND LIGAND-
BINDING DOMAIN ................................................................................................................... 36
3.1 OUTLINE OF METHODS ............................................................................... 38
3.2 STRUCTURAL FEATURES OF IGLUR N-TERMINAL DOMAINS ....... 40
3.3 LIGAND-BINDING SITES ON IGLUR LBD ................................................ 42
3.4 DRUG-LIKE PROBE CLUSTERS CAPTURING DIMER INTERFACE
FROM NTD MONOMER SIMULATION ...................................................................... 44
3.5 DRUGGABILITY ASSESSMENT OF IGLUR NTD DIMER ..................... 48
3.5.1 Druggability assessment of GluA3 NTD dimer .......................................... 48
3.5.2 Druggability assessment of GluN1-GluN2B NTD dimer ........................... 52

viii
3.6 CONCLUSION .................................................................................................. 56
4.0 PREDICTING DRUG-TARGET INTERACTIONS USING PROBABILISTIC
MATRIX FACTORIZATION ................................................................................................... 58
4.1 ANALYSIS OF DRUG-TARGET INTERACTION NETWORK ................ 59
4.2 OVERVIEW OF METHODS ........................................................................... 62
4.2.1 Dataset ............................................................................................................ 62
4.2.2 Probabilistic Matrix Factorization (PMF) .................................................. 63
4.2.3 Active Learning (AL) using PMF................................................................. 65
4.3 PMF CLUSTERS DRUGS WITH THERAPEUTIC SIMILARITIES,
IRRESPECTIVE OF THEIR CHEMICAL-STRUCTURAL SIMILARITIES .......... 67
4.4 BENCHMARKING COMPUTATIONS SUPPORT THE UTILITY OF
THE METHOD FOR ANALYZING LARGE DATASETS .......................................... 73
4.5 THE ABSOLUTE NUMBER OF KNOWN INTERACTIONS OVERRIDES
THE SCARCITY OF THE DATA IN DETERMINING THE ACCURACY RATE OF
PMF ACTIVE LEARNER ................................................................................................ 77
4.6 DE NOVO PREDICTIONS OF DRUG-TARGET INTERACTIONS ......... 81
4.7 DISCUSSION ..................................................................................................... 83
5.0 CONCLUSION AND FUTURE WORK ................................................................. 86
APPENDIX A .............................................................................................................................. 90
BIBLIOGRAPHY ....................................................................................................................... 91

ix
LIST OF TABLES
Table 1 High affinity binding sites on iGluR monomers .............................................................. 47
Table 2 Druggability of GluA3 NTD dimer ................................................................................. 50
Table 3 Druggability of GluN1-GluN2B NTD dimer .................................................................. 54
Table 4 Properties of the space of proteins-drugs, and performance of present method in
comparison to others ..................................................................................................................... 74
Table 5 De novo predictions, rank-ordered based on confidence ................................................. 81
Table 6 Drugs predicted using pharmacophore models ................................................................ 87
Table 7 Top-ranking 10 drugs predicted by PMF for NMDA GluN1 and GluN2B subunits ...... 88
x
LIST OF FIGURES
Figure 1 Secondary structure of LeuT .......................................................................................... 20
Figure 2 Transport cycle of LeuT. ................................................................................................ 22
Figure 3 Description of the method for comparing ANM-predicted modes with the principal
structural variations observed in all available crystal structures with LeuT fold. ........................ 27
Figure 4 Results for LeuT. ............................................................................................................ 31
Figure 5 Comparison of the conformational space sampled by MD simulations with the principal
subspaces inferred from experiments and ANM theory. .............................................................. 33
Figure 6 Complete structure of GluA2 (left) (except for the C-terminal domain) and the structure
of the NTD dimer of GluA2 ( right) ............................................................................................. 41
Figure 7 Probes that capture the known drug-binding sites in the LBD dimer of GluA2. ........... 43
Figure 8 Interlobe (UL-UL and LL-LL) interface regions at the NTD dimer of GluA3, identified
by druggability simulation to have a high propensity for binding small molecules. .................... 45
Figure 9 Potential drug binding sites deduced from GluA3 NTD dimer simulations .................. 49
Figure 10 Binding sites at GluA3 NTD dimer interface and corresponding PMs. ....................... 51
Figure 11 Potential drug-binding sites captured by GluN1-GluN2B dimer druggability simulation
....................................................................................................................................................... 53
Figure 12 Binding sites at GluN1-GluN2B NTD dimer and corresponding PMs ........................ 55
xi
Figure 13 . Comparison of pairwise similarities of drugs ............................................................. 68
Figure 14 Latent variables can capture therapeutic action similarities when 3D similarity metrics
cannot. ........................................................................................................................................... 71
Figure 15 Strong cross-correlations between different clusters of drugs are consistent with their
similar therapeutic functions ......................................................................................................... 72
Figure 16 Ability of PMF to recapitulate hidden drug-target interactions. .................................. 78
Figure 17 Improvement in prediction accuracy by active learning (AL) over random (panel a)
and over passive learning (PL) (pane, as a function of the latent space dimensionality ......... 79l b)

xii
PREFACE
I would like to sincerely thank my advisor Professor Ivet Bahar, for being a great mentor, whose
patience, guidance, care and strong support, both academically and personally, have eventually
made my overseas graduate life enjoyable and memorable, especially her strong support during
my hard time. I learned a lot under her supervision such as critical thinking, independent
researching and preciseness for academic research. It is my great honor to have had her as my
supervisor and she will always be my life-long learning example and mental guide who will
inspire me to work or study hard to achieve my goals.
Also, I would like to thank my thesis committee members Dr. Takis Benos and Dr.
Donald DeFranco whose insightful comments and critiques have shaped my thoughts and ideas
towards my research.
In addition, I would like to thank Dr. Ignacio General, Dr. Indira Shrivastava, Dr. Ahmet
Bakan, Dr. Anindita Dutta and Murat Can Cobanoglu who taught me some useful techniques and
gave me insightful ideas towards research, and who have encouraged me to learn new
techniques. Moreover, I feel lucky to have had really helpful lab members, Dr. Mert Gur, Dr.
Mary Cheng, Dr. Filippo Pullara, Dr. Bing Liu, Dr. Timothy Lezon and Dr. Elia Zomot and
graduate students Mao, Kaitlyn and Cihan.

xiii
I feel lucky to have been accepted to the PIMB and happy to have met kind and helpful
students and friends, and interact with the faculty and staff of the program. I would like to thank
Susanna Goodwin who was always there to offer help and Dr. Jeffrey Hildebrand. Also, in the
department of Computational and Systems Biology, I am grateful to Kelly, Sandy and Nancy for
their help and patience.
A special acknowledgement goes to my roommate Jue Gong who helped me a lot during
my hard times. The time we studied in the library together, had meals together and went to
parties together is unforgettable. I also thank my best friends Mengdi Sun, Pu zhang, Shuchang
Liu, Rittika, Kaitlyn, Wenzhi Mao, Ya Su , Xiaolong Shen, Qingyang Ding and Jingyi Zhang
who accompanied me and made my graduate life colorful in Pittsburgh, whose friendship has
meant so much to me and will last forever. I really cherish the time when we had meals together
in Tong’s Cuisine.
Finally, I would like to thank my dad Mr. Dazhen Liu and my mom Mrs. Hong Qiu who
support me to do whatever I do and whose love is selfless and priceless. I hope they will be
proud of me one day.

1
1.0 INTRODUCTION
Drug discovery and development is generally considered to be costly and time-consuming. A
typical drug discovery and development cycle takes around 14 years (Myers and Baker 2001)
and costs between 0.8 and 1.0 billion USD (Moses, Dorsey et al. 2005). Due to the rapid
development in combinatorial chemistry and high-throughput screening technologies, it enables
huge libraries of compounds to be screened and synthesized in a short time (Ou-Yang, Lu et al.
2012). However, because of the low efficiency and high failure rate in drug discovery, the output
of developing a new drug is not positively proportional to the investment (Shekhar 2008). As a
result, computational drug discovery has been developed to transform drug development, and has
become an effective method to shorten the research cycle and reduce the cost and risk of failure.
Computer-aided drug design (CADD) is a general term that defines computational
approaches and sources for the storage, management, analysis and modeling of compounds
toward drug design. It includes many aspects of drug discovery, such as tools for assessing
potential lead candidates systematically, computer programs for designing compounds and the
development of digital repositories for investigating chemical interactions (Song, Lim et al.
2009).
The traditional and widely used computational drug discovery methods can be classified
into two broad groups: structure-based drug design, ligand-based drug design. Structure-based
drug design methods include molecular docking, molecular dynamics (MD) simulations and

2
structure-based pharmacophore modeling (PM). They all rely on knowledge of the target
macromolecule structure. The target molecule is usually a protein for which a drug is to be
designed, and its structural data are obtained from crystal structures, NMR data and homology
models (Chen, Morrow et al. 2012). In the absence of three-dimensional structure for the target,
and even in the case where the target is not known, ligand-based drug discovery tools, such as
quantitative structure-activity relationship (QSAR) analyses, ligand-based PM, molecular field
analysis and 2D or 3D similarity assessment between small molecules can offer insights into the
construction of predictive models fit for lead discovery and optimization (Acharya, Coop et al.
2011). Chapter 3 presents MD-based druggability simulation approaches and their application to
ionotropic glutamate receptors (iGluRs). We consider in particular two families of iGluRs:
AMPA receptors (AMPAR) and NMDA receptors (NMDAR). These simulations use all-atom
models in the presence of explicit water and organic probe molecules. Based on the captured
“druggable” sites and the binding pause of the probes observed in druggability simulations, PMs
are built, which, in turn, are used in virtual screenings for identifying small molecules that
potentially serve as drugs for AMPARs and NMDARs.
Many biological functions rely on protein-protein interactions where the structure and
dynamics of one or both proteins is affected during the course of binding. Therefore, an
understanding of conformational flexibility of target proteins involved in protein-protein
interaction and protein-ligand interaction is very important for structure-based drug design.
Elastic network models (ENM) normal mode analysis (NMA) (Bahar, Atilgan et al. 1997),
rooted in the statistical thermodynamics of polymer networks (Flory, Gordon et al. 1976), are
broadly used to extract those more probable modes, which are near the global free energy
minimum. Identification of these so-called ‘soft modes’ has been considered as a prerequisite for
3
structure-based drug design (Floquet, Marechal et al. 2006). A lot of work has indicated that in
fact those soft modes conform to the structural changes associated with ligand binding and
allosteric transitions demonstrating their relevance to function (Bahar, Lezon et al. 2010, Bahar,
Lezon et al. 2010). Chapter 2 provides an overview of the assumptions and theory underlying
these approaches and their application to leucine transporter (LeuT) and secondary transporters
sharing the LeuT fold.
Drugs are frequently withdrawn from markets and this is mainly due to their side effects
or toxicities. Drug molecules often interact with multiple targets, termed as polypharmacology,
and the off-target interactions can cause adverse side-effects. The philosophy of drug design has
been transformed from ‘one drug, one target’ to ‘one drug, multiple targets’ (Hopkins 2008).
Polypharmacology emerged as the new paradigm of drug discovery (Hopkins 2008) and became
a major focus in recent CADD studies. Polypharmacological phenomena includes: (a) a single
drug acting on multiple targets on a unique disease pathway or (b) a single drug acting on
multiple targets pertaining to multiple diseases’ pathways (Hopkins 2007, Reddy and Zhang
2013). Moreover, polypharmacology for complex disease is likely to employ multiple drugs
acting on distinct targets, that are part of a network regulating various physiological responses
(Hopkins 2007). The aim of polypharmacological approaches is to discover the unknown off-
targets for the existing drugs, a task also known as drug repurposing (Oprea and Mestres 2012).
Chapter 4 provides details on the theory, assumptions and applications of probabilistic matrix
factorization (PMF) method for predicting drug-target associations.
Most of the methods described above are used in the present study for investigating the
structure, dynamics and/or drug-binding properties of the NMDAR and AMPAR families of
proteins and LeuT fold family of proteins. NMDARs and AMPARs play a major role in

4
mediating neurotransmission events in the central nervous system. NMDARs have served as
important drug targets due to their implication in neurodegenerative diseases and neurological
disorders, while the druggability of AMPARs has remained unknown to date. Among LeuT-fold
family proteins, dopamine transporter (DAT) has been an important drug target for drug abuse
and addiction research, among other neurodegenerative disorders. Discovering the structural and
dynamic bases of their function and their ligand-binding properties, and the identification of the
potential drug candidates may potentially provide new insights into developing better novel
therapeutic treatments.
1.1 COMPUTATIONAL METHODS IN MOLECULAR PHARMACOLOGY
Computer-aided drug discovery (CADD) has actively promoted the development of
therapeutically significant small molecules for three decades. As mentioned above, CADD
approaches are broadly classified into two major methods—structure-based methods and ligand-
based methods. Structure-based approaches for drug design include ligand docking, PM and
ligand design, all based on knowledge and/or modeling of the target protein structure, while
ligand-based methods use ligand information only for predicting activity depending on
similarities to already identified active ligands (Sliwoski, Kothiwale et al. 2014). The following
paragraphs introduce the position of CADD in the drug discovery pipeline as well as the use of
virtual screening, MD simulations, and PM in structure-based CADD, since those methods are
used in our study.

5
1.1.1 CADD in the drug discovery pipeline
CADD can achieve a better hit rate of novel drug compounds, compared to traditional high-
throughput screening (HTS) and combinatorial chemistry, due to the usage of more targeted
search. It not only helps to understand the molecular basis of therapeutic activity but also to
predict other possible activities which might improve therapeutic effects. In the drug discovery
process, CADD has been employed for three main goals (Sliwoski, Kothiwale et al. 2014): (1) to
filter large compound libraries into smaller ones which can be tested by experimentalists; (2) to
design a new compound either by adding a functional group on a starting molecule or by putting
chemical fragments together into novel chemotypes; and (3) to optimize lead compounds,
whether to increase their affinity or optimize drug metabolism and pharmacokinetics properties
including their absorption, distribution, metabolism, excretion and potential toxicity (ADMET).
The most common use of CADD is the screening of virtual compound libraries, known as
virtual high-throughput screening (vHTS). This enables researchers to test a series of compounds
and provide a reduced set for further tests. In this way, researchers can identify the same number
of hits while (experimentally) screening less compounds as they skip those less likely
compounds, thereby saving money and time. vHTS was first introduced in 1997 (Horvath 1997)
and it triggered an increasing rate of publications on the applications of vHTS since then
(Ripphausen, Nisius et al. 2010). The largest fraction of hits has been obtained for G-protein-
coupled receptors (GPCRs) followed by kinases (Ripphausen, Nisius et al. 2010).
vHTS has several components, such as compounds selection by predicted biological
activity through QSAR models or PM, chemical similarity searches and structure-based docking
(Enyedy and Egan 2008). All those methods can rank hits from the screened virtual compound
library. The ranking reflects the property of the compounds, such as the percentage of similarity

6
to a query compound or the predicted biological activity or in the case of docking, an estimate of
the relative binding affinity (often expressed as scores) for each compound bound to the targeted
protein (Joffe 1991).
There is a substantial cost benefit in the utilization of computational tools during the lead
optimization phase of drug development. The cost for developing a new drug ranges from 400
million to 2 billion USD and the synthesis and test of lead analogs contribute a large proportion
of the sum (Basak 2012). As a result, it is significant and beneficial to use computational
methods in hit-to-lead optimization to cover a wider chemical space while dramatically
decreasing the number of compounds that must be tested or synthesized in vitro (Sliwoski,
Kothiwale et al. 2014). Optimization of a hit compound computationally includes a structure-
based analysis of docking poses or energy profiles for hit analogs, ligand-based screening for
compounds with similar chemical structure and properties or improved enhanced biological
activity and prediction of biologically preferred ADMET properties. The comparably low cost of
CADD, compared to chemical synthesis and biological characterization of compounds, makes it
popular as a tool for generating more focused, reduced and diversified set of compounds in the
the chemical space that is explored (Enyedy and Egan 2008).
1.1.2 Use of MD simulations in CADD
Molecular dynamics (MD) simulation can be used for binding site detection and characterization.
The dynamics of proteins make it inappropriate to predict binding site using a single static
structure. Several conformations are used to account for the conformational dynamics of a
protein. Conventional MD can capture an ensemble of protein conformations starting with a
single structure. MD simulations use classical Newtonian physics principles to compute a

7
trajectory of conformations of a target as a function of time. The trajectory is computed for a
given number of atoms in small time steps, usually 1-10 fs (van Gunsteren and Berendsen 1990).
Molecules simulated in classic MD approaches have a tendency of being trapped in local energy
minima. To overcome this, some advanced MD algorithms including targeted-MD (Schlitter,
Engels et al. 1994), SWARM-MD (Huber and van Gunsteren 1998), conformational flooding
simulations (Grubmüller 1995), temperature accelerated MD simulations (Abrams and Vanden-
Eijnden 2010) and replica exchange MD (Sugita and Okamoto 1999) have been introduced. In
general, these methods permit us to jump over multiple minima on the energy surface of
proteins, thus allowing for a more complete sampling of the conformational space. One example
of success of MD simulations is the identification of a novel binding trench in HIV integrase,
which led to the development of raltegravir, a drug used to treat HIV infection. The MD
simulation of the inhibitor of the same protein, 5CITEP, captured a novel binding trench which
was not detected with a static structure previously (Schames, Henchman et al. 2004). After the
discovery, Merck developed the antiretroviral drug raltegravir (Summa, Petrocchi et al. 2008).
A major limitation in MD simulations is the time scale that can be explored, usually
limited to nanoseconds-to-microseconds. More recently, the timescale has been extended to
milliseconds (for small proteins) with the development of the special purpose machine Anton
(Shaw, Deneroff et al. 2008). Such long simulations now provide more accurate visualization of
drug binding events to their targets (Shan, Kim et al. 2011). Anton has been used successfully for
full atomic resolution protein folding (Lindorff-Larsen, Piana et al. 2011). Advances in computer
technology mean that protein flexibility can be accessed more efficiently, which may allow us to
have a better understanding and descriptions of the effect of protein dynamics in biological
function.
8
1.1.3 Pharmacophore modeling (PM) in CADD
A PM of the target binding site summarizes electronic and steric features required for optimal
interaction of a ligand with a target (Sliwoski, Kothiwale et al. 2014). The typical properties that
define a PM are hydrogen bond acceptors or donors, basic or acidic groups, partial charges,
aliphatic hydrophobic moieties and aromatic hydrophobic moieties. Pharmacophore features
have been widely used in lead optimization, virtual screening and de novo drug design (Yang
2010). A PM for a target binding site can be used to virtually screen a compound library like
DrugBank containing all FDA-approved drugs, or STITCH database that contains information in
small molecules/ligands characterized to date. In addition to interrogate such databases for
filtering the inactive compounds, PM can be used to refine drug design.
Structure-based PM approaches are usually developed upon analyzing the target binding
site or target-ligand complex structure (Sliwoski, Kothiwale et al. 2014). For instance,
LigandScout (Wolber and Langer 2005) use protein-ligand complex data to map interactions
between ligands and targets. Usually, there is an empirical scoring algorithm, which includes
terms to account for van der Waals interactions, metal-ligand bonding, hydrogen bonding and
desolvation effects (Wang, Liu et al. 1998) and the algorithm can automatically develop a PM
from target-ligand complex.A successful application is that of Brvar et al. (Brvar, Perdih et al.
2010) who used a PM to identify novel inhibitors of bacterial DNA gyrase B, a target for
antibacterial drugs. A PM learned from LigandScount was utilized to screen the ZINC database,
which produced a novel class of thiazole-based inhibitors with IC50 value of 25 uM.
9
1.2 COMPUTATIONAL METHODS IN SYSTEMS PHARMACOLOGY
Systems biology approaches have long been used in pharmacology to understand drug action.
The application of computational and experimental systems biology methods allows us to extend
the definition of systems pharmacology (Zou, Zheng et al. 2013), which provides a field of study
that provides us with a comprehensive view of drug action in humans. Systems pharmacology is
rooted in molecular interactions between drugs and their targets in the cell, and includes network
analyses at multiple scales of biological organization to explain both therapeutic and adverse
effects of drugs (Zhao and Iyengar 2012). In the long run, advances in systems biology will assist
in the development of new drugs and more effective therapies for patients. Systems biology
approaches make contributions to several clinically driven applications in drug discovery. Here,
we introduce five recent advances and major applications in this area: (1) analysis of drug-target
networks, (2) prediction of drug-target interactions, (3) predictions of drug combination, (4) drug
repurposing, (5) exploration of the side effects of drugs (Zou, Zheng et al. 2013).
1.2.1 Drug-target networks
Quantitative analysis of drug-target networks systematically helps disclose the patterns of
interactions between drugs and targets. Drugs usually bind multiple rather than single molecular
targets, a phenomenon known as polypharmacology (Hopkins 2007). Quantitative topological
analyses of drug-target networks show an overabundance of ‘follow-up’ drugs, that is to say
drugs target those proteins already targeted by other drugs (Zou, Zheng et al. 2013). Thus, many
proteins are targeted by more than one drug, although those drugs have distinct chemical
structures. These observations have significant implications for drug discovery and will lay the

10
ground for future CADD work. While single-target approach remains the main strategy
currently, a large body of work has been done to facilitate the development of ‘promiscuous
drugs’ which can bind multiple targets.
Integration of systems biology and polypharmacology offers the opportunities to expand
current technologies to improve clinical efficacy and decrease adverse effects and toxicity of
drugs. Advances in these fields are forming the foundation of the next paradigm in drug
discovery, that is ‘network pharmacology’ (Hopkins 2008). Along these lines, Keiser et al.
related receptors to each other quantitatively based on the chemical similarities between the
ligands that they are interacting with. They have shown that targets without significant sequence
or structure similarity are still linked quantitatively based on their bioactive ligands that they
share (Keiser, Roth et al. 2007). This type of link between drugs and targets can be used to
predict their biological function. Moreover, another computational framework developed by Li et
al. can be used to build disease-specific drug-protein network and help study molecular signature
differences between different classes of drugs under different diseases conditions (Li, Zhu et al.
2009).
1.2.2 Predictions of drug-target interactions
Since the observation of drug polypharmacology, this concept has motivated a large number of
studies to predict and characterize drug- target associations (Oprea, Tropsha et al. 2007, Siegel
and Vieth 2007, Bajorath 2008, Newman 2008, Miller, Dunham et al. 2009, Walsh and
Fischbach 2009). Some groups have employed phenotypic and chemical similarities among
molecules to identify those interacting with multiple targets (Wagner, Kitami et al. 2008, Young,
Bender et al. 2008), and early drug candidates have been screened against molecular target

11
panels (Krejsa, Horvath et al. 2003). To identify new targets for known drugs, Campillos et al.
looked for side-effects shared between two molecules and applied to marketed drugs (Campillos,
Kuhn et al. 2008). Several new drug-drug relations have emerged between chemically dissimilar
drugs having different therapeutic indications, implying that they are involved in new drug-target
associations (Paolini, Shapland et al. 2006).
Unlike conventional approaches based on sequence or structural similarity between
targets, Shoichet, Roth and coworkers developed a computational tool that predicts the
pharmacological profile of drugs (Keiser, Setola et al. 2009). They introduced the ‘similarity
ensemble approach’ (SEA) which defines each target by its set of known ligands, searches for
drugs with chemical structure similar to the known ligands, and then eventually predicts new
drug-target interactions. To integrate side-effect and pharmacogenomics similarities, Takarabe et
al. made a comprehensive prediction and pointed to some potential drug-target associations that
were not identified by previous methods (Takarabe, Kotera et al. 2012). In addition, it is shown
by Cheng et al. that network-based inference methods perform best on predicting drug-target
interactions after comparison of three supervised inference approaches (Cheng, Liu et al. 2012).
In this regard, the important role of machine learning approaches such as active learning has
been highlighted (Murphy 2011). The application of probabilistic matrix factorization (PMF), a
widely used machine learning method, to the prediction of drug-target interactions will be
discussed in details in Chapter 4.
1.2.3 Predictions of drug combinations
In recent years, combination therapies were shown to be more beneficial to patients than using a
single drug (Jia, Zhu et al. 2009). Systems biology approaches have been used to describe and

12
predict potential drug combinations (Fitzgerald, Schoeberl et al. 2006). Dynamical modeling has
already been used to simulate the effect of drug combinations and generate testable intervention
methods experimentally (Iadevaia, Lu et al. 2010, Zou, Luo et al. 2011). However, due to lack of
knowledge on the kinetics of biochemical reactions, these dynamic models are currently
restricted to small scales. Given that target information is usually accessible, the combined effect
of drugs on specific targets may be assessed by analyzing the interaction pattern of targets using
a network perspective (Zou, Ji et al. 2012). Lee et al. showed that how the progressive rewiring
of oncogenic signaling networks over time following EGFR inhibition makes breast tumors
vulnerable to a second and later hit with DNA-damaging drugs, indicating that time- and order-
dependent drug combinations might be more effective in killing cancer cells (Lee, Ye et al.
2012). Lehar et al. used large-scale simulations of bacterial metabolism to simulate the inhibitory
effects of drug combinations and gave evidence that synergistic combinations are in general
more specific to particular cellular phenotypes than are to single agents (Lehar, Krueger et al.
2009). Kwong et al. investigated a gated signaling model that provides a new framework to find
synergistic drug combinations for melanoma (Kwong, Costello et al. 2012)
1.2.4 Drug repurposing
Drug repurposing, also called drug repositioning, one of the alternatives for drug discovery, is to
explore new therapeutic applications for known drugs. The essential advantage for drug
repurposing is that it can dramatically reduce the risks of drug development and promote
repurposed drugs to advance to clinical phase more rapidly. For example, Iorio et al. developed a
method that uses the similarities in the molecular activity signatures of all drugs so as to
calculate pair-wise similarities between drugs in their drug mode and in their effects (Iorio,

13
Bosotti et al. 2010). Drugs were organized into a network based on the resulting similarity
scores. Then, drugs were separated into groups of interconnected nodes (i.e., communities) using
network theory. Those compounds with similar mode of action were grouped into same
communities, which usually shared the same targets and pathways. By this method, drug
repurposing shows its importance in collocating drugs within network communities, which
identifies a shared molecular activity with other drugs in the same drug communities. Moreover,
some systems biology methods based on genomics have been published, which aim at drug
repurposing (Sirota, Dudley et al. 2011, Jin, Fu et al. 2012). Iskar et al. found a large set of drug-
induced transcriptional modules from genome-wide microarray data of drug-treated human cell
lines (Iskar, Zeller et al. 2013). Those identified modules show the conservation of
transcriptional activities in response to drugs, which provides a hint for drug repurposing.
Gottlieb et al. developed ‘PREDICT’ algorithm that could deal with both novel compounds and
approved drugs (Gottlieb, Stein et al. 2011). This new approach is based on the assumption that
similar drugs are involved in similar diseases, and uses the chemical similarity of drugs as well
as disease-disease similarity measures for predicting novel drug indications.
1.2.5 Exploring the side effects of drugs
One of the major challenges for drug discovery is to predict the toxicity and side-effects of drugs
in the early stage of drug development pipeline. Assessment of drug candidates can dramatically
change when integrating biological data and systems biology methods. Lounkine et al. utilized a
similarity ensemble approach, which computes whether a drug will bind to a target or not based
on the chemical properties it shares with existing ligands, and predicted the activity of marketed
drugs on unintended ‘side-effect’ targets (Lounkine, Keiser et al. 2012). Around half of their

14
predictions were validated by experiments and a correlation metric was developed to give more
weight to those new off-targets that explained side effects of a certain drug better than any
known existing target of the drug. Recently, Kuhn et al. have performed a large scale analysis to
systematically predict and identify proteins that are implicated in drug side effects (Kuhn, Al
Banchaabouchi et al. 2013). Clinical phenotypic data and existing drug-target interactions were
integrated to find overrepresented protein side effect associations. They demonstrated that some
individual proteins are responsible for regulating most of complex side effects. Yang et al. have
developed a computational chemical-protein interactome, which mimics the interactions between
drugs known to cause at least one type of severe side effect and a group of human proteins
(Yang, Chen et al. 2009). They pointed out that those drugs that share similarities in their
chemical-protein interactome profiles also share side-effects. Through exploration of the
associations between drugs and off-targets, they also elucidated the molecular basis of several
adverse events. There are other researches who adopted integrated systems biology and structural
or chemoinformatics analyses, which proved to predict drug adverse effects (Chang, Xie et al.
2010, Chen, Lu et al. 2013).

15
2.0 ELASTIC NETWORK MODELS: THEORY AND APPLICATION TO LEUCINE
TRANSPORTER
Proteins have the ability to go through a distribution of collective changes in conformation, or
modes of motions at their equilibrium or native state, which accommodate their function (Bahar,
Chennubhotla et al. 2007). Coarse-grained methods have been widely used in capturing those
collective movements. Particularly, after the studies performed by Bahar and coworkers (Bahar,
Atilgan et al. 1997, Haliloglu, Bahar et al. 1997) and Hinsen (Hinsen 1998), ENMs have been
broadly used in association with normal mode analysis (NMA) and revealed that network models
can capture global modes. The wide use of ENMs results from their three major advantages:
simplicity, robustness of predicted modes of motions in the low frequency regime (the softest
modes), and functional significance of these modes, as indicated by a large number of
applications (Bahar, Lezon et al. 2009).
In this chapter, we describe the general theory and methods of ENMs, especially the
Anisotropic Network Model (ANM), along with its application toward understanding the specific
features and structural dynamics of leucine transporter (LeuT). Also, we compare the
conformation sampling ability of ANM and MD simulations for LeuT.
16
2.1 ELASTIC NETWORK MODELS
2.1.1 Theory and methods
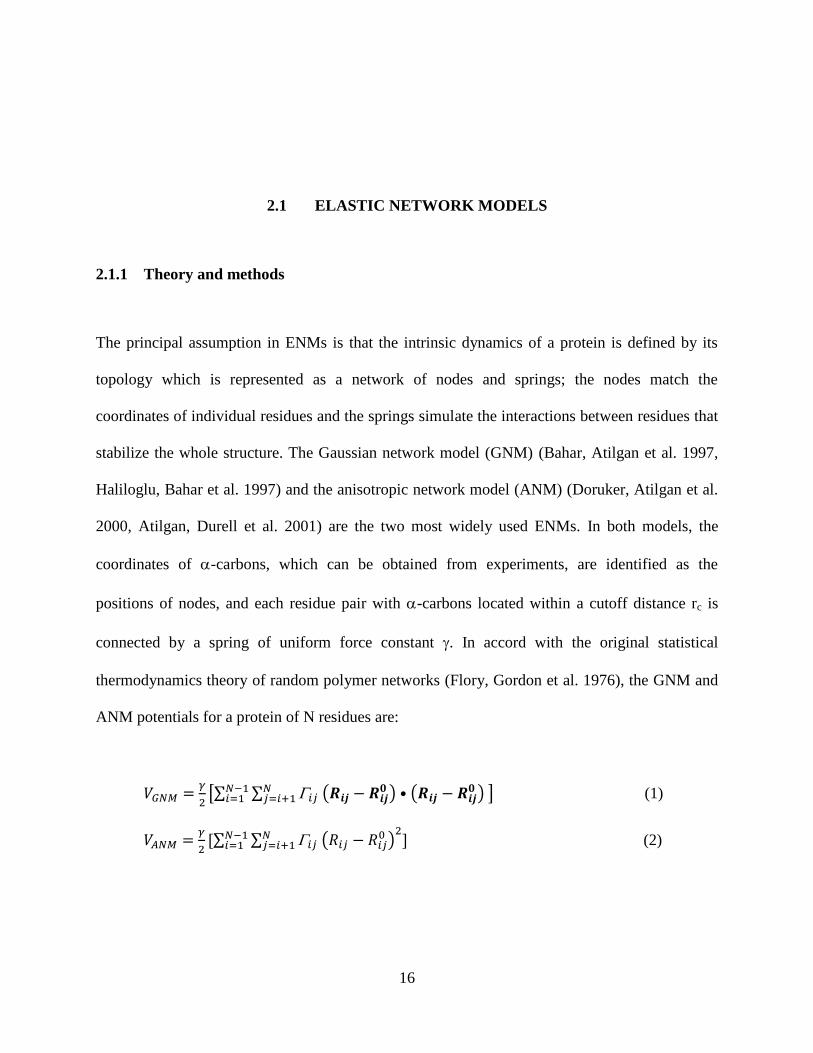
The principal assumption in ENMs is that the intrinsic dynamics of a protein is defined by its
topology which is represented as a network of nodes and springs; the nodes match the
coordinates of individual residues and the springs simulate the interactions between residues that
stabilize the whole structure. The Gaussian network model (GNM) (Bahar, Atilgan et al. 1997,
Haliloglu, Bahar et al. 1997) and the anisotropic network model (ANM) (Doruker, Atilgan et al.
2000, Atilgan, Durell et al. 2001) are the two most widely used ENMs. In both models, the
coordinates of -carbons, which can be obtained from experiments, are identified as the
positions of nodes, and each residue pair with -carbons located within a cutoff distance rc is
connected by a spring of uniform force constant . In accord with the original statistical
thermodynamics theory of random polymer networks (Flory, Gordon et al. 1976), the GNM and
ANM potentials for a protein of N residues are:
[∑ ∑ (
) ( )
] (1)
∑ ∑ (
)
(2)

17
where • designates the dot product, and are the instantaneous and native state distance
vectors between residues i and j, are their magnitudes and is ijth element of the
Kirchhoff matrix equal to -1, if < rc , otherwise it equals to zero. Thus, the major difference
between GNM and ANM is that GNM potential is contributed by both distance and orientation
changes while ANM potential is only based on distance changes. Hinsen et al. was the first to
propose a coarse-grained harmonic potential for all residue pairs, by using a distance dependent
force constant (Hinsen 1998) while the use of uniform force constant accounts for specific and
nonspecific interactions as the same. Modifications of ANM with more elaborate force constants
have revealed a subtle improvement in the prediction accuracy (Yang, Song et al. 2009), such as
negative exponents (Yang, Song et al. 2009) or an exponential decay function (Hinsen 1998).
Recently, Bahar et al. suggested that the next level of optimization of ENM lies in the
incorporation of secondary structure dependent force constant (Lezon and Bahar 2010).
2.1.2 ANM-based evaluation of global modes of motion
Previous studies have validated that the global modes of biomolecules are dominantly defined by
the overall shape of the biomolecule or inter-residue contact distribution regardless of the
detailed structure and energetics (Tirion 1996, Ma 2005). The most important point is that, in
many studies, these global modes have been shown to be associated with functional motions
(Bahar, Chennubhotla et al. 2007, Yang and Chng 2008), and thus it is essential to identify them
computationally, and ANM is one of those methods to achieve this goal effectively (Eyal, Yang
et al. 2006).

18
ANM modes are computed based on eigenvalue decomposition of the Hessian matrix
(H). H is the matrix of the second derivatives of VANM with respect to residue position.
Eigenvalue decomposition of H yields 3N-6 eigenvectors. For instance, the kth eigenvector, uk =
(ux1, uy1,uz1,…uzN)kT, also called ANM mode k, describes the normalized displacements of N
residues in the x, y and z directions as driven by mode k. It defines the normal coordinate along
which the structure moves as residues moves along ANM mode k. Also, k, the corresponding
eigenvalue measures the frequency of that mode and also provides information on the shape of
the protein subject to that VANM . The obtain the displacement of all residue positions along mode
k, we use the equation below (Xu, Tobi et al. 2003) :
(3)
Where is a constant and it is a product size scaling factor, Boltzmann constant (kB) and absolute
temperature (T). is the initial conformation. With different values of , we can generate an
ensemble of conformations along mode k.

19
2.2 LEUCINE TRANSPORTER: A MODEL SYSTEM FOR EXPLORING SODIUM-
COUPLED NEUROTRANSMITTER TRANSPORT
Neurotransmitter symporters are integral membrane proteins which are ion-coupled transporters:
they can drive the uphill uptake of chemical transmitter from neural synapse and terminate
neurotransmission mediated by dopamine, serotonin, noradrenaline, glycine and
GABA(Krishnamurthy and Gouaux 2012). LeuT is a bacterial homologue the crystal structure of
which has offered valuable insights into the mechanism of function of mammalian
neurotransmitter transporters. So far, there are 50 available crystal structures of LeuT fold
family members, in distinct conformations such as outward-open, inward-open, outward
occluded, competitive and non-competitive bound states, which have revealed a mechanistic
framework for the transport and transport inhibition of neurotransmitter. The paragraphs below
describe the current understanding of mechanistic and pharmacological properties of these
mammalian neurotransmitter sodium symporters (NSSs) gained from the structures of LeuT.
2.2.1 Structure of LeuT
LeuT is composed of 12 transmembrane helices. The first 10 helices are correlated by an
inverted symmetry topology: helices 1 to 5 and helices 6 to 10 are related by a pseudo two-fold
axis of symmetry (Yamashita, Singh et al. 2005) (Figure 1). This structure indicates a
relationship with the molecular organization of solute carrier 6 (SLC6) transporters. Helices1 and

20
6 have discontinuous parts with loops connecting their portions ‘a’ and ‘b’. The regions where
the helices are broken harbor the ions and substrate binding sites (Figure 1). The substrate,
leucine, binds a binding pocket that is occluded from extracellular solvent upon closure of the
gating residue F253 (on TM6a). The two sodium ion binding sites are located in the close
neighborhood of the substrate binding site (Yamashita, Singh et al. 2005).
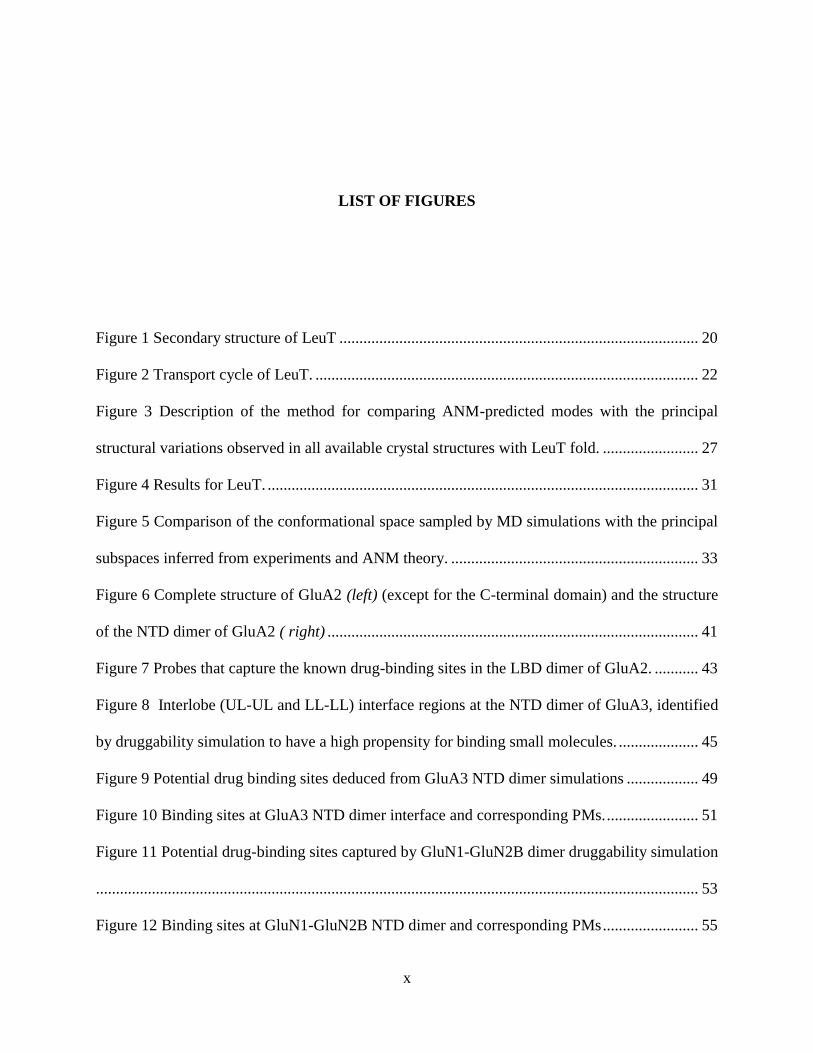
Figure 1 Secondary structure of LeuT
The positions of leucines (L; red star) and two sodium ions (blue ellipses) are depicted in the topological diagram of the
LeuT. The structure contains 12 transmembrane helices. EL2, EL3 and EL4a-b are extracellular loops. The diagram also
shows the intracellular loops IL1 and IL5.

21
Though LeuT shares structural similarities with mammalian NSS family members, the
amino acid transport by LeuT is not chloride dependent, which is different from NSS members
that require both sodium and chloride for effective transport (Yamashita, Singh et al. 2005).
Forrest et al. suggested the importance of LeuT for the identification of a potential chloride site
through homology modeling and site-directed mutagenesis on mammalian serotonin transporter
and stated that chloride binds in a pocket close to sodium site 1 (Na1) with residues in TM7
involved in anion coordination, and E290 in LeuT being a key site for chloride conductance
(Forrest, Tavoulari et al. 2007). A recent report by Kantcheva et al. validated this site
(Kantcheva, Quick et al. 2013).
2.2.2 Transport cycle and alternating access in LeuT
For a comprehensive understanding of LeuT transport cycle, structural data for the major LeuT
intermediate states are required. The current available crystal structures are in the outward open,
outward-occluded and inward-open states; and there is no available crystal structure for inward-
occluded state. To offer a complete picture of the transport cycle, we generated the inward-
occluded state structure obtained from MD simulation.
LeuT has a group of nearly invariant helices constructing the ‘scaffold’ domain (TM3, 4,
8 and 9) and a group of helices which undergo relatively large movement acting as the ‘core’
domain (TMs 1, 2, 6 and 7) (Yamashita, Singh et al. 2005, Forrest, Zhang et al. 2008). In order
to stabilize the conformations of the outward-open and inward-open states (both are substrate-
free) when obtaining their crystal structure, the Gouaux laboratory mutated specific residues and
used specific antibodies (Krishnamurthy and Gouaux 2012).

22
Figure 2 illustrates the series of structures visited during the LeuT transport cycle,
starting from the outward-open conformation (Figure 2A). TM1b and TM6a are released
allowing them to move outward due to the mutation (Y108F) which weakens then substrate
binding (Krishnamurthy and Gouaux 2012). We can see that the extracellular gate (labelled in
blue circle) is open and the binding site for leucine is exposed for substrate binding. The
intracellular gate is closed, which requires Na+ binding to stabilize intracellular closed
conformation, as confirmed by single- molecule FRET studies as well (Zhao, Terry et al. 2010).
Figure 2 Transport cycle of LeuT.
A. outward-open (substrate-free) state (red, PDB ID: 3TT1), B. outward-occluded (substrate-
bound) (blue, PDB ID: 2A65), C. inward-occluded (substrate bound) (yellow, note: this
conformer is obtained from simulations as the structure is not experimentally available yet. ) D.
inward-open (substrate free) (magenta, PDB ID : 3TT3), E. Competitive-inhibitor Trp bound
outward-open (pink, PDB ID : 3F3A), F. Non-competitive inhibitor TCA bound outward-
occluded. (cyan, PDB ID :2Q6H)

23
Thus,the outward-open state is substrate-free but Na+-bound. Once binding leucine, LeuT
changes conformation into the outward-occluded conformation (Figure 2B) where the
extracellular gate is closed. Then, the outward-occluded conformation transits to the inward-
occluded state, the crystal structure of which is not available for far. Finally, the inward-occluded
state opens its intracellular gate with leucine and Na+ released, it reconfigures into the inward-
open substrate-free state as a consequence of large hinge-like movements within the core domain
relative to the scaffold domain, and shifts in extracellular loops (Krishnamurthy and Gouaux
2012). The most notable change includes TM1a tilting by 45 degree from its position in the
closed state as shown in Figure 2D.
Generally, during the LeuT transport cycle, local hinge like bending of helices are coupled
to the formation and disruption of substrate- and sodium-binding sites, which are translated by
almost rigid-body motion of other helices and loops and thereby opening and closing the
extracellular and intracellular gates (Krishnamurthy and Gouaux 2012).
Previous structural and biophysical studies supported the alternating access mechanism in
neurotransmitter transporter (Forrest, Zhang et al. 2008). Accordingly, the membrane proteins’
binding site is accessible to only one side of membrane upon opening and closing intracellular
and extracellular gates, alternatively (Penmatsa and Gouaux 2014). Shimamura et al. found that
in Mhp1, which is another LeuT-fold protein, outward-open and inward-open states are created
by rigid helical movements, where four helices move against a rigid core to provide access to the
substrate in either side of the transporter (Shimamura, Weyand et al. 2010). Also, Perez et al.
showed that BetP transports the osmolyte betaine involving helical elements that works as a
rigid-bodies coupled with small conformational changes (Perez, Koshy et al. 2012). In LeuT,
TM1a moves as much as 45 degree (Figure 2D), but it has a minimal movement of 18 degree in

24
BetP (Perez, Koshy et al. 2012). To validate the large-scale changes in the position of TM1a in
LeuT, single molecule FRET studies have been performed, which confirmed that displacements
of TM1a are associated with the release of substrate (Zhao, Terry et al. 2011).
2.2.3 Pharmacological properties of LeuT
Neurotransmitter sodium-coupled symporters (NSSs) regulate endogenous neurotransmitter
concentrations and are targets for a wide range of therapeutic agents including selective
serotonin reuptake inhibitors (SSRIs), serotonin-noradrenaline reuptake inhibitors and tricyclic
antidepressants (TCAs) (Wang, Goehring et al. 2013), which are used to treat depression, ADHD
and fibromyalgia as a few examples. Therefore, LeuT has been used to examine the structure of
the complexes NSSs form with antidepressant drugs. TCAs, such as clomipramine binds with
weak affinity a site in the extracellular vestibule of LeuT (Singh, Yamashita et al. 2007),
consistent with their observation that TCAs are non-competitive inhibitors of transport in LeuT
(Figure 2F). In the presence of bound-TCA, LeuT is locked in an occluded state. Although
TCAs and SSRIs are non-competitive inhibitors for LeuT-coupled transport, they do not
necessarily represent how antidepressants act on mammalian NSSs. Many studies indicate that
anti-depressants inhibit biogenic amine transport by competitive binding (Henry, Field et al.
2006, Andersen, Stuhr-Hansen et al. 2011).
To illustrate the mechanism of competitive inhibition, Singh et al. tested different amino
acids and eventually found that tryptophan (Trp) inhibited LeuT transport competitively and
stabilized LeuT in the outward-open state (Figure 2E), while other amino acids like Ala, Gly and
Met stabilized an occluded state through competitive inhibition (Singh, Piscitelli et al. 2008).
Furthermore, in order to make LeuT behave like the human biogenic amine transporters, the

25
Gouaux group mutated some key residues in LeuT, and TCAs and SSRIs were found to inhibit
this specifically mutated LeuT competitively and trap it in the outward open state as what Trp
does for LeuT (Wang, Goehring et al. 2013). Their studies define common and simple principles
for the action of SSRIs and TCAs on human biogenic amine transporters. In addition, using
LeuT as a molecular model, Kristensen et al. modified residues lining the binding pocket in
TM1, 3, 6, 8 and 9 in the noradrenaline transporter (NET), and identified the highly binding
affinity shift of NET from talopram to citalopram which is a highly specific and most selective
SERT inhibitor (Andersen, Stuhr-Hansen et al. 2011). All those studies highlight the role that
LeuT plays as a template to model the structures of human neurotransmitter transporters.
26
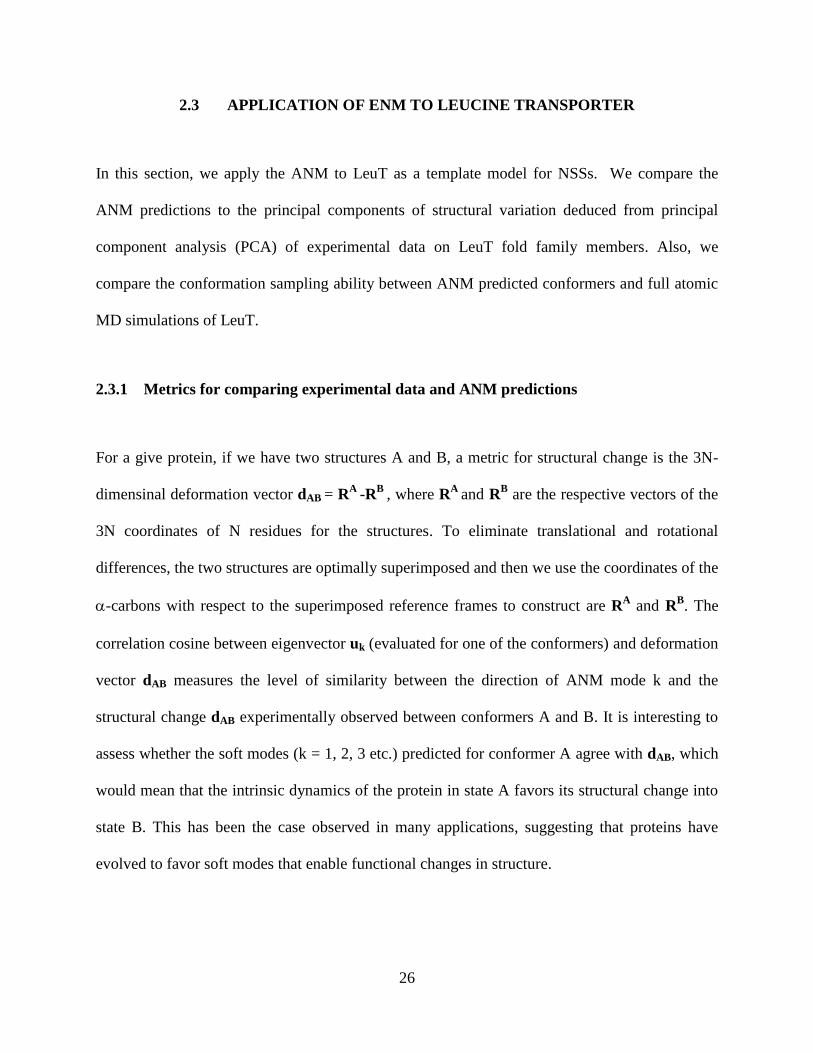
2.3 APPLICATION OF ENM TO LEUCINE TRANSPORTER
In this section, we apply the ANM to LeuT as a template model for NSSs. We compare the
ANM predictions to the principal components of structural variation deduced from principal
component analysis (PCA) of experimental data on LeuT fold family members. Also, we
compare the conformation sampling ability between ANM predicted conformers and full atomic
MD simulations of LeuT.
2.3.1 Metrics for comparing experimental data and ANM predictions
For a give protein, if we have two structures A and B, a metric for structural change is the 3N-
dimensinal deformation vector dAB = RA
-RB
, where RA
and RB are the respective vectors of the
3N coordinates of N residues for the structures. To eliminate translational and rotational
differences, the two structures are optimally superimposed and then we use the coordinates of the
-carbons with respect to the superimposed reference frames to construct are RA and R
B. The
correlation cosine between eigenvector uk (evaluated for one of the conformers) and deformation
vector dAB measures the level of similarity between the direction of ANM mode k and the
structural change dAB experimentally observed between conformers A and B. It is interesting to
assess whether the soft modes (k = 1, 2, 3 etc.) predicted for conformer A agree with dAB, which
would mean that the intrinsic dynamics of the protein in state A favors its structural change into
state B. This has been the case observed in many applications, suggesting that proteins have
evolved to favor soft modes that enable functional changes in structure.

27
Figure 3 Description of the method for comparing ANM-predicted modes with the principal structural
variations observed in all available crystal structures with LeuT fold.
(A) Superposition of the ensemble of 50 available crystal structures that are structurally homologous to LeuT.
(B) Projection of the structures on the top 2 PCs. (C) Structural changes along the top three PCA modes (D)
ANM representation of LeuT (E) Structural variations along the softest three ANM modes. (F) Overlap between
top 6 ANM and PCA modes.

28
For a number of protein targets, there is a large ensemble of structures available in the Protein
Data Bank (PDB). For LeuT fold family members, there are currently 50 crystal structures
available in PDB (Figure 3A). Bakan and Bahar showed that a principal component analysis
(PCA) of the structures can be performed to extract principal modes of structural changes based
on experimental data, which, then, may be compared to the softest modes predicted by ANM
(Bakan and Bahar 2009), as outlined in Figure 3. The PCA of the ensemble of experimentally
resolved structures, requires the evaluation of a 3Nx3N covariance matrix, C, defined as
C = < > =
∑ ) ) ,
where m is the number of structures in the ensemble and is the deviation of conformation A
away from the ensemble average <R>. After eigenvalue decomposition of C, C = ∑
we get the principal components of structural variations (eigenvectors) and the corresponding
variances (eigenvalues) n. Among those eigenvalues, 1 is the largest variance and the
corresponding principal vector describes the displacement along this largest variance mode,
also called PCA1 or PC1. Obviously, contributes the most to the average root-mean-square
deviations <RMSD> between structures.
The ensemble of structures can be projected onto those top PCs defined space. Thus, each
structure A or B can be represented by a point in the space spanned by the PCs. The points in
Figure 3B represent such an ensemble of structures (50 of them in the case of LeuT) mapped into
the subspace spanned by PC1 and PC2. We can see that the three different states, outward-open
(red; 15 structures), outward-occluded (blue; 34 structures) and inward-open (purple; 1

29
structure), are clearly separated into three distinctive clusters. Compared to PC2, there is a
broader dispersion along PC1.
Conceptually, ANM modes are similar to PCA modes. ANM modes are based on the
(theoretical) Hessian matrix, H, while PCA modes are based on the (experimental) covariance
matrix C, and by definition, C is the inverse of Hessian. For PCA, the input is the ensemble of
those experimentally resolved structures while in ANM, the native contact topology of a single
known structure is the only input used to construct H. Thus, if the ensembles agrees completely
with the ANM predicted displacement in structure, k =
, and uk = pk for all k. However, this is
not possible in reality because the experimentally resolved structures do not necessarily sample
all accessible structures, and also ANM is a coarse-grained model which provides an estimate of
the collective movements intrinsically defined by the protein structural topology. As a result,
only the top-ranking modes (the largest variance PCs and softest or lowest frequency ANM
modes) are taken into account and the overlap between them is examined. Figure 3F shows the
overlap between the top 6 PCs and ANM modes. We can see that ANM mode 2 and PC1 exhibit
a high overlap value. These two modes will be analyzed further in the following. This type of
comparison enables us to identify the ANM and PCA modes that are the counterpart of each
other, confirmed both experimentally and computationally, thus providing robust information on
the collective change in structure accessible to the examined family of proteins.

30
2.3.2 Comparison of ANM soft modes with PC modes derived from experiments
In previous session, we identified that PC1 and ANM2 show the highest overlap. We projected
the ensemble of LeuT structures onto those two directions for further analysis. The residue
motions represented by PC1 (red arrow) and ANM2 (green arrow) are shown in Figure 4C and
individual fluctuations for those two models can be viewed in Figure 4A as well. The reference
ANM structure is the first resolved LeuT crystal structure (2A65) and it is in leucine-bound
outward-occluded state. Both PC1 and ANM2 capture the dramatic movement of TM1b and
TM6a. These two helical segments form the flexible core domain, and in consistency with the
studies performed by Gouaux et al. TM1b,TM2 and TM6a shift away from leucine-bound
outward-occlued state to leucine-free outward-open state (Krishnamurthy and Gouaux 2012). In
addition, the extracellular and cytoplasmic entries, has been suggested by Gouaux et al., to
expand upon movement of surface-exposed elements, including intracellular loop1 (IL1),
extracellular loop 2 (EL2) and extracellular loop 4 (EL4) (Yamashita, Singh et al. 2005). Indeed,
previous work showed that both EL2 and EL4 participate in the conformational changes during
neurotransmitter transport by NET and SERT (Stephan, Chen et al. 1997, Smicun, Campbell et
al. 1999). Both PC1 and ANM2 capture the movement of EL2, and PC1 further captures EL4
displacement which is the largest movement along PC1.
Then, the level of correlation between the projections of the structures onto these two
collective displacement directions was examined. As shown in Figure 4B, the structures perfectly
align along these two axes (correlation coefficient of 0.99), indicating the equivalence of the
predicted ANM2 and experimentally observed (PC1) global modes. The figure also shows that
the structures resolved to date are essentially conformers with different levels of deformation
along this combined PC1/PC2 axis, apart from minor local fluctuations.

31
Figure 4 Results for LeuT.
(A) Comparison of the weighted sum of square displacements along PC1 with this predicted along ANM2 mode. (B) Projection of
the 50 crystal structures of LeuT onto PC1 and ANM2. (C) Structural variations along PC1 and ANM2.
100 200 400 300 500
r = 0.99
EL2
TM1b
EL4
TM3 TM1a
C
TM6a
Red: PC1 Green: ANM2
A
B

32
2.3.3 Comparison of ANM-predicted conformers with the conformations sampled in MD
simulations
We examined the correlation between ANM2 mode and PC1 derived from MD trajectories
generated for LeuT. These simulations permitted us to sample all the possible states visited
during the LeuT cycle (Figure 2). As shown in Figure 5A, the ANM2 mode and PC1 have a high
correlation of 0.96. In addition, we compared MD simulations’ conformers with experimentally
resolved structures, and the correlation between ANM2 and PC1 was still high. Their correlation
dropped a little to 0.91 (Figure 5B).
Then, we tested the sampling ability of MD simulations, in comparison to the predictions
of ANM. First we compared how the 1st essential mode obtained from simulations compare with
ANM mode 2 (Figure 5A), which led to a good correlation (of 0.96). We then projected ANM
predicted conformations (green dots) and MD simulation snapshots (yellow dots) onto the
subspace spanned by the top two PCs, PC1 and PC2, derived from experimentally resolved
structures. The ANM sampled conformations showed close overlap with the experimentally
resolved structures especially in the outward-open occluded states (Figure 5C) while MD
simulation conformations tend to drift away from experimental structures though some of them
were close to the outward-facing open structures (Figure 5D).

33
MD simulation conformations
r = 0.96 r = 0.91
A
D C
B
Figure 5 Comparison of the conformational space sampled by MD simulations with the principal subspaces inferred
from experiments and ANM theory.
(A) Projection of MD snapshots onto ANM2 and the 1st essential mode derived from MD. (B) Projection MD simulation
conformations and experimental structures onto PC1 and ANM2. (C) Projection of ANM predicted conformations on top two PCs
derived from experiments. (D) projection of MD simulation conformations on top two PCs

34
2.4 CONCLUSION AND FUTURE WORK
From our results, we can see that both PCA modes and ANM modes capture the conformational
flexibility of LeuT, consistent with experimental studies. Also, there is strong correlation (0.99)
between ANM2 and PC1 based on the experimental structures (Figure 4C). In addition, the
correlation is still high, though dropped slightly, based on MD conformations (0.96) (Figure 5A)
and mixed conformations (MD conformations and experimental structures)(0.91) (Figure 5B). In
a similar study involving HIV 1 protease, Yang et al. also reported the close similarity between
the motions predicted by ENMs and those computed by the PCA of experimental structures only,
PCA of MD simulation snapshots, and PCA of NMR ensembles (Yang, Song et al. 2008).
ANM-sampled conformations overlap with experimental structures around the outward-
occluded state. This might because we only sampled 70 ANM prediction conformations for the
top 3 ANM modes, starting from an outward-facing occluded conformation. MD sampled
conformations tend to drift away from the experimental structures, though some of them cluster
around the outward-open state experimental structure. It remains to be verified if the new cluster
of conformations in Figure 5D is complementary to the experimental structures and provide an
adequate representation of those unavailable (or not resolved) to date.
In the future, we may use of ENMs to generate conformational ensembles for docking, as
suggested by many studies (Cavasotto, Kovacs et al. 2005, Sperandio, Mouawad et al. 2010).
Also, a systematic study of the dynamics of families of proteins can be performed to help us
understand the relation between sequence evolution, structure selection and functional
promiscuity. Bahar et al. have already performed a systematic analysis for structurally resolved

35
and sequentially homologous proteins and made accessible the corresponding software, Prody
(Bakan, Meireles et al. 2011).
ANM results are dependent on the overall architecture/fold of the structure. They do not
incorporate the effects of specific interactions or detailed atomic coordinates. They do not offer
information on local changes in structure and interactions. Also, sequence information is not
included in ANM. In addition, inadequate description of non-linear effects and solvent effect etc.
limits the applications of ENMs. In cases where such local detailed interactions are of interest,
MD simulations can be utilized. Such simulations become particularly useful in druggability
assessments where the specific interactions between the protein and the ligand on a local scale
become important. We will introduce MD simulation and their use in druggability assessment in
the next chapter.

36
3.0 DRUGGABILITY ASSESSMENT: APLLICATION TO IONOTROPIC GLUTAMATE
RECEPTORS (IGLUR) N-TERMINAL DOMAIN AND LIGAND-BINDING DOMAIN
Druggability assessment of a target protein has become an area of interest toward hit-to-lead
optimization in recent years (Keller, Pichota et al. 2006). Here, we define focus on computational
assessment of druggability which is an estimation of binding sites and binding affinities of a
potential drug acting on a certain protein target with the help of MD simulations (Bakan, Nevins
et al. 2012). Recent genome analysis revealed that 10% of human genome is druggable and 50%
of those druggable proteins are correlated to disease-causing genes (Hopkins and Groom 2002).
Thus, early assessment of druggability may play an important role in drug discovery in saving
the cost due to the failure at the later toxicity/efficacy test stage.
Both NMR screening of libraries of small molecules (Hajduk, Huth et al. 2005) and
multiple crystallography where small molecule form complex a with the target protein (Allen,
Bellamacina et al. 1996) have proven useful in making those assessment experimentally. Hajduk
et al showed the correspondence between the sites experimentally observed to bind large
fractions of fragments (or drug-like molecules) available in solutions and the sites known to have
high ligand-binding affinity (Hajduk, Huth et al. 2005). Based on those observations, they
suggested a metric, druggability index to compute the druggability of target proteins and built a
model to distinguish druggable and non-druggable sites with a reasonable accuracy rate.

37
However, the experimental methods are expensive. Recently, the computational
screening of a library of fragment-like molecules and organic probe molecules against known
binding sites indicated that computational methods can distinguish druggable and non-druggable
targets successfully (Huang and Jacobson 2010). Due to dynamics of protein, some allosteric
sites and druggable pockets can be captured by MD simulations, even though they cannot be
identified by examination of the crystal structures (Ivetac and Andrew McCammon 2010).
In addition, methods for incorporating water and organic probes into MD simulations
have been developed by Guvench and Mackerell (Guvench and MacKerell Jr 2009). Further,
Bakan et al. recently developed a similar method but with an optimized probe set. This set is
drawn from small organic fragments overrepresented in FDA drugs, which have diverse
physicochemical properties (Bakan, Nevins et al. 2012). They showed that MD simulation-based
druggability assessment can capture and predict ligand-binding sites or even the allosteric sites
for a number of targets. The method thus enables us to investigate the binding landscape of
iGluR N-terminal domains (NTDs), especially those of AMPARs and NMDARs.

38
3.1 OUTLINE OF METHODS
MD simulations were performed using the simulation package NAMD (Phillips, Braun et
al. 2005) with the CHARMM (Brooks, Brooks et al. 2009) force field. The detailed protocol is
described by Bakan et al., 2012, (Bakan, Nevins et al. 2012). Smulations were conducted for 40 -
60 ns (See Appendix A for details). Due to the fast diffusion of small probes, this time scale can
successfully explore the entire surface of the target protein and identify most probable binding
pockets (Bakan, Nevins et al. 2012).
The free energy in this method is estimated based on the assumption that the probe
molecules follow a Boltzmann distribution and thereby allow us to convert probability
distributions into binding free energies. A grid-based method is used and the binding free energy
at each grid i is evaluated as = -RT ln(ni/n0). Here, ni/n0 is the ratio of the
observed density of probes ni to the expected density n0, R is the gas constant and T is the
absolute temperature (K). Binding events are accounted for by considering probe molecules as
independent particles. Interaction spots are identified by removing the voxels that overlap with
the lower energy voxels. Then, usually 6 or 8 proximal (located within 5.5 to 6.5 Å) spots are
merged to predict a so-called maximal affinity. Interaction spots (28 to 32 heavy atoms) are then
clustered and merged to locate each binding site. The interaction spots are supposed to be
potential druggable sites provided that the corresponding maximal affinity is 10uM (which
corresponds to a binding free energy of -6.86 kcal/mol). The maximal affinity is calculated based
on the premise that the free energies of different binding spots are additive. Thus, the maximal
affinity is estimated by the sum of free energies of interaction spots in that region for each site.

39
Once all the different sites are assessed, the program ranks all the possible druggable sites in
terms of their binding free energy from the lowest to the highest.
All the probes in this chapter are shown as spheres and reported by their center of mass.
They are color-coded based on the fragment name shown in Appendix A. The probes included in
our simulations are isopropylamine (IPAM), acetate (ACET), acetamide (ACAM), imidazole
(IMID), isopropanol (IPRO), isobutene (IBUT) and benzene (BENZ).

40
3.2 STRUCTURAL FEATURES OF IGLUR N-TERMINAL DOMAINS
Ionotropic glutamate receptors (iGluRs) consist of a family of glutamate-gated cation channels
that regulate the majority of neurotransmission in the central nervous system. The alterations in
iGluRs are associated with severe acute and chronic neurodegenerative diseases. The iGluR
family consists of three subfamilies: -amino-3-hydroxy-5methyl-4-isozazolepropionic acid
receptors (AMPARs), kainite receptors (KRs) and N-methyl-D-aspartate receptors (NMDARs).
Those subfamilies share an architecture of three major parts (shown in Figure 6): an extracellular
domain (ECD), a transmembrane domain (TMD) and an intracellular carboxyl-terminal domain
(Traynelis, Wollmuth et al. 2010). The ECD consists of a distal N-terminal domain (NTD) and
ligand-binding domain (LBD).
Figure 6 displays the full length structure of GluA2 AMPAR resolved by Gouaux and
collaborators (Sobolevsky, Rosconi et al. 2009). Both NTDs and LBDs share the clamshell-like
bilobate fold features which belong to the periplasmic binding protein (PBP)-like family
(Quiocho and Ledvina 1996). The function of the LBD is well-studied and characterized; L-
glutamate docking to the cleft of upper lobe (UL) and lower lobe (LL) leads to the closure of
cleft, which triggers channel activation through allosteric transition by TMD (Armstrong and
Gouaux 2000). The function of the NTDs remains to be further studied. In NMDARs, the NTDs
play a key role in signaling as a allosteric modulator of channel opening probability (Gielen,
Retchless et al. 2009). And this role resulted in a surge in the development of NMDAR
modulators /drugs. However, the allosteric modulation of NTDs in non-NMDARs is still not
well understood and is still under debate.
In addition, NMDARs contain Zn2+
binding sites and an ifenprodil molecule was found to
bind to NMDARs which was proposed to stabilize the closed-cleft conformation of the NTDs

41
(Karakas, Simorowski et al. 2009, Traynelis, Wollmuth et al. 2010). However, for AMPARs and
KRs, no ions or small molecules are known to bind. In this chapter we mainly explore the
potential druggable sites on the NTDs of AMPARs and NMDARs.
TMD interf
NTD
LBD interf
in
out
Figure 6 Complete structure of GluA2 (left) (except for the C-terminal domain) and the structure of the NTD
dimer of GluA2 ( right)
GluA2 is one of the subtypes of AMPAR. This complete GluA2 crystal structure (except for the C-terminal domain)
was obtained by Soblevsky et al. (Sobolevsky, Rosconi et al. 2009)
LL
UL

42
3.3 LIGAND-BINDING SITES ON IGLUR LBD
As introduced previously, the LBD of iGluRs is a bilobate structure similar to the bacterial PBP
proteins, which bind ligands in the cleft due to evolutionary optimization (Sukumaran, Rossmann
et al. 2011). The ion channel opening is initiated by the binding of glutamate in the LBD cleft
(Armstrong and Gouaux 2000). We benchmark the druggability assessment method first to see
how well this property of the LBD can be reproduced. We perform simulations using the GluR2
AMPAR LBD because this domain has a lot of crystal structure bound with either agonist or
antagonist and it is a good model for analysis (Pøhlsgaard, Frydenvang et al. 2011).
In AMPARs, receptor desensitization is initiated by reorganization of the dimer interface.
Though the exact mechanism is not clear yet, there is a large number of crystal structures of
LBDs with certain mutations which give us a few insight on the structural changes relevant to
receptor desensitization. It was reported by Sun et al. that cyclothiazide can stabilize the dimer
interface through positive allosteric modulation (Sun, Olson et al. 2002). AMPAR currents can
be enhanced by those positive modulator through its decreasing effect on receptor
desensitization. In Figure 7, we show that our probes capture the binding sites of cyclothiazide at
the interface of LBD and the locations of the probe molecules overlap with those binding sites.
Particularly, a high affinity binding site consisting of 6 hotspots, all of which composed of
ACAMs (yellow spheres) is identified, which closely overlaps owith the upper site for
cyclothiazide (shown in stick representation) allosteric modulator binding. This site yielded a
drug-like affinity of 0.413M or a binding free energy of -8.76 kcal/mol. Thus, we can see that
the probes adopt a binding pattern similar to those experimentally detected for positive
modulators of AMPAR LBD.

43
ACAM
IPRO
Figure 7 Probes that capture the known drug-binding sites in the LBD dimer of GluA2.
The structure of GluA2 NTD dimer in the presence of two cyclothiazide molecules (PDB ID: 1LBC) is shown. Cyclothiazide is a
known positive allosteric modulator at GluA2 LBD. GluA2 binds two cyclothiazides (shown by CPK stick representation) at the
interface between the monomers of the LBD dimers. Probe molecules shown by spheres (coinciding with their mass center) exhibit a
high propensity to populate this site.

44
3.4 DRUG-LIKE PROBE CLUSTERS CAPTURING DIMER INTERFACE FROM
NTD MONOMER SIMULATION
There are 9 distinct subtypes of iGluR NTDs crystal structures available. We have
performed 40ns druggability simulation for 7 subtypes in monomeric forms in the presence of
drug fragments (probes) and water. The most interesting result is the identification of monomer-
monomer interfacial regions captured by our probes (Table 1 and Figure 8).
Residues that participate in the formation of NTDs UL and LL dimer interface are
obtained from crystal contacts experimentally (Jin, Singh et al. 2009, Karakas, Simorowski et al.
2009, Kumar and Mayer 2010, Guorui, Yinong et al. 2011). However, for the NMDARs, no
distinct LL interface is identified for NMDAR homo/hetero dimers, only UL results are reported.
The high-affinity binding sites (clusters of 6 or 7 probes) which contain more than 2
probes within 5Å of the interfacial UL and HL regions are reported, which are proposed to be the
potential drug-like binding sites. Those probes that bind the interfacial regions are called
‘interfacial probes’.
Figure 8A shows that the druggability simulations accurately capture the high-affinity
binding sites at the monomer-monomer UL and LL interfaces of GluA3 NTD (shown as
spheres). At the UL interface (Figure 8B, the magnification of the UL interface), there are 7
probes with total affinity of 18.31nM. Six of the probes are within 5 Å of the interfacial residues
(shown in purple sticks) and 4 of them are within 4 Å; whereas for the LL interface (Figure 8C),
3 out of 7 probes bind the interfacial region. Both sites bind isopropanols (IPROs).

45
C
A
B
C312 T59
13
F88
LL interface
UL interface
S144
Q147
F143 L146
IPRO
Figure 8 Interlobe (UL-UL and LL-LL) interface regions at the NTD dimer of GluA3,
identified by druggability simulation to have a high propensity for binding small molecules.
(A) GluA3 monomer NTD (PDB ID: 3O21) chain C used in simulations is shown in white and the other chain
(chain D) is shown in light blue. The residues that line the interface are shown in purple sticks. The interfacial
region preferentially binds IPRO probes, which are shown in green spheres.
(B) Magnification of UL-UL interface. (C) Magnification of LL-LL interface.

46
For all iGluRs NTDs which have known UL and LL interfacial regions, except for GluA2
and GluK2, high-affinity sites for interfacial probes were identified. We can see that non-polar
hydrophobic molecules, such as isopropanol (IRPO) and isobutane (IBUT), are the two
dominating probes at those binding sites. The binding sites that contain 6 interfacial probes out
of 7 are labelled in red (Table 1).
GluK3 has the largest number of interfacial probes at both the UL and LL interfaces,
which indicates that it has a higher probability to form interfacial interactions or to stabilize a
dimeric form. We also concluded that among AMPARs and NMDARs, GluA3 and GluN2B
were more likely to form interfaces in terms of the number of interfacial probes in the binding
sites. Generally, for all subtypes, the UL interfacial residues are captured by high affinity binding
probe clusters, which indicates that the ULs are more likely to form interfaces compared to the
LLs.
We note that this method helps identify protein-protein interfaces consistent with
experiments and it has future implications on the identification of other unknown protein-protein
interfaces. In the next session, we will further discuss the druggability simulations performed for
the NTD dimers of iGluRs.

47
Table 1 High affinity binding sites on iGluR monomers
The table reports the high affinity binding sites which contain more than 2 hot spots within 5Å from the UL
or LL interface. For NMDARs, there were no LL interface binding probes. Thus only UL interface results are
reported for NMDARs.
iGluRs UL interface result for NTD monomer simulation
No. of interfacial
probes
Probe
composition
Binding free
energy
(kcal/mol)
Affinity
(nM)
GluA1 2 6 IBUT, 1 IPRO -11.71 2.90
GluA2 6 7 IBUT -10.98 9.90
GluA3 6 7 IPRO -10.61 18.31
GluK2 4 2 IBUT, 5 IPRO -10.10 43.60
GluK3 6 6 IBUT, 1 IPRO -12.19 1.29
NR1 3 5 IBUT, 2 IPRO -12.08 1.55
NR2B 4 6 BENZ, 1 IPRO -10.72 15.36
(Note: Probe abbreviations: isopropanol (IPRO), isopropyl amine (IPAM), Benzene (BENZ), and isobutane (IBUT))
iGluRs LL interface result from NTD monomer simulation
No. of interfacial
probes
Probe
composition
Binding Free
energy
(kcal/mol)
Affinity
(nM)
GluA1 2 4 IPRO, 3 IBUT -11.53 3.96
GluA2 - - - -
GluA3 3 7 IPRO -11.56 3.72
GluK2 - - - -
GluK3 6 4 IPRO, 3 IBUT -10.89 11.59

48
3.5 DRUGGABILITY ASSESSMENT OF IGLUR NTD DIMER
In this section, we proceed to evaluate the druggable sites in AMPARs and NMDARs. Among
AMPARs, as we saw in previous section, GluA3 has a relatively larger interface accessible to
probe molecules. We picked up GluA3 for NTD dimer simulations. For NMDARs, we used the
GluN1-GluN2B heterodimer NTD structure complexed with ifenprodil. Ifenprodil is a well-
known small molecule used to treat neurological diseases. It specifically inhibits the GluN1 and
GluN2B subunits of NMDAR (Karakas, Simorowski et al. 2011).
3.5.1 Druggability assessment of GluA3 NTD dimer
In the druggability simulation of GluA3 NTD dimer, two potential drug-binding sites were
identified, located at the UL and LL interfaces, respectively (Figure 9). Residues within 4.5 Å of
the probe clusters were considered to interact with the probes. Residues on 3,2 and L1 flap,
which are key conserved UL interfacial residues were found to interact with the probes at the UL
interface (Table 2). The UL probes clustered all at close proximity of the corresponding residues
that formed the binding pocket that contribute majorly to the binding affinity (Figure 10A).
Examination of the LL site (Figure 10C), on the other hand, showed that all 7 probes identified
to bind most frequently the interface make close contacts with key residues on 5, 6 and 7.
Particularly, one IPRO was observed to consistently make close contacts (within 4 Å) with R163.

49
The LL interface is largely polar. Especially R163 and R184 project towards together interface to
generate positive electrostatic potential and the charge repulsion presumably contributes to the
greater separation if the lobes compared to other AMPARs NTD subtypes (Jin, Singh et al.
2009). Thus, the IPRO here, which interacts with R163, prevents the same charge repulsion and
helps stabilize the NTD LL interface in a tightly packed conformation. In addition, two other
hydrophobic probes (IPROs) interact with M150 to contribute to the binding affinity as well.
Another potential drug binding site is the binding pocket formed by M150 by two 5 (Figure
10).
Figure 9 Potential drug binding sites deduced from GluA3 NTD dimer
simulations
Two binding sites are shown, at the UL and LL interfaces of the GluA3 NTD dimer. The
residues located within 4.5 Å interatomic distance from the probes are shown in sticks. Probe
molecules are shown in spheres.
ACAM
IPRO
ACET
IPAM
UL interface
LL interface

50
Table 2 Druggability of GluA3 NTD dimer
Probe cluster
(binding sites)
Interacting
residues
Binding free
energy(kcal/mol)
Affinity Probe cluster
compositions
Charge
UL interface 3: T86,
S87, A91
2 : N54,
F56
L1 flap:
A317
-8.21 1.04uM 3 ACAM
3 IPRO
-0.04e
LL interface
(sol 1) 5: L146 to
A152
6: E180
7 : R163
-12.19 1.31nM 5 IPRO
1 ACTT
1 IPAM
1e
LL interface
(sol 2)
M150 on two
5
-12.25 1.17nM 5 IPRO
2 IPAM
2e

51
LL interface
UL interface
3
2
7
Figure 10 Binding sites at GluA3 NTD dimer interface and corresponding PMs.
(A) Magnification of probe-binding site at the UL interface and (B) its corresponding PM (shown using OpenEye)
(C) Magnification of probe-binding site at the LL interface and (D ) its corresponding PM (shown using OpenEye)
(D) Magnification of probe-binding site at the LL interface and (D ) its corresponding PM (shown using OpenEye)
5
M150
M150
F56 N54
T86TM
S87
A317L3 A91
L146 Q147 M150
R163 E180
5
A
D C
B
E LL interface solut 2 F
5
5
7 6
ACAM IPRO ACET IPAM
LL interface solution 1
UL interface
M150
M150
T86

52
3.5.2 Druggability assessment of GluN1-GluN2B NTD dimer
In previous studies for NMDARs, the allosteric drug-binding site at NTD was usually located at
the interface between two NTD subunits (Karakas, Simorowski et al. 2011). In druggability
simulation of GluN1-GluN2B NTD dimer, three potential drug-binding sites are captured by the
probe clusters (Figure 11 and Table 3). The first two sites are located at the NTD hetero-dimer
interface, and the third is located between 7, 2 and loop1 and is presumed to be the possible
allosteric regulation site in GluN2B.
At the UL interface, the key residues belonging to L1 flap, 3 and 6 were found to be in
close contact (within 4.5 Å) with site 1 probe clusters (Figure 12A). Particularly, residue T103
interacting with an IPRO probe, on a loop extended from 3, has been identified as a key residue
for both ifenprodil- and zinc-binding (Rachline, Perin-Dureau et al. 2005), which maintains the
architecture of the zinc-binding pocket and the GluN2B NTD clamshell structure as a whole
(Karakas, Simorowski et al. 2009).
Site 2 is located in the LL interface. Therein residues in 5, participating in the interface
region, were observed interact with the probe cluster (Figure 12C). In addition, one of the probes
is close to K131 on a loop which may play a role upon drug binding on the NMDARs (Karakas,
Simorowski et al. 2011).
In addition to those binding sites located in the UL or LL interface regions, we also
identified a third binding site which binds in a pocket formed by loop, an helix and a sheet.
This site exhibits a binding affinity of 0.152uM and is proposed to be an allosteric binding site
yet to be experimentally validated.

53
The PMs for the above three sites are shown in Figure 12BDF. These will be used for
virtual screening for further analysis.
Site 1
Site 2
Site 3
Figure 11 Potential drug-binding sites captured by GluN1-GluN2B dimer
druggability simulation
The residues within 4.5 Å of the binding sites probes are shown in sticks. Probe molecules are
shown in spheres. GluN1 NTD is colored silver and GluN2B NTD, purple.

54
Table 3 Druggability of GluN1-GluN2B NTD dimer
Probe cluster
(binding
sites)
Interacting
residues
Binding free
energy
(kcal/mol)
Affinity Probe cluster
compositions
Charge
Site 1 GluN1 NTD:
L1 flap: from
N311 to I314
3: Y114
GluN2B NTD:
6 : E235, T238
Loop: T103
-9.50 0.12uM 5 IPRO
1 IPAM
I BENZ
-1.90e
Site 2 GluN1 NTD:
Loop: K131
GluN2B NTD
5: Q180 to
N184, R187
-7.43 3.83M 5 IPRO
1 BENZ
0.15e
Site 3 7 helix: V293,
R294
2 sheet: V68
Loop1: F59
-9.35 0.152uM 4 IPRO
2 ACTT
1 IBUT
-1.45e
(Probe abbreviations: isopropanol (IPRO), isopropyl amine (IPAM), Benzene (BENZ), acetate (ACTT), acetamide
(ACAM) and isobutene (IBUT) )

55
L1 flap
Y114
T103
Loop
E235 T238
S132
Loop
R187
5
K131
A (site1) (site1)LL
C (site2) D
B
helix
sheet
Loop
E (site3) F
T238
Figure 12 Binding sites at GluN1-GluN2B NTD dimer and corresponding PMs
(A) Magnification of Site 1 and its PM (B). Magnification of Site 1 and its PM. (C) Magnification of Site 2 and its PM (D).
(E) Magnification of Site 3 and its PM (F).
(B)
(C)

56
3.6 CONCLUSION
In this chapter, we assessed the druggabilities of iGluRs NTD monomers and dimers. To detect
high affinity binding sites, only those drug-like probe clusters (6 to 7 probes) were reported as
potential drug-binding sites. At the beginning, we benchmarked this method by investigating the
well-characterized ligand binding sites of GluA2 LBD dimer. And we found that our probe
cluster captured the known drug binding site and some probes overlapped with the residues in
the known drug.
Then, we further explored the potential binding sites of iGluR NTD monomers. Drug
probes identified residues involved in the interfacial region for each NTD subtype and the
corresponding high affinity binding sites were reported as well. This suggests that we can use
this method to accurately predict proten-protein interaction interfaces. Among the iGluRs,
GluA3 showed the most accessible interfacial region for binding probes, due to the high
flexibility of GluA3 (Dutta, Shrivastava et al. 2012). The identified high affinity binding sites in
the interface region suggest likelihood of drug binding site at the interface of GluA3 NTD.
Finally, we explored the druggable sites in the GluA3 NTD dimer and GluN1-GluN2B
NTD dimer. The simulation of GluA3 dimer provided an interesting result: we found two high
affinity binding sites at the interfacial regions and some key interfacial residues were found to be
in close contact with our probes, which further strengthen our hypothesis that there exists sites
that may potentially bind drugs at the LL GluA3 NTD interface. We characterized the
pharmacophore features of the high affinity site found by probe clusters. The PM can be
employed as a template for virtual screening of compounds (from known libraries of chemical
compounds) to identify potential molecules conforming to the PMs. And those hits can be further
optimized with higher efficacy to GluA3 and eventually be tested experimentally.

57
This study offers a new insight into the identification of allosteric regulatory binding sites
in GluA3 NTD where few drugs have been found to bind to it yet. For NMDARs, the
druggability analysis of GluN1-GluN2B NTD dimer also identified possible drug binding sites at
the interface region though there are fewer interacting interfacial residues in the binding pocket
compared to GluA3. Additionally, we identified another binding site, though not close to
interface region located in a pocket formed by helices and loop. PMs have been built for those
sites as well and we will use them for further virtual screening.
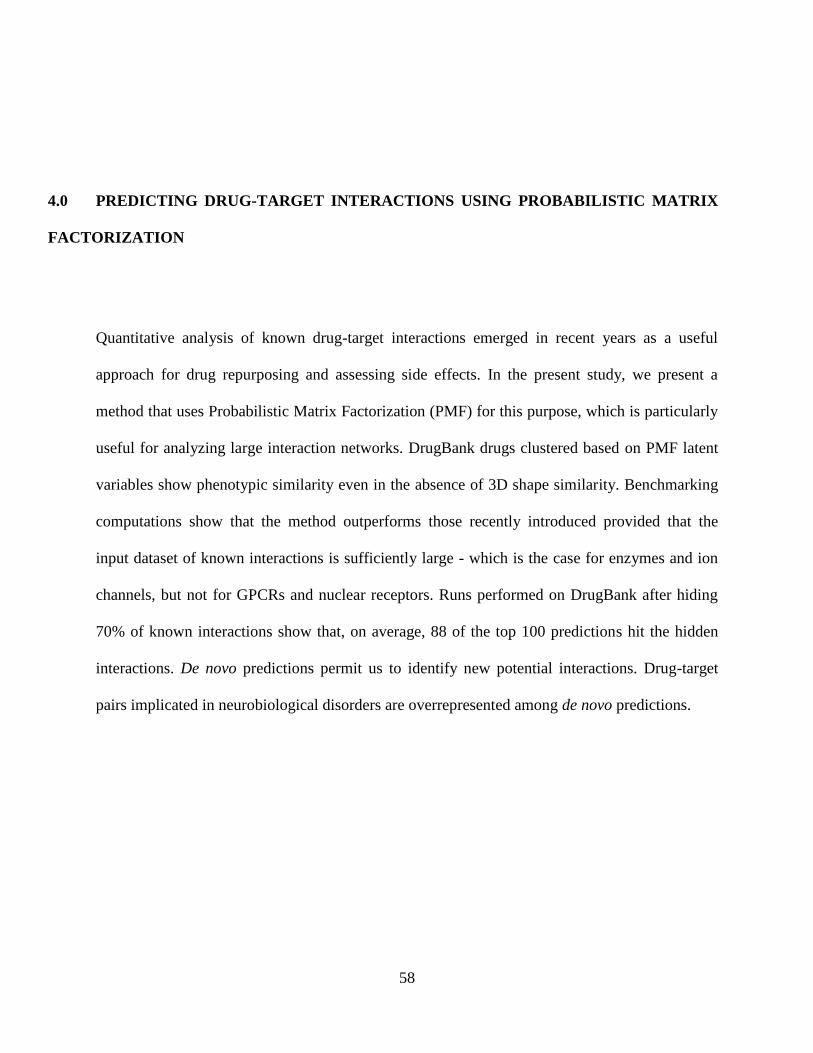
58
4.0 PREDICTING DRUG-TARGET INTERACTIONS USING PROBABILISTIC MATRIX
FACTORIZATION
Quantitative analysis of known drug-target interactions emerged in recent years as a useful
approach for drug repurposing and assessing side effects. In the present study, we present a
method that uses Probabilistic Matrix Factorization (PMF) for this purpose, which is particularly
useful for analyzing large interaction networks. DrugBank drugs clustered based on PMF latent
variables show phenotypic similarity even in the absence of 3D shape similarity. Benchmarking
computations show that the method outperforms those recently introduced provided that the
input dataset of known interactions is sufficiently large - which is the case for enzymes and ion
channels, but not for GPCRs and nuclear receptors. Runs performed on DrugBank after hiding
70% of known interactions show that, on average, 88 of the top 100 predictions hit the hidden
interactions. De novo predictions permit us to identify new potential interactions. Drug-target
pairs implicated in neurobiological disorders are overrepresented among de novo predictions.

59
4.1 ANALYSIS OF DRUG-TARGET INTERACTION NETWORK
Drug discovery and development became increasingly challenging in recent years, evidenced by
the estimated cost of around $1.8 billion for the development of a novel molecular entity with
suitable pharmacological properties (Paul, Mytelka et al. 2010). This cost increase partly
originates from the failure of many drug candidates in Phase II or III clinical trials due to their
toxicity or lack of efficacy (Berg, Rogers et al. 2010). The efficiency of drug discovery and
development might be improved by adopting a systemic approach that takes into consideration
the interaction of existing drugs and candidate compounds with the entire network of target
proteins and other biomolecules in a cell (Csermely, Korcsmáros et al. 2013). Indeed, the “one
gene, one drug, one disease” paradigm is widely recognized to fail in describing experimental
observations (Hopkins, Mason et al. 2006). Many drugs act on multiple targets, and many targets
are themselves involved in multiple pathways. For example, -lactam antibiotics and most
antipsychotic drugs exert their effect through interactions with multiple proteins (Sorger,
Allerheiligen et al. 2011). Biological networks are highly robust to single-gene knockouts, as
recently shown for yeast where 80% of the gene knockouts did not affect cell survival
(Hillenmeyer, Fung et al. 2008). Similarly, 81% of the 1,500 genes knocked out in mice did not
cause embryonic lethality, further corroborating the robustness of biological networks against
single target perturbagens (Zambrowicz and Sands 2004). These results suggest that quantitative
systems pharmacology strategies that take account of target (and drug) promiscuities can present
attractive alternative routes to drug discovery.
Recent years have seen many network-based models adopted to reduce the complexity of, and
efficiently explore, drug-target interaction systems (Berger and Iyengar 2009). In particular, the

60
development of computational methods that can efficiently assess potential new interactions
became an important goal. In this regard, the important role that machine learning approaches
such as Active Learning (AL) can play has been recently been highlighted (Murphy 2011).
Computational approaches used to predict unknown drug-target interactions can be divided into
roughly four categories: chemical-similarity-based methods (Keiser, Roth et al. 2007), target-
similarity-based methods (Li, An et al. 2011), integrative (both target- and chemical-similarity-
based) methods (Yamanishi, Araki et al. 2008), holistic approaches (Gottlieb, Stein et al. 2011,
Sirota, Dudley et al. 2011). The first two posit that if two entities are chemically or structurally
similar they will share interactions. The integrative approaches combine the chemical- and
target-similarity methods. While the intuition behind these approaches is very reasonable, their
performance has been observed to be tied to the underlying similarity computation method. We
also note that the utility of different methods may depend on the size of the dataset being
analyzed, e.g., computing chemical-chemical and target-target similarity matrices can be
problematic for large databases like STITCH (Kuhn, Szklarczyk et al. 2012) (that contains
information on the interactions between more than 2.6 million proteins and 300,000 chemicals).
To overcome these limitations, holistic methods have been introduced, which utilize a number of
different data sources such as gene expression perturbation (Dudley, Sirota et al. 2011) or high-
throughput screening (Cheng, Li et al. 2011).
In this study, we propose a novel approach by using a collaborative filtering algorithm to
predict interactions without reliance on chemical/target similarity or external data collection. We
validate the utility of Probabilistic Matrix Factorization (PMF) for predicting unknown drug-
target interactions with the help of a detailed investigation of its performance. The method is

61
shown to group drugs according to their therapeutic effects, irrespective of their 3-dimensional
(3D) shape similarity. Benchmarking computations show that the method outperforms recent
methods (Yamanishi, Araki et al. 2008, Yamanishi, Kotera et al. 2010, Gönen 2012)when
applied to large datasets of protein-drug associations, such as those of enzyme- and ion channel-
drug pairs; whereas it performance falls short of these methods' with decreasing size of the
examined dataset (e.g. GPCR- and nuclear receptor-drug datasets). The ability of the method to
efficiently analyze, and make inferences from, large datasets of protein-drug interactions
suggests that with growing sizes of those datasets, the utility (and accuracy) of the method will
further improve.
Application of the same benchmarking procedure to DrugBank (Knox, Law et al. 2011)
confirms its ability to disclose hidden data: 88 out of top 100 predictions (or 587 out of 1,000)
are found to hit known (but hidden) interactions, when only 30% of the entire data is used for
training. Finally, when the method is trained on the entire dataset of drug-target interactions
compiled in DrugBank, de novo predictions for drug repurposing can be made along with the
corresponding confidence levels. Top predictions include many drugs indicated for
neurodegenerative diseases or neurobiological disorders, including drug-target pairs apparently
supported by previous experiments (not reported in DrugBank), e.g., ergotamine–serotonin
receptor 1A (5HT1A) (Tfelt-Hansen, Saxena et al. 2000), amoxapine–5-HT2A (Pälvimäki,
Majasuo et al. 1996), verapamil–calmodulin (Epstein, Fiss et al. 1982).
In conclusion, the newly introduced computational method provides an efficient approach
for identifying potential drug-target association between chemicals and targets, and formulating

62
new hypotheses for repurposable drugs or side effects, thus complementing those deduced from
chemical-chemical or target-target similarities.
4.2 OVERVIEW OF METHODS
The drug-target interaction network is a bipartite graph with two types of nodes; drugs, and
targets. Each edge represents an interaction between a drug and a target. The drug-target
interaction identification problem is to determine the missing edges that are likely to exist given
all nodes and some of the edges in the network.
4.2.1 Dataset
We used DrugBank (version of September 20, 2011) as database (Knox, Law et al. 2011). All
drugs annotated therein as approved, along with their annotated targets, are included in our
dataset (i.e., we excluded compounds annotated as withdrawn or nutraceutical), resulting in N =
1,413 drugs and M = 1,050 targets with 4,731 interactions among them. The interaction network
displays small-world characteristics: many nodes have low degree and a few, very high degree,
as illustrated in the panels b and c of Figure S1, in line with previous studies on drug-target
networks (Yıldırım, Goh et al. 2007). On average, there are 3.35 interactions per drug, and 4.50
interactions per target.

63
4.2.2 Probabilistic Matrix Factorization (PMF)
PMF is a member of the Collaborative Filtering family of Machine Learning algorithms that
decomposes the connectivity matrix, RN x M, of a bipartite graph of N drugs and M targets as a
product of two matrices of latent variables (LVs) (Salakhutdinov and Mnih 2008). RN x M is
defined as:
The matrix RN x M is modeled as the product of two matrices UT
N x D and VD x M, that express each
drug/target in terms of a set of D LVs. Our objective is to find the best approximation for LVs,
while avoiding over-fitting. The predicted N x M is then expressed as:
MD
T
DNMN VUR̂ (2)
where UT and V are composed of N rows ui
T and M columns vj, respectively, each being D-
dimensional. The PMF adopts a probabilistic linear model with Gaussian noise to model the
interaction. Therefore, the conditional probability over observed interactions is represented as
N
i
M
j
I
j
T
iij
ij
Rfp1 1
22 ),|(),,|( vuVUR
(3)

64
where f((x | u,2) is the Gaussianly distributed probability density function for x, with mean u
and variance 2, and Iij is the indicator function equal to 1 if the entry Rij is known, and 0
otherwise. Therefore, p(R | U, V, 2) gives us a probabilistic representation of the connectivity
matrix, R (Mnih and Salakhutdinov 2007). Using zero-mean, spherical Gaussian priors on LVs,
we can write
N
i
UiU fp1
220 ),|()|( IuU
(4)
and
M
j
VjV ),|(f)|(p1
22 0 IvV
(5)
Which lead to the log-likelihood of U and V given by
Here C is a term that does not depend on LVs; the first term on the right-hand side is the squared
error function to be minimized; and the two summations over the square magnitudes of ui and vj
are regularization terms that favor simpler solutions and penalize over-fitting. The above log-
likelihood directly follows from the Bayes’ rule where R stands for data, and U and V represent
the model (see Supplementary Material for details). To learn an optimal model means to find the
U and V matrices, or the D-dimensional LV vectors, ui (1 ≤ i ≤ N) and vj (1 ≤ j ≤ M)), that
maximize the log-likelihood function.
The PMF method yields the optimal ui and vj vectors corresponding to each drug, di, and each
target tj, respectively. The basic idea is that the model is forced towards making a ‘no-

65
interaction’ prediction by the regularization – i.e. there is a penalty associated with any non-zero
value in the LV matrices. However, there is also a penalty for failing to capture known
interactions– i.e., if the dot product of the LV vectors corresponding to an interacting drug-target
pair is close to zero. Therefore the learning of a model means to optimally balance out two
objectives: developing a sufficiently complex model to describe the known interactions, but not
overly complex to end up in over-fitting. In this study, we use gradient descent for optimization.
The adoption of higher D values usually yields more accurate results, although beyond a certain
limit the increase in complexity and decrease in efficiency may not warrant the marginal
improvement, if any, in prediction accuracy. D = 50 is adopted here as an optimal dimensionality
for prediction runs. The method is highly efficient: a 50-dimensional model is trained on the
entire DrugBank in approximately 2 seconds using a 2.00 GHz AMD Opteron processor.
Moreover, the computing time to learn a PMF model scales linearly with the number of
interactions, and as such, the method can be advantageously used for much larger datasets.
4.2.3 Active Learning (AL) using PMF
The AL strategy adopted in the present study is, in part, motivated by the success reported by
Warmuth et al (Warmuth, Liao et al. 2003). who demonstrated that hit maximization is a viable
AL strategy applicable to predicting drug-target interactions. The AL strategy adopted here also
prioritizes the discovery of unknown interactions. Our method differs in that we aim at capturing
the interactions between all drugs and targets, as opposed to predicting activity against a single
target.

66
The procedure is the following: We begin with the set of N drugs and M targets, and
known associations. The purpose is to identify new associations. For each candidate interaction,
say the possible interaction between di and tj, we compute the model’s estimate, (Eq 3). The dot
product ui Tvj serves as a weight ij for the edge/connector between di and tj. Clearly, ij, or the
likelihood of association between di and tj, is high when ui and vj have both large values of the
same sign at the same dimension(s). For example, a relatively large weight may originate from
the 2nd component of both ui and vj, which means that the predicted association is mainly due to
latent variable 2. We evaluated the statistical weights ij(di, tj) for the N x M pairs of drug-
targets for two purposes: (i) benchmarking the methodology via an iterative AL scheme, and (ii)
making de novo predictions. In the former case, the method is benchmarked by hiding 70% of
known interactions and examining whether the top-ranking prediction is a ‘hit’, i.e., whether it
corresponds to a known (but hidden) interaction. The outcome from this test is fed back to the
model, to repeat the calculation for the next prediction. Therefore, the AL model is updated at
each iteration using the newly acquired ‘hit’ or ‘miss’ data until a predetermined number (m) of
predictions are made. The passive learner (PL) makes the m predictions simultaneously without
updating its model.
In the case of de novo predictions, all DrugBank data were used as input. De novo
predictions also lend themselves to an AL scheme provided that the top-ranking prediction is
experimentally tested and then the new hit or miss data are incorporated in the model to perform
a new prediction, and so on, until the experimentation budget is exhausted.

67
4.3 PMF CLUSTERS DRUGS WITH THERAPEUTIC SIMILARITIES,
IRRESPECTIVE OF THEIR CHEMICAL-STRUCTURAL SIMILARITIES
To assess whether the LVs provide us with a pharmacologically meaningful metric, we examined
the clustering of drugs in the D-dimensional space of the latent vectors. The clustering was
performed for D = 30 - the value that gave the lowest Akaike information criterion I (Akaike
1974), using as basis the drug-drug distance L1(di, dj) = k |uik - ujk | where uik designates the kth
component of ui, and the summation is performed over D components.
Inasmuch as our method evaluates drugs based on their interaction profiles with targets,
which in turn refer to specific therapeutic or phenotypic actions, the similarity of a pair of drugs
should be high when their therapeutic effects are comparable and vice versa. Thus, the method
will tend to cluster drugs that exhibit similar patterns of interactions (with target proteins), which
we term as functionally similar drugs.
The heat map in Figure 13 displays the resulting organization of drugs in 30 clusters
(indicated by different colors and indices along the axes). The dark regions on the map indicate
high functional similarity. The dark blocks along the diagonal show that most clusters include
highly similar members, except for two (clusters 29 and 30), which apparently combine the
outliers.

68
Given that (promiscuous) proteins present more than one site for ligand-binding, different
functionalities may be modulated by chemical-structurally different drugs, depending on the
Figure 13 . Comparison of pairwise similarities of drugs
Comparison of pairwise similarities of drugs, based on their (a) therapeutic targets compiled in DrugBank and
(b) 3D structure. Panel a displays the 30 clusters of drugs deduced from the PMF of 1,413 approved drugs and
corresponding 1,050 targets compiled in DrugBank. By definition, drugs belonging to a given cluster share similar
interaction patterns with respect to targets. Panel b displays their 3D similarities, with the drugs being ordered as in
panel a. Dark regions indicate high similarity based on LVs (panel a) or 3D similarities (panel b). Comparison of the
panels shows that close proximity in LV space (which indicates functional similarity) does not necessarily imply 3D-
structure similarity. LV distances were distributed in the range [0, 1]; with the distribution of values also skewed in
different ways. To render the two sets comparable, we performed rank normalization on both the LV similarities and
3D similarities. Selected boxes are enlarged in Figure 13 (white) and 4 (yellow).

69
binding site on the target (e.g. catalysis, substrate recognition, or allosteric signaling).
Furthermore, a shared phenotype may arise from the targeting of different proteins along a given
pathway. In order to make a better assessment of the properties of drugs grouped in those
clusters, we examined their 3D structural similarities. High similarities would suggest that they
bind similar epitopes, if not similar (or identical) structural domains or proteins. If, on the
contrary, they are structurally dissimilar, this might indicate a different site on the same protein,
or a different target on the same pathway, or other indirect effect due to drug-target network
connectivity.
The extent of 3D structure similarity between pairs of drugs was computed using the OpenEye
Scientific software (http://www.eyesopen.com/). 3D similarity was reported to be a better
predictor than 2D methods for off-target interactions, and to perform equally well in on-target
interactions (Yera, Cleves et al. 2011), although 3D methods may suffer from more noise due to
the conformational flexibility of the small molecule. We generated for each drug all possible
stereoisomers using OpenEye FLIPPER (Hawkins, Skillman et al. 2010), and up to 200
conformers per stereoisomer using OpenEye OMEGA (Hawkins, Skillman et al. 2010). All
combinations of conformers accessible to the examined pair of drugs were examined using
OpenEye Shape (Swann, Brown et al. 2011) toolkit; and the best matching pair was adopted to
assign a 3D similarity score. This computationally expensive task led to the heat map presented
in panel b of Figure 13. The drugs (along the axes) are ordered as in panel a to enable visual
comparison.

70
The comparison of Figure 13 shows that some clusters of functionally similar drugs (panel a)
also exhibit some 3D similarities (panel b), whereas others display little structural similarity. We
examined more closely the individual clusters to see if shared therapeutic functions were
captured even when 3D similarities were absent. Figure 14 illustrates the results for cluster 14.
This cluster essentially consists of anti-anxiety drugs, the majority of which are both functionally
(panel b) and structurally (panel c) similar. However, the cluster also includes a structurally
dissimilar drug, ethchlorvynol (panel a), which shares the same type of phenotypic action (as a
sedative) as the majority of the cluster membership (mostly targeting GABA receptors). The
present approach thus detects chemically or structurally distinctive drugs that share common
activities, which would have been missed by methods based on ligand fingerprint similarities.
Another interesting observation concerns the cross-correlations between different clusters (i.e.
the off-diagonal regions of the heat maps). We note for example that cluster 11 also contains a
set of sedatives. LVs are able to capture the commonality between the clusters 11 and 14 as may
be seen by the strong signal (dark region) at the off-diagonal region enlarged in Figure 15b. The
3D similarity, on the other hand, cannot recognize the functional similarity and potential
interference/side effects between these drugs in these two clusters (Figure 15c). The LVs thus
provide information on drug groups that potentially share pathways or exhibit similar activity
patterns despite their distinct physicochemical properties.

71
DB00186
Lorazepam
DB00231
Temazepam
DB01594
Cinolazepam
DB00842
Oxazepam
DB00189
Ethchlorvynol
Latent Variable Similarity
3D Similarity
ANTI-ANXIETY AGENTS a b
c
Figure 14 Latent variables can capture therapeutic action similarities when 3D similarity metrics cannot.
Closer examination of the similarities between the members of the cluster 14 in Figure 13 (enclosed in white boxes in Figure 13,
enlarged in panels b and c here) shows that the cluster contains a series of anti-anxiety drugs. A few members of this cluster (indicated by
orange boxes along the abscissa of panels b and c) are displayed in panel a, to illustrate their shared structural features, also indicated by the
panel c that reflects their 3D similarities. The same cluster however contains ethchlorvynol, also used as a sedative, which would have been
missed if we had used exclusively used 3D similarity to identify functionally similar drugs.

72
Figure 15 Strong cross-correlations between different clusters of drugs are consistent with their similar therapeutic
functions
Cluster 11, color-coded cyan, is essentially composed of hypnotics and sedatives. Cluster 14 (dark gray) contains anti-
anxiety drugs. The drugs in these two clusters are located very closely on the drug-target interaction network, as shown in panel a,
consistent with their similar actions. The LV-derived heat maps capture the functional similarity between these two clusters (as
indicated by strong signals, or the dark region, in panel b); the maps based on 3D similarity (panel c) do not. In panel a drugs are
shown in blue, protein targets in red. Most drugs and targets are part of a single connected component. Data are retrieved from
DrugBank. Cytoscape is used for visualization(Smoot, Ono et al. 2011).

73
4.4 BENCHMARKING COMPUTATIONS SUPPORT THE UTILITY OF THE
METHOD FOR ANALYZING LARGE DATASETS
To evaluate the performance of the method in comparison to previous work, we considered three
important studies in this area, one recently published by Gonen (Gönen 2012) and two by
Yamanishi et al. (Yamanishi, Araki et al. 2008, Yamanishi, Kotera et al. 2010). Gonen used a
Kernel-based matrix factorization (KBMF) with chemical and genomic similarities to predict
multiple targets. Yamanishi et al., on the other hand, integrated chemical, genomic and
pharmacological data to map all drugs and targets to the same unified feature space where each
protein-compound pair closer than a predefined threshold was predicted to interact. Our
approach differs from both studies, in that PMF assumes an independent LV for each row and
column with Gaussian priors; whereas KBMF employs LVs spanning all rows and columns with
Gaussian process priors, and Yamanishi et al project drugs and targets into a pharmacological
space based on the eigenvalue decomposition of the graph-based similarity matrix.
The benchmarking procedure that we adopted is a five-fold cross-validation of drugs on four
target classes: Enzymes, Ion channels, G-protein coupled receptors (GPCRs) and Nuclear
Receptors. In order to achieve comparable results, we used the same protocol as that adopted
earlier, i.e., we divided our dataset into five subsets, and each was used as a test set, and the
others, as training sets. Due to the randomness involved in the selection of subsets, we repeated
the cross-validation experiments 100 times with randomly selected subsets and evaluated the
average AUC (area under the receiver operating curve) for each subset. The first four rows in
Table 4 compare the results (columns 6-10) for the four classes, and the 5th row lists the average
performances weighted by the size of the interaction space. Our method performs best when
applied to large datasets (e.g. enzymes and ion channels); whereas Gonen’s performs best in the

74
case of GPCRs, and Yamanishi et al.(2010) exhibits the highest performance for nuclear
receptors, where the present method yields a relatively low (0.642) AUC value. Examination of
the statistical significance of our results indicates that the mean AUC values obtained for all four
sets are highly robust. Their covariance vary from 2% (Enzymes and Ion Channels) to 11%
(Nuclear Receptors). Finally, the application of the same benchmarking protocol to DrugBank
yielded an accuracy rate of 79.4 ± 0.01% (Table 4), supporting the utility of the method when
applied to large datasets.
Table 4 Properties of the space of proteins-drugs, and performance of present method in comparison
to others
(a)The last four columns present the comparison with Yamanishi’s and Gonen’s results for the same
dataset.
(b) weighted-average mean and covariances, evaluated using the number of interactions as weights

75
In principle, it might be intrinsically harder to make accurate predictions for larger
datasets as the size of the potential interaction space N×M grows quadratically when the number
of drugs and targets grow linearly, particularly if the number of known interactions is small. The
occupancy of the N×M interaction matrix is only 1.5% in the Enzyme class, which could make it
difficult to learn an informative model. The present PMF technique, however, successfully
learned an informative model and handled the complexity of interactions in this space of
interactions, apparently due to the availability of a sufficiently large (absolute) number of known
interactions.
Ion Channel-drug class has the second largest number of known interactions among the
four. Although the size of interaction space is one order of magnitude smaller than Enzyme class,
there are 776 known interactions leading to a percent occupancy of 5.37% of all possible ion
channel-drug associations. The success of our method in this case may be attributed to both the
relatively large number of known interactions and the rich annotation of that class of
interactions.
The two other classes, GPCRs and nuclear receptors, are significantly smaller in terms of
their interaction space and/or occupancy of that space. Nuclear receptors comprise only 27 drugs
and 22 targets, and 44 interactions. A method that relies solely on connectivity, like ours, cannot
presumably formulate an informative model when the set of ‘edges’ to construct the network
connectivity matrix is incomplete. In those cases, the data that come from other sources, e.g.
chemical similarity and genomic patterns amend this lack of information. Consequently, methods
that incorporate such features (Yamanishi, Kotera et al. 2010, Gönen 2012) outperform ours.

76
To put the results into perspective, we indicated by a vertical dashed line in each panel
the fraction of data (80%) used in previous studies (Yamanishi, Kotera et al. 2010, Gönen
2012)for training purposes. Consistent with the above findings, Ion Channels yield the best
result: previous AUC values (Gönen 2012) (of 0.799; Table 4) are matched with about only 35%
of the data. On the Enzyme group, we match the performance of Yamanishi et al. (Yamanishi,
Kotera et al. 2010)(AUC of 0.845) with roughly 70% of the data used for training. GPCRs and
Nuclear Receptors yield AUC values lower than those previously attained, irrespective of the
fraction of hidden interactions.
In summary, the method is particularly suitable for screening and inferring repurposable
drugs or potential side effects from large datasets where computational assessment of structure
similarity kernels become prohibitively expensive. In cases where the dataset of known
interactions is too small, on the other hand, 2D or 3D similarity metrics provide more accurate
assessments.

77
4.5 THE ABSOLUTE NUMBER OF KNOWN INTERACTIONS OVERRIDES THE
SCARCITY OF THE DATA IN DETERMINING THE ACCURACY RATE OF PMF
ACTIVE LEARNER
As a more stringent test, 3,318 (70%) of the known 4,731 interactions in DrugBank were
randomly hidden, reducing the average number of interactions per drug from 3.35 to 1. The
resulting ‘incomplete’ interaction matrix was then used to predict the hidden interactions, one at
a time (rank-ordered by statistical weights ij(di, tj)) as described in the Methods. The outcome
was checked in a simulated experiment to assess whether the predicted interaction is a true
positive (TP) or a false positive (FP). If the prediction is an existing, but hidden, interaction, the
result is considered a TP (or hit), otherwise a FP (or miss). Then the model is updated in line
with our AL scheme, and this loop is repeated until the completion of m = 1,000 predictions. At
that point, the simulation is halted and the overall performance of the model, or the hit ratio, is
evaluated. Note that this method gives us a lower bound for hit ratio because the predictions are
labeled as hits only if they are annotated in DrugBank, although they can be true but not yet
observed experimentally or annotated in DrugBank.
The results are presented in Figure 16. The figure displays the number of hits as a
function of the number of predictions, obtained with three approaches: active learning (dark blue
curves), passive learning (dark red curves) and random (green). The approach is able to achieve,
on average, 587 hits out of 1,000 predictions via AL, 407 hits, via PL; and the corresponding
variances (indicated by the dashed curves) are 35 and 46, respectively. Compared to the random
probability of 2.23 hits per 1,000 predictions, the AL result is a 263-fold improvement over
random. The improvement of AL over PL is 1.44 fold. The AL improvement over random was

78
Figure 16 Ability of PMF to recapitulate hidden drug-target interactions.
The number of drug-target interactions per drug was reduced from 3.35 (average) to 1 by hiding 70% of known
interactions, selected randomly. Simulations were repeated n = 96 times for each of the 1 < m < 1,000 predictions (abscissa)
and the number of hits (correctly identified hidden interactions) is plotted for each run, along the ordinate. The dark blue
and dark red solid curves refer to the average performance obtained by active learning and passive learning protocols,
respectively, using D = 50, = 3, = 0.01, and u = 0.9 in the adopted PMF algorithm. Dashed curves show the
corresponding variances (by one standard deviation) above and below the mean value. The green curves (practically
overlapping with the abscissa) refer to results from random predictions. The inset shows a close-up of the first 100
predictions. AL reaches an accuracy rate (hit ratio) of 88.0 ± 4.7% and 58.7± 3.5 % in the respective cases of m = 100 and
1,000 predictions.

79
reported to be up to 3.19-fold in a previous SVM-based study for predicting the activity of 1,316
drugs against a single target.38 The same study also reported 1.59-fold improvement between
passive and active learners. Closer examination of the results from the top 100 predictions
(enlarged in the inset) further shows that hit ratios of 88.0 ± 4.7% and 82.2 ± 6.4% are obtained
by the respective AL and PL protocols.
Figure 17 Improvement in prediction accuracy by active learning (AL) over random (panel a) and over passive
learning (PL) (panel b), as a function of the latent space dimensionality
Fold-improvement is based on hit ratios obtained at the end of 1,000 predictions, using same parameters as Figure 16. The AL
performance levels off at about D = 50 in panel a. The last bar in each panel refers to the work of Warmuth et al. (2003).
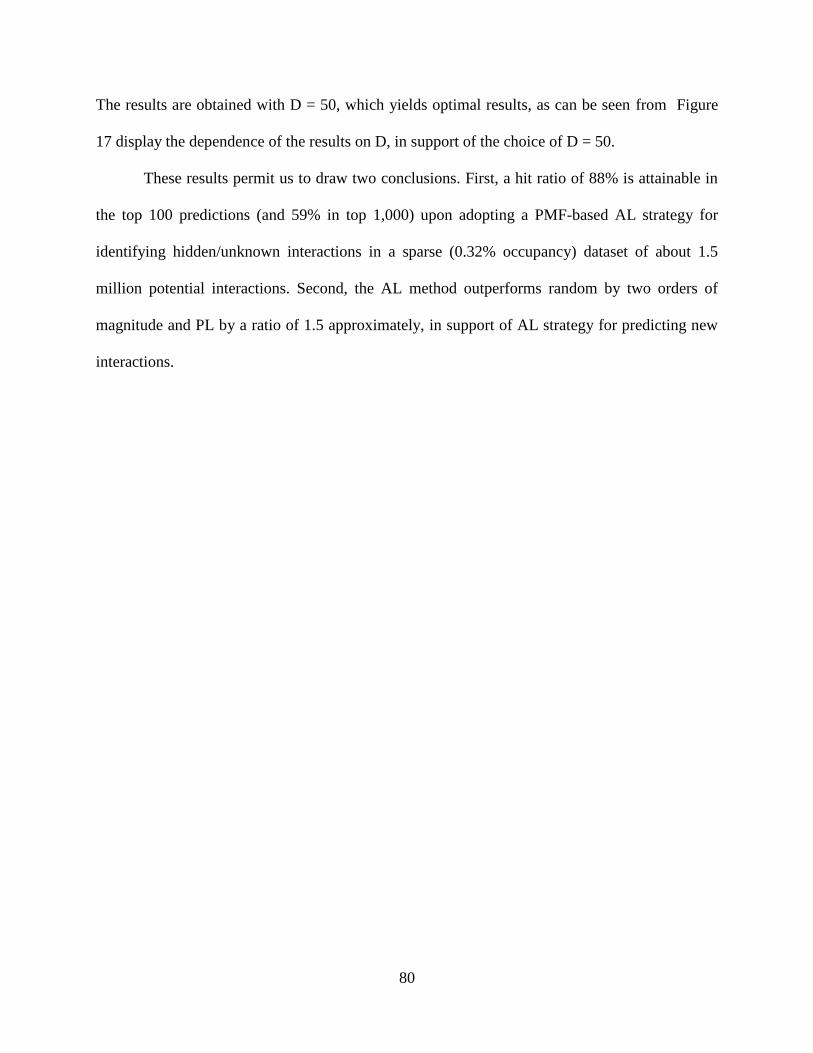
80
The results are obtained with D = 50, which yields optimal results, as can be seen from Figure
17 display the dependence of the results on D, in support of the choice of D = 50.
These results permit us to draw two conclusions. First, a hit ratio of 88% is attainable in
the top 100 predictions (and 59% in top 1,000) upon adopting a PMF-based AL strategy for
identifying hidden/unknown interactions in a sparse (0.32% occupancy) dataset of about 1.5
million potential interactions. Second, the AL method outperforms random by two orders of
magnitude and PL by a ratio of 1.5 approximately, in support of AL strategy for predicting new
interactions.

81
4.6 DE NOVO PREDICTIONS OF DRUG-TARGET INTERACTIONS
We used our method to predict new (potential) drug-target interactions after training our model
on the latest available version of DrugBank (Sept 10, 2013) comprised of 5,041 interactions
between 1,502 approved drugs and 1,138 targets. The highest confidence pairs obtained for
twenty distinct drugs are presented in Table 5.
Table 5 De novo predictions, rank-ordered based on confidence
(a)Abbreviations: GABA: -aminobutyric-acid receptor; 5-HT: 5-hydroxytryptamine (or serotonin) receptor. NET:
norepinephrine (or noradrenaline) transporter; ADRA1A: adrenoreceptor 1 A; DAT: dopamine transporter.
(b)The cases listed as ‘indirect’ refer to interactions of the drugs with different subtypes of the identified target
(c) orphenadrine inhibits norepinephrine reuptake thus potentiating the effect of norepinephrine There are several
drugs acting as norepinephrine-dopamine reuptake inhibitors, and ophenadrine might exhibit same behavior.
Drug Target Support from previous experiments (ref)
Ergotamine 1A (5-HT1Aa) direct(Tfelt-Hansen, Saxena et al. 2000)
Amoxapine 2A (5-HT2A) direct(Pälvimäki, Majasuo et al. 1996)
Minaprine histamine receptor H1 -
Trimipramine 2A adrenergic receptor Amitriptyline 2C (5-HT2c) Tramadol 2C (5-HT2c) Clozapine D(1B) dopamine receptor Doxepin D(1A) dopamine receptor Nicardipine histamine receptor H1 -
Flunitrazepam GABAa
Paliperidone 7 (5-HT7) direct(Kast 2010)
Iloperidone 2B adrenergic receptor Propericiazine 1A adrenergic receptor (ADRA1A
a)
Asenapine 1B adrenergic receptor Verapamil calmodulin direct (Petersen and Mørk 1996)
Meperidine Naa channel 10, type direct (Wagner, Eaton et al. 1999)
Cinnarizine calmodulin direct(ZIMMER and HOFMANN 1987)
Paroxetine (paxil) histamine receptor H1 direct(Fava 1999)
Orphenadrine DATa
Citalopram Naa-dependent NET
a indirect(Petersen and Mørk 1996)

82
The pairs therein were observed to lie frequently among the top-ranking 10 pairs (in the space of
N × M = 1.7x10⁶ potential interactions), deduced from 10
4 independent runs initiated with
different random numbers.
We note that the list of de novo predictions in Table 5 is dominated by drugs used for
neurological or psychiatric disorders, consistent with the known pharmacological promiscuity of
this of drugs. The last column 2 lists the experimental support from the literature, if any, for the
possible interaction of the drug-target pair in each row. Among pairs supported by previous
experiments, we note ergotamine–serotonin receptor 1A (5HT1A) (Tfelt-Hansen, Saxena et al.
2000), amoxapine–5-HT2A (Pälvimäki, Majasuo et al. 1996), verapamil–calmodulin (Epstein,
Fiss et al. 1982), paliperidone–5-HTc (Kast 2010), meperidine–sodium channels (Wagner, Eaton
et al. 1999), cinnarizine–calmodulin (ZIMMER and HOFMANN 1987). We also note that
chronic treatment with paroxetine has been recently reported to increase the mRNA levels of
histamine receptor H1, indicating an association between paroxetine and Histamine receptor H1
(Rahmadi, Narita et al. 2011). Although paroxetine is a potent serotonin reuptake inhibitor, its
weight gain side effect has been attributed to its medication action on histamine receptors(Fava
1999).
Many others (indicated as ‘indirect’) are interactions known to occur either with subtypes
of the listed targets or proteins implicated in the same phenotype (e.g., citalopram induces
norepinephrine receptor hypoactivity (Petersen and Mørk 1996), which may relate to

83
norepinephrine transport by NET). Yet, the validity of these predictions need to be established by
experiments.
4.7 DISCUSSION
Over the last couple of years, there have been a number of computational studies performed to
identify targets of existing drugs and drug candidates other than those originally known/proposed
to be targeted. A pioneering study is that of Roth, Shoichet and coworkers (Keiser, Roth et al.
2007, Keiser, Setola et al. 2009) based on compound chemical similarities. Dudley et al focused
on inverse correlations between gene expression profiles in the presence of a drug and in a
disease state (Dudley, Sirota et al. 2011). Yamanishi and his colleagues represented drugs and
targets in an integrated ‘pharmacological space’ (Yamanishi, Araki et al. 2008, Yamanishi,
Kotera et al. 2010).Gonen used a KBMF method where chemical and genomic similarities were
integrated (Gönen 2012).We proposed a PMF-based AL methodology that can be
advantageously used for large datasets.
The applicability of the method to large datasets is worth further attention, given that we
will increasingly have access to bigger data (e.g. STITCH Database (Kuhn, Szklarczyk et al.
2012)), which will be exploited for repurposable drug identification. The software developed
here, made accessible in http://www.csb.pitt.edu/Faculty/bahar/files/, is readily scalable. For
very large datasets, which typically have more known interactions, the PMF is able to construct a
better model using the plethora of available data; whereas when the number of known
interactions is limited, the use of chemical and genomic kernels allows KBMF to outperform
PMF. The application of KBMF to large datasets may, however, become challenging, For

84
example, STITCH contains on the order of 106 proteins and 105 compounds, implying that 1012
sequence and 1010 chemical similarity comparisons are needed to make predictions. However,
the PMF method is independent of chemical, structural or other similarity metrics, and its
computation time scales linearly with the number of known interactions; and it proves to perform
well on large datasets. The datasets reporting drug-target interactions are constantly improving in
quality and quantity, and therefore expected to give even better results when analyzed by an
efficient tool. Finally, the extension of the method to analyzing big data (with millions of nodes)
is foreseeable in the near future. The recently introduced GraphChi tool (Kyrola, Blelloch et al.
2012) can be used for optimized and parallelized model learning for further performance
improvements.
The fact that the PMF is independent of 2D/3D shape comparison methods commonly
employed in drug-target pair inferences implies that the derived LVs capture similarities based
on the interaction patterns of drugs at the cellular level, even if their molecular structures are
dissimilar (see Figure 13 and Figure 14). As such, the method may be advantageously used for
lead hopping, thus complementing those (e.g. SVM classification algorithms) used in
conjunction with 2D or 3D pharmacophoric fingerprints (see Saeh et al. (Saeh, Lyne et al.
2005)). Inasmuch as the currently proposed method does not require structural data for proteins
but knowledge of drug-target interactions, it can be advantageously applied to membrane
proteins (major drug targets) for which structural data still remain sparse. It can also be used to
make predictions across major drug or target classification boundaries. One implication is that
the de novo predictions are not restricted to major drug or target classification boundaries.
A major utility of the developed tool is the ability to deliver testable hypotheses with
regard to repurposable drugs, thus significantly reducing the search space for identifying potent

85
applications of existing drugs (that proved to meet ADMET requirements). The number of
experiments that can be efficiently conducted is usually limited, e.g. of the order of 102 if not
101 for high-confidence assays as opposed to the complete space of ~1.5 million combinations
for the dataset used in this study. The fact that the top-ranking predictions exhibit a hit ratio of
59% (for the top 1,000 predictions; or 88% for top 100 predictions) suggest that de novo
predictions made by the presently introduced method of approach applied to increasingly large
datasets are likely to provide useful guidance for experimentally testing, streamlining or
prioritizing existing or investigational drugs or new compounds. Another important by-product
is the probabilistic assessments on potential side effects, a topic that will become increasingly
important with advances in personalized medicine.

86
5.0 CONCLUSION AND FUTURE WORK
In this thesis, we have performed analysis of several neuron-signaling membrane proteins: LeuT
and iGluR family, using both computational molecular and systems-level approaches: ENM
analysis, all-atom MD simulations based druggability assessment as well as probabilistic matrix
factorization (PMF) in analysis of drug-target interaction network.
Using NMA-ENM, we gained a better understanding of the conformation sampling
ability of ANM in LeuT. The advantage of this approach is that it can help us to extend the
conformational space accessible to LeuT based on a single structure among the available LeuT
crystal structures and it is fast without depending on the availability of numerous representative
structures (that are needed for PCA analysis, for instance.) The consistency between ENM-
predicted motion and the dominate motion computed by PCA of experimental structures enables
us to use ENM to decipher a pathway of communication via residues identified from the intrinsic
topology of the protein. The most cooperative motion identified by the native topology network
models is highly correlated with the potential structural changes in different forms.
The flexibility of proteins and ligands has been widely recognized important for
identifying binding sites in proteins. MD simulation of proteins in the presence of small organic
molecules and water, which takes entropy and enthalpy into account, enables us to capture those
allosteric binding sites which is hard to be captured by experimental approaches due to protein
flexibility. Using this druggability assessment method, we described a landscape of binding sites

87
for iGluR NTDs monomers and dimers. Particularly, we have identified binding sites at the UL
and LL interfaces of GluA3 NTD dimer and GluN1-GluN2B NMDA heterodimer. PMs have
been built for those potential binding sites captured by probe clusters in the previous GluA3
NTD dimers and GluN1-GluN2B NTD dimers druggability simulation.
Based on those pharmocophore models, virtual screenings have been done to find
potential hit compounds for NMDAR (GluN1-GluN2B) and AMAPR (GluA3). As shown in
Table 6, no literature evidence have been found to offer hint about whether the predicted drugs
bind to our targets. However, for Marimastat, which is predicted by NMDAR PM, as a top-
ranking drug predicted by PMF for AMPAR. Also, Arbutamine which targets -adrenergic
receptors is captured by both NMDAR and AMPAR PMs, which might suggest it is likely to
bind the iGluRs.
Table 6 Drugs predicted using pharmacophore models
Targets Position of the
binding sites
Drugs Supporti
ng evidence
NMDAR(GluN1-GluN2B) Site 1 (UL interface) Arbutamine -
Site 2(LL interface) Adenosine -
Site 3(helices and
loops interface)
Marimastat Indirect
(Captured by
PMF)
AMPAR(GluA3) UL interface Carteolol -
LL interface Arbutamine -
De novo prediction of the above two targets via PMF has been performed as well. Table
7 lists the top-ranking 10 drugs based on confidence levels. For NMDAR (GluN1), among the
top 10 drugs, 3 have direct literature support for their binding to the target (highlighted in red)
and 6 hae indirect support either binding to subtypes of GluN1 or reveal some binding profiles
indicating it might bind to the target from previous experiments. Also, among those 10 drugs, all,

88
except Felbamate andMemantine, are antagonists of sodium-dependent noradrenaline transporter
and sodium-dependent serotonin transporter. Therefore, they have been employed as
antidepressant drugs or neuropathic pain analgesia. Chlorpheniramine and Atomoxetine can
target dopamine transporter as well.
Table 7 Top-ranking 10 drugs predicted by PMF for NMDA GluN1 and GluN2B subunits
Target Top10 predicted
Drugs
Supporting evidence from DrugBank or
Literature
NMDAR
(GluN1) Tramadol Indirecta (GluN3A)
Tapentadol Indirect(Schäfer 2009, Vadivelu, Mitra et al.
2010)
Chlorpheniramine Indirect(Díaz-Trelles, Novelli et al. 2000)
Felbamate Indirecta(GluN2B, GluN2A GluN3A)
Atomoxetine Direct(Ludolph, Udvardi et al. 2010)
Levomilnacipran Direct(Shuto, Takada et al. 1995)
Desvenlafaxine Indirect(Raabe and Gentile 2008)
Cocaine -
Dextromethorphan Indirecta(GluN3A)
Memantine Direct(Kotermanski, Wood et al. 2009)
NMDAR
(GluN2B)
Tramadol Indirecta (GluN3A)
Orphenadrine Indirecta(GluN1, GluN2D, GluN3A, GluN3B)
Ketamine Indirect (GluN3A)
Amantadine Indirecta(GluN3A)
Mirtazapine Direct(Bienkowski, Krzascik et al. 2001)
Halothane Indirecta (GluN3A, GluN3B, GluN2A)
Amisulpride -
Thiothixene -
Dopamine -
Sulpride -
AMPAR
(GluA3 subunit)
Marimastat Indirect(Captured by NMDA PM)
Zonisamide Indirect(Sarid-Segal, Knapp et al. 2009)
Dalfampridine -
Miconazole -
Halothane Indirecta (GluN3A, GluN3B, GluN2A)
Antithymocyte globulin -
Bosutinib -

89
Amiloride -
L-Carnitine Indirect(Castorina, Maria Ambrosini et al.
1993, Zanelli, Solenski et al. 2005)
Drotrecogin alfa -
Note: a.The cases listed as ‘indirect’ refer to interactions of the drugs with different subtypes of the
identified target from DrugBank.
For NMDAR (GluN2B), among the top 10 drugs, only the first 6 drugs have either direct
or indirect supporting evidence. Tramadol ranks first in both GluN1 and GluN2B, and it has been
found to directly interact with GluN3A. The top 10 drugs for AMPAR (GluA3) have much less
supporting evidence and most of the predicted drugs are ion channel blockers. This is due to
those AMPARs, especially GluA3, which have much fewer known existing drugs binding to
them compared to NMDARs. And in the dataset we used for de novo prediction, there is only
one known interaction which is between GluA3 and lithium. Lack of known interactions affects
PMF performance as discussed in chapter4. Interestingly, Marimastat ranking first among PMF
de novo predictions made for AMPAR, is also captured by NMDAR PM based on druggability
simulations.
In summary, the results from the application of PMF and druggability simulations based
PM may be advantageously combined to obtain consensus hit compounds. PMF outperforms the
latter in terms of new drug-target associations prediction. However, there is still overlap between
those two models like drug Marimastat. The PMF method relies on the existing known
interaction information for that specific target.
Thus, in the presence of knowledge in ligand-binding profile, PMF emerges as a
powerful approach for predicting repurposable drugs. On the other hand, for exploring potential
binding site on those targets, especially when there are fewer data on drugs, druggability
simulations provides valuable testable hypotheses.

90
APPENDIX A
DETAILS OF DRUGGABILITY SIMULATION

91
BIBLIOGRAPHY
Abrams, C. F. and E. Vanden-Eijnden (2010). "Large-scale conformational sampling of proteins
using temperature-accelerated molecular dynamics." Proceedings of the National Academy of
Sciences 107(11): 4961-4966.
Acharya, C., A. Coop, J. E. Polli and A. D. Mackerell, Jr. (2011). "Recent advances in ligand-
based drug design: relevance and utility of the conformationally sampled pharmacophore
approach." Curr Comput Aided Drug Des 7(1): 10-22.
Akaike, H. (1974). "A new look at the statistical model identification." Automatic Control, IEEE
Transactions on 19(6): 716-723.
Allen, K. N., C. R. Bellamacina, X. Ding, C. J. Jeffery, C. Mattos, G. A. Petsko and D. Ringe
(1996). "An experimental approach to mapping the binding surfaces of crystalline proteins." The
Journal of Physical Chemistry 100(7): 2605-2611.
Andersen, J., N. Stuhr-Hansen, L. Zachariassen, S. Toubro, S. M. Hansen, J. N. Eildal, A. D.
Bond, K. P. Bøgesø, B. Bang-Andersen and A. S. Kristensen (2011). "Molecular determinants
for selective recognition of antidepressants in the human serotonin and norepinephrine
transporters." Proceedings of the National Academy of Sciences 108(29): 12137-12142.
Armstrong, N. and E. Gouaux (2000). "Mechanisms for activation and antagonism of an AMPA-
sensitive glutamate receptor: crystal structures of the GluR2 ligand binding core." Neuron 28(1):
165-181.
Atilgan, A., S. Durell, R. Jernigan, M. Demirel, O. Keskin and I. Bahar (2001). "Anisotropy of
fluctuation dynamics of proteins with an elastic network model." Biophysical journal 80(1): 505-
515.
Bahar, I., A. R. Atilgan and B. Erman (1997). "Direct evaluation of thermal fluctuations in
proteins using a single-parameter harmonic potential." Fold Des 2(3): 173-181.
Bahar, I., A. R. Atilgan and B. Erman (1997). "Direct evaluation of thermal fluctuations in
proteins using a single-parameter harmonic potential." Folding and Design 2(3): 173-181.
Bahar, I., C. Chennubhotla and D. Tobi (2007). "Intrinsic dynamics of enzymes in the unbound
state and relation to allosteric regulation." Current opinion in structural biology 17(6): 633-640.

92
Bahar, I., T. R. Lezon, A. Bakan and I. H. Shrivastava (2009). "Normal mode analysis of
biomolecular structures: functional mechanisms of membrane proteins." Chemical reviews
110(3): 1463-1497.
Bahar, I., T. R. Lezon, A. Bakan and I. H. Shrivastava (2010). "Normal mode analysis of
biomolecular structures: functional mechanisms of membrane proteins." Chem Rev 110(3):
1463-1497.
Bahar, I., T. R. Lezon, L. W. Yang and E. Eyal (2010). "Global dynamics of proteins: bridging
between structure and function." Annu Rev Biophys 39: 23-42.
Bajorath, J. (2008). "Computational analysis of ligand relationships within target families." Curr
Opin Chem Biol 12(3): 352-358.
Bakan, A. and I. Bahar (2009). "The intrinsic dynamics of enzymes plays a dominant role in
determining the structural changes induced upon inhibitor binding." Proceedings of the National
Academy of Sciences 106(34): 14349-14354.
Bakan, A., L. M. Meireles and I. Bahar (2011). "ProDy: protein dynamics inferred from theory
and experiments." Bioinformatics 27(11): 1575-1577.
Bakan, A., N. Nevins, A. S. Lakdawala and I. Bahar (2012). "Druggability assessment of
allosteric proteins by dynamics simulations in the presence of probe molecules." Journal of
chemical theory and computation 8(7): 2435-2447.
Basak, S. C. (2012). "Chemobioinformatics: the advancing frontier of computer-aided drug
design in the post-genomic era." Curr Comput Aided Drug Des 8(1): 1-2.
Berg, J., M. Rogers and P. Lyster (2010). "Systems biology and pharmacology." Clinical
Pharmacology & Therapeutics 88(1): 17-19.
Berger, S. I. and R. Iyengar (2009). "Network analyses in systems pharmacology."
Bioinformatics 25(19): 2466-2472.
Bienkowski, P., P. Krzascik, E. Koros, W. Kostowski, A. Scinska and W. Danysz (2001).
"Effects of a novel uncompetitive NMDA receptor antagonist, MRZ 2/579 on ethanol self-
administration and ethanol withdrawal seizures in the rat." European journal of pharmacology
413(1): 81-89.
Brooks, B. R., C. L. Brooks, A. D. MacKerell, L. Nilsson, R. J. Petrella, B. Roux, Y. Won, G.
Archontis, C. Bartels and S. Boresch (2009). "CHARMM: the biomolecular simulation
program." Journal of computational chemistry 30(10): 1545-1614.
Brvar, M., A. Perdih, M. Oblak, L. P. Mašič and T. Solmajer (2010). "In silico discovery of 2-
amino-4-(2, 4-dihydroxyphenyl) thiazoles as novel inhibitors of DNA gyrase B." Bioorganic &
medicinal chemistry letters 20(3): 958-962.

93
Campillos, M., M. Kuhn, A. C. Gavin, L. J. Jensen and P. Bork (2008). "Drug target
identification using side-effect similarity." Science 321(5886): 263-266.
Castorina, M., A. Maria Ambrosini, A. Giuliani, L. Pacifici, M. Teresa Ramacci and L.
Angelucci (1993). "A cluster analysis study of acetyl-L-carnitine effect on NMDA receptors in
aging." Experimental gerontology 28(6): 537-548.
Cavasotto, C. N., J. A. Kovacs and R. A. Abagyan (2005). "Representing receptor flexibility in
ligand docking through relevant normal modes." Journal of the American Chemical Society
127(26): 9632-9640.
Chang, R. L., L. Xie, L. Xie, P. E. Bourne and B. O. Palsson (2010). "Drug off-target effects
predicted using structural analysis in the context of a metabolic network model." PLoS Comput
Biol 6(9): e1000938.
Chen, L., J. Lu, J. Zhang, K. R. Feng, M. Y. Zheng and Y. D. Cai (2013). "Predicting chemical
toxicity effects based on chemical-chemical interactions." PLoS One 8(2): e56517.
Chen, L., J. K. Morrow, H. T. Tran, S. S. Phatak, L. Du-Cuny and S. Zhang (2012). "From
laptop to benchtop to bedside: structure-based drug design on protein targets." Curr Pharm Des
18(9): 1217-1239.
Cheng, F., C. Liu, J. Jiang, W. Lu, W. Li, G. Liu, W. Zhou, J. Huang and Y. Tang (2012).
"Prediction of drug-target interactions and drug repositioning via network-based inference."
PLoS Comput Biol 8(5): e1002503.
Cheng, T., Q. Li, Y. Wang and S. H. Bryant (2011). "Identifying compound-target associations
by combining bioactivity profile similarity search and public databases mining." Journal of
chemical information and modeling 51(9): 2440-2448.
Csermely, P., T. Korcsmáros, H. J. Kiss, G. London and R. Nussinov (2013). "Structure and
dynamics of molecular networks: A novel paradigm of drug discovery: A comprehensive
review." Pharmacology & therapeutics 138(3): 333-408.
Díaz-Trelles, R., A. Novelli, J. A. Vega, A. Marini and M. T. Fernández-Sánchez (2000).
"Antihistamine terfenadine potentiates NMDA receptor-mediated calcium influx, oxygen radical
formation, and neuronal death." Brain research 880(1): 17-27.
Doruker, P., A. R. Atilgan and I. Bahar (2000). "Dynamics of proteins predicted by molecular
dynamics simulations and analytical approaches: Application to α‐ amylase inhibitor."
Proteins: Structure, Function, and Bioinformatics 40(3): 512-524.
Dudley, J. T., M. Sirota, M. Shenoy, R. K. Pai, S. Roedder, A. P. Chiang, A. A. Morgan, M. M.
Sarwal, P. J. Pasricha and A. J. Butte (2011). "Computational repositioning of the anticonvulsant
topiramate for inflammatory bowel disease." Science translational medicine 3(96): 96ra76-
96ra76.

94
Dutta, A., I. H. Shrivastava, M. Sukumaran, I. H. Greger and I. Bahar (2012). "Comparative
dynamics of NMDA-and AMPA-glutamate receptor N-terminal domains." Structure 20(11):
1838-1849.
Enyedy, I. J. and W. J. Egan (2008). "Can we use docking and scoring for hit-to-lead
optimization?" J Comput Aided Mol Des 22(3-4): 161-168.
Epstein, P. M., K. Fiss, R. Hachisu and D. M. Andrenyak (1982). "Interaction of calcium
antagonists with cyclic AMP phosphodiesterases and calmodulin." Biochemical and biophysical
research communications 105(3): 1142-1149.
Eyal, E., L.-W. Yang and I. Bahar (2006). "Anisotropic network model: systematic evaluation
and a new web interface." Bioinformatics 22(21): 2619-2627.
Fava, M. (1999). "Weight gain and antidepressants." The Journal of clinical psychiatry 61: 37-
41.
Fitzgerald, J. B., B. Schoeberl, U. B. Nielsen and P. K. Sorger (2006). "Systems biology and
combination therapy in the quest for clinical efficacy." Nat Chem Biol 2(9): 458-466.
Floquet, N., J. D. Marechal, M. A. Badet-Denisot, C. H. Robert, M. Dauchez and D. Perahia
(2006). "Normal mode analysis as a prerequisite for drug design: application to matrix
metalloproteinases inhibitors." FEBS Lett 580(22): 5130-5136.
Flory, P. J., M. Gordon and N. G. McCrum (1976). "Statistical Thermodynamics of Random
Networks [and Discussion]." Proceedings of the Royal Society of London. A. Mathematical and
Physical Sciences 351(1666): 351-380.
Forrest, L. R., S. Tavoulari, Y.-W. Zhang, G. Rudnick and B. Honig (2007). "Identification of a
chloride ion binding site in Na+/Cl−-dependent transporters." Proceedings of the National
Academy of Sciences 104(31): 12761-12766.
Forrest, L. R., Y.-W. Zhang, M. T. Jacobs, J. Gesmonde, L. Xie, B. H. Honig and G. Rudnick
(2008). "Mechanism for alternating access in neurotransmitter transporters." Proceedings of the
National Academy of Sciences 105(30): 10338-10343.
Gielen, M., B. S. Retchless, L. Mony, J. W. Johnson and P. Paoletti (2009). "Mechanism of
differential control of NMDA receptor activity by NR2 subunits." Nature 459(7247): 703-707.
Gönen, M. (2012). "Predicting drug–target interactions from chemical and genomic kernels
using Bayesian matrix factorization." Bioinformatics 28(18): 2304-2310.
Gottlieb, A., G. Y. Stein, E. Ruppin and R. Sharan (2011). "PREDICT: a method for inferring
novel drug indications with application to personalized medicine." Molecular systems biology
7(1).

95
Gottlieb, A., G. Y. Stein, E. Ruppin and R. Sharan (2011). "PREDICT: a method for inferring
novel drug indications with application to personalized medicine." Mol Syst Biol 7: 496.
Grubmüller, H. (1995). "Predicting slow structural transitions in macromolecular systems:
conformational flooding." Physical Review E 52(3): 2893.
Guorui, Y., Z. Yinong, G. Shenyan, Z. Jie, X. Huaxi, I. M. Irimpan and J. Rongsheng (2011).
"Crystal structure of the glutamate receptor GluA1 N-terminal domain." Biochemical Journal
438(2): 255-263.
Guvench, O. and A. D. MacKerell Jr (2009). "Computational fragment-based binding site
identification by ligand competitive saturation." PLoS computational biology 5(7): e1000435.
Hajduk, P. J., J. R. Huth and S. W. Fesik (2005). "Druggability indices for protein targets derived
from NMR-based screening data." Journal of medicinal chemistry 48(7): 2518-2525.
Haliloglu, T., I. Bahar and B. Erman (1997). "Gaussian dynamics of folded proteins." Physical
review letters 79(16): 3090.
Hawkins, P. C., A. G. Skillman, G. L. Warren, B. A. Ellingson and M. T. Stahl (2010).
"Conformer generation with OMEGA: algorithm and validation using high quality structures
from the Protein Databank and Cambridge Structural Database." Journal of chemical information
and modeling 50(4): 572-584.
Henry, L. K., J. R. Field, E. M. Adkins, M. L. Parnas, R. A. Vaughan, M.-F. Zou, A. H. Newman
and R. D. Blakely (2006). "Tyr-95 and Ile-172 in transmembrane segments 1 and 3 of human
serotonin transporters interact to establish high affinity recognition of antidepressants." Journal
of Biological Chemistry 281(4): 2012-2023.
Hillenmeyer, M. E., E. Fung, J. Wildenhain, S. E. Pierce, S. Hoon, W. Lee, M. Proctor, R. P. S.
Onge, M. Tyers and D. Koller (2008). "The chemical genomic portrait of yeast: uncovering a
phenotype for all genes." Science 320(5874): 362-365.
Hinsen, K. (1998). "Analysis of domain motions by approximate normal mode calculations."
Proteins Structure Function and Genetics 33(3): 417-429.
Hopkins, A. L. (2007). "Network pharmacology." Nat Biotech 25(10): 1110-1111.
Hopkins, A. L. (2008). "Network pharmacology: the next paradigm in drug discovery." Nat
Chem Biol 4(11): 682-690.
Hopkins, A. L. and C. R. Groom (2002). "The druggable genome." Nature reviews Drug
discovery 1(9): 727-730.
Hopkins, A. L., J. S. Mason and J. P. Overington (2006). "Can we rationally design promiscuous
drugs?" Current opinion in structural biology 16(1): 127-136.

96
Horvath, D. (1997). "A virtual screening approach applied to the search for trypanothione
reductase inhibitors." J Med Chem 40(15): 2412-2423.
Huang, N. and M. P. Jacobson (2010). "Binding-site assessment by virtual fragment screening."
PloS one 5(4): e10109.
Huber, T. and W. F. van Gunsteren (1998). "SWARM-MD: Searching conformational space by
cooperative molecular dynamics." The Journal of Physical Chemistry A 102(29): 5937-5943.
Iadevaia, S., Y. Lu, F. C. Morales, G. B. Mills and P. T. Ram (2010). "Identification of optimal
drug combinations targeting cellular networks: integrating phospho-proteomics and
computational network analysis." Cancer Res 70(17): 6704-6714.
Iorio, F., R. Bosotti, E. Scacheri, V. Belcastro, P. Mithbaokar, R. Ferriero, L. Murino, R.
Tagliaferri, N. Brunetti-Pierri, A. Isacchi and D. di Bernardo (2010). "Discovery of drug mode of
action and drug repositioning from transcriptional responses." Proc Natl Acad Sci U S A
107(33): 14621-14626.
Iskar, M., G. Zeller, P. Blattmann, M. Campillos, M. Kuhn, K. H. Kaminska, H. Runz, A. C.
Gavin, R. Pepperkok, V. van Noort and P. Bork (2013). "Characterization of drug-induced
transcriptional modules: towards drug repositioning and functional understanding." Mol Syst
Biol 9: 662.
Ivetac, A. and J. Andrew McCammon (2010). "Mapping the Druggable Allosteric Space of G‐
Protein Coupled Receptors: a Fragment‐Based Molecular Dynamics Approach." Chemical
biology & drug design 76(3): 201-217.
Jia, J., F. Zhu, X. Ma, Z. W. Cao, Y. X. Li and Y. Z. Chen (2009). "Mechanisms of drug
combinations: interaction and network perspectives." Nat Rev Drug Discov 8(2): 111-128.
Jin, G., C. Fu, H. Zhao, K. Cui, J. Chang and S. T. Wong (2012). "A novel method of
transcriptional response analysis to facilitate drug repositioning for cancer therapy." Cancer Res
72(1): 33-44.
Jin, R., S. K. Singh, S. Gu, H. Furukawa, A. I. Sobolevsky, J. Zhou, Y. Jin and E. Gouaux
(2009). "Crystal structure and association behaviour of the GluR2 amino‐terminal domain."
The EMBO journal 28(12): 1812-1823.
Joffe, E. (1991). "Complication during root canal therapy following accidental extrusion of
sodium hypochlorite through the apical foramen." Gen Dent 39(6): 460-461.
Kantcheva, A. K., M. Quick, L. Shi, A.-M. L. Winther, S. Stolzenberg, H. Weinstein, J. A.
Javitch and P. Nissen (2013). "Chloride binding site of neurotransmitter sodium symporters."
Proceedings of the National Academy of Sciences 110(21): 8489-8494.

97
Karakas, E., N. Simorowski and H. Furukawa (2009). "Structure of the zinc‐bound amino‐terminal domain of the NMDA receptor NR2B subunit." The EMBO journal 28(24): 3910-3920.
Karakas, E., N. Simorowski and H. Furukawa (2011). "Subunit arrangement and
phenylethanolamine binding in GluN1/GluN2B NMDA receptors." Nature 475(7355): 249-253.
Kast, R. (2010). "Glioblastoma chemotherapy adjunct via potent serotonin receptor‐7 inhibition
using currently marketed high ‐ affinity antipsychotic medicines." British journal of
pharmacology 161(3): 481-487.
Keiser, M. J., B. L. Roth, B. N. Armbruster, P. Ernsberger, J. J. Irwin and B. K. Shoichet (2007).
"Relating protein pharmacology by ligand chemistry." Nature biotechnology 25(2): 197-206.
Keiser, M. J., B. L. Roth, B. N. Armbruster, P. Ernsberger, J. J. Irwin and B. K. Shoichet (2007).
"Relating protein pharmacology by ligand chemistry." Nat Biotechnol 25(2): 197-206.
Keiser, M. J., V. Setola, J. J. Irwin, C. Laggner, A. I. Abbas, S. J. Hufeisen, N. H. Jensen, M. B.
Kuijer, R. C. Matos and T. B. Tran (2009). "Predicting new molecular targets for known drugs."
Nature 462(7270): 175-181.
Keiser, M. J., V. Setola, J. J. Irwin, C. Laggner, A. I. Abbas, S. J. Hufeisen, N. H. Jensen, M. B.
Kuijer, R. C. Matos, T. B. Tran, R. Whaley, R. A. Glennon, J. Hert, K. L. Thomas, D. D.
Edwards, B. K. Shoichet and B. L. Roth (2009). "Predicting new molecular targets for known
drugs." Nature 462(7270): 175-181.
Keller, T. H., A. Pichota and Z. Yin (2006). "A practical view of ‘druggability’." Current opinion
in chemical biology 10(4): 357-361.
Knox, C., V. Law, T. Jewison, P. Liu, S. Ly, A. Frolkis, A. Pon, K. Banco, C. Mak and V. Neveu
(2011). "DrugBank 3.0: a comprehensive resource for ‘omics’ research on drugs." Nucleic acids
research 39(suppl 1): D1035-D1041.
Kotermanski, S. E., J. T. Wood and J. W. Johnson (2009). "Memantine binding to a superficial
site on NMDA receptors contributes to partial trapping." The Journal of physiology 587(19):
4589-4604.
Krejsa, C. M., D. Horvath, S. L. Rogalski, J. E. Penzotti, B. Mao, F. Barbosa and J. C. Migeon
(2003). "Predicting ADME properties and side effects: the BioPrint approach." Curr Opin Drug
Discov Devel 6(4): 470-480.
Krishnamurthy, H. and E. Gouaux (2012). "X-ray structures of LeuT in substrate-free outward-
open and apo inward-open states." Nature 481(7382): 469-474.
Kuhn, M., M. Al Banchaabouchi, M. Campillos, L. J. Jensen, C. Gross, A. C. Gavin and P. Bork
(2013). "Systematic identification of proteins that elicit drug side effects." Mol Syst Biol 9: 663.

98
Kuhn, M., D. Szklarczyk, A. Franceschini, C. von Mering, L. J. Jensen and P. Bork (2012).
"STITCH 3: zooming in on protein–chemical interactions." Nucleic acids research 40(D1):
D876-D880.
Kumar, J. and M. L. Mayer (2010). "Crystal structures of the glutamate receptor ion channel
GluK3 and GluK5 amino-terminal domains." Journal of molecular biology 404(4): 680-696.
Kwong, L. N., J. C. Costello, H. Liu, S. Jiang, T. L. Helms, A. E. Langsdorf, D. Jakubosky, G.
Genovese, F. L. Muller, J. H. Jeong, R. P. Bender, G. C. Chu, K. T. Flaherty, J. A. Wargo, J. J.
Collins and L. Chin (2012). "Oncogenic NRAS signaling differentially regulates survival and
proliferation in melanoma." Nat Med 18(10): 1503-1510.
Kyrola, A., G. E. Blelloch and C. Guestrin (2012). GraphChi: Large-Scale Graph Computation
on Just a PC. OSDI.
Lee, M. J., A. S. Ye, A. K. Gardino, A. M. Heijink, P. K. Sorger, G. MacBeath and M. B. Yaffe
(2012). "Sequential application of anticancer drugs enhances cell death by rewiring apoptotic
signaling networks." Cell 149(4): 780-794.
Lehar, J., A. S. Krueger, W. Avery, A. M. Heilbut, L. M. Johansen, E. R. Price, R. J. Rickles, G.
F. Short, 3rd, J. E. Staunton, X. Jin, M. S. Lee, G. R. Zimmermann and A. A. Borisy (2009).
"Synergistic drug combinations tend to improve therapeutically relevant selectivity." Nat
Biotechnol 27(7): 659-666.
Lezon, T. R. and I. Bahar (2010). "Using entropy maximization to understand the determinants
of structural dynamics beyond native contact topology." PLoS computational biology 6(6):
e1000816.
Li, J., X. Zhu and J. Y. Chen (2009). "Building disease-specific drug-protein connectivity maps
from molecular interaction networks and PubMed abstracts." PLoS Comput Biol 5(7): e1000450.
Li, Y. Y., J. An and S. J. Jones (2011). "A computational approach to finding novel targets for
existing drugs." PLoS computational biology 7(9): e1002139.
Lindorff-Larsen, K., S. Piana, R. O. Dror and D. E. Shaw (2011). "How fast-folding proteins
fold." Science 334(6055): 517-520.
Lounkine, E., M. J. Keiser, S. Whitebread, D. Mikhailov, J. Hamon, J. L. Jenkins, P. Lavan, E.
Weber, A. K. Doak, S. Cote, B. K. Shoichet and L. Urban (2012). "Large-scale prediction and
testing of drug activity on side-effect targets." Nature 486(7403): 361-367.
Ludolph, A. G., P. T. Udvardi, U. Schaz, C. Henes, O. Adolph, H. U. Weigt, J. M. Fegert, T. M.
Boeckers and K. J. Föhr (2010). "Atomoxetine acts as an NMDA receptor blocker in clinically
relevant concentrations." British journal of pharmacology 160(2): 283-291.

99
Ma, J. (2005). "Usefulness and limitations of normal mode analysis in modeling dynamics of
biomolecular complexes." Structure 13(3): 373-380.
Miller, J. R., S. Dunham, I. Mochalkin, C. Banotai, M. Bowman, S. Buist, B. Dunkle, D. Hanna,
H. J. Harwood, M. D. Huband, A. Karnovsky, M. Kuhn, C. Limberakis, J. Y. Liu, S. Mehrens,
W. T. Mueller, L. Narasimhan, A. Ogden, J. Ohren, J. V. Prasad, J. A. Shelly, L. Skerlos, M.
Sulavik, V. H. Thomas, S. VanderRoest, L. Wang, Z. Wang, A. Whitton, T. Zhu and C. K.
Stover (2009). "A class of selective antibacterials derived from a protein kinase inhibitor
pharmacophore." Proc Natl Acad Sci U S A 106(6): 1737-1742.
Mnih, A. and R. Salakhutdinov (2007). Probabilistic matrix factorization. Advances in neural
information processing systems.
Moses, H., 3rd, E. R. Dorsey, D. H. Matheson and S. O. Thier (2005). "Financial anatomy of
biomedical research." JAMA 294(11): 1333-1342.
Murphy, R. F. (2011). "An active role for machine learning in drug development." Nature
chemical biology 7(6): 327-330.
Murphy, R. F. (2011). "An active role for machine learning in drug development." Nat Chem
Biol 7(6): 327-330.
Myers, S. and A. Baker (2001). "Drug discovery--an operating model for a new era." Nat
Biotechnol 19(8): 727-730.
Newman, D. J. (2008). "Natural products as leads to potential drugs: an old process or the new
hope for drug discovery?" J Med Chem 51(9): 2589-2599.
Oprea, T. I. and J. Mestres (2012). "Drug repurposing: far beyond new targets for old drugs."
AAPS J 14(4): 759-763.
Oprea, T. I., A. Tropsha, J. L. Faulon and M. D. Rintoul (2007). "Systems chemical biology."
Nat Chem Biol 3(8): 447-450.
Ou-Yang, S. S., J. Y. Lu, X. Q. Kong, Z. J. Liang, C. Luo and H. Jiang (2012). "Computational
drug discovery." Acta Pharmacol Sin 33(9): 1131-1140.
Pälvimäki, E.-P., H. Majasuo, A. Laakso, M. Kuoppamäki, E. Syvälahti, B. Roth and J. Hietala
(1996). "Interactions of selective serotonin reuptake inhibitors with the serotonin 5-HT2c
receptor." Psychopharmacology 126(3): 234-240.
Paolini, G. V., R. H. Shapland, W. P. van Hoorn, J. S. Mason and A. L. Hopkins (2006). "Global
mapping of pharmacological space." Nat Biotechnol 24(7): 805-815.

100
Paul, S. M., D. S. Mytelka, C. T. Dunwiddie, C. C. Persinger, B. H. Munos, S. R. Lindborg and
A. L. Schacht (2010). "How to improve R&D productivity: the pharmaceutical industry's grand
challenge." Nature reviews Drug discovery 9(3): 203-214.
Penmatsa, A. and E. Gouaux (2014). "How LeuT shapes our understanding of the mechanisms of
sodium‐coupled neurotransmitter transporters." The Journal of physiology 592(5): 863-869.
Perez, C., C. Koshy, Ö. Yildiz and C. Ziegler (2012). "Alternating-access mechanism in
conformationally asymmetric trimers of the betaine transporter BetP." Nature 490(7418): 126-
130.
Petersen, B. and A. Mørk (1996). "Chronic treatment with citalopram induces noradrenaline
receptor hypoactivity. A microdialysis study." European journal of pharmacology 300(1): 67-70.
Phillips, J. C., R. Braun, W. Wang, J. Gumbart, E. Tajkhorshid, E. Villa, C. Chipot, R. D. Skeel,
L. Kale and K. Schulten (2005). "Scalable molecular dynamics with NAMD." Journal of
computational chemistry 26(16): 1781-1802.
Pøhlsgaard, J., K. Frydenvang, U. Madsen and J. S. Kastrup (2011). "Lessons from more than 80
structures of the GluA2 ligand-binding domain in complex with agonists, antagonists and
allosteric modulators." Neuropharmacology 60(1): 135-150.
Quiocho, F. A. and P. S. Ledvina (1996). "Atomic structure and specificity of bacterial
periplasmic receptors for active transport and chemotaxis: variation of common themes."
Molecular microbiology 20(1): 17-25.
Raabe, R. and L. Gentile (2008). "Antidepressant interactions with the NMDA NR1-1b subunit."
Journal of Biophysics 2008.
Rachline, J., F. Perin-Dureau, A. Le Goff, J. Neyton and P. Paoletti (2005). "The micromolar
zinc-binding domain on the NMDA receptor subunit NR2B." The Journal of neuroscience 25(2):
308-317.
Rahmadi, M., M. Narita, A. Yamashita, S. Imai, N. Kuzumaki and T. Suzuki (2011). "Sleep
disturbance associated with an enhanced orexinergic system induced by chronic treatment with
paroxetine and milnacipran." Synapse 65(7): 652-657.
Reddy, A. S. and S. Zhang (2013). "Polypharmacology: drug discovery for the future." Expert
Rev Clin Pharmacol 6(1): 41-47.
Ripphausen, P., B. Nisius, L. Peltason and J. Bajorath (2010). "Quo vadis, virtual screening? A
comprehensive survey of prospective applications." J Med Chem 53(24): 8461-8467.
Saeh, J. C., P. D. Lyne, B. K. Takasaki and D. A. Cosgrove (2005). "Lead hopping using SVM
and 3D pharmacophore fingerprints." Journal of chemical information and modeling 45(4):
1122-1133.

101
Salakhutdinov, R. and A. Mnih (2008). Bayesian probabilistic matrix factorization using Markov
chain Monte Carlo. Proceedings of the 25th international conference on Machine learning, ACM.
Sarid-Segal, O., C. M. Knapp, W. Burch, M. A. Richardson, S. Bahtia, K. DeQuattro, M. Afshar,
C. Richambault, L. Sickels and E. Devine (2009). "The anticonvulsant zonisamide reduces
ethanol self-administration by risky drinkers." The American journal of drug and alcohol abuse
35(5): 316-319.
Schäfer, M. (2009). "Novel concepts for analgesia in severe pain—current strategies and future
innovations." European Journal of Pain Supplements 3(S1): 6-10.
Schames, J. R., R. H. Henchman, J. S. Siegel, C. A. Sotriffer, H. Ni and J. A. McCammon
(2004). "Discovery of a novel binding trench in HIV integrase." Journal of medicinal chemistry
47(8): 1879-1881.
Schlitter, J., M. Engels and P. Kruger (1994). "Targeted molecular dynamics: a new approach for
searching pathways of conformational transitions." J Mol Graph 12(2): 84-89.
Shan, Y., E. T. Kim, M. P. Eastwood, R. O. Dror, M. A. Seeliger and D. E. Shaw (2011). "How
does a drug molecule find its target binding site?" Journal of the American Chemical Society
133(24): 9181-9183.
Shaw, D. E., M. M. Deneroff, R. O. Dror, J. S. Kuskin, R. H. Larson, J. K. Salmon, C. Young, B.
Batson, K. J. Bowers and J. C. Chao (2008). "Anton, a special-purpose machine for molecular
dynamics simulation." Communications of the ACM 51(7): 91-97.
Shekhar, C. (2008). "In silico pharmacology: computer-aided methods could transform drug
development." Chem Biol 15(5): 413-414.
Shimamura, T., S. Weyand, O. Beckstein, N. G. Rutherford, J. M. Hadden, D. Sharples, M. S.
Sansom, S. Iwata, P. J. Henderson and A. D. Cameron (2010). "Molecular basis of alternating
access membrane transport by the sodium-hydantoin transporter Mhp1." Science 328(5977):
470-473.
Shuto, S., H. Takada, D. Mochizuki, R. Tsujita, Y. Hase, S. Ono, N. Shibuya and A. Matsuda
(1995). "(.+-.)-(Z)-2-(Aminomethyl)-1-phenylcyclopropanecarboxamide Derivatives as a New
Prototype of NMDA Receptor Antagonists." Journal of medicinal chemistry 38(15): 2964-2968.
Siegel, M. G. and M. Vieth (2007). "Drugs in other drugs: a new look at drugs as fragments."
Drug Discov Today 12(1-2): 71-79.
Singh, S. K., C. L. Piscitelli, A. Yamashita and E. Gouaux (2008). "A competitive inhibitor traps
LeuT in an open-to-out conformation." Science 322(5908): 1655-1661.

102
Singh, S. K., A. Yamashita and E. Gouaux (2007). "Antidepressant binding site in a bacterial
homologue of neurotransmitter transporters." Nature 448(7156): 952-956.
Sirota, M., J. T. Dudley, J. Kim, A. P. Chiang, A. A. Morgan, A. Sweet-Cordero, J. Sage and A.
J. Butte (2011). "Discovery and preclinical validation of drug indications using compendia of
public gene expression data." Sci Transl Med 3(96): 96ra77.
Sirota, M., J. T. Dudley, J. Kim, A. P. Chiang, A. A. Morgan, A. Sweet-Cordero, J. Sage and A.
J. Butte (2011). "Discovery and preclinical validation of drug indications using compendia of
public gene expression data." Science translational medicine 3(96): 96ra77-96ra77.
Sliwoski, G., S. Kothiwale, J. Meiler and E. W. Lowe, Jr. (2014). "Computational methods in
drug discovery." Pharmacol Rev 66(1): 334-395.
Smicun, Y., S. D. Campbell, M. A. Chen, H. Gu and G. Rudnick (1999). "The role of external
loop regions in serotonin transport Loop scanning mutagenesis of the serotonin transporter
external domain." Journal of Biological Chemistry 274(51): 36058-36064.
Smoot, M. E., K. Ono, J. Ruscheinski, P.-L. Wang and T. Ideker (2011). "Cytoscape 2.8: new
features for data integration and network visualization." Bioinformatics 27(3): 431-432.
Sobolevsky, A. I., M. P. Rosconi and E. Gouaux (2009). "X-ray structure, symmetry and
mechanism of an AMPA-subtype glutamate receptor." Nature 462(7274): 745-756.
Song, C. M., S. J. Lim and J. C. Tong (2009). "Recent advances in computer-aided drug design."
Brief Bioinform 10(5): 579-591.
Sorger, P. K., S. R. Allerheiligen, D. R. Abernethy, R. B. Altman, K. L. Brouwer, A. Califano,
D. Z. D'Argenio, R. Iyengar, W. J. Jusko and R. Lalonde (2011). Quantitative and systems
pharmacology in the post-genomic era: new approaches to discovering drugs and understanding
therapeutic mechanisms. An NIH white paper by the QSP workshop group, NIH Bethesda.
Sperandio, O., L. Mouawad, E. Pinto, B. O. Villoutreix, D. Perahia and M. A. Miteva (2010).
"How to choose relevant multiple receptor conformations for virtual screening: a test case of
Cdk2 and normal mode analysis." European Biophysics Journal 39(9): 1365-1372.
Stephan, M. M., M. A. Chen, K. M. Penado and G. Rudnick (1997). "An extracellular loop
region of the serotonin transporter may be involved in the translocation mechanism."
Biochemistry 36(6): 1322-1328.
Sugita, Y. and Y. Okamoto (1999). "Replica-exchange molecular dynamics method for protein
folding." Chemical Physics Letters 314(1): 141-151.
Sukumaran, M., M. Rossmann, I. Shrivastava, A. Dutta, I. Bahar and I. H. Greger (2011).
"Dynamics and allosteric potential of the AMPA receptor N‐terminal domain." The EMBO
journal 30(5): 972-982.

103
Summa, V., A. Petrocchi, F. Bonelli, B. Crescenzi, M. Donghi, M. Ferrara, F. Fiore, C. Gardelli,
O. Gonzalez Paz and D. J. Hazuda (2008). "Discovery of raltegravir, a potent, selective orally
bioavailable HIV-integrase inhibitor for the treatment of HIV-AIDS infection." Journal of
medicinal chemistry 51(18): 5843-5855.
Sun, Y., R. Olson, M. Horning, N. Armstrong, M. Mayer and E. Gouaux (2002). "Mechanism of
glutamate receptor desensitization." Nature 417(6886): 245-253.
Swann, S. L., S. P. Brown, S. W. Muchmore, H. Patel, P. Merta, J. Locklear and P. J. Hajduk
(2011). "A unified, probabilistic framework for structure-and ligand-based virtual screening."
Journal of medicinal chemistry 54(5): 1223-1232.
Takarabe, M., M. Kotera, Y. Nishimura, S. Goto and Y. Yamanishi (2012). "Drug target
prediction using adverse event report systems: a pharmacogenomic approach." Bioinformatics
28(18): i611-i618.
Tfelt-Hansen, P., P. Saxena, C. Dahlöf, J. Pascual, M. Lainez, P. Henry, H.-C. Diener, J.
Schoenen, M. Ferrari and P. Goadsby (2000). "Ergotamine in the acute treatment of migraine A
review and European consensus." Brain 123(1): 9-18.
Tirion, M. M. (1996). "Large amplitude elastic motions in proteins from a single-parameter,
atomic analysis." Physical review letters 77(9): 1905.
Traynelis, S. F., L. P. Wollmuth, C. J. McBain, F. S. Menniti, K. M. Vance, K. K. Ogden, K. B.
Hansen, H. Yuan, S. J. Myers and R. Dingledine (2010). "Glutamate receptor ion channels:
structure, regulation, and function." Pharmacological reviews 62(3): 405-496.
Vadivelu, N., S. Mitra and D. Narayan (2010). "Recent advances in postoperative pain
management." The Yale journal of biology and medicine 83(1): 11.
van Gunsteren, W. F. and H. J. Berendsen (1990). "Computer simulation of molecular dynamics:
Methodology, applications, and perspectives in chemistry." Angewandte Chemie International
Edition in English 29(9): 992-1023.
Wagner, B. K., T. Kitami, T. J. Gilbert, D. Peck, A. Ramanathan, S. L. Schreiber, T. R. Golub
and V. K. Mootha (2008). "Large-scale chemical dissection of mitochondrial function." Nat
Biotechnol 26(3): 343-351.
Wagner, L. E., M. Eaton, S. S. Sabnis and K. J. Gingrich (1999). "Meperidine and Lidocaine
Block of Recombinant Voltage‐Dependent Na+ Channels: Evidence that Meperidine is a Local
Anesthetic." Anesthesiology 91(5): 1481.
Walsh, C. T. and M. A. Fischbach (2009). "Repurposing libraries of eukaryotic protein kinase
inhibitors for antibiotic discovery." Proc Natl Acad Sci U S A 106(6): 1689-1690.

104
Wang, H., A. Goehring, K. H. Wang, A. Penmatsa, R. Ressler and E. Gouaux (2013). "Structural
basis for action by diverse antidepressants on biogenic amine transporters." Nature 503(7474):
141-145.
Wang, R., L. Liu, L. Lai and Y. Tang (1998). "SCORE: A new empirical method for estimating
the binding affinity of a protein-ligand complex." Molecular modeling annual 4(12): 379-394.
Warmuth, M. K., J. Liao, G. Rätsch, M. Mathieson, S. Putta and C. Lemmen (2003). "Active
learning with support vector machines in the drug discovery process." Journal of Chemical
Information and Computer Sciences 43(2): 667-673.
Wolber, G. and T. Langer (2005). "LigandScout: 3-D pharmacophores derived from protein-
bound ligands and their use as virtual screening filters." Journal of chemical information and
modeling 45(1): 160-169.
Xu, C., D. Tobi and I. Bahar (2003). "Allosteric changes in protein structure computed by a
simple mechanical model: hemoglobin T↔ R2 transition." Journal of molecular biology 333(1):
153-168.
Yamanishi, Y., M. Araki, A. Gutteridge, W. Honda and M. Kanehisa (2008). "Prediction of
drug–target interaction networks from the integration of chemical and genomic spaces."
Bioinformatics 24(13): i232-i240.
Yamanishi, Y., M. Kotera, M. Kanehisa and S. Goto (2010). "Drug-target interaction prediction
from chemical, genomic and pharmacological data in an integrated framework." Bioinformatics
26(12): i246-i254.
Yamashita, A., S. K. Singh, T. Kawate, Y. Jin and E. Gouaux (2005). "Crystal structure of a
bacterial homologue of Na+/Cl--dependent neurotransmitter transporters." Nature
437(7056): 215-223.
Yang, L.-W. and C.-P. Chng (2008). "Coarse-grained models reveal functional dynamics-I.
elastic network models–theories, comparisons and perspectives." Bioinformatics and biology
insights 2: 25.
Yang, L., J. Chen and L. He (2009). "Harvesting candidate genes responsible for serious adverse
drug reactions from a chemical-protein interactome." PLoS Comput Biol 5(7): e1000441.
Yang, L., G. Song, A. Carriquiry and R. L. Jernigan (2008). "Close correspondence between the
motions from principal component analysis of multiple HIV-1 protease structures and elastic
network modes." Structure 16(2): 321-330.
Yang, L., G. Song and R. L. Jernigan (2009). "Protein elastic network models and the ranges of
cooperativity." Proceedings of the National Academy of Sciences 106(30): 12347-12352.

105
Yera, E. R., A. E. Cleves and A. N. Jain (2011). "Chemical structural novelty: on-targets and off-
targets." Journal of medicinal chemistry 54(19): 6771-6785.
Yıldırım, M. A., K.-I. Goh, M. E. Cusick, A.-L. Barabási and M. Vidal (2007). "Drug—target
network." Nature biotechnology 25(10): 1119-1126.
Young, D. W., A. Bender, J. Hoyt, E. McWhinnie, G. W. Chirn, C. Y. Tao, J. A. Tallarico, M.
Labow, J. L. Jenkins, T. J. Mitchison and Y. Feng (2008). "Integrating high-content screening
and ligand-target prediction to identify mechanism of action." Nat Chem Biol 4(1): 59-68.
Zambrowicz, B. P. and A. T. Sands (2004). "Modeling drug action in the mouse with knockouts
and RNA interference." Drug Discovery Today: TARGETS 3(5): 198-207.
Zanelli, S. A., N. J. Solenski, R. E. Rosenthal and G. Fiskum (2005). "Mechanisms of Ischemic
Neuroprotection by Acetyl‐ l‐carnitine." Annals of the New York Academy of Sciences
1053(1): 153-161.
Zhao, S. and R. Iyengar (2012). "Systems pharmacology: network analysis to identify multiscale
mechanisms of drug action." Annu Rev Pharmacol Toxicol 52: 505-521.
Zhao, Y., D. Terry, L. Shi, H. Weinstein, S. C. Blanchard and J. A. Javitch (2010). "Single-
molecule dynamics of gating in a neurotransmitter transporter homologue." Nature 465(7295):
188-193.
Zhao, Y., D. S. Terry, L. Shi, M. Quick, H. Weinstein, S. C. Blanchard and J. A. Javitch (2011).
"Substrate-modulated gating dynamics in a Na+-coupled neurotransmitter transporter
homologue." Nature 474(7349): 109-113.
ZIMMER, M. and F. HOFMANN (1987). "Differentiation of the drug‐ binding sites of
calmodulin." European Journal of Biochemistry 164(2): 411-420.
Zou, J., P. Ji, Y. L. Zhao, L. L. Li, Y. Q. Wei, Y. Z. Chen and S. Y. Yang (2012). "Neighbor
communities in drug combination networks characterize synergistic effect." Mol Biosyst 8(12):
3185-3196.
Zou, J., S. D. Luo, Y. Q. Wei and S. Y. Yang (2011). "Integrated computational model of cell
cycle and checkpoint reveals different essential roles of Aurora-A and Plk1 in mitotic entry."
Mol Biosyst 7(1): 169-179.
Zou, J., M. W. Zheng, G. Li and Z. G. Su (2013). "Advanced systems biology methods in drug
discovery and translational biomedicine." Biomed Res Int 2013: 742835.