computational and experimental study of li-doped ionic ... · nitudes of . differences in the...
TRANSCRIPT

Computational and Experimental Study of Li-Doped
Ionic Liquids at Electrified Interfaces
Justin B. Haskins† and John W. Lawson⇤,‡
AMA Inc., Thermal Materials Protection Branch, Mail Stop 234-1, NASA Ames Research
Center, Moffett Field, California 94035, USA, and Thermal Materials Protection Branch,
Mail Stop 234-1, NASA Ames Research Center, Moffett Field, California 94035, USA
E-mail: [email protected]
⇤To whom correspondence should be addressed
†AMA Inc., Thermal Materials Protection Branch, Mail Stop 234-1, NASA Ames Research Center, Mof-
fett Field, California 94035, USA
‡Thermal Materials Protection Branch, Mail Stop 234-1, NASA Ames Research Center, Moffett Field,
California 94035, USA
1
https://ntrs.nasa.gov/search.jsp?R=20190001418 2020-08-02T11:56:56+00:00Z

Abstract
We evaluate the influence of Li-salt doping on the dynamics, capacitance, and struc-
ture of three ionic liquid electrolytes, [pyr14][TFSI], [pyr13][FSI], and [EMIM][BF4],
using molecular dynamics and polarizable force fields. In this respect, our focus is on
the properties of the electric double layer (EDL) formed by the electrolytes at the elec-
trode surface as a function of surface potential ( ). The rates of EDL formation are
found to be on the order of hundreds of picoseconds and only slightly influenced by the
addition of Li-salt. The EDLs of three electrolytes are shown to have different energy
storage capacities, which we relate to the EDL formation free energy. The differential
capacitance obtained from our computations exhibits asymmetry about the potential
of zero charge and is consistent with the camel-like profiles noted from mean field the-
ories and experiments on metallic electrodes. The introduction of Li-salt reduces the
noted asymmetry in the differential capacitance profile. Complementary experimental
capacitance measurements have been made on our three electrolytes in their neat forms
and with Li-salt. The measurements, performed on glassy carbon electrodes, produce
U-like profiles, and Li-salt doping is shown to strongly affect capacitance at high mag-
nitudes of . Differences in the theoretical and experimental shapes and magnitudes
of capacitance are rationalized in terms of the electrode surface and pseudocapacitive
effects. In both neat and Li-doped liquids, the details of the computational capacitance
profile are well described by -induced changes in the density and molecular orienta-
tion of ions in the molecular layer closest to the electrode. Our results suggest that the
addition of Li+ induces disorder in the EDL, which originates from the strong binding
of anions to Li+. An in-depth analysis of the distribution of Li+ in the EDL reveals
that it does not readily enter the molecular layer at the electrode surface, preferring
instead to be localized farther away from the surface in the second molecular layer.
This behavior is validated through an analysis of the free energy of Li+ solvation as a
function of distance from the electrode. Free energy wells are found to coincide with
localized concentrations of Li+, the depths of which increase with and suggest a
source of impedance for Li+ to reach the electrode.
2

Keywords. molecular dynamics, differential capacitance, electric double layer, super-
capacitor
3

Introduction
Recent material advances1–3 have led to improvements in the energy density and delivery
of electrochemical capacitors.4 Typically, these utilize a liquid electrolyte to store energy
non-Faradaically at the electrode surface, with the electrolyte interfacial layer being referred
to as the electric double layer (EDL). As it stands, ionic liquids are appealing electrolytes5–10
as they are more electrochemically stable than conventional organic electrolytes, which allows
the use of a large voltage bias for greater energy storage. Furthermore, ionic liquids readily
solvate Li+ and have shown stable operation in Li-ion11,12 and more advanced13–17 batteries,
which invites the possibility of developing hybrid battery/capacitor devices.18 Combined with
the favorable properties of ionic liquid electrolytes, nanostructuring the electrode interface
to obtain high surface area and pores19–29 can lead to further gains in capacitance, though
more exact optimization in this way will require an in-depth understanding of the interplay
between electrode and EDL structure.
An important measure of the ability of a given electrolyte to store energy at an electrode
is the differential capacitance (Cdl), which is defined as the rate of change of surface charge
density (h�i) with surface potential (h i), or @h�i/@h i. Cdl is a highly sensitive function of
electrolyte molecular size, weight, and shape and can thus provide information regarding the
structure of the EDL. In this respect, the tolerance of Cdl to electrolyte molecule characteris-
tics has been extensively investigated, particularly the dependence of chain length of various
imidizolium and pyrrolidinium cations, the size of fluorinated anions (e.g. [BF4]� versus
[PF6]�), and the weight of elemental halogen anions.5,7–10,30–32 Broadly speaking, the results
show that Cdl assumes characteristic profiles in different liquids, which include the single
maximum “bell,” the dual maxima “camel,” and single minimum “U” profiles,31 while the
magnitudes are generally3 between 5-20 µF/cm2. Furthermore, the potential of zero charge
(h i0) determined from these profiles is generally assumed to be at an extrema, either the
peak of the bell curve or the valley of the camel curve. Cdl often exhibits anisotropy about
4

this point, which can be exacerbated by large disparities in cation and anion size.
As a means of obtaining a more detailed understanding of the interplay between EDL
structure and capacitance, several experimental approaches have been developed to quantify
molecular density and configuration at the electrode surface under potential bias. Both
X-ray reflectivity33–36 and atomic force microscopy37–42 yield general information on ion
distribution within the EDL. These methods have been used to characterize the layered
structure (i.e. alternating layers of cations and anions) of the EDL and, in specific cases, have
provided coarse information about surface ion configuration.39 Other methods, including X-
ray photoelectron spectroscopy43 and sum frequency generation spectroscopy44–48 allow the
resolution of finer details of surface ions, including average orientations of ion moieties with
respect to the surface.
With respect to theory, the mean field theory lattice gas model developed by Korny-
shev49 correlates ion structure to differential capacitance. The mean field approach expands
upon the earlier Guoy-Chapman-Stern model of the response of dilute electrolytes to elec-
trified interfaces to include the effect of ion size and density, which are important in dense
ionic systems. Through the incorporation of these effects, the mean field model success-
fully reproduces the characteristic “bell” and “camel” Cdl profiles noted in experiment,3,49–52
with differences between the packing efficiency of anions and cations at the electrode surface
leading to the aforementioned anisotropy about h i0. However, because detailed molecular
correlation effects are difficult to include in the mean field model, the resulting Cdl captures
only the most general aspects of differential capacitance, though more complex theories that
incorporate ion correlation effects have been proposed.53
Alternatively, molecular dynamics (MD) simulations can provide atomic-level insight
into the behavior of ionic liquids at electrified interfaces. Such simulations have show
success in detailing the structure of the EDL,54–56 the EDL capacitance as a function of
h i,25,57–65 and the influence of electrode structure (e.g. porosity and curvature) on EDL
behavior.20,23,24,26–28,66–74 Of note, recent united atom MD simulations have been used to
5

explore the structural origin of Cdl for a number of ionic liquids.24,29,61,62,74,74,75 These sim-
ulations have successfully correlated Cdl to the structure of ions at the surface of both
ideal24,29,61,62,74,75 and non-ideal electrodes.74
The present work extends the use of MD simulations to the study of Li-doped ionic liquids
at electrified interfaces. In general, there have been few investigations on this topic, despite
its importance for batteries and hybrid battery/capacitor devices.76,77 This is related perhaps
to the complex energetics of Li+ solvated in ionic liquids, which can be difficult to represent
with conventional force fields.78,79 These issues are overcome here by using the atomic polar-
izable potential for liquids, electrolytes, and polymers (APPLE&P),80–82 which accurately
captures the energetics and dynamics of a range of Li-doped ionic liquids.78,79,83,84 Further-
more, the use of APPLE&P allows the electrolyte to polarize in response to an electrified
interface, which has been shown to impact both the EDL structure and capacitance.85 We
perform these simulations on three ionic liquids of electrochemical interest,11–17 N -methyl-N -
butylpyrrolidinium bis(trifluoromethanesulfonyl)imide ([pyr14][TFSI]), N -methyl-N -propyl-
pyrrolidinium bis(fluorosulfonyl)imide ([pyr13][FSI]), and 1-ethyl-3-methylimidazolium boron
tetrafluoride ([EMIM][BF4]), in both their neat and Li-doped form. The simulations are per-
formed using a model capacitor system with two electrodes (see Fig. 1) having a constant
potential difference (� ) imposed by dynamically updating surface charge throughout the
simulation. We investigate these liquids for 0 V � 4.2 V, which is approximately
within the electrochemical windows of the electrolytes, and for Li-salt mole fractions (xLi)
of 0.0 and 0.2.
As an outline of this work, we first evaluate the influence of Li+ on the most general as-
pects of the EDL evolved at the electrode surface, including formation times, energetic con-
tent, and differential capacitance, where differential capacitance is computed with a modified
version of recently developed fluctuation formulas.56,85 The properties are then correlated to
the molecular structure of the EDL by analyzing the ion density and configuration at the
interface. Finally, we complement the structural analysis by a detailed examination of the
6

distribution, binding and solvation free energy of Li+ in the EDL.
Methods
Ionic Liquid Interatomic Potential
We employ the atomic polarizable potential for liquids, electrolytes, and polymers (AP-
PLE&P) as parameterized by Borodin and coworkers80–82 for the ionic liquids of interest in
the present work. Through extensive testing,79,81,83,84,86 APPLE&P has been shown to ac-
curately capture the thermodynamic behavior of a vast array of ionic liquids as well as ionic
liquid systems containing Li-salt. While many of the energetic interactions in APPLE&P
are standard to molecular dynamics simulations, including harmonic bonded interactions,
the exponential-6 Buckingham potential, and Coulomb interactions between point charges,
APPLE&P includes a self-consistent measure of atomic polarization. Each atom is assigned
an atomic polarizability (↵) which yields an atomic dipole moment (µ) proportional to the
electric field, µi = ↵E(ri). To obtain the induced dipoles, one must iteratively update the
electric field with induced dipole contributions until the total polarization energy,
Upol = �1
2
X
i
µi · E0(ri), (1)
where E0(ri) is the electrostatic field contribution from permanent charges only, converges.
Further details of the force field as used for these ionic liquids can be found elsewhere.79–81
Electrode Model
The model capacitor employed here is composed of two electrodes, between which is
ionic liquid, as shown in Fig. 1. The use of two electrodes is a practical means of creating
7

electrified interfaces while maintaining charge neutrality (i.e each system is composed of a
negative and positive electrode that are oppositely charged). The geometry of our model
capacitor is taken to be that of a slab, with the system being periodic in the (x,y), or in-
plane, directions and having a finite thickness Lz in the z-direction. The region beyond
the electrodes in the z-direction is assumed to be an infinite vacuum. Problematically,
standard long range electrostatic summation techniques, namely the Ewald summation and
particle-mesh methods, assume the system has full three dimensional periodicity, which is
not appropriate for slab geometries employed here. To correct for this, there are exact forms
of the two dimensional Ewald summation87 as well as corrections to the three dimensional
Ewald summation that approximate slab conditions.88 As described in detail elsewhere,85
we have tested both approaches in slab systems and have found the correction to the three
dimensional Ewald to be in excellent agreement with the two dimensional Ewald summation.
The correction method, as originally described by Yeh and coworkers,88 assumes a system of
slab geometry being separated by a suitable distance from its periodic image normal to the
slab such that mutual slab-slab interactions are approximately dipolar. Though originally
developed for systems of interacting point charges, we have extended this correction to
account for the long-range interaction of point charges with the atomic dipoles produced
from the polarizable force field, yielding
U2Dcorr =
1
2✏0M2
z , (2)
where ✏0 is the permittivity of free space and Mz is the net dipole moment in the z-direction,PN
i=1 (qizi + µzi).
The electrodes are treated as rigid bodies, with the positions of the electrode atoms held
fixed throughout the simulations. The electrode atoms interact with the ionic liquids through
both repulsive dispersive interactions, as described by the Buckingham potential, as well as
through electrostatic interactions. To approximate the electrode surface as metallic, we follow
8

the convention89 of treating charges on electrode atoms as Gaussians with a half maximum
width of 0.5; the electrode atoms do not have induced dipoles. A constant potential difference
(� ) is maintained between the electrodes during a given simulation. This is achieved
by dynamically distributing electrode charge using a modified version of a procedure first
implemented by Siepmann89 and later adapted to interactions between electrified interfaces
and organic and ionic liquid electrolytes.61,63,90 In this approach the total Hamiltonian, H,
is given by
H = UK + URD + UES � A|�|� , (3)
where UK is kinetic energy, URD is the repulsive-dispersive energy, UES is the total elec-
trostatic energy, A is the electrode surface area, |�| is the absolute value of the electrode
surface charge density on either the positive (�+) or negative (��) electrode (�+ = ���),
and � = + � � is the potential difference set between the positive ( +) and negative
( �) electrodes. As detailed elsewhere,85 the charges on the electrode atoms are updated
under the constraint that the charge on the positive electrode balances that on the negative
electrode until @H/@q+i = @H/@q�i = 0, where q+i and q�i are charges on individual atoms in
the positive or negative electrode.
EDL Thermodynamics
We now derive several useful thermodynamic relationships for the EDL free energy and
capacitance that can be evaluated from MD simulations that employ our model capacitor
with the constant-� condition. The Helmholtz free energy of our model capacitor, F, can
be written as, F = ���1ln (⌦), where � is defined as the inverse product of Boltzmann’s
constant and temperature (1/kbT ), H is the Hamiltonian of our system defined in Eq. 3, and
⌦ is the partition function of the system, which is given by the integral of e��H over phase
9

space. The partial derivative of F with respect to � is then given by,
@F
@� = �Ah|�|i � A�
⌧@|�|@�
�+
⌧@UES
@�
�, (4)
where the terms containing h@|�|/@� i and⌦@UES/@�
↵arise from implicit, instantaneous
dependencies of charge and energy on � introduced by the constant-� procedure. By
integrating this function over � , one may obtain the free energy of EDL formation on both
electrodes.
It is more informative, however, to obtain changes in F for the charging of individual
electrode surfaces (i.e. separating the energetic contributions of the positive and negative
electrodes), or @F/@h i. Such a value can be expanded as
@F
@h i =@F
@�
@�
@h i . (5)
Taking the derivative of the ensemble average of surface potential difference, given by
h i =R e��Hdr/
Re��Hdr, where � is the inverse product of temperature with Boltz-
mann’s constant and r represents the atomic configuration of our system, with respect to
� leads to @�
@h i
��1
=
⌧@
@�
�+ �A h|�|� i . (6)
For the systems of interest in the present work, we have found numerically that h@ /@� i,
representing the instantaneous change of electrode potential with a change in potential dif-
ference, is approximately ±0.5, while the fluctuation of potential, � = �h i, and surface
charge can be easily obtained during the molecular dynamics simulation. Combining Eq. 5
and Eq. 6, one obtains
�F edl =
Z h if
h i0
@F
@�
⌧@
@�
�+ �Ah|�|� i
��1
dh i, (7)
where �F edl is the potential dependent EDL formation free energy difference between the
10

potential of zero charge, h i0 and h if .
As detailed elsewhere,56,85 fluctuation formulas can be derived to define Cdl as a function
of h i. As with free energy before, one may take the derivative of the average surface charge,
h�i =R�e��Hdr/
Re��Hdr, with respect to � to approximately yield
@h�i@�
=
⌧@�
@�
�+ �A h|�|��i , (8)
where h@�/@� i is again attributed to implicit dependencies of charge on the defined value
of � .
This represents the total differential capacitance of our two-electrode, model capacitor.
The capacitance of an isolated electrode is valuable for understanding the comparative be-
havior of EDLs at the positive and negative electrodes. To obtain such a quantity, we can
write @h�i/@h i = @h�i/@� ⇥ @� /@h i, which, when combined with Eq. 6, gives
@h�i@h i =
@h�i@�
⌧@
@�
�+ �A h|�|� i
��1
. (9)
The complete derivation of this equation is described elsewhere.85
As a final note on the thermodynamic expressions, one may leverage Eq. 8 to rewrite
�F edl in terms of surface charge. Starting with @F/@h�i = @F/@� ⇥ @� /@h�i, the
charge dependent free energy of EDL formation is given as
�F edl =
Z h�if
0
@F
@�
⌧@�
@�
�+ �A h|�|��i
��1
dh�i, (10)
where �F edl is the free energy difference between the system having, on average, no electrode
charge to a value of h�if .
Solvation Free Energy
11

To understand the interplay between surface structure and Li-salt doping, we perform a
free energy analysis on Li+ solvation in the EDL as a function of �z and h i. In general,
the solvation free energy of a given molecule is computed along a thermodynamic cycle that
takes the molecule from a gaseous state to a solvated state in a liquid bath. However, the
solvation of a single ion, like Li+, into an electrolyte leads to a charge imbalance, which can
lead to errors that makes the determination of solvation free energy difficult. To overcome
this difficulty, we compute the free energy using a thermodynamic cycle that solvates Li+
into the electrolyte of our model capacitor system and simultaneously balances the resulting
charge by countercharging an electrode. The simplest form of such a cycle is
F s(0) = �F Li0(g)!Li0(l) +�FLi0(l)!Li+(l)�=0!�=�1 ��F edl. (11)
We first compute the solvation free energy of a neutral Li0 from a gaseous state to a sol-
vated state in the electrolyte of our model capacitor system, given by �F Li0(g)!Li0(l). This
interaction is mediated through repulsive-dispersive interactions and the response of Li+
polarizability to the electrolyte. To ensure the Li0 is solvated into the bulk-like region, we
constrain the trajectory of Li+ over the course of the MD simulation to ensure the value of
z is zero, or at the midpoint between our electrodes (such a procedure is later validated by
our results, which show a constant value of solvation free energy when �z > 20 Å from the
electrode surface). We then calculate the free energy of charging Li0 to Li+ while simultane-
ously balancing the ion by charging one of the electrodes to a value of -1 a.u., �FLi0(l)!Li+(l)�=0!�=�1 ,
which overcomes the charge imbalance issues encountered when solvating an ion into a bulk
liquid system. The solvation free energy of Li+ at z = 0, �F s(0), can then be obtained
by removing �F edl induced from charging the electrode through Eq. 10. We later denote
�FLi0(l)!Li+(l)�=0!�=�1 ��F edl as simply �F Li0(l)!Li+(l), or the free energy of charging the Li+.
To understand barriers to Li+ translation within the EDL, we perform additional com-
putations to determine the change in free energy as a function of z, or distance from the
12

electrode, �z. We first perform MD simulations having Li+ constrained to various values
of z throughout the EDL and, for each simulation, determine the average value of force on
Li+ in the z-direction, hfLiz i. The formalism known as the “blue-moon” ensemble91 relates
the constrained forces to the derivative in free energy with respect to z-direction translation.
This results in our z-dependent solvation free energy taking the form
F s(z) = F s(0)�Z z
0
hfLi+z i|z0dz0, (12)
where hfLi+z i|z0 represents the z-directional force when Li+ is constrained to z0. Similar
approaches without constraints have been employed successfully to study ion free energetics
within the EDL.77,92–94 However, our use of a constraint-based method allows a better probe
of regions where Li+ density is negligible over the course of a standard MD simulation, which
can lead to more accurate averaging of hfLiz i|z0
Molecular Dynamics Simulations
We have performed MD simulations on six ionic liquid systems in total, which include
[pyr14][TFSI], [pyr13][FSI], and [EMIM][BF4] having xLi values of 0.0 and 0.2. Our simu-
lations employ three-layer graphite electrodes interfaced with the ionic liquids; the normal
of the basal plane defines the z-direction. The distance between the electrode surfaces is 10
nm, as shown in Fig. 1, which our tests have indicated results in practically non-interacting
double layers; the in-plane, periodic dimensions are 2.46 nm ⇥ 2.58 nm. The systems are
constructed by first equilibrating a large ionic liquid bath to the desired T and P conditions.
Upon reaching equilibrium, the electrodes are inserted into the bath, and a stoichiometric
number of ionic liquid pairs are removed to create a 3.14 Å vacuum buffer region around the
electrodes. The system is then allowed to equilibrate under isobaric-isothermal conditions
(NPT) for 10 ns, after which the average number of ion pairs in the electrode region can be
13

obtained. We then generate electrode systems with slab geometry (periodic in the x and y
directions only) filled with the number of ionic liquid pairs determined from the bath simu-
lations. For reference, both the net system size and total simulation lengths are provided in
Table 1.
The MD simulations in the present work are performed at T = 363 K, which is elevated
when compare to most experiments on capacitors. This is necessary, however, to increase
the glassy dynamics of Li-doped ionic liquids so that the EDL structure and capitative be-
havior can be suitably represented on MD time-scales. Time-integration is performed by the
rRESPA95 algorithm and a timestep of 3.0 fs, with the multiple time step partitions being
provided in a previous work.79 The long range electrostatics are performed with a coupled
Ewald summation/reaction field formalism, whereby charge-charge and charge-dipole inter-
actions are performed with an Ewald summation and dipole-dipole interactions are evaluated
using a reaction field. The dipoles are updated self-consistently until the net dipole energy
changes by less than 10�8 kcal/mol. Local non-bonded interactions, which include explicit
Coulomb and repulsive-dispersive interactions, are performed within a cutoff of 12 Å for the
[pyr14][TFSI] and the [pyr13][FSI] systems and 11 Å for the [EMIM][BF4] systems. The
electrode charge is updated every five time steps in the outermost rRESPA parition with the
constant potential formalism such that the error in � is less than 0.05 V.
Experimental Techniques
The [pyr14][TFSI] (99%), [pyr13][FSI] (99.9%), and [EMIM][BF4] were purchased from
IOLITEC, Solvionic, and Fliua Analytical respectively. The corresponding salt, Li[TFSi]
(>99.0%) and Li[BF4] (99.998%) were purchased from Aldrich, and Li[FSI] (99%) was pur-
chased from Sarchem Laboratories. All the ionic liquids and the corresponding salts were
dried at 120oC under vacuum for 10 hours before use. The differential capacitance measure-
ments were completed in a Swagelok (USA) cell using glassy carbon (purchased from BAS) as
14

working electrode, a coiled platinum (Pt) wire as a counter electrode, and a silver (Ag) wire as
reference. The glassy carbon electrode was first polished following the procedures suggested
from the vendor. All the cell components were dried at 90oC under vacuum for 2 hours. The
cell was then assembled and the ionic liquids were introduced in a the glove box. A Solartron
1287 potentiostat/galvanostat in combination with a model 1255B frequency response an-
alyzer was used for cyclic voltammetry (CV) and electrochemical impedance spectroscopy
(EIS) experiments (performed at room temperature). AC signal of 10 mV amplitude with
frequency 1000 Hz at different DC voltage was used for the potential-dependent capacitance
measurement. The measured impedance was normalized to the geometric electrode area.
Results
EDL Formation and Capacitance
Formation Times
The dynamics of EDL formation can be determined by considering the evolution of � from
a � = 0 to a � > 0 state as a function of time. We initially equilibrate our ionic liquid
systems at 363 K and� = 0 V for 10 ns. Using the system so equilibrated, we impose a non-
zero� and track surface charge density until it converges, as shown in Fig. 2 for ionic liquids
exposed to electrodes having � values of 2.1 and 4.2 V. For the potentials investigated,
the surface charge reaches an equilibrium value in less that 1 nanosecond, though the exact
value appears to be dependent on Li-salt content. We quantify the formation rate in Table 2
through a characteristic formation time, ⌧edl, that is obtained from a simple fit of surface
charge, given by � = h�i(1�e�t/⌧edl), where h�i is the average value of surface charge density
and t is time. A comparison of ⌧edl across the ionic liquid systems shows that the formation
time in [pyr14][TFSI] > [pyr13][FSI] > [EMIM][BF4]. Interestingly, this hierarchy is inverse
15

to that of the diffusion coefficient, implying liquids with higher diffusion coefficients exhibit
faster EDL formation times and thereby faster charging. Furthermore, both surface potential
and Li-salt doping have a strong effect on the charging times. The difference in the value
of ⌧edl at � = 2.1 V versus 4.2 V changes from 193 ps to 318 ps, 64 ps to 216 ps, and 33
to 48 ps for [pyr14][TFSI], [pyr13][FSI], and [EMIM][BF4], respectively. The effect of Li-salt
doping is to increase ⌧edl by a factor of ⇠2-5 with � = 2.1 V and ⇠ 1.2 � 3 with � =
4.2 V, which, sensibly, suggests the effect of Li+ on EDL formation is reduced under a larger
driving force, � .
Differential Capacitance
The differential capacitance of our neat and Li-doped ionic liquid systems is shown in
Figure 3. For all three liquids at � 4.2 V, we find that Cdl ranges from 3 to 6 µF/cm2,
depending on h i. The average values of Cdl are markedly similar for our three liquids, 4.4,
4.5, and 4.5 µF/cm2 for neat [pyr14][TFSI], [pyr13][FSI], and [EMIM][BF4], respectively.
At high values of h i we see, as expected, lower values of differential capacitance. These
results agree well with previous MD simulations on ionic liquids,24,61,62 which yield average
values between 4-6 µF/cm2. The agreement of our results with experiment, however, is
less clear, with ionic liquids on various electrode materials and probed with various tech-
niques yielding very different values of Cdl. The general range of experimentally determined
differential capacitance of ionic liquids spans 2-20 µF/cm2,5,7–10,96–98 which bounds our re-
sults. The probable explanation for higher experimental values and variances of Cdl are
pseudo-capitative processes that include, namely, ion adsorption onto the electrode. Our
MD simulations do not currently account for these effects but rather provide a pure measure
of the EDL mediated capacitance.
Addressing the ionic liquids systems having xLi = 0, as shown in Figure 3 a,c, and e, we see
that each system displays a distinct Cdl profile. For [pyr14][TFSI] and [pyr13][FSI], we note
16

that Cdl assumes the characteristic “camel” shape, with [pyr14][TFSI] having a large peak
occurring between 0 V and 1V and [pyr13][FSI] having a larger peak differential capacitance
at negative potentials. Both of these features agree with previous united atom simulations
of neat [pyr13][TFSI] and [pyr13][FSI] ionic liquids.24,61,62 On the other hand, results for
[EMIM][BF4] are only slightly asymmetric, with an incrementally higher maximum value of
Cdl at negative potentials. For the systems having Li-salt, we see subtle differences in the
shapes of Cdl in all three systems, while the average magnitudes of Cdl are not significantly
different from those of the xLi = 0 systems. The primary impact of Li-doping on Cdl appears
to be a softening of the asymmetry between positive and negative potentials, the origin of
which will be probed later through a structural analysis. In all cases, we find that Cdl roughly
has a minima at h i0, and this corresponds to the midpoint of the antisymmetric “camel”
profile.
Experimental measurements, complimentary to our simulations, are shown in Figure 4
for the three ionic liquids of interest in the present work in both the neat form and having
xLi = 0.2. For the neat systems, Cdl is U-like in character and has an average magnitude of
13.9, 27.2, and 9.9 µC/cm2 for [pyr14][TFSI], [pyr13][FSI], and [EMIM][BF4], respectively.
Similarly, for the Li-doped systems, differential capacitance adopts the U-shaped profile and
has an average magnitude of 16.0, 17.4, and 16.5 µC/cm2 for [pyr14][TFSI], [pyr13][FSI], and
[EMIM][BF4], respectively. The addition of Li-salt appears to generally increase capacitance
at higher surface potentials, likely due to plating or Li-mediated pseudo-capacitive processes.
The major exception to this is found in [pyr13][FSI] system, which exhibits a reduction in
capacitance upon addition of Li-salt.
Comparing our computational and experimental results is challenging as the systems are
fundamentally different on a number of levels. First of all, the basic shape of capacitance
is camel-like in our computational results and U-like in our experimental results. For a
given ionic liquid, glassy carbon electrodes have been shown31 to lead to more U-like Cdl
profiles, while metallic electrodes produce capacitance profiles that are more camel-like. As
17

we treat our model electrode as an ideal metal, the camel-like character is dominant and
reasonable. Our computational differential capacitance also provides a lower bound to the
experimental measurements. Surface roughness, such as that present on such glassy carbon
surfaces, has been shown to lead to anomalous increases in capacitance.29 Addressing the
overall magnitude, our theoretical results an experiments are most similar at low values
of surface potential, where one would expect the smallest influence from pseudocapacative
effects (e.g adsorption and decomposition). At large magnitudes of surface potential, such
processes certainly influence the value of capacitance. The surface structure of our ideal
electrode is quite different from that of a glassy carbon electrode, and our computational
models do not account for pseudo-capacitive processes.
Free Energy of Formation
Leveraging the fluctuations obtained from our differential capacitance computations, we
apply Eq. 7 to obtain �F edl, as shown in Figure 5, which, along with h�i, is displayed as a
function of h i for our electrolytes in their neat form. Each of the �F edl profiles exhibits
a quasi-parabolic behavior as a function of h i and are predominantly symmetric. The
fact that the asymmetry in Cdl does not strongly manifest in these systems in not entirely
surprising as, at a given value of � , the difference in Cdl between the two electrodes is
generally < 1 µF/cm2. The relative ordering of �F edl between the three liquids appears to
change depending on the h i range. At h i < 0.0 V, the value of �F edl in [EMIM][BF4]
< [pyr14][TFSI] < [pyr13][FSI] until h i �1.5 V, where [pyr13][FSI] rapidly overtakes
the other liquids to have the smallest value of �F edl at h i ⇠ �2.1 V. At h i > 0.0 V,
we see similar values of �F edl between the systems, though [EMIM][BF4] is slightly higher,
until h i ⇠ 1 V, where with increasing potential �F edl in [pyr13][FSI] < [EMIM][BF4] <
[pyr14][TFSI]. Of course, a liquid having a smaller value �F edl is generally implied from
larger values of h�i across a potential range, which follows from Eq. 4. To this point, at
18

the extreme values of h i, ⇠ ±2.1 V , |h|�|i| is found to be 9.11, 9.99, and 9.52 µC/cm2 for
[pyr14][TFSI], [pyr13][FSI], and [EMIM][BF4], respectively, which reflects the aforementioned
the order of �F edl at these potentials. In the case of liquids having Li-salt, we note that
there are only slight changes in the free energetics, with the energies of the three liquids
again having magnitudes and orderings similar to those of the neat system.
EDL Structure
Ion Density Profiles
As an initial means of characterizing the influence of Li-doping on the structure of the
EDL, we now look at average ion density profiles as a function of distance from the electrode,
⇢(�z). In this way, ⇢(�z) is computed on a per atom basis and normalized by the total
number of ion atoms in the simulation cell. Though we have performed computations with
various values of � , we choose representative values that give an adequate sampling of the
structures observed in our simulations, namely the equipotential condition, � = 0, and
our upper limit of potential difference, � = 4.2 V. In the ion density profiles in Figure 6,
the total ion density is given as a black dashed and double dotted line, the cation density
is given as a blue dashed line, anion density is given as a red dashed-dotted line, and the
density of Li+ is given as a solid green line. Furthermore, we present only neat and Li-doped
[pyr14][TFSI] in Figure 6 as the prototypical case for all of our electrolytes, with the few
differences in EDL structure between the electrolytes being explicitly mentioned. The full
ion density profiles for [pyr13][FSI] and [EMIM][BF4] can be found in Figures S1 and S2,
respectively, of the supporting information.99
For the case of � = 0, as shown in Figure 6 a, there is a reasonable degree of fluctuation
in ⇢(�z) near the surface, which drops off to bulk densities at�z⇠15 nm. The density fluctu-
ations under no potential bias imply that the layer of ions at the surface is enriched in either
cations or anions, which will be later characterized by looking at surface ion populations.
19

The density fluctuations under no potential bias could represent the response to ion ordering
or enrichment in a preferred ion at the electrode surface. In this respect, we note that the
surface ions should be encompassed within the first minimum in total ion density, which is
< 5� 7 Å, depending on the liquid. The addition of Li-salt, as shown in Figure 6 b, results
in only nominal changes to the surface ion layer. In fact, there is practically no trace of Li+
within the surface ion layer itself, although a strong, though asymmetric, peak is present
in the second ion layer near the interface of the first and second layers, occurring between
4-10 Å. This is in qualitative agreement with trends noted from previous MD simulations of
the EDL of organic and ionic liquid electrolytes,62,77 with strong solvation effects presenting
a barrier to Li+ entering the surface layer. This also reinforces the previously mentioned
independence of h i0 to Li-doping, as the surface layer nearest the electrode is relatively
unchanged. Aside from the peak in the second ion layer, Li+ is distributed almost evenly
throughout the �z>10 Å region. The slight variations in Li+ density in this region, as can
be noted clearly in the total ion density profile, are due to strong and long-lived Li+/Anion
binding and network formation noted in previous works.78,79
The segregation of cations and anions into distinct layers and the densification of the
layers in close proximity to the cathode is shown in the density profiles of Figure 6 c and
d. In the case of the neat liquid in Figure 6 c, we see the surface ion layer is predominantly
composed of anions, which leads to strong fluctuations in density that drop off to the bulk
density by �z⇠25 Å, though small fluctuations in density can be seen to persist up to 50 Å.
The addition of Li-salt disrupts layering in the EDL, leading to an uneven total ion density
profile, as shown in Figure 6 d. As with the � = 0 V case, Li+ is again asymmetrically
distributed within the second ion layer, being preferentially localized nearer to the first layer,
and is not present in the first ion layer. For [pyr14][TFSI] in Figure 6 c and [pyr13][FSI]
in Figure S1 c, beyond this localization a region void of Li+ develops at �z ⇠ 8 � 14 Å,
followed by a diffuse accumulation at 15-25 Å. For [EMIM][BF4], shown in Figure S2 c,
this void region is not present, and, aside from the initial peak in the second ion layer, Li+
20

appears to be evenly distributed through the EDL.
Ionic liquids near the anode exhibit a layered order akin to that at cathode, as shown
in Figure 6 e and f, with primarily cations in the surface ion layer. For the neat system,
as shown in Figure 6 e, the fluctuations in ion density again dissipate after �z⇠25 Å, with
the exception being the long range fluctuations of [pyr13][FSI] that dissipate after �z ⇠40
Å, as shown in Figure S1 e. As can be clearly noted, the second ion layer, which here is a
cation layer, is more prominent than the second ion layer at the cathode. The introduction
of Li-salt, given in Figure 6 f, disrupts the long-range ordering of ions and leads to abrupt
peaks in the total ion density that suggest a large accumulation of Li+ in the EDL. In this
case it appears that Li+ is asymmetrically distributed with a preference for residing near
the interface of the second and third ion layers. Additionally, we see the previously noted
trend of no Li+ in the surface ion layer. Instead, and for all three liquids (Figure S1 f and
S2 f), the Li+ density is localized primarily within the anion layers, and each anion layer has
an associated localization of Li+ density. Altogether the EDL at the anode appears to have
more Li+ concentration than at the cathode. To elaborate on the structures and energetic
trends noted here, we later investigate the bonding and free energetics of Li+ in the double
layer.
Surface Ion Layer
To provide a more descriptive measure of surface structure behavior beyond the global
ion density profiles, we now focus on the molecular ion layer at the surface itself. We define
this layer based on the density of the ion centers of mass, shown in Figures S3-S5 of the
supplemental material,99 with the initial accumulation of ions occurring within 4-6 Å for
all of our electrolytes across the range of � probed here. To understand the composition
of this layer, we compute the average surface ion density (N) attributed to this layer as a
function of h i� h i0. The value of N is determined from the product of the integral of the
21

aforementioned density profiles of ion centers of mass from the electrode surface to the first
minimum with the surface area of the electrode, and this procedure is performed for both
cations and anions, with the results being shown in Figure 7 a, c, and e.
The value of N for the three liquids displays the same general behavior of more cations at
lower potential and more anions at higher potential; however, there are various nuances that
should be noted. At h i0, we see that [pyr14][TFSI] and [pyr13][FSI] have more cations in
the surface layer, while [EMIM][BF4] has almost an equal number of each ion. This suggests
better packing of the pyrrolidinium cations with the graphite surface than the imide anion
interactions, possibly through more configurational freedom. The near equal amount of
[BF4] and [EMIM] at the surface could be attributed to their relatively simple structures
and similar, small size. At the extreme of negative potential, h i ⇠ �2 V, the population
of [TFSI] and [FSI] at the surface is near negligible, while [BF4] has only been reduced to
half its value at h i0. On the other hand, at h i ⇠ 2 V we see a mixture of anions and,
persistently, cations at the surface for all three liquids. The addition of Li+ salt has limited
effect on the value of N , which agrees with the ion density profiles showing no significant
Li+ density in the surface ion layer. Finally, the average number of ions in the surface layer
increases with decreasing ion size, with N in [EMIM][BF4] > [pyr13][FSI] > [pyr14][TFSI].
It has been determined previously that the surface layer governs the shape of differential
capacitance.61,74,75 To connect Cdl to the number of ions in the surface layer, we look at
the change in surface ion density, �N , as a function of h i. In this respect, we define �N
as (h i � h i0)/|h i � h i0|(N� �N+ �N�0 +N+
0 ), which yields the net accumulation of
anions and removal of cations at the cathode and vice versa for the anode. This measure
provides a pseudo-parabolic curve, as shown in Figure 7 b, d, and f, that reveals an interesting
asymmetry for the considered electrolytes. In the case of [pyr14][TFSI], we see that the value
of �N at the maximum positive potential is larger than at the minimum negative potential,
which concurs with our finding that Cdl is larger at positive potentials for [pyr14][TFSI].
For [pyr13][FSI], we see the opposite asymmetry, with �N reaching larger values at negative
22

potential, which again agrees with the previously noted larger values of Cdl at negative
potentials, as well as the findings of previous simulations on [FSI] containing ionic liquids.75
For [EMIM][BF4], we note a nearly symmetric �N curve that coincides with a symmetric
differential capacitance. As with N , the addition of Li-salt does not significantly change the
trends in �N .
As a means of understanding the structural origin of changes in N and �N with potential,
we look to the molecular configuration of cations and anions in the surface ion layer as a
function of h i�h i0, with representative configurations being shown in Figure S7. We first
look at the distribution of the angle between the cation ring normal and the electrode surface
normal, given in Figure S8. In this respect, we find that the cations at the surface can take
one of two distinct states: a low angle state having the ring interact with the surface (denoted
planar) and a high angle state more likely to have the chain interact with the surface (denoted
perpendicular). For [pyr14], [pyr13], and [EMIM], we find the average angle of planar cations
to be ⇠8o, ⇠35o, and ⇠7o, respectively. Perpendicular cations are separated from planar
cations by a minimum in the angle configuration space and are diffusely distributed through
angles > 30o and > 45o for [pyr14] and [pyr13], respectively. [EMIM] does not have a clearly
preferred perpendicular state; so we define perpendicular as > 30o, which separates planar
cations from larger angles (see Figure S8).
Mapping out the percent of planar cations in the ion surface layer as a function of
potential, we see that [EMIM] is ⇠ 67% planar, a value virtually independent of h i. On
the other hand [pyr14] and [pyr13] have few planar cations at low potential (⇠16-20 %),
which rapidly increases to almost 50 % planar at our lowest potential. Again, there are no
large systematic differences between neat systems and those having Li+. The prevalence of
[pyr14] and [pyr13] at the surface across the range of potential, as given by N , is due to their
two favorable states. The planar configuration, which exposes the positive charge center
of the ring to the surface, is favorable at the anode, while the perpendicular configuration,
which allows the cation to remain in the surface ion layer without having its charge center
23

exposed to the electrode, is favored at the cathode. Alternatively, [EMIM] predominantly
assumes a planar configuration with a positive charge center exposed to the electrode. While
this configuration at the anode is favorable, the prevalence of [EMIM] at the cathode is
anomalous. We therefore look to the behavior of the companion anion, [BF4], to further
understand the composition of the surface layer. The ion density profile of [EMIM][BF4]
at the cathode, given in Figure S2 c, shows that the surface layer is composed of a planar
[EMIM] layer between two [BF4] layers. The relatively small size of [BF4] and high planarity
of [EMIM] allows these ions to coexist and form a finer secondary layering of charge, or
sub-layer of charge, within the surface ion layer.
Surface anions can be treated in a similar manner to the surface cations. For [TFSI] and
[FSI], we use the deviation of the angle between the vector connecting the two S atoms in the
S-N-S bridge from the surface normal as our gauge of configuration. For [BF4], we employ a
dynamic measure of configuration, where the vector between the most distant F-atom and
the central B atom with respect to the surface is used. For [TFSI] and [FSI], we see that
the anions have a high angle state where the anion lies flat on the surface (denoted flat)
and a low angle configuration where the end of the anion interacts with the surface (denoted
perpendicular). Likewise, the [BF4] anions assume configurations with three F-atoms close
to the surface (flat) and those with one or two F-atoms close to the surface (perpendicular).
As shown in Figure S9, the anion angle distribution has a separation such that values > 53o
are considered flat for both [TFSI] and [FSI] and angles < 33o are considered flat for [BF4].
As seen from the Figure 8, the percent of flat anions increases as a function of increasing
potential. At h i0, [TFSI] and [FSI] have overall high percents of flat anions (⇠75 %) that
increases to 90-98 % at high h i. The [BF4] anion increases from roughly 50 % flat at low
potential to 80 % at high potential. Both the [TFSI] and [FSI] anions assume predominantly
flat configurations at the electrode surface, as previously noted with other potentials61 and
shown pictorially in Figure S7. These anions do not have a highly favorable perpendicular
conformation that moves the negative charge center away from the electrode, with the neg-
24

ative O and F atoms on the outer shell of the molecules. This is the most likely cause of
their rapid exodus from the anode with decreasing potential, as noted from N in Figure 7.
Again owing primarily to its small size, the [BF4] anion can closely crowd the predominantly
planar [EMIM] cations and incorporate itself into the surface ion layer at the anode, leading
to high value of N for [BF4] at negative potenital; this is supported by the high density close
to the anode given in Figure S2 e.
We see, then, that the Cdl of the three liquids can be closely related to the net change of
surface ion density, �N , as a function of potential, with higher values implying higher values
of capacitance. For [pyr14][TFSI], there are more cations than anions in the h i0 layer, and
the present anions assume a flat configuration at the electrode surface. As the potential
is decreased, the flat anions, having negative charge exposed to the electrode, are rapidly
depleted from the surface, while the cation population at the surface does not dramatically
increases but, rather, favors the transition of present cations to have more planar character.
The loss of the few [TFSI] and the addition of few cations lead to an altogether muted
change in �N . At positive potentials, however, there is a steady loss of [pyr14] and a steady
gain in [TFSI] anions that lead to a net larger increase in �N when compared to negative
potentials. While structurally similar though smaller than [pyr14][TFSI], [pyr13][FSI] has
a larger number of both cations and anions in the h i0 layer. While [FSI] also assumes
primarily flat configurations, their number in the surface layer is suitably large to sustain a
high-rate of anion exit from the anode across our values of � , leading to a larger value of
�N at negative potentials when compared to positive potentials. Finally, [EMIM][BF4] has
a highly planar cation and a small anion that both lead to thin molecular surface layers that
can be closely crowded by their counter-ions. This leads to reordering of the molecules to
create a sub-layering of charge within the ion surface layer being preferred to the rapid gain
or removal a given ion, which results in similar value of �N at both the anode and cathode.
25

Potential of Zero Charge
An important property related to the structure of the EDL is the potential of zero charge,
which we have previously denoted as h i0. It is instructive to briefly describe h i0 in the
context of the total electrostatic potential profile in our interfacial systems at � = 0 V,
shown in Figure S7 of the supplemental material.99 The electrostatic potential is practically
constant about z = 0, where the electrolyte is bulk-like in character, and we thereby refer to
this potential as the bulk potential, h iB. Alternatively, the potential as z approaches the
electrode deviates from h iB due to the influence of the interfacial structure. Because our
electrodes are identical, h�i = 0 when � = 0, and the potential felt by both electrodes is
potential of zero charge, h i0. In general, h i0 need not be equivalent to h iB, as potential
of the electrode is highly influenced by ion ordering at the surface.
We provide measures of both h i0 and h iB in Table 3. At xLi = 0.0, the values of
h i0 are small and negative for [pyr14][TFSI] and [pyr13][FSI], measuring -0.06 and -0.11 V,
respectively. The value for [EMIM][BF4], on the other hand, is positive, 0.01 V, though close
to zero. The sign of h i0 for each liquid can be related to the surface ion configuration, shown
in Figure 8. At � = 0 V, both [pyr14][TFSI] and [pyr13][FSI] have a large population,
⇠70-80%, of flat surface anions with negative charge centers near the electrode surface and
a relatively low population, ⇠15-20%, of planar cations with positive charge centers near the
electrode surface. This leads to the net negative biasing of the electrode, and thus a negative
potential of zero charge, at � = 0 V. The opposite is true for [EMIM][BF4]. Roughly 70%
of [EMIM] cations are in a planar configuration, while only ⇠50% of the [BF4] anions are
flat. This leads to the net positive biasing of the electrode, and thus a slightly potential of
zero charge, at � = 0 V.
The bulk potentials for our electrolytes are -0.79 V, -0.01 V, and -0.21 V for neat
[pyr14][TFSI], [pyr13][FSI], and [EMIM][BF4], respectively. Interestingly, the addition of
Li-salt has little influence on h i0, while its influence on the bulk potential for all elec-
26

trolytes is more pronounced, with h iB increasing by roughly 0.1-0.2 V. The decoupling of
h i0 and h iB under Li-doping implies that Li+ does not strongly perturb the charge density
directly above the electrode surface.
Distribution and Solvation of Li
+
Li
+Distribution
We now provide a more detailed analysis of the interaction of Li+ with EDL structure
by mapping out the net ion density (�⇢ ⌘ ⇢+ � ⇢�) as a function of distance from the
electrode and surface potential, as given in the color maps in Figure 9 d-f. A net abundance
of cations is denoted by the blue region, while a net abundance of anions is given by red
regions. In additional to this, the density of Li+ (⇢Li) is given in Figure 9 g-i. For the liquids
having xLi = 0, the double layer structure is clearly visible. The addition of Li+ leads to
more disorder in the layers adjacent to the first ion layer. This is particularly notable in the
second ion layer, which has greater positive character at negative potentials than the case
of the neat liquid. The origin of this effect can be understood though ⇢Li in Figure 9 g-i,
where there is a strongly localized Li+ signature in the second ionic layer. For larger values
of �z, the density of Li+ is less localized, with weak signatures appearing in more distant
cation and anion layers. The surface ion layer, on the other hand has a negligible signature
of Li+, and such behavior explains the previously noted insensitivity of the surface ion layer
properties to Li-salt doping.
To qualitatively understand the aggregation of Li+ in the second ionic layer, we look to the
solvation structure, which is shown in Figure 10 for the representative case of [pyr14][TFSI]
at the positive and negative electrodes. Against the anode, as shown in Figure 10 a, Li+
is solvated primarily in the second ion layer, composed of anions. As a result, a positive
contribution is added into the second anion layer, which results in the second ion layer
having a greater cation contribution, as noted in Figure 9 d-f. At the cathode, as displayed
27

in Figure 10 b, we see that Li+ resides again in the second ion layer, composed of cations.
In this case, the anions bond to Li+ across the second cation layer. The majority of binding
anions originate from the first ion layer, with the remainder being from the third ion layer.
In all cases, we note that Li+ maintains 4-coordinated, atomically, solvation structure in a
similar manner to bulk systems.79 Energetically speaking, against the anode Li+ must remain
in the second anion layer due to the strong Li/Anion binding, while against the cathode Li+
remains in the second cation layer due to a balance between a strong repulsion to the cathode
and sufficient binding from the first and third anion layers. One would expect such binding
to create a barrier to the translation of Li+ through the EDL surface ion layer.
Li
+Solvation Free Energy
We first focus on obtaining the solvation free energy of Li+ in the z = 0 plane in the
bulk region of the electrolyte at � = 0 V, the values of which are given in Table 4 for the
three electrolytes of interest in the present work. The first step of the thermodynamic cycle
takes neutral Li0 from the gas phase to a solvated state in the z = 0 plane of our model
capacitor. This step of the cycle yields �F Li0(g)!Li0(l) values of 4.2, 4.7 and 4.6 kcal/mol
for [pyr14][TFSI], [pyr13][FSI], and [EMIM][BF4], respectively. The solvated Li0 interacts
with the ionic liquid only through repulsive-dispersive interactions, which are unfavorable
with respect to the transition from the gas phase as seen from the positive contributions
to the solvation free energy. The second step of the cycle involves the charging of sol-
vated Li0 to Li+ while simultaneously counter charging an electrode to -1 a.u. The Li+
solvation free energy contribution from this leg of the cycle �F Li0(l)!Li+(l), which can be
resolved by removing �F edl according to Fig. 5, is -105.8, -105.5, and -101.9 kcal/mol for
[pyr14][TFSI], [pyr13][FSI], and [EMIM][BF4], respectively. The electrostatic interactions
introduced by this transition are favorable to solvation and of an order of magnitude larger
than the repulsive-dispersive contribution, leading to a highly favorable values of �F s.
28

Concerning the magnitude of F s shown in Table 4, our values are in general agreement
with previous measures of the solvation of other elemental, monovalent cations into aqueous
solutions.100 The value of Fs for the three electrolytes follows the order [pyr14][TFSI] <
[pyr13][FSI] < [EMIM][BF4], which interestingly follows the trend of Li+ ionic conductivity
and the inverse trend of anion size.79 There is not strictly speaking a previously established
correlation between F s and Li+ conductivity, though one could suppose that a more weakly
solvated ion would have increased mobility.
With the solvation free energy of Li+ into the bulk in hand, we can now determine the
solvating free energy as a function of distance from the electrode at different values of � .
In this case, we employ our standard two electrode setup with a given value of � applied
between the electrodes, perform MD simulations with Li+ constrained to various z-planes
throughout the EDL, and populate the solvation free energy using the “blue-moon” ensemble
as represented by Eq. 12. The resulting free energies profiles, given in terms of distance from
the electrode surface F s(�z), are shown in Fig. 11 for � values of 0 V and 4.2 V. The
free energy profiles are in line with our expectations from the distribution of Li+ given in
Figure 9 and provide a comparative quantification of barriers to Li+ transport in the EDLs
of the different electrolytes. At the neutral electrode, � = 0 V, we see a 5 kcal/mol
barrier to Li+ motion from �z = 7 Å to 5 Å for [pyr14][TFSI], corresponding to motion
from the second molecular layer to the surface ion layer. Such a barrier is not present
in the other electrolyte systems. We can trace this barrier to the fact that, as shown in
Figure 7, [pyr14][TFSI] has a highly cation enriched surface layer that would be unfavorable
to Li+ solvation. Intercalating Li+ with its solvation shell of large [TFSI] anions is also an
unfavorable contribution to translation into the surface ion layer.
Upon applying a potential difference between the electrodes of � = 4.2 V, we find some
consistent trends between the three liquids at the negative electrode. Namely, a 7-8 kcal/mol
barrier to Li+ motion from �z = 7 Å to 5 Å evolves for all electrolytes. As with the neutral
electrode with [pyr14][TFSI], this corresponds to motion from the second molecular layer
29

to the surface ion layer. As the second molecular layer is primarily anions at the negative
electrode, it is highly favorable for Li+ to remain in this layer, hence the barrier to insertion
into the surface ion layer.
Alternatively, at the positive electrode of the system having � = 4.2 V, we see slightly
different behavior between the three liquids. For [pyr14][TFSI] and [EMIM][BF4], a minimum
in Fs evolves around �z values of 4-5 Å, and a maximum evolves around 8-10 Å, with
the difference between the extrema being 5 kcal/mol and 6 kcal/mol for [pyr14][TFSI] and
[EMIM][BF4], respectively. For [pyr13][FSI], on the other hand, the minimum is clearly
present, but the maximum is much lower than the other liquids, leading to a difference
between the extrema of 2.5 kcal/mol.
For all three electrolytes, the minimum is a reflection of Li+ preferring to remain at the
interface of the anion-rich surface layer and the cation rich second molecular layer. For
example, as can be seen in Figure 10 b, Li+ remains 4-coordinated with 3 O atoms from
the surface ion layer and a monodentate [TFSI] drawn from the third molecular layer, which
represent the free energy well at 4-5 Å. The binding of Li+ with an anion in the third
molecular layer across the adjacent cation layer is unfavorable as it disrupts the segregation
of charge, and the optimum structure mitigates this by requiring only one anion to be inserted
into the layer.
Concerning the maximum in free energy, as Li+ is forced into the second molecular layer
(cation layer) at the positive electrode, its solvating anions are introduced into this layer too.
This is unfavorable and leads to the noted increase in free energy around the 8-10 Å region.
The specific solvation structure of Li+ in each electrolyte, however, changes the magnitude of
the noted maximum. The solvation structure of a Li+ constrained to reside at the maximum
of free energy is shown in Figure 12. For [pyr14][TFSI], we see a surface anion bound to Li+
in a monodentate configuration as well as anions originating from the third molecular layer
bound in monodentate and bidentate configurations. The same anion binding configuration
is noted for [EMIM][BF4], which is unusual as Li+ prefers 4 monodentate [BF4] bond in
30

the bulk electrolyte. The small size of the anions leads to all three being incorporated into
the cation layer, which is highly unfavorable. Both of these solvation structures lead to the
similar energetic barriers to Li+ translation. On the other hand, [pyr13][FSI] has a much
lower maximum, with Li+ assuming a solvation shell having 4 monodentate anions. The
anions in this case, as seen in Figure 12, are all monodentate, which leads to their negative
charge centers being more removed from the cation layer. This reduces the energetic cost of
inserting Li+ into the cation layer.
Conclusions
In the present work we investigate the influence of Li-salt doping on the electric dou-
ble layer formation and capacitance of three ionic liquids ([pyr14][TFSI], [pyr13][FSI], and
[EMIM][BF4]) at 363 K and for 0 V � 4.2 V. To represent the interfaces, we use
a dual electrode model, one being the positive and the other being the negative electrode,
with a potential difference imposed on the electrode through the constant-� method. Be-
yond typical computations of this nature, the interfaced electrolyte is represented with a
polarizable force field, which has been shown previously to ensure accurate ion density and
alignment at electrified interfaces.85 The differential capacitance is computed using a newly
derived fluctuation formula that yields capacitance as a function of surface potential. The
fluctuation formula is shown to be an effective method to compute differential capacitance,
and further avoids the computational overhead of taking a direct derivative of surface charge
with respect to surface potential, which requires many simulations over a fine � grid to
achieve an accurate result.
While all three liquids have similar EDL formation rates, we see that [pyr13][FSI] has
slightly better overall energy storage characteristics, or lower EDL formation free energy,
than [pyr14][TFSI] or [EMIM][BF4]. Concerning our computations using ideal metallic elec-
31

trodes, all three liquids exhibit asymmetric differential capacitance about the potential of
zero charge. This is in line with the expected camel-shaped profiles previously observed in
experimental measurements of ionic liquids at metallic electrodes. The addition of Li-salt to
our systems leads to a decrease in asymmetry, likely as a result of the disorder Li+ introduces
into the electric double layer structure. For our experimental measurements on glassy carbon
electrodes, differential capacitance adopts a U-like profile and has a larger magnitude than
our computational results. The differences between theoretical predictions and experiment
underscore the strong influence of electrode surface structure and pseudocapacitive effects
on differential capacitance.
We have mapped out the electric double layer structure, noting the expected alternating
layers of cations and anions from previous studies. The introduction of Li+ leads to EDL
disorder, which is observable in the differential capacitance as well as the ion density profiles.
One particular aspect of the EDL that is not strongly influenced by the introduction of Li+ is
the composition and structure of the first molecular layer of ions at the surface. We find that
the behavior of the surface ions imparts a great deal of information about the differential
capacitance, namely in describing the overall shape of this quantity. For instance, we find
that regions of higher differential capacitance correspond to greater ion buildup at the surface
and a corresponding alignment that leads to more dense packing.
We have also investigated the distribution of Li+ in the double layer as a function of
potential and have found a strong localization behavior in the second ion layer of the EDL.
At the anode, the localization is a result of the strong anion binding in the second molecular
layer, while at the cathode Li+ resides in the second cation layer and forms bonds with both
the first and third anion layers. Quantifying this behavior, we have performed an in-depth
study of free energy of Li+ in the electric double layer. We compute the free energy of Li+
solvation into the bulk-like region in our model capacitor and perform constrained dynamics
as a function of distance from the electrode to understand solvation free energetic difference
in the double layer. We note that solvation free energy follows the trend of [pyr14][TFSI] <
32

[pyr13][FSI] < [EMIM][BF4], which is inverse to the size of solvating anions. For electrodes
having a � of 0 V, [pyr14][TFSI] exhibits a 5 kcal/mol barrier to Li+ translation to the
surface ion layer, which originates from cation enrichment of this layer at neutral conditions.
This barrier is not present in the other electrolytes. Concerning the negative electrode of a
system having a � of 4.2 V, a barrier to Li+ insertion into the surface layer occurs due
to favorable anion solvation in the second molecular layer. On the positive electrode, a well
forms near the anion layer at the surface again due to strong Li/anion interactions. Inter-
estingly, the solvation structure of Li+ in the liquids leads to different free energy barriers,
with [pyr13][FSI] exhibiting the smallest barrier due to a more diffuse solvation structure.
Acknowledgement
This work was supported by funding from the NASA Aeronautics Research Institute (NARI)
Seedling program.
References
(1) Armand, M.; Endres, F.; MacFarlane, D. R.; Ohno, H.; Scrosati, B. Ionic-Liquid
Materials for the Electrochemical Challenges of the Future. Nature Mater. 2009, 8,
621–629.
(2) Buzzeo, M. C.; Evans, R. G.; Compton, R. G. Non-Haloaluminate Room-Temperature
Ionic Liquids in Electrochemistry - A Review. ChemPhysChem 2004, 5, 1106–1120.
(3) Fedorov, M. V.; Kornyshev, A. A. Ionic Liquids at Electrified Interfaces. Chem. Rev.
2014, 114, 2978–3036.
(4) Simon, P.; Gogotsi, Y. Materials for Electrochemical Capacitors. Nature Mater. 2008,
7, 845–854.
33

(5) Lockett, V.; Horne, M.; Sedev, R.; Rodopoulos, T.; Ralston, J. Differential Capac-
itance of the Double Layer at the Electrode/Ionic Liquids Interface. Phys. Chem.
Chem. Phys. 2010, 12, 12499–12512.
(6) Alam, M. T.; Islam, M. M.; Okajima, T.; Ohsaka, T. Measurements of Differential
Capacitance at Mercury/Room-Temperature Ionic Liquids Interfaces. J. Phys. Chem.
C 2007, 111, 18326–18333.
(7) Lockett, V.; Sedev, R.; Ralston, J.; Horne, M.; Rodopoulos, T. Differential Capaci-
tance of the Electrical Double Layer in Imidazolium-Based Ionic Liquids: Influence of
Potential, Cation Size, and Temperature. J. Phys. Chem. C 2008, 112, 7486–7495.
(8) Zheng, J.; Moganty, S. S.; Goonetilleke, P. C.; Baltus, R. E.; Roy, D. A Comparative
Study of the Electrochemical Characteristics of [Emim+][BF�4 ] and [Bmim+][BF�
4 ]
Ionic Liquids at the Surfaces of Carbon Nanotube and Glassy Carbon Electrodes. J.
Phys. Chem. C 2011, 115, 7527–7537.
(9) Zheng, J. P.; Goonetilleke, P. C.; Pettit, C. M.; Roy, D. Probing the Electro-
chemical Double Layer of an Ionic Liquid Using Voltammetry and Impedance Spec-
troscopy: A Comparative Study of Carbon Nanotube and Glassy Carbon Electrodes
in [EMIM]+[EtSO4]�. Talanta 2010, 81, 1045–1055.
(10) Drüschler, M.; Huber, B.; Passerini, S.; Roling, B. Hysteresis Effects in the Potential-
Dependent Double Layer Capacitance of Room Temperature Ionic Liquids at a Poly-
crystalline Platinum Interface. J. Phys. Chem. C 2010, 114, 3614–3617.
(11) Xu, J.; Yang, J.; NuLi, Y.; Wang, J.; Zhang, Z. Additive-Containing Ionic Liquid
Electrolytes for Secondary Lithium Battery. J. Power Sources 2006, 160, 621–626.
(12) Wang, H.; Liu, S.; Huang, K.; Yin, X.; Liu, Y.; Peng, S. BMIMBF4 Ionic Liquid
Mixtures Electrolyte for Li-Ion Batteries. Int. J. Electrochem. Sci. 2012, 7, 1688–
1698.
34

(13) Bhattacharyya, R.; Key, B.; Chen, H.; Best, A. S.; Hollenkamp, A. F.; Grey, C. P.
In Situ NMR Observation of the Formation of Metallic Lithium Microstructures in
Lithium Batteries. Nat. Mater. 2010, 9, 504–510.
(14) Schweikert, N.; Hofmann, A.; Schulz, M.; Scheuermann, M.; Boles, S. T.; Hane-
mann, T.; Hahn, H.; Indris, S. Suppressed Lithium Dendrite Growth in Lithium Bat-
teries Using Ionic Liquid Electrolytes: Investigation by Electrochemical Impedance
Spectroscopy, Scanning Electron Microscopy, and In Situ
7Li Nuclear Magnetic Res-
onance Spectroscopy. J. Power Sources 2013, 228, 237–243.
(15) Howlett, P. C.; MacFarlane, D. R.; Hollenkamp, A. F. High Lithium Metal Cycling
Efficiency in a Room-Temperature Ionic Liquid. Electrochem. Solid State Lett. 2004,
7, A97–A101.
(16) Matsumoto, H.; Sakaebe, H.; Tatsumi, K.; Kikuta, M.; Ishiko, E.; Kono, M.
Fast Cycling of Li/LiCoO2 Cell with Low-Viscosity Ionic Liquids Based on
Bis(Fluorosufonyl)Imide ([FSI]�). J. Power Sources 2006, 160, 1308–1313.
(17) Basile, A.; Hollenkamp, A. F.; Bhatt, A. I.; O’Mullane, A. P. Extensive Charge-
Discharge Cycling of Lithium Metal Electrodes Achieved Using Ionic Liquid Elec-
trolytes. Electrochem. Commun. 2013, 27, 69–72.
(18) Naoi, K. ’Nanohybrid Capacitor’: The Next Generation Electrochemical Capacitors.
Fuel Cells 2010, 10, 825–833.
(19) Lin, R.; Huang, P.; Ségalini, J.; Largeot, C.; Taberna, P. L.; Chmiola, J.; Gogotsi, Y.;
Simon, P. Solvent Effect on the Ion Adsorption from Ionic Liquid Electrolyte into
Sub-Nanometer Carbon Pores. Electrochim. Acta 2009, 54, 7025–7032.
(20) Li, S.; Van Aken, K. L.; McDonough, J. K.; Feng, G.; Gogotsi, Y.; Cummings, P. T.
The Electrical Double Layer of Dicationic Ionic Liquids at Onion-like Carbon Surface.
J. Phys. Chem. C 2014, 118, 3901–3909.
35

(21) Centeno, T. A.; Sereda, F., O. Stoeckli Capacitance in Carbon Pores of 0.7 to 15 nm:
A Regular Pattern. Phys. Chem. Chem. Phys. 2011, 13, 12403–12406.
(22) Largeot, C.; Portet, C.; Chmiola, J.; Taberna, P.-L.; Gogotsi, Y.; Simon, P. Relation
between the Ion Size and Pore Size for an Electric Double-Layer Capacitor. J. Am.
Chem. Soc. 2008, 130, 2730–2731.
(23) Wu, P.; Huang, J.; Meunier, V.; Sumpter, B. G.; Qiao, R. Complex Capacitance
Scaling in Ionic Liquids-Filled Nanopores. ACS Nano 2011, 5, 9044–9051.
(24) Bedrov, D.; Vatamanu, J.; Hu, Z. Ionic Liquids at Charged Surfaces: Insight from
Molecular Simulations. J. Non-Cryst. Solids 2014, in press.
(25) Feng, G.; Cummings, P. T. Supercapacitor Capacitance Exhibits Oscillatory Behavior
as a Function of Nanopore Size. J. Phys. Chem. Lett. 2011, 2, 2859–2864.
(26) Shim, Y.; Kim, H. J. Nanoporous Carbon Supercapacitors in an Ionic Liquid: A
Computer Simulation Study. ACS Nano 2010, 4, 2345–2355.
(27) Merlet, C.; Rotenberg, B.; Madden, P. A.; Taberna, P.-L.; Simon, P.; Gogotsi, Y.;
Salanne, M. On the Molecular Origin of Supercapacitance in Nanoporous Carbon
Electrodes. Nature Mater. 2012, 11, 306–310.
(28) Jiang, D.; Jin, Z.; Wu, J. Oscillation of Capacitance inside Nanopores. Nano Lett.
2011, 11, 5373–5377.
(29) Vatamanu, J.; Vatamanu, M.; Bedrov, D. Non-Faradic Energy Storage by Room Tem-
perature Ionic Liquids in Nanoporous Electrodes. ACS Nano 2015, Just Accepted,
Just Accepted.
(30) Su, Y.-Z.; Fu, Y.-C.; Yan, J.-W.; Chen, Z.-B.; Mao, B.-W. Double Layer of
Au(100)/Ionic Liquid Interface and Its Stability in Imidazolium-Based Ionic Liquids.
Angew. Chem. Int. Ed. 2009, 48, 5148–5151.
36

(31) Islam, M. M.; Alam, M. T.; Ohsaka, T. Electrical Double-Layer Structure in Ionic
Liquids: A Corroboration of the Theoretical Model by Experimental Results. J. Phys.
Chem. C 2008, 112, 16568–16574.
(32) Alam, M. T.; Islam, M. M.; Okajima, T.; Ohsaka, T. Ionic Liquid Structure Dependent
Electrical Double Layer at the Mercury Interface. J. Phys. Chem. C 2008, 112, 2601–
2606.
(33) Mezger, M.; H., S.; Reichart, H.; Schramm, S.; Okasinski, J. S.; Sch oder, S.;
Honkim aki, V.; Deutsch, M.; Ocko, B. M.; Ralston, J. et al. Molecular Layering
of Fluorinated Ionic Liquids at a Charged Sapphire (0001) Surface. Science 2008,
322, 424–428.
(34) Mezger, M.; Schramm, S.; H., S.; Reichart, H.; Deutsch, M.; De Souza, E. J.; Okasin-
ski, J. S.; Ocko, B. M.; Honkim aki, V.; Dosch, H. Layering of [BMIM]+-based Ionic
Liquids at a Charged Sapphire Interface. J. Chem. Phys. 2009, 131, 094701.
(35) Mezger, M.; Ocko, B. M.; Reichert, H.; Deutsch, M. Surface Layering and Melting in
an Ionic Liquid Studied by Resonant Soft X-ray Reflectivity. Proc. Natl. Acad. Sci.
2013, 110, 3733–3737.
(36) Nishi, N.; Yasui, Y.; Uruga, T.; Tanida, H.; Yamada, T.; Nakayama, S.; Matsuoka, H.;
Kakiuchi, T. Ionic Multilayers at the Free Surface of an Ionic Liquid, Trioctylmethy-
lammonium Bis(nonafluorobutanesulfonyl)amide, Probed by X-ray Reflectivity Mea-
surements. J. Chem. Phys. 2010, 132, 164705.
(37) Yamamoto, R.; Morisaki, H.; Sakata, O.; Shimotani, H.; Yuan, H.; Iwasa, Y.;
Kimura, T.; Wakabayashi, Y. External Electric Field Dependence of the Structure
of the Electric Double Layer at an Ionic Liquid/Au Interface. Appl. Phys. Lett. 2012,
101, 053122.
37

(38) Hayes, R.; El Abedin, S. Z.; Atkin, R. Pronounced Structure in Confined Aprotic
Room-Temperature Ionic Liquids. J. Phys. Chem. B Lett. 2009, 113, 7049–7052.
(39) Wakeham, D.; Hayes, R.; Warr, G. G.; Atkin, R. Influence of Temperature and Molec-
ular Structure on Ionic Liquid Solvation Layers. J. Phys. Chem. B 2009, 113, 5961–
5966.
(40) Atkin, R.; Warr, G. G. Structure in Confined Room-Temperature Ionic Liquids. J.
Phys. Chem. C 2007, 111, 5162–5168.
(41) Black, J. M.; Walters, D.; Labuda, A.; Feng, G.; Hillesheim, P. C.; Dai, S.; Cum-
mings, P. T.; Kalinin, S. V.; Proksch, R.; Balke, N. Bias-Dependent Molecular-Level
Structure of Electrical Double Layer in Ionic Liquid on Graphite. Nano Lett. 2013,
13, 5954–5960.
(42) Hayes, R.; Borisenko, N.; Tam, M. K.; Howlett, P. C.; Endres, F.; Atkin, R. Double
Layer Structure of Ionic Liquids at the Au(111) Electrode Interface: An Atomic Force
Microscopy Investigation. J. Phys. Chem. C 2011, 115, 6855–6863.
(43) Buchner, F.; Forster-Tonigold, K.; Bozorgchenani, M.; Gross, A.; J urgen Behm, R.
Interaction of a Self-Assembled Ionic Liquid Layer with Graphite(0001): A Combined
Experimental and Theoretical Study. J. Phys. Chem. Lett. 2016, 7, 226–233.
(44) Aliaga, C.; Baldelli, S. Sum Frequency Generation Spectroscopy and Double-Layer
Capacitance Studies of the 1-Butyle-3-Methylimidazolium Dicyanamide-Platinum In-
terface. J. Phys. Chem. B 2006, 110, 18481–18491.
(45) Rivera-Rubero, S.; Baldelli, S. Surface Spectroscopy of Room-Temperature Ionic Liq-
uids on a Platinum Electrode: A Sum Frequency Generation Study. J. Phys. Chem.
B 2004, 108, 15133–15140.
38

(46) Baldelli, S. Probing Electric Fields at the Ionic Liquid-Electrode Interface Using Sum
Frequency Generation Spectroscopy and Electrochemistry. J. Phys. Chem. B Lett.
2005, 109, 13049–13051.
(47) Santos Jr., V. O.; Alves, M. B.; Carvalho, M. S.; Suarez, P. A. Z.; Rubim, J. C.
Surface-Enhanced Raman Scattering at the Silver Electrode/Ionic Liquid (BMIPF6)
Interface. J. Phys. Chem. B 2006, 110, 20379–20385.
(48) Nanbu, N.; Sasaki, Y.; Kitamura, F. In Situ FT-IR Spectroscopic Observation of a
Room-Temperature Molten Salt | Gold Electrode Interphase. Electrochem. Commun.
2003, 5, 383–387.
(49) Kornyshev, A. A. Double-Layer in Ionic Liquids: Paradigm Change? J. Phys. Chem.
B 2007, 111, 5545–5557.
(50) Fedorov, M. V.; Kornyshev, A. A. Ionic Liquid Near a Charged Wall: Structure and
Capacitance of Electrical Double Layer. J. Phys. Chem. B 2008, 112, 11868–11872.
(51) Georgi, N.; Kornyshev, A. A.; Fedorov, M. V. The Anatomy of the Double Layer
and Capacitance in Ionic Liquids with Anisotropic Ions: Electrostriction vs. Lattice
Saturation. J. Electroanal. Chem. 2010, 649, 261–267.
(52) Ivanistsev, V.; Fedorov, M. V. Interfaces between Charged Surfaces and Ionic Liquids:
Insights from Molecular Simulations. Interface 2014, 23, 65–69.
(53) Limmer, D. T. Interfacial Ordering and Accompanying Divergent Capacitance at Ionic
Liquid-Metal Interfaces. Phys. Rev. Lett. 2015, 115, 256102.
(54) Black, J. M.; Okatan, M. B.; Feng, G.; Cummings, P. T.; Kalinin, S. V.; Balke, N.
Topological Defects in Electric Double Layers of Ionic Liquids at Carbon Interfaces.
Nano Energy 2015, 15, 737–745.
39

(55) Uysal, A.; Zhou, H.; Feng, G.; Lee, S. S.; Li, S.; Cummings, P. T.; Fulvio, P. F.;
Dai, S.; McDonough, J. K.; Gogotsi, Y. et al. Interfacial Ionic ‘Liquids’: Connecting
Static and Dynamic Structures. J. Phys.:Condens. Matter 2015, 27, 032101.
(56) Merlet, C.; Limmer, D.; Salanne, M.; van Roij, R.; Madden, P. A.; Chandler, D.;
Rotenberg, B. The Electric Double Layer Has a Life of Its Own. J. Phys. Chem. C
2014, 118, 18291–18298.
(57) Van Aken, K. L.; McDonough, J. K.; Li, S.; Feng, G.; Chathoth, S. M.; Mamontov, E.;
Fulvio, P. F.; Cummings, P. T.; Dai, S.; Gogotsi, Y. Effect of Cation on Diffusion
Coefficient of Ionic Liquids at Onion-Like Carbon Electrodes. J. Phys.: Condens.
Matter 2014, 26, 284104.
(58) Shim, Y.; Jung, Y.; Kim, H. J. Graphene-Based Supercapacitors: A Computer Simu-
lation Study. J. Phys. Chem. C 2011, 115, 23574–23583.
(59) Tazi, S.; Salanne, M.; Simon, C.; Turq, P.; Pounds, M.; Madden, P. A. Potential-
Induced Ordering Transition of the Adsorbed Layer at the Ionic Liquid-Electrified
Metal Interface. J. Phys. Chem. B 2010, 114, 8453–8459.
(60) Lynden-Bell, R. M.; Del Pópolo, M. G.; Youngs, T. G. A.; Kohanoff, J.; Hanke, C. G.;
Harper, J. B.; Pinilla, C. C. Simulations of Ionic Liquids, Solutions, and Surfaces. Acc.
Chem. Res. 2007, 40, 1138–1145.
(61) Vatamanu, J.; Borodin, O.; Smith, G. D. Molecular Insights into the Potential and
Temperature Dependences of the Differential Capacitance of a Room-Temperature
Ionic Liquid at Graphite Electrodes. J. Am. Chem. Soc. 2010, 132, 14825–14833.
(62) Vatamanu, J.; Borodin, O.; Smith, G. D. Molecular Dynamics Simulation Studies of
the Structure of a Mixed Carbonate/LiPF6 Electrolyte near Graphite Surface as a
Function of Electrode Potential. J. Phys. Chem. C 2011, 116, 1114–1121.
40

(63) Vatamanu, J.; Borodin, O.; Smith, G. D. Molecular Dynamics Simultions of Atomically
Flat and Nanoporous Electrodes with a Molten Salt Electrolyte. Phys. Chem. Chem.
Phys. 2010, 12, 170–182.
(64) Feng, G.; Zhang, J. S.; Qiao, R. Microstructure and Capacitance of the Electrical
Double Layers at the Interface of Ionic Liquids and Planar Electrodes. J. Phys. Chem.
C 2009, 113, 4549–4559.
(65) Merlet, C.; Salanne, M.; Rotenberg, B.; Madden, P. A. Imidazolium Ionic Liquid
Interfaces with Vapor and Graphite: Interfacial Tension and Capacitance from Coarse-
Grained Molecular Simulations. J. Phys. Chem. C 2011, 115, 16613–16618.
(66) Coasne, B.; Viau, L.; Vioux, A. Loading-Controlled Stiffening in Nanoconfined Ionic
Liquids. J. Phys. Chem. Lett. 2011, 2, 1150–1154.
(67) Feng, G.; Qiao, R.; Huang, J.; Sumpter, B. G.; Meunier, V. Atomistic Insight on the
Charging Energetics in Subnanometer Pore Supercapacitors. J. Phys. Chem. C 2010,
114, 18012–18016.
(68) Rajput, N. N.; Monk, J.; Singh, R.; Hung, F. R. Structure and Dynamics of an Ionic
Liquid Confined Inside a Charged Slit Graphitic Nanopore. J. Phys. Chem. C 2012,
116, 14504–14513.
(69) Rajput, N. N.; Monk, J.; Singh, R.; Hung, F. R. On the Influence of Pore Size and Pore
Loading on Structural and Dynamical Heterogeneities of an Ionic Liquid Confined in
a Slit Nanopore. J. Phys. Chem. C 2012, 116, 5169–5181.
(70) Pinialla, C.; Del Pópolo, M. G.; Lynden-Bell, R. M.; Kohanoff, J. Structure and
Dynamics of a Confined Ionic Liquid. Topics of Relevance to Dye-Sensitized Solar
Cells. J. Phys. Chem. B 2005, 109, 17922–17927.
41

(71) Pinialla, C.; Del Pópolo, M. G.; Kohanoff, J.; Lynden-Bell, R. M. Polarization Relax-
ation in an Ionic Liquid Confined between Electrified Walls. J. Phys. Chem. B 2007,
111, 4877–4884.
(72) Shim, Y.; Kim, H. J. Solvation of Carbon Nanotubes in a Room-Temperature Ionic
Liquid. ACS Nano 2009, 3, 1693–1702.
(73) Dong, K.; Zhou, G.; Liu, X.; Yao, X.; Zhang, S.; Lyubartsev, A. Structural Evidence
for the Ordered Crystallites of Ionic Liquid in Confined Carbon Nanotubes. J. Phys.
Chem. C 2009, 113, 10013–10020.
(74) Hu, Z.; Vatamanu, J.; Borodin, O.; Bedrov, D. A Comparative Study of Alkylimi-
dazolium Room Temperature Ionic Liquids with FSI and TFSI Anions near Charged
Electrodes. Electrochim. Acta 2014, 145, 40–52.
(75) Vatamanu, J.; Borodin, O.; Smith, G. D. Molecular Simulations of the Electric Dou-
ble Layer Structure, Differential Capcitance, and Charging Kinetics for N -Methyl-N -
Propylpyrrolidinium Bis(Fluorosulfonyl)Imide at Graphite Electrodes. J. Phys. Chem.
B 2011, 115, 3073–3084.
(76) Smith, A. M.; Perkin, S. Influence of Lithium Solutes on Double-Layer Structure of
Ionic Liquids. J. Phys. Chem. Lett. 2015, 6, 4857–4861.
(77) Ivanistsev, V.; Méndez-Morales, T.; Lynden-Bell, R. M.; Cabeza, O.; Gallego, L. J.;
Varela, L. M.; Fedorov, M. V. Molecular Origin of High Free Energy Barriers for Alkali
Metal Ion Transfer through Ionic Liquid-Graphene Electrode Interfaces. Phys. Chem.
Chem. Phys. 2016, 18, 1302–1310.
(78) Bauschlicher, C. W., Jr.; Haskins, J. B.; Bucholz, E. W.; Lawson, J. W.; Borodin, O.
Structure and Energetics of Li+-(BF�4 )n, Li+-(FSI�4 )n, and Li+-(TFSI�4 )n: Ab Initio
and Polarizable Force Field Approaches. J. Phys. Chem. B 2014, 118, 10785–10794.
42

(79) Haskins, J. B.; Bennett, W. R.; Wu, J. J.; Hernández, D. M.; Borodin, O.; Monk, J. D.;
Bauschlicher, C. W., Jr.; Lawson, J. W. Computational and Experimental In-
vestigation of Li-doped Ionic Liquid Electrolytes: [pyr14][TFSI], [pyr13][FSI], and
[EMIM][BF4]. J. Phys. Chem. B 2014, 118, 11295–11309.
(80) Borodin, O.; Smith, G. D. Development of Many-Body Polarizable Force Fields for
Li-Battery Components: 1. Ether, Alkane, and Carbonate-Based Solvents. J. Phys.
Chem. B 2006, 110, 6279–6292.
(81) Borodin, O.; Smith, G. D. Development of Many-Body Polarizable Force Fields for Li-
Battery Applications: 2. LiTFSI-Doped Oligoether, Polyether, and Carbonate-Based
Electrolytes. J. Phys. Chem. B 2006, 110, 6293–6299.
(82) Borodin, O. Polarizable Force Field Development and Molecular Dynamics Simulations
of Ionic Liquids. J. Phys. Chem. B 2009, 113, 11463–11478.
(83) Borodin, O.; D., S. G.; Henderson, W. Li+ Cation Environment, Transport, and Me-
chanical Properties of the LiTFSI Doped N -Methyl-N -Alkylpyrrolidinium+ TFSI�
Ionic Liquids. J. Phys. Chem. B 2006, 110, 16879–16886.
(84) Li, Z.; Smith, G. D.; Bedrov, D. Li+ Solvation and Transport Properties in Ionic
Liquid/Lithium Salt Mixtures: A Molecular Dynamics Simulation Study. J. Phys.
Chem. B 2012, 116, 12801–12809.
(85) Haskins, J. B.; Lawson, J. W. Evaluation of Methods for the Simulation of Ionic Liquid
Electrified Interfaces. J. Chem. Phys. (Submitted).
(86) Solano, C. J. F.; Jeremias, S.; Paillard, E.; Beljonne, D.; Lazzaroni, R. A Joint
Theoretical/Experimental Study of the Structure, Dynamics, and Li+ Transport in
Bis([tri]fluoro[methane]sulfonyl)Imide [T]FSI-Based Ionic Liquids. J. Chem. Phys.
2013, 139, 034502.
43

(87) Kawata, M.; Mikami, M. Rapid Calculation of Two-Dimensional Ewald Summation.
Chem. Phys. Lett. 2001, 340, 157–164.
(88) Yeh, I.-C.; Berkowitz, M. L. Ewald Summation for Systems with Slab Geometry. J.
Chem. Phys. 1999, 111, 3155–3162.
(89) Siepmann, J. I.; Sprik, M. Influence of Surface Topology and Electrostatic Potential
on Water/Electrode Systems. J. Chem. Phys. 1995, 102, 511.
(90) Reed, S. K.; Lanning, O. J.; Madden, P. A. Electrode Interface Between an Ionic
Liquid and a Model Metallic Electrode. J. Chem. Phys. 2007, 126, 084704.
(91) Carter, E. A.; Ciccotti, G.; Hynes, J. T.; Kapral, R. Constrained Reaction Coordinate
Dynamics for the Simulation of Rare Events. Chem. Phys. Lett. 1989, 156, 472.
(92) Ivanistsev, V.; Fedorov, M. V.; Lynden-Bell, R. M. Screening of Ion-Graphene Elec-
trode Interactions by Ionic Liquids: the Effects of Liquid Structure. J. Phys. Chem.
C 2014, 118, 5841–5847.
(93) Fedorov, M. V.; Lynden-Bell, R. M. Probing the Neutral Graphene-Ionic Liquid In-
terface: Insights from Molecular Dynamics Simulations. Phys. Chem. Chem. Phys.
2012, 14, 2552–2556.
(94) Lynden-Bell, R. M.; Frolov, A. I.; Fedorov, M. V. Electrode Screening by Ionic Liquids.
Phys. Chem. Chem. Phys. 2012, 14, 2693–2701.
(95) Tuckerman, M.; Berne, B. J.; Martyna, G. J. Reversible Multiple Time Scale Molecular
Dynamics. J. Chem. Phys. 1992, 97, 1990.
(96) Gnahm, M.; Pajkossy, T.; Kolb, D. M. The Interface between Au(111) and an Ionic
Liquid. Electrochim. Acta 2010, 55, 6212–6217.
44

(97) Pajkossy, T.; Kolb, D. M. The Interfacial Capacitance of Au(100) in an Ionic Liquid,
1-butyl-3-methyl-imidazolium hexafluorophasphate. Electrochim. Commun. 2011, 13,
284–286.
(98) Siinor, L.; Arendi, R.; Lust, K.; Lust, E. Influence of Temperature on the Electrochem-
ical Characteristics of Bi(111)|Ionic Liquid Interface. J. Electroanal. Chem. 2013, 689,
51–56.
(99) See supporting information for additional details of the ion density profiles and struc-
ture at the surface.
(100) Lynden-Bell, R. M.; Rasaiah, J. C. From Hydrophobic to Hydrophilic Behaviour: a
Simulation Study of Solvation Entropy and Free Energy of Simple Solutes. J. Chem.
Phys. 1997, 107, 1981–1991.
45

Table 1: Number of cation/anion pairs (NIL), Li+/anion pairs (NLi), and ranges of totalsimulation time (tsim) in nanoseconds used for the interface systems.
[pyr14][TFSI] [pyr13][FSI] [EMIM][BF4]
xLi NIL NLi tsim NIL NLi tsim NIL NLi tsim
0.0 113 0 50-65 147 0 45-55 226 0 40-500.2 100 25 60-75 134 33 50-60 212 53 40-50
46

Table 2: Characteristic formation time of the ionic liquid electric double layer (⌧ edl) in unitsof picoseconds as a function of voltage and Li-salt doping.
⌧edl
� xLi [pyr14][TFSI] [pyr13][FSI] [EMIM][BF4]
2.1 0.0 193 64 330.2 368 135 160
4.2 0.0 318 216 480.2 395 354 164
47

Table 3: Potential of zero charge (h i0) and bulk potential (h iB) in units of millivolts forthe interface systems.
[pyr14][TFSI] [pyr13][FSI] [EMIM][BF4]
xLi h i0 h iB h i0 h iB h i0 h iB
0.00 -61 -794 -112 -12 9 -2090.20 -54 -641 -109 216 7 37
48

Table 4: Solvation free energies of Li+ (F s) into the ionic liquids electrolytes as resolved intorepulsive-dispersive (�F Li0(g)!Li0(l)) and electrostatic (�F Li0(l)!Li+(l)) contributions. Unitsare given in kcal/mol.
[pyr14][TFSI] [pyr13][FSI] [EMIM][BF4]
F s -101.6 -100.8 -97.3�F Li0(g)!Li0(l) 4.2 4.7 4.6�F Li0(l)!Li+(l) -105.8 -105.5 -101.9
49

z!
x!
Lz = 10 nm!
Pictorial)view)
Figure 1: Pictorial example of an ionic liquid (0.8[pyr14][TFSI] + 0.2Li[TFSI]) interfacedwith ideal basal-plane graphite electrodes as modeled in the present work. The distancebetween the electrodes in the non-periodic z-direction, Lz, is 10 nm. Lithium ions are shownas enlarged yellow atoms.
50

0
1
2
3
4
5
m (µ
C/c
m2 )
xLi = 0.0xLi = 0.2
0
1
2
3
4
5
m (µ
C/c
m2 )
xLi = 0.0xLi = 0.2
0 1 2 3 4Time (ns)
0
1
2
3
4
5
m (µ
C/c
m2 )
xLi = 0.0xLi = 0.2
-3 -2 -1 0 1 2 3^ (V)
(a)
(b)
(c)
(b)
(d)
(f)
[pyr14][TFSI]
[pyr13][FSI]
[EMIM][BF4]
[pyr14][TFSI]
[pyr13][FSI]
[EMIM][BF4]
6^ = 2.1 V
6^ = 4.2 V
6^ = 2.1 V
6^ = 4.2 V
6^ = 2.1 V
6^ = 4.2 V
Figure 2: Surface charge density as a function of simulation time for our ionic liquid systemswith the � values of 2.1 and 4.2 V. The initial configurations for these simulations areobtained from the trajectories of � = 0 V simulations.
51

1
2
3
4
5
6C
dl (µ
F/cm
2 )
1
2
3
4
5
6
Cdl (µ
F/cm
2 )
-3 -2 -1 0 1 2 3�^�-�^�
0 (V)
1
2
3
4
5
6
Cdl (µ
F/cm
2 )
-3 -2 -1 0 1 2 3�^�-�^�
0 (V)
(a)
(c)
(e)
(b)
(d)
(f)
[pyr14][TFSI]
[pyr13][FSI]
[EMIM][BF4]
0.8[pyr14][TFSI] + 0.2Li[TFSI]
0.8[pyr13][FSI] + 0.2Li[FSI]
0.8[EMIM][BF4] + 0.2Li[BF4]
Figure 3: Differential capacitance as a function of surface potential of our three ionic liquidsystems having xLi values of 0.0 (a,c,e) and 0.2 (b,d,f). Data in (e) is reproduced from aprevious work.85
52

0
10
20
30
40C
dl (µ
F/cm
2 )TheoryExp.
0
15
30
45
60
Cdl (µ
F/cm
2 )
TheoryExp.
-3 -2 -1 0 1 2 3�^�-�^�
0 (V)
0
10
20
30
40
Cdl (µ
F/cm
2 )
-3 -2 -1 0 1 2 3�^�-�^�
0 (V)
TheoryExp.
(a)
(c)
(e)
(b)
(d)
(f)
[pyr14][TFSI]
[pyr13][FSI]
[EMIM][BF4]
0.8[pyr14][TFSI] + 0.2Li[TFSI]
0.8[pyr13][FSI] + 0.2Li[FSI]
0.8[EMIM][BF4] + 0.2Li[BF4]
Figure 4: Differential capacitance as a function of surface potential of our three ionic liquidsystems having xLi values of 0.0 (a,c,e) and 0.2 (b,d,f). Computational results are shown assolid symbols, while the experimental capacitance on glassy carbon electrodes is given byopen symbols.
53

-10
-5
0
5
10
�m� (µ
Cucm
-2)
-3 -2 -1 0 1 2 3�^� (V)
0
5
10
15
20
25
6Eed
l (kca
l·mol
-1·n
m-2
)
[pyr14][TFSI][pyr13][FSI][EMIM][BF4]
-3 -2 -1 0 1 2 3�^� (V)
0
5
10
15
20
-6Fed
l (kca
l·mol
-1·n
m-2
)
[pyr14][TFSI][pyr13][FSI][EMIM][BF4]
-10 -5 0 5 10�m� (µC·cm-2)
0
5
10
15
20
6Fed
l (kca
l·mol
-1·n
m-2
)
[pyr14][TFSI][pyr13][FSI][EMIM][BF4]
(a)
(c)
xLi = 0.0
xLi = 0.2
(d)xLi = 0.2
Figure 5: Free energy of EDL formation (�Fedl) (solid lines) and surface charge (h�i)(dashed lines) as a function of surface potential (h i) for the three neat ionic liquids ofinterest at 363 K. Values of surface charge are included to allow conversion of �F edl from afunction of h i to h�i.
54

0
3
6l(6
z) (n
m-3
)Total[pyr14][TFSI]Li+
0
3
6
l(6
z) (n
m-3
)
Total[pyr14][TFSI]Li+
0 25 506z (Å)
0
3
6
l(6
z) (n
m-3
)
0 25 506z (Å)
Total[pyr14][TFSI]Li+
-50-2502550z (Å)
(a)
(c)
(e)
(b)
(d)
(f)
Figure 6: Average density profiles for ions in [pyr14][TFSI] as a function of distance fromthe (a,b) neutral electrode surface at � = 0 V, (c,d) the cathode surface at � = 4.2 V,and the anode surface at � = 4.2 V. Profiles for both neat [pyr14][TFSI] (a,c,e) as wellas that having xLi = 0.2 (b,d,f) are displayed. Data in (e) is reproduced from a previouswork.85
55

0
1
2
N (n
m-2
)
[pyr14][TFSI]
0
1
2
bN (n
m-2
)0
1
2
N (n
m-2
)
[pyr13][FSI]
0
1
2
bN (n
m-2
)
-2 -1 0 1 2�^� - �^�
0 (V)
0
1
2
N (n
m-2
)
[EMIM][BF4]
-2 -1 0 1 2�^� - �^�
0 (V)
0
1
2
bN (n
m-2
)
-50-2502550z (Å)
(a)
(c)
(e) [EMIM][BF4]
[pyr13][FSI]
filled symbols - xLi = 0
open symbols - xLi = 0.2
filled symbols - xLi = 0
open symbols - xLi = 0.2
(b)
(d)
(f) [EMIM][BF4]
[pyr13][FSI]
[pyr14][TFSI]
Figure 7: Composition of the surface ion layer, N , (a, c, and e) and net increase in surfaceion density, �N (b, d, and f) for ionic liquids having xLi values of 0.0 and 0.2. Potential isreferenced to the potential of zero charge found at � = 0 V. Data in (e) is reproducedfrom a previous work.85
56

0 1 2〈Ψ〉
0 - 〈Ψ〉 (V)
0
25
50
75
100
% p
lana
r sur
face
cat
ions
[pyr14][TFSI][pyr13][FSI][EMIM][BF4]
0 1 2〈Ψ〉 - 〈Ψ〉0 (V)
40
60
80
100
% fl
at s
urfa
ce a
nion
s
[pyr14][TFS][pyr13][FSI][EMIM][BF4]
(a)
(b)
filled symbols - xLi = 0open symbols - xLi = 0.2
filled symbols - xLi = 0open symbols = xLi = 0.2
Figure 8: Percent of cations at the electrode surface that are planar (a) and the percentof anions at the electrode surface that lie flat as a function of electrode potential, withpotential being referenced to the potential of zero charge found at � = 0 V. Data plottedwith filled symbols and open symbols are obtained from systems having xLi values of 0.0 and0.2, respectively. Data for neat [EMIM][BF4] is reproduced from a previous work.85
57

Δρ#
Δρ#
ρLi#
(a)#
(d)#
(g)#
(b)#
(e)#
(h)#
(c)#
(f)#
(i)#
[pyr14][TFSI], [pyr13][FSI], [EMIM][BF4],
Figure 9: Color contour plot of ion densities in (a,d,g) [pyr14][TFSI], (b,e,h) [pyr13][FSI],and (c,f,i) [EMIM][BF4] as a function of distance from the electrode with 0 V < � < 4.2V. Net ion density, or cation density minus anion density, is shown for ionic liquids in theneat form (a,b,c), as well as those having xLi = 0.2 (d,e,f). Also shown is the density of Li+(g,h,i) in ionic liquid systems having xLi = 0.2.
58
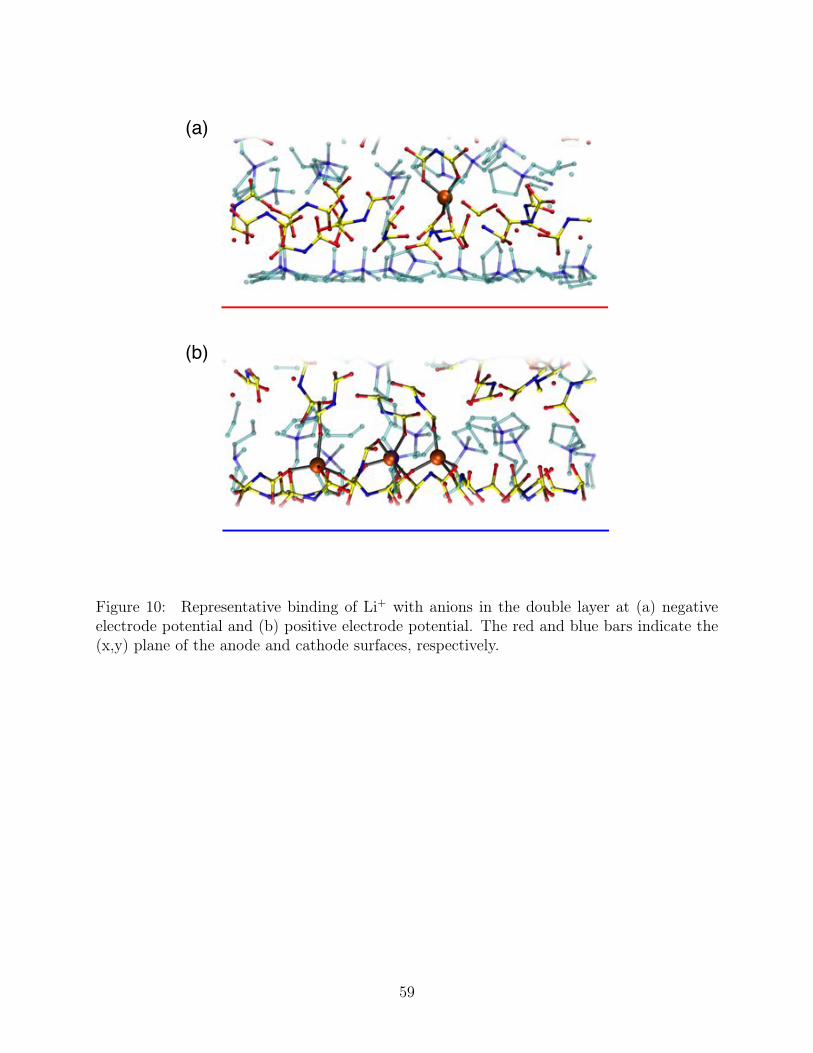
(a)!
(b)!
Figure 10: Representative binding of Li+ with anions in the double layer at (a) negativeelectrode potential and (b) positive electrode potential. The red and blue bars indicate the(x,y) plane of the anode and cathode surfaces, respectively.
59

-105
-102
-99
-96
-93
Fs (6z)
(kca
l/mol
)
Neutral ElectrodeNegative ElectrodePositive Electrode
-45
-40
-35
-30
-25
-20
-15
-102
-99
-96
-93
Fs (6z)
(kca
l/mol
)
Neutral ElectrodeNegative ElectrodePositive Electrode
-50
-40
-30
0 5 10 15 20 25 306z (Å)
-99
-96
-93
-90
-87
Fs (6z)
(kca
l/mol
)
Neutral ElectrodeNegative ElectrodePositive Electrode
0 20 40 606z (Å)
-50
-45
-40
-35
-30
-25
-20
(a)
(b)
(c)
(b)
(d)
(f)
[pyr14][TFSI]
[pyr13][FSI]
[EMIM][BF4]
[pyr14][TFSI]
[pyr13][FSI]
[EMIM][BF4]
Figure 11: Solvation free energy of Li+ in our three neat ionic liquids as a function ofdistance from the electrode. Shown are the F s profiles against electrodes having � = 0 V(solid black line) as well as against the negative electrode (dashed red line) and the positiveelectrode (dashed-dotted blue line), where � between the electrodes is held at 4.2 V.
60

(a)!
(b)!
(c)!
Figure 12: Solvation structure of Li+ when inserted into the second ion layer adjacent tothe positive electrode (cation layer). Structures are shown against the positive electrode ofa system have a � of 4.2 V for (a) [pyr14][TFSI], (b) [pyr13][FSI], and (c) [EMIM][BF4].
61

SUPPLEMENTARY MATERIAL
Contents
1. Ion Density Profiles 12. Electrostatic Potential Profile 43. Ion Center of Mass Profiles 44. Ion Surface Configuration 8
1. Ion Density Profiles
1

SUPPLEMENTARY MATERIAL 2
0
3
6
9
12l(6
z) (n
m-3
)Total[pyr13][FSI]Li+
0
3
6
9
12
l(6
z) (n
m-3
)
Total[pyr13][FSI]Li+
0 25 506z (Å)
0
3
6
9
12
l(6
z) (n
m-3
)
0 25 506z (Å)
Total[pyr13][TFSI]Li+
-50-2502550z (Å)
(a)
(c)
(e)
(b)
(d)
(f)
Figure S1. Average atomic density profiles for ions in [pyr13][FSI] as afunction of distance from the (a,b) neutral electrode surface at ∆Ψ = 0 V,(c,d) the cathode surface at ∆Ψ = 4.2 V, and the anode surface at ∆Ψ = 4.2V. Profiles for both neat [pyr13][FSI] (a,c,e) as well as that having xLi =0.2 (b,d,f) are displayed.

SUPPLEMENTARY MATERIAL 3
0369
1215
l(6
z) (n
m-3
)Total[EMIM][BF4]
Li+
0369
1215
l(6
z) (n
m-3
)
Total[EMIM][BF4]
Li+
0 25 506z (Å)
0369
1215
l(6
z) (n
m-3
)
0 25 506z (Å)
Total[EMIM][BF4]
Li+
-50-2502550z (Å)
(a)
(c)
(e)
(b)
(d)
(f)
Figure S2. Average atomic density profiles for ions in [EMIM][BF4] as afunction of distance from the (a,b) neutral electrode surface at ∆Ψ = 0 V,(c,d) the cathode surface at ∆Ψ = 4.2 V, and the anode surface at ∆Ψ = 4.2V. Profiles for both neat [EMIM][BF4] (a,c,e) as well as that having xLi =0.2 (b,d,f) are displayed.

SUPPLEMENTARY MATERIAL 4
2. Electrostatic Potential Profile -10
-5
0
5
10
�m� (µ
Cucm
-2)
-50 -25 0 25 50z (Å)
-1.5
-1
-0.5
0
0.5
1El
ectro
stat
ic P
oten
tial (
V)
[pyr14][TFSI][pyr13][FSI][EMIM][BF4]
-3 -2 -1 0 1 2 3�^� (V)
0
5
10
15
20
-6Fed
l (kca
l·mol
-1·n
m-2
)
[pyr14][TFSI][pyr13][FSI][EMIM][BF4]
-10 -5 0 5 10�m� (µC·cm-2)
0
5
10
15
20
6Fed
l (kca
l·mol
-1·n
m-2
)
[pyr14][TFSI][pyr13][FSI][EMIM][BF4]
(a)(c)
xLi = 0.0
xLi = 0.2
(d)xLi = 0.2
6^ = 0 VxLi=0
Figure S3. Electrostatic potential as a function of z for our model ca-pacitor system having neat electrolyte and a ∆Ψ of 0 V.
3. Ion Center of Mass Profiles

SUPPLEMENTARY MATERIAL 5
0.1
1
10l(6
z) (n
m-3
)Total[pyr14][TFSI]Li+
0.01
0.1
1
10
l(6
z) (n
m-3
)
Total[pyr14][TFSI]Li+
0 10 206z (Å)
0.1
1
10
l(6
z) (n
m-3
)
0 10 206z (Å)
Total[pyr14][TFSI]Li+
-50-2502550z (Å)
(a)
(c)
(e)
(b)
(d)
(f)
Figure S4. Average density profiles of ion centers of mass in [pyr14][TFSI]as a function of distance from the (a,b) neutral electrode surface at ∆Ψ = 0V, (c,d) the cathode surface at ∆Ψ = 4.2 V, and the anode surface at∆Ψ = 4.2 V. Profiles for both neat [EMIM][BF4] (a,c,e) as well as thathaving xLi = 0.2 (b,d,f) are displayed.

SUPPLEMENTARY MATERIAL 6
0.1
1
10
l(6
z) (n
m-3
)Total[pyr13][FSI]Li+
0.01
0.1
1
10
l(6
z) (n
m-3
)
Total[pyr13][FSI]Li+
0 10 206z (Å)
0.1
1
10
l(6
z) (n
m-3
)
0 10 206z (Å)
Total[pyr13][FSI]Li+
-50-2502550z (Å)
(a)
(c)
(e)
(b)
(d)
(f)
Figure S5. Average density profiles of ion centers of mass in [pyr13][FSI]as a function of distance from the (a,b) neutral electrode surface at ∆Ψ = 0V, (c,d) the cathode surface at ∆Ψ = 4.2 V, and the anode surface at∆Ψ = 4.2 V. Profiles for both neat [pyr13][FSI] (a,c,e) as well as thathaving xLi = 0.2 (b,d,f) are displayed.

SUPPLEMENTARY MATERIAL 7
0.1
1
10l(6
z) (n
m-3
)Total[EMIM][BF4]
Li+
0.01
0.1
1
10
l(6
z) (n
m-3
)
Total[EMIM][BF4]
Li+
0 10 206z (Å)
0.1
1
10
l(6
z) (n
m-3
)
0 10 206z (Å)
Total[EMIM][BF4]
Li+
-50-2502550z (Å)
(a)
(c)
(e)
(b)
(d)
(f)
Figure S6. Average density profiles of ion centers of mass in [EMIM][BF4]as a function of distance from the (a,b) neutral electrode surface at ∆Ψ = 0V, (c,d) the cathode surface at ∆Ψ = 4.2 V, and the anode surface at∆Ψ = 4.2 V. Profiles for both neat [EMIM][BF4] (a,c,e) as well as thathaving xLi = 0.2 (b,d,f) are displayed.

SUPPLEMENTARY MATERIAL 8
4. Ion Surface Configuration
(a)! (b)!
(d)!(c)!
(f)!(e)!
CATHODE(ANODE(
Figure S7. The most common configuration of ionic liquid cations (a,c,e)and anions (b,d,f) at an anode and cathode, respectively, having a ∆Ψ of4.2 V. The red and blue bars indicate the (x,y) plane of the anode andcathode surfaces, respectively.

SUPPLEMENTARY MATERIAL 9
0
0.02
0.04
Angl
e D
ensi
ty
6^ = 0 V6^ = 4.2 V
0
1
2
bN (n
m-2
)
0
0.02
0.04
Angl
e D
ensi
ty
6^ = 0 V6^ = 4.2 V
0
1
2
bN (n
m-2
)
0 30 60 90Angle (degree)
0
0.02
0.04
0.06
Angl
e D
ensi
ty
6^ = 0 V6^ = 4.2 V
-2 -1 0 1 2�^� - �^�
0 (V)
0
1
2
bN (n
m-2
)
-50-2502550z (Å)
(a)
(b)
(c) [EMIM][BF4]
[pyr13][FSI]
[pyr14]
filled symbols - xLi = 0
open symbols - xLi = 0.2
(b)
(d)
(f) [EMIM][BF4]
[pyr13][FSI]
[pyr14][TFSI]
[pyr13]
[EMIM]
Figure S8. Distribution of configuration angles for cations in the surfaceion layer from neat ionic liquids at ∆Ψ = 0 and 4.2 V. Given are (a) [pyr14],(b) [pyr13], and (c) [EMIM].

SUPPLEMENTARY MATERIAL 10
0
0.04
0.08
0.12
0.16
Angl
e D
ensi
ty
6^ = 0 V6^ = 4.2 V
0
1
2
bN (n
m-2
)
0
0.04
0.08
0.12
Angl
e D
ensi
ty
6^ = 0 V6^ = 4.2 V
0
1
2
bN (n
m-2
)
0 30 60 90Angle (degree)
0
0.02
0.04
0.06
Angl
e D
ensi
ty
6^ = 0 V6^ = 4.2 V
-2 -1 0 1 2�^� - �^�
0 (V)
0
1
2
bN (n
m-2
)
-50-2502550z (Å)
(a)
(b)
(c) [EMIM][BF4]
[pyr13][FSI]
[TFSI]
filled symbols - xLi = 0
open symbols - xLi = 0.2
(b)
(d)
(f) [EMIM][BF4]
[pyr13][FSI]
[pyr14][TFSI]
[FSI]
[BF4]
Figure S9. Distribution of configuration angles for anions in the surfaceion layer from neat ionic liquids at ∆Ψ = 0 and 4.2 V. Given are (a) [TFSI],(b) [FSI], and (c) [BF4].