computational analysis of surface plasmon resonancepsasir.upm.edu.my/5156/1/fs_2008_38.pdf ·...
TRANSCRIPT

UNIVERSITI PUTRA MALAYSIA
COMPUTATIONAL ANALYSIS OF SURFACE PLASMON RESONANCE
ROSMIZA MOKHTAR
FS 2008 38
COMPUTATIONAL ANALYSIS OF SURFACE PLASMON RESONANCE
ROSMIZA MOKHTAR
DOCTOR OF PHILOSOPHY UNIVERSITI PUTRA MALAYSIA
2008

COMPUTATIONAL ANALYSIS OF SURFACE PLASMON RESONANCE
By
ROSMIZA MOKHTAR
Thesis Submitted to the School of Graduate Studies, Universiti Putra Malaysia, in Fulfilment of the Requirements for the Degree of Doctor of Philosophy
January 2008

xiv
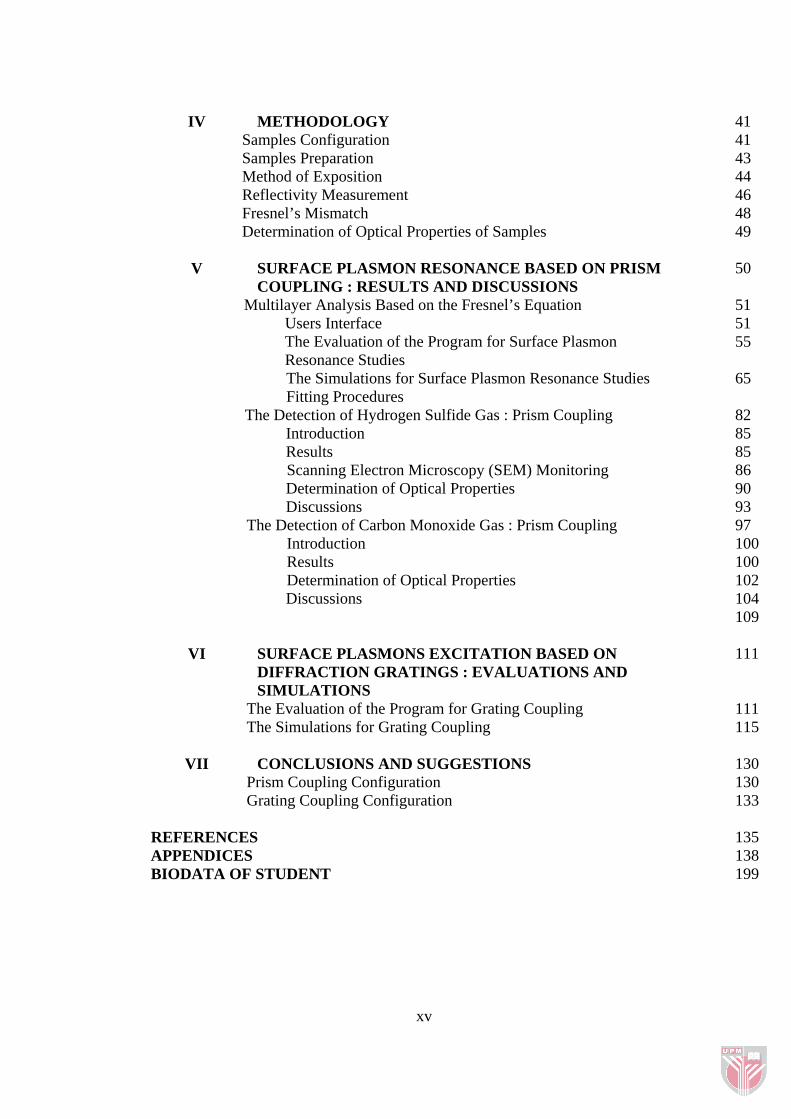
TABLE OF CONTENTS Page DEDICATION ii ABSTRACT iii ABSTRAK vi ACKNOWLEDGEMENTS ix APPROVAL xi DECLARATION xiii LIST OF TABLES xvi LIST OF FIGURES xvii LIST OF ABBREVIATIONS AND GLOSSARY OF TERMS xxiv CHAPTER
I INTRODUCTION 1 Background of the Work Prism Coupling Configuration Grating Coupling Configuration Surface Plasmon Resonance (SPR) Technique as a Tool for the Toxic Gas Detection Objectives of the Project Outlines of the Thesis
1 2 3 3 4 5
II LITERATURE REVIEW 7
Background of Surface Plasmon Resonance Metals as an Active Medium Surface Plasmon Resonance Method and Other Method – A Comparison Application of Surface Plasmon Resonance Method as a Gas Sensor
7 9 10 12
III THEORETICAL 14
General Properties of Surface Plasma Wave Excitation of Surface Plasma Wave Methods of Coupling to Surface Plasma Wave Computer Program Development Based on Fresnel’s Equation Computer Program Development Based on the Diffraction Theory of Multicoated Grating
Statement of the Problem Eigenvalue Equation and Expression of the Total Field Boundary Conditions
15 19 21 23 29 30 32 36
xv
IV METHODOLOGY 41
Samples Configuration Samples Preparation Method of Exposition Reflectivity Measurement Fresnel’s Mismatch Determination of Optical Properties of Samples
41 43 44 46 48 49
V SURFACE PLASMON RESONANCE BASED ON PRISM
COUPLING : RESULTS AND DISCUSSIONS 50
Multilayer Analysis Based on the Fresnel’s Equation Users Interface The Evaluation of the Program for Surface Plasmon Resonance Studies The Simulations for Surface Plasmon Resonance Studies Fitting Procedures
The Detection of Hydrogen Sulfide Gas : Prism Coupling Introduction Results Scanning Electron Microscopy (SEM) Monitoring Determination of Optical Properties Discussions
The Detection of Carbon Monoxide Gas : Prism Coupling Introduction Results Determination of Optical Properties Discussions
51 51 55 65 82 85 85 86 90 93 97 100 100 102 104 109
VI SURFACE PLASMONS EXCITATION BASED ON
DIFFRACTION GRATINGS : EVALUATIONS AND SIMULATIONS
111
The Evaluation of the Program for Grating Coupling The Simulations for Grating Coupling
111 115
VII CONCLUSIONS AND SUGGESTIONS 130
Prism Coupling Configuration Grating Coupling Configuration
130 133
REFERENCES 135 APPENDICES 138 BIODATA OF STUDENT 199

ii
DEDICATION
To my dearest husband, daughter and son,
ABD. HALIM B. BAIJAN AMEERA FARZANA BT. ABD. HALIM
AMEER FARHAN B. ABD. HALIM
To my father and mother,
MOKHTAR B. YAHYA RABIAH BT. YA’ACOB
To my sisters and brother,
ROSMAYA BT. MOKHTAR MOHD. RIDZUAN B. MOKHTAR
ROSLINA BT. MOKHTAR

iii
Abstract of thesis presented to the Senate of Universiti Putra Malaysia in fulfilment of the requirement for the degree of Doctor of Philosophy
COMPUTATIONAL ANALYSIS OF SURFACE PLASMON RESONANCE
By
ROSMIZA MOKHTAR
January 2008
Chairman : Zainul Abidin Hassan, PhD Faculty : Science
The Surface Plasmon Resonance (SPR) technique was used as a sensitive optical
sensor as well as characterizing materials. To achieve these, two computer programs
were developed to carry out an accurate curve fitting of theory to reflectivity data.
Two programs were developed preceding from the following requirement that SPR
technique can be carried out by using two configurations. The first configuration was
the prism coupling, where the program was developed based on the Fresnel’s
Equations. The second configuration was the grating coupling, where the program
was developed based on the coordinate-transformation-based differential method of
Chandezon et al. (1980) (the C Method). The fitting process was done by adjusting
the relevant parameters (i.e., thickness and dielectric constants) until the lowest sum
of square error was obtained. In order to know whether the results from the
developed computer program represent the real situation, we have examined our
program with the experimental results carried out by other researchers. We have

iv
achieved a satisfactory agreement. Furthermore, surface plasmon resonance
simulations on single and multilayer were presented to motivate an effort to
understand the shape of the resonances when a surface was exposed to the
environment filled with toxic gas. The film growth due to the exposition was studied
by understanding the effect of increasing thickness and also the modification of
effective permittivity. We also investigated the effect on surface plasmon resonance
by varying the grating period and grating profile. We achieved an excellent
understanding of the shape of reflectivity curve when the optical constants of layers,
the grating period and grating profile, were varied, for both prism coupling and
grating coupling, respectively.
In the SPR measurement, the angle of resonance is very sensitive to any surface layer
over a metal thin film. The existence of extremely thin surface layer can cause a
detectable shift of the SPR curve, which indicates the sensitivity of resonance angle
to the changes in the environment of the metal layer. In the present work, SPR
technique was used as a tool for the detection of toxic gases, i.e. hydrogen sulfide
(H2S) gas and carbon monoxide (CO) gas. The gold-coated prism was used as a
sensor head. The experiments were carried out by measuring the reflected intensity
as a function of incident angle. By using the developed programs, the optical
permittivity of the material was obtained giving an accurate characterization
of the changes brought about by the H2S and CO gases. This is one of the important
characteristics of constructing the optical gas sensor.

v
We have theoretically modeled a surface plasmon resonance device that is sensitive
to both the refractive index and thickness of an adsorbed film. An extensive
numerical simulation of the sensor is performed using the scattering matrix approach.
The method is capable of monitoring environmental changes in a wide range of
applications. With further effort and modification, we believe it is possible to expand
the functionality of the surface plasmon resonance sensor to provide powerful tools
for the determinations of optical constant of materials and also the determination of
grating profiles and grating period. Some of the limitations and breakdowns may also
be fixed in the future.

vi
Abstrak tesis yang dikemukakan kepada Senat Universiti Putra Malaysia sebagai memenuhi keperluan untuk ijazah Doktor Falsafah
ANALISIS KOMPUTER BAGI RESONAN PLASMON PERMUKAAN
Oleh
ROSMIZA MOKHTAR
Januari 2008
Pengerusi : Zainul Abidin Hassan, PhD Fakulti : Sains
Teknik Resonan Plasmon Permukaan (SPR) telah digunakan sebagai sensor optik
yang sensitif dan juga untuk mencirikan bahan-bahan. Untuk mencapai tujuan ini,
dua program komputer telah dibangunkan untuk melakukan dengan tepat
penyesuaian data-data ujikaji dengan data-data teori. Dua program tersebut
dibangunkan berdasarkan kepada keperluan berikut, iaitu teknik SPR boleh
dilakukan dengan menggunakan dua konfigurasi. Konfigurasi yang pertama adalah
gandingan prisma, di mana program komputer telah dibangunkan berdasarkan
persamaan Fresnel. Konfigurasi kedua adalah gandingan parutan, di mana program
komputer telah dibangunkan berdasarkan kaedah pembezaan asas-transformasi-
koordinat oleh Chandezon dan rakan-rakan (1980) (C Method). Proses penyesuaian
data-data ujikaji dengan data-data teori dilakukan dengan cara memasukkan
parameter-parameter tertentu (iaitu ketebalan saput tipis dan pemalar-pemalar
dielektrik) secara kaedah cuba jaya sehingga ralat jumlah kuasa dua terkecil
diperolehi. Untuk mengetahui sama ada hasil yang diperolehi dari program komputer

vii
yang dibangunkan menyamai situasi sebenar, program komputer tersebut telah diuji
dengan data-data eksperimen yang telah dilakukan oleh penyelidik-penyelidik lain.
Didapati hasil dari program komputer tersebut memberikan persetujuan yang
memuaskan. Tambahan lagi, simulasi resonan plasmon permukaan ke atas satu atau
berbilang lapisan dilakukan bagi mendorong usaha untuk memahami bentuk resonan
apabila sesuatu permukaan didedahkan kepada persekitaran yang dipenuhi dengan
gas toksid. Pembetukan saput tipis akibat dari pendedahan tersebut dikaji dengan
cara memahami kesan pertambahan ketebalan dan juga pengubahsuaian pemalar
dielektrik. Kesan perubahan tempoh parutan dan profil parutan ke atas resonan
plasmon permukaan turut dikaji. Pemahaman yang mendalam tentang bentuk
lengkungan keterpantulan apabila pemalar-pemalar optik lapisan-lapisan, tempoh
parutan dan profile parutan diubah telah dicapai.
Dalam pengukuran SPR, sudut resonan adalah sangat sensitif terhadap mana-mana
lapisan permukaan di atas saput tipis logam. Kewujudan lapisan pemukaan yang
sangat tipis boleh menyebabkan anjakan lengkungan SPR dikesan, menunjukkan
kepekaan sudut resonan terhadap perubahan dalam persekitaran lapisan logam.
Dalam kajian ini, teknik SPR digunakan sebagai alat untuk mengesan gas-gas toksid
seperti gas hidrogen sulfida (H2S) dan gas karbon monoksida (CO). Prisma yang
disaput dengan logam emas digunakan sebagai alat pengesan. Eksperimen dijalankan
dengan mengukur keamatan keterpantulan optik sebagai fungsi kepada sudut tuju.
Dengan menggunakan program-program komputer yang dibangunkan, pemalar
dielektrik bahan diperolehi, memberikan ketepatan dalam pencirian bahan akibat dari

viii
perubahan yang disebabkan oleh gas H2S dan CO. Ini merupakan satu daripada ciri-
ciri penting dalam membina alat pengesan gas secara optik.
Alat pengukuran resonan plasmon permukaan yang peka terhadap kedua-dua indeks
biasan dan ketebalan saput tipis bahan telah berjaya dimodelkan secara teori.
Simulasi angka secara meluas ke atas alat pengesan dijalankan dengan menggunakan
pendekatan ‘scattering matrix’. Kaedah ini berupaya untuk memantau perubahan-
perubahan persekitaran dalam julat aplikasi yang besar. Dengan usaha dan
pengubahsuaian lanjut, fungsi alat pengesan resonan plasmon permukaan ini boleh
dikembangkan lagi untuk menyediakan satu alat bagi menentukan pemalar optik
bahan dan juga tempoh dan profil parutan. Sebahagian daripada kelemahan program
yang dibangunkan boleh dibaiki pada masa hadapan.

ix
ACKNOWLEDGEMENTS
In the name of Allah, Most Gracious, Most Merciful, Praises and thanks belong only
to ALLAH S.W.T. for giving me the strength and patience and enable me to
complete this work.
My immense gratitude to Dr. Zainul Abidin Hassan, chairman of my supervisory
committee, for his excellent supervision, invaluable suggestions, helpful discussions,
beneficial advices, valuable support, endless patience and continuous encouragement
throughout this project. Similar appreciation is extended to members of my
supervisory committee, Prof. Dr. W. Mahmood Mat Yunus and Associate Prof. Dr.
Zainal Abidin Talib for their help in providing equipments for depositing thin layers
and measurements and also for their assistance, suggestions and guidance throughout
this work.
I would also like to express my thanks to ITMA (Dr. Hishamuddin Zainuddin) for
providing Mathematica V5.2 software and Universiti Tenaga Nasional (ITMS) for
providing the Visual Basic 6.0 Standard Edition software for the development of
computer programs.
Thanks to PASCA for providing the scholarship throughout this work. To Electron
Microscopic Unit, Faculty of Veterinar for letting me used the SEM equipment. To
Chemistry Department, Faculty of Science, UPM for providing the chemicals
resources. To Mechanical Workshop, Physics Department, Faculty of Science, UPM

x
for their helps in experimental set up manufacture. To all my friends in UPM and
UNITEN for their endless supports.
My deepest thanks to my mother, my father, my sisters and brother for their supports,
care and patience without which this work would never have succeeded. To my
dearest husband, daughter and son who have been always beside me, with endless
love and support and have made my life enjoyable.
Finally, may Allah rewards the people who helped me directly or indirectly in
finishing this work.

xi
I certify that an Examination Committee met on 9th January 2008 to conduct the final examination of Rosmiza Mokhtar on her Doctor of Philosophy thesis entitle “Computational Analysis of Surface Plasmon Resonance” in accordance with Universiti Pertanian Malaysia (Higher Degree) Act 1980 and Universiti Pertanian Malaysia (Higher Degree) Regulations 1981. The Committee recommends that the student be awarded the degree of Doctor of Philosophy. Members of the Examination Committee were as follows: Zaidan Abdul Wahab, PhD Assoc. Professor Faculty of Science Universiti Putra Malaysia (Chairman) Elias Saion, PhD Professor Faculty of Science Universiti Putra Malaysia (Internal Examiner) Maarof Moksin, PhD Professor Faculty of Science Universiti Putra Malaysia (Internal Examiner) Ibrahim Talib, PhD Professor Faculty of Science and Technology Universiti Kebangsaan Malaysia (External Examiner) ______________________________________
HASANAH MOHD. GHAZALI, PhD Professor and Deputy Dean School of Graduate Studies Universiti Putra Malaysia Date: 28 April 2008
xii
This thesis was submitted to the Senate of Universiti Putra Malaysia and has been accepted as fulfilment of the requirement for the degree of Doctor of Philosophy. The members of the Supervisory Committee were as follows: Zainul Abidin Hassan, PhD Lecturer Faculty of Science Universiti Putra Malaysia (Chairman) W. Mahmood Mat Yunus, PhD Professor Faculty of Science Universiti Putra Malaysia (Member) Zainal Abidin Talib, PhD Associate Professor Faculty of Science Universiti Putra Malaysia (Member)
_____________________________
AINI IDERIS, PhD Professor and Dean School of Graduate Studies Universiti Putra Malaysia Date: 8 May 2008

xiii
DECLARATION
I declare that the thesis is my original work except for quotations and citations which have been duly acknowledged. I also declare that it has not been previously, and is not concurrently, submitted for any other degree at UPM or at any other institution.
_______________________
ROSMIZA MOKHTAR Date: 9 January 2008

xvi
LIST OF TABLES Table Page 4.1 Conditions for sputtering process 43 5.1 List of permittivities and molecule thicknesses of selected
gasses 75
5.2 List of dielectric constants and thickness of pure gold
before and after the exposure to H2S 94
5.3 List of dielectric constants and thickness of pure gold
before and after the exposure to CO gas 106
6.1 Eigenvalues of equation (3.41) in medium 1 for the grating
case with grating profile defined by equation (6.1) as computed with the truncation order N = 11
113
6.2 Eigenvalues of equation (3.41) in medium 2 for the grating
case with grating profile defined by equation (6.1) as computed with the truncation order N = 11
114
6.3 Diffraction efficiencies of the grating of case with grating
profile defined by equation (6.1) as computed by the developed program with the truncation order N = 11
114

LIST OF FIGURES Figure Page 3.1 Surface plasma wave at the interface with complex
dielectric function 1ε and 2ε 16
3.2 A TM polarized wave passing from medium 2 to
medium 1 17
3.3 Dispersion of a surface plasma wave, where spω is the
surface plasmon frequency 20
3.4 (a) Propagation of EM fields in multilayer thin film
system with N-1 layers, and (b) an incident ray i hits interface 0-1 at an angle and refracted into medium 1 at angle and reflected in medium 0 at angle
oθ
1θ rθ
26
3.5 Flow-chart for reflection and transmission versus angle of
incidence 28
3.6 Notation and Cartesian coordinate system for a grating 31 3.7 Definitions of the spatial domains , D1, D2
and Do +D , −D 31
4.1 Prism-coupler structures (a) Kretschmann prism
arrangement and (b) Otto prism arrangement 42
4.2 Schematic of diffraction of light at the surface of a
diffraction grating 42
4.3 Illustration of prism and target position in sputtering
technique (Polaron SC7640) 43
4.4 The schematic set up for the exposition procedure (H2S
gas) 45
4.5 Schematic set up for the exposition procedure (CO gas) 46 4.6 Schematic of experimental set up of the present
measurement 47
4.7 Attenuated total reflection at the boundary of the prism
and metal interface 48
xvii

5.1 The main page of the program 52 5.2 The main menu of the program 54 5.3 The interface program to calculate the reflectance and
transmittance as a function of incident angle 54
5.4 The reflectance for the P and S polarization as a function
of incidence angles for air/glass interface; λ = 546.1 nm, nglass = 1.50
56
5.5 The reflectance for the P and S polarization as a function
of incidence angle for air/silicon interface; λ = 546.1 nm, nsilicon = 4.05 – i0.028
57
5.6 The reflectance for the P and S polarization as a function
of incidence angle for air/gold interface; λ = 546.1 nm, ngold = 0.35 – i2.45
57
5.7 The reflectance for the P and S polarization as a function
of incidence angle for glass/air interface; λ = 546.1 nm, nglass = 1.50
58
5.8 The reflectance for the p-polarized light as a function of
incidence angles for prism/gold/air and prism/silver/air interfaces
59
5.9 The plot of reflectance and transmittance for p and s-
polarized incident light for air/glass interface; = 546.1 nm, nλ glass = 1.50
62
5.10 The plot of reflectance and transmittance for p and s-
polarized incident light for air/silicon interface; = 546.1 nm, nsilicon = 4.05 – i0.028 λ
62
5.11 The plot of reflectance and transmittance for p and s-
polarized incident light for glass/air interface; = 546.1 nm, nλ glass = 1.50
63
5.12 The plot of reflectance and transmittance for p and s-
polarized incident light for air/gold interface; = 546.1 nm, nλ gold = 0.35 – i2.45
64
5.13 The plot of transmittance and reflectance (insert to the
figure) for p and s-polarized incident light for gold/air interface; = 632.8 nm, ελ gold = -10.92 + i1.49
64
xviii

5.14 The plot of transmittance and reflectance (insert to the figure) for p and s-polarized incident light for silver/air interface; = 632.8 nm, εsilveλ r = -18.22 + i0.48
65
5.15 The plot of reflectance as a function of incidence angle
for different thickness 66
5.16 The relationship between the resonant angle, sprθ with the
thickness of layer 67
5.17 The relationship between the minimum reflectivity with
the thickness of layer 67
5.18 The plot of reflectance as a function of incidence angle
for different permittivity (real) 68
5.19 The plot of reflectance as a function of incidence angle
for different permittivity (imaginary) 69
5.20 The relationship between the resonant angle, sprθ with
real permittivity 70
5.21 The relationship between the reflectance (minimum) with
real permittivity 71
5.22 The relationship between the resonant angle, sprθ with
imaginary permittivity 71
5.23 The relationship between the reflectance (minimum) with
imaginary permittivity 72
5.24 The plot of reflectance as a function of incidence angle
for different wavelength of incidence light 73
5.25 Reflectivity curves for one layer and two layer of gold
thin film as a function of incident angle 74
5.26 Schematic diagram of the four mediums in the simulation,
where the permittivitties of prism, gold layer and air were fixed, while the one for gas layer was varied
75
5.27 The plot of reflectance as a function of incident angle for
the case without the gas layer and with the methane layer; = 589.3 nm, λ airε = 1.000 584, methaneε = 1.000 888,
thickness of methane layer = 0.109 nm
76
xix
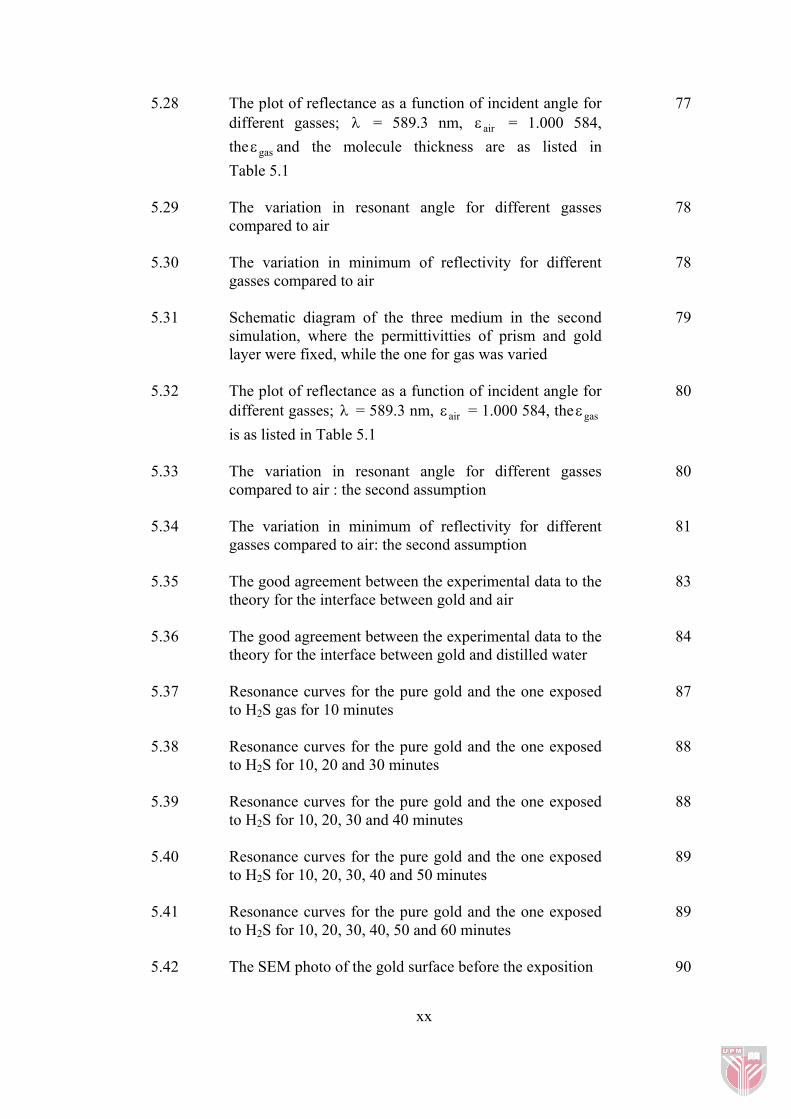
5.28 The plot of reflectance as a function of incident angle for different gasses; λ = 589.3 nm, airε = 1.000 584, the and the molecule thickness are as listed in Table 5.1
gasε
77
5.29 The variation in resonant angle for different gasses
compared to air 78
5.30 The variation in minimum of reflectivity for different
gasses compared to air 78
5.31 Schematic diagram of the three medium in the second
simulation, where the permittivitties of prism and gold layer were fixed, while the one for gas was varied
79
5.32 The plot of reflectance as a function of incident angle for
different gasses; λ = 589.3 nm, airε = 1.000 584, the is as listed in Table 5.1
gasε 80
5.33 The variation in resonant angle for different gasses
compared to air : the second assumption 80
5.34 The variation in minimum of reflectivity for different
gasses compared to air: the second assumption 81
5.35 The good agreement between the experimental data to the
theory for the interface between gold and air 83
5.36 The good agreement between the experimental data to the
theory for the interface between gold and distilled water 84
5.37 Resonance curves for the pure gold and the one exposed
to H2S gas for 10 minutes 87
5.38 Resonance curves for the pure gold and the one exposed
to H2S for 10, 20 and 30 minutes 88
5.39 Resonance curves for the pure gold and the one exposed
to H2S for 10, 20, 30 and 40 minutes 88
5.40 Resonance curves for the pure gold and the one exposed
to H2S for 10, 20, 30, 40 and 50 minutes 89
5.41 Resonance curves for the pure gold and the one exposed
to H2S for 10, 20, 30, 40, 50 and 60 minutes 89
5.42 The SEM photo of the gold surface before the exposition 90
xx
xxi
5.43 The SEM photo of the gold surface for 10 minutes of exposition
91
5.44 The SEM photo of the gold surface for 20 minutes of
exposition 91
5.45 The SEM photo of the gold surface for 30 minutes of
exposition 92
5.46 A good agreement of theoretical and experimental
reflectance curve for pure gold before the exposure 93
5.47 A good agreement of theoretical and experimental
reflectance curve for the case of exposition time of 10 minutes
94
5.48 The relationship between the real permittivity with time
of exposure to H2S gas 95
5.49 The relationship between the imaginary permittivity with
time of exposure to H2S gas 96
5.50 The relationship between the thickness of gold and gold
sulfide with time of exposure to H2S gas 96
5.51 The plot of reflectance as a function of incidence angle of
exposed and unexposed gold surface to carbon monoxide (CO) gas
103
5.52 Relationship between resonance angle with exposition
time 103
5.53 Relationship between reflectance minimum with
exposition time 104
5.54 A good agreement of theoretical and experimental
reflectance curve for pure gold before the exposure 105
5.55 A good agreement of theoretical and experimental
reflectance curve for the case of exposition time of 7 minutes
105
5.56 The relationship between the real permittivity with time
of exposure to CO gas 106
5.57 The relationship between the imaginary permittivity with
time of exposure to CO gas 107
5.58 The relationship between the thickness of gold and the new compound with time of exposure to CO gas
107
5.59 The condition of the gold surface after the exposition to
CO gas 109
6.1 The plot of efficiency as a function of incident angle for
grating profile A, for air/gold interface; λ = 590 nm, Ngold = 0.35 – i2.45. The ratio is varied from 1.0 to 2.6
116
6.2 The plot of incident angle as a function of ratio (=Λ /λ )
ranging from 1.0 to 2.6 for grating profile A, for air/gold interface; = 590 nm, Nλ gold = 0.35 – i2.45
116
6.3 The plot of efficiency as a function of ratio (=Λ /λ )
ranging from 1.0 to 2.6 for grating profile A, for air/gold interface; = 590 nm, Nλ gold = 0.35 – i2.45
117
6.4 The original grating profile, Profile A; where a1 = 0.1 and
a2 = 0.02 118
6.5 The grating profile, Profile B; where a1 = 0.1 118 6.6 The grating profile, Profile B1; where a2 = 0.02 118 6.7 The plot of efficiency as a function of incident angle for
Profile A, when the coefficient a1 is varied for air/gold interface; = 590 nm, Ngold = 0.35 – i2.45, ratio Λ /λ ) = 1.9
λ
(
119
6.8 The plot of efficiency as a function of incident angle for
Profile A, when the coefficient a2 is varied for air/gold interface; = 590 nm, Ngold = 0.35 – i2.45, ratio Λ /λ ) = 1.9
λ (
119
6.9 The plot of efficiency as a function of the coefficient a1
for Profile A; for air/gold interface; λ = 590 nm, Ngold = 0.35 – i2.45, ratio(Λ /λ )=1.9
120
6.10 The plot of resonant angle as a function of the coefficient
a1 for Profile A; for air/gold interface; λ = 590 nm, Ngold = 0.35 – i2.45, ratio(Λ /λ ) = 1.9
121
6.11 The plot of efficiency as a function of the coefficient a2
for Profile A; for air/gold interface; λ = 590 nm, Ngold = 0.35 – i2.45, ratio(Λ /λ ) =1.9
121
xxii

6.12 The plot of resonant angle as a function of the coefficient a2 for Profile A; for air/gold interface; λ = 590 nm, Ngold = 0.35 – i2.45, ratio(Λ /λ ) =1.9
122
6.13 The plot of efficiency as a function of incident angle for
Profile A and B for air/gold interface; Ratios are taken to be 1.0 and 1.9; λ = 590 nm, Ngold = 0.35 – i2.45
123
6.14 Plot of efficiency as a function of incident angle for
coefficient a1 ranging from 0.01 to 0.1, for air/gold interface, where λ = 590 nm, Ngold = 0.35 – i2.45, ratio(Λ / ) = 1.9 λ
123
6.15 Plot of efficiency as a function of coefficient a1 (ranging
from 0.01 to 0.1), for air/gold interface, where = 590 nm, Nλ gold = 0.35 – i2.45, ratio(Λ /λ ) = 1.9
124
6.16 Plot of resonant angle as a function of coefficient a1
(ranging from 0.01 to 0.1), for air/gold interface, where = 590 nm, Nλ gold = 0.35 – i2.45, ratio(Λ /λ ) = 1.9
124
6.17 Plot of efficiency as a function of incident angle for
Profile B, where the ratio (=Λ /λ ) is ranging from 1.0 to 2.6, for air/gold interface, where λ = 590 nm, Ngold = 0.35 – i2.45
125
6.18 Plot of efficiency as a function of ratio (=Λ /λ ) for
Profile B, where the coefficient a1 is taken to be 0.1, for air/gold interface, where λ = 590 nm, Ngold = 0.35 – i2.45
126
6.19 Plot of resonant angle as a function of ratio (=Λ /λ ) for
Profile B, where the coefficient a1 is taken to be 0.1, for air/gold interface, where λ = 590 nm, Ngold = 0.35 – i2.45
126
6.20 Plot of efficiency as a function of ratio (=Λ /λ ) for
Profile A and B, where the coefficient a1 and a2 is taken to be 0.1 and 0.02, respectively, for air/gold interface, where = 590 nm, Nλ gold = 0.35 – i2.45
127
6.21 Plot of resonant angle as a function of ratio (=Λ /λ ) for
Profile A and B, where the coefficient a1 and a2 is taken to be 0.1 and 0.02, respectively, for air/gold interface, where = 590 nm, Nλ gold = 0.35 – i2.45
127
6.22 The plot of efficiency as a function of incident angle for
different metal layer; For Profile A, ratio (Λ /λ ) = 1.0, = 590 nm λ
129
xxiii