computational analysis of shrouded wind turbine...
TRANSCRIPT

lable at ScienceDirect
Renewable Energy 75 (2015) 818e832
Contents lists avai
Renewable Energy
journal homepage: www.elsevier .com/locate/renene
Computational analysis of shrouded wind turbine configurationsusing a 3-dimensional RANS solver
Aniket C. Aranake a, *, Vinod K. Lakshminarayan a, Karthik Duraisamy b
a Department of Aeronautics and Astronautics, Stanford University, Stanford, CA 94035, USAb Department of Aerospace Engineering, University of Michigan, Ann Arbor, MI, USA
a r t i c l e i n f o
Article history:Received 7 August 2013Accepted 18 October 2014Available online
Keywords:Wind energyShrouded wind turbinesDAWTCFDTransition model
* Corresponding author.E-mail address: [email protected] (A.C. A
http://dx.doi.org/10.1016/j.renene.2014.10.0490960-1481/© 2014 Elsevier Ltd. All rights reserved.
a b s t r a c t
The use of a shroud is known to improve performance. In this work, the flow physics and performance ofshrouded turbines is assessed by solving the Reynolds Averaged NaviereStokes equations supplementedwith a transition model. Shroud geometries are evaluated for their augmentation of mass flow throughthe turbine. Initial assessments are performed using axisymmetric calculations of annular wings withhigh-lift airfoils as cross sections. The mass flow amplification factor is defined as a performanceparameter and is found to increase nearly linearly with radial lift force. From a selection of consideredairfoils, the Selig S1223 high-lift airfoil is found to best promote mass flow rate. Full three-dimensionalsimulations of shrouded wind turbines are performed for selected shroud geometries. The results arecompared to open turbine solutions. Augmentation ratios of up to 1.9 are achieved. Peak augmentationoccurs at the highest wind speed for which the flow over the blade stays attached. Flowfields areexamined in detail and the following aspects are investigated: regions with flow separation, thedevelopment of velocity profiles, and the interaction between the turbine wake and shroud boundarylayer. The sensitivity of the solutions to rotation rate is examined.
© 2014 Elsevier Ltd. All rights reserved.
1. Introduction
The primary obstacle presently confronting the widespreadadoption of wind energy is cost. Improvements in wind turbineefficiency would lower the cost of wind power and thereby advanceits suitability for investments in the energy market. At present, themost established machine for harvesting wind energy is the hori-zontal axis wind turbine (HAWT). As stated by the well-known Betzlimit, the efficiency of conventional HAWTs is bounded above by59.3%. This limit is based on an assumption that the freestreamwind is not disturbed by any external force prior to its interactionwith the turbine. It has long been established, however, thataltering the streamtube incident on the turbine rotor via someexternal mechanism can produce efficiencies in excess of the Betzlimit. A shrouded wind turbine, often referred to as a diffuseraugmented wind turbine (DAWT) in previous literature, makes useof such a mechanism. In a shrouded turbine, the turbine is encasedin a shroud which accelerates the incoming wind, significantlyincreasing the mass and power available to the turbine. Accordingto a generalized version of the classic Betz limit proposed by
ranake).
Jamieson [1], the theoretical limit for power extraction for a windturbine with augmentation can be as high as 88.89% of the energyavailable in the streamtube incident on the rotor. (Note that this isnot a limit of efficiency by the standard definition, as the upstreamarea of the streamtube in question will in general differ from thearea of the rotor.)
In addition to the capability of exceeding the Betz limit, shrou-ded turbines also offer other potential advantages. Every windturbine is limited by its so-called ‘cut-in speed’, a wind speed belowwhich the blades do not turn. High cut-in speeds significantlyhinder the ability of a wind operation to confidently generate po-wer at times of high demand, a problem exacerbated by theinherent intermittency of wind. Recent progress in materialstechnology has enabled the construction of massively large blades,which alleviates the challenges due to cut-in speeds for new largewind farms. However, this solution is not ideal for all situations. Forinstance, in urban or remote settings, a smaller and more portablesolution is desirable. In such cases, by accelerating the wind beforeit reaches the turbine, a shrouded turbine achieves a lower cut-inspeed than a conventional open rotor and can operate produc-tively for a longer portion of its lifetime.
Few researchers in the past have examined the benefits andeconomics of placing a diffuser around a wind turbine. A surveyincluding a comprehensive history of shrouded turbines has been

Nomenclature
_m mass flow rateu turbine angular velocitycd sectional drag coefficientcf skin friction coefficientCP turbine power coefficient, P/½rpR2U∞
3
Cp pressure coefficientCT turbine thrust coefficient, T/½rpR2U∞
2
Mr mass flow amplification factor, _m=rU∞pR2sp local field pressurep∞ freestream pressurera augmentation ratio, CP/0.593Rs shroud radius at turbine planeT turbine thrustuz axial component of velocityVtip turbine tip velocity, uRxtrans chordwise transition location
A.C. Aranake et al. / Renewable Energy 75 (2015) 818e832 819
recently published by van Bussel [2]. The idea of a shrouded turbinewas first proposed by Lilley and Rainbird [3]. Experimental in-vestigations were performed in the 1980s by Gilbert and Foreman[4] and by Igra [5]. Although these experiments did demonstratethat power extraction beyond the classic Betz limit is possible, theshrouded turbine was determined not to be profitable compared totraditional wind turbines and was not pursued extensively.
Recently however, an increase in number of publications on thetopic and attempts to commercialize the idea indicate a renewedinterest in shrouded turbines. Researchers have come to anagreement that there is significant potential for improvements inthis concept and understanding the details of flow physics is one ofkeys to achieving this. An investigation by Hansen [6] demonstratesusing both low-fidelity momentum theory and CFD that the poweraugmentation of a shrouded turbine is proportional to the increasein mass flow rate through the turbine blades. Throughout the pastdecade, the research group of Ohya [7e10] have performedextensive experimental and computational work on this topicwhich has led to the development of a high performance so-called“flanged diffuser”.
Due to the high cost associated with experiments, computa-tional studies are important for an in-depth understanding of theflow physics of shrouded turbines. However, to the authorsknowledge, all the previous work employ modeling simplificationsthat affect the accuracy of flowfield predictions. Early work [5,4]attempted to model the behavior of a shrouded wind turbine asan internal flow problem, in which a turbine was placed inside aduct with an imposed pressure condition at the duct outlet. Morerecently, however, it has been determined [11,1] that this assump-tion is inaccurate, and a more appropriate boundary condition isone which is imposed far downstream of the entire system, i.e., theshrouded turbine must be treated as an external flow problem.
In some of the recent computational studies of shrouded tur-bines [6,7], an actuator disk assumption is used to model the tur-bine blades. In such a model, the rotor is replaced by an infinitelythin disk across which a pressure drop is explicitly imposed. Thissimplification offers a substantial cost saving over a full three-dimensional solution, making it a useful tool during the pre-liminary design stage. It does not, however, capture finer andpotentionally profound aspects of the flow physics near the bladeand in thewake of a shrouded turbine. In addition, the actuator diskmodel cannot predict the effect of the turbine wake on flow sepa-ration along the walls of the shroud. This effect, the “swirl mixing
mechanism” mentioned in previous literature [4], has potentiallysignificant consequences on the performance of a shroudedturbine.
A fully Reynolds-Averaged-NaviereStokes (RANS)-based CFDsimulation can overcome the above mentioned modeling issues.The current work uses a compressible RANS solver to simulateshrouded wind turbines. The solver has been validated previouslyby Baeder [12], Duraisamy [13,14] and Lakshminarayan [15,16] for avariety of flows including single, coaxial, and shrouded rotors,primarily in the context of helicopters. While this legacy admitsconsiderable confidence in the accuracy of the solver for rotatingflows, the simulation of wind turbines presents an additionalcomplication. This is due to free transition from laminar to turbu-lent flow, which occurs on wind turbine blades during typicaloperating conditions and is found to significantly impact bothpressure and viscous forces. Recently, authors of the present workhave performed a detailed validation of 3D simulations of an openwind turbine [17] using the g� Reqt � SA transition model [18],which is demonstrated to accurately predict transitional flows intwo and three dimensions. A preliminary investigation of shroudedturbines has also been performed by present authors [19]. Theprimary objective of the present work is to employ this previouslyvalidated methodology to examine the performance and flowfieldof shrouded wind turbines.
The remainder of this paper is organized as follows. Section 2outlines the methodology employed by the flow solver OVER-TURNS which is used throughout this work. In Section 3, a sum-mary of the validation is presented. In Section 4, results arepresented for a baseline shroud generated from a NACA0006 airfoil.In Section 5, axisymmetric computations are performed to inves-tigate a number of different shroud geometries. Based on thisanalysis, the high-lift S1223 airfoil shape is selected for detailedinvestigation. In Section 6, a shroud generated from a S1223 airfoilsection is examined in detail. The behavior of the shrouded turbinewith varying tip speed ratio is investigated. Section 7 summarizesthe key conclusions and proposes future work.
2. Methodology
In this work, computations are performed using the oversetstructured mesh solver OVERTURNS [15]. This code solves thecompressible RANS equations using a preconditioned dual-timescheme in the diagonalized approximate factorization framework,described by Buelow et al. [20] and Pandya et al. [21]. In thisframework, time is advanced using the implicit approximatefactorization method developed by Pulliam and Chaussee [22]. LowMach preconditioning, based on that developed by Turkel [23], isused to improve both convergence properties and the accuracy ofthe spatial discretization. Inviscid terms are computed using a thirdorder MUSCL scheme using Koren's limiter with Roe's flux differ-ence splitting, and the viscous terms are computed using secondorder central differencing. For RANS closure, the SpalarteAllmaras[24] turbulence model is employed. To capture the effects of flowtransition, the g� REqt � SA [18] model is used. The governingequations are solved in the rotating frame, with no-slip conditionsaccounting for wall velocities applied on the surfaces of both theshroud and turbine blade. An implicit hole-cutting techniquedeveloped by Lee [25] and improved by Lakshminarayan [15] isused to determine the connectivity information between variousoverlapping meshes.
3. Assessment of transition model
In this section, the performance of a newly implemented tran-sition model is carefully evaluated. First, a performance prediction

A.C. Aranake et al. / Renewable Energy 75 (2015) 818e832820
validation is performed on a two-dimensional flow over the S809airfoil. Subsequently, full three-dimensional calculations of theflow past the NREL Phase VI turbine are performed, and the resultsare compared to the experimental measurements including per-formance and surface pressure data.
3.1. S809 airfoil
The S809 airfoil, employed by the NREL Phase VI wind turbine[26], is one of a family of airfoils deliberately designed to contain aso-called “transition-ramp,” a short region of gentle pressure re-covery along the upper surface which induces smooth transitionfrom laminar to turbulent flow [27]. Computations are performedusing structured C-meshes with dimensions 527� 101 in thewrap-around and normal directions respectively. The airfoil andmesh areshown in Fig. 1. To match experimental conditions, simulations arerun at a Reynolds number of 2� 106, and a lowMach number of 0.1is selected to avoid effects due to compressibility.
The predicted lift and drag coefficients for a sweep of angles ofattack are shown in Fig. 2. Results are plotted both with the tran-sition model and without, in which case the flow was assumed tobe fully turbulent. The g� Reqt � SA model significantly improvesthe prediction of both quantities, particularly in the post-stall re-gion. The use of the transition model also improves the predictionof the pressure coefficient significantly as shown in Fig. 3. At a¼ 4�,shown in Fig. 3(a), the prominent dip in pressure on the upper
Fig. 1. Computational mesh (527 � 101
Fig. 2. Lift and drag coefficients vs
surfacewhich indicates transition is well-captured by the transitionmodel. Furthermore, at a ¼ 12�, shown in Fig. 3(b), when the airfoilis partially stalled, the prediction of the entire pressure distributionis substantially improved by the inclusion of the transition model.
The location of the transition point at each angle of attack isplotted against experimental data in Fig. 4. Transition is triggeredby laminar separation bubbles, which span several grid points inthe CFD solutions. Error bars are used to represent the location andwidth of these bubbles. The transition locations are captured wellexcept in the range between a¼ 6� and a¼ 8� on the upper surfaceof the airfoil. The calculations predict that the separation bubble onthe upper surface jumps to the leading edge of the airfoil at a ¼ 9�.In reality, the transition location is highly sensitive to small dis-turbances in the middle range of angle of attack, and even theexperimental data is not single-valued in this region. Nonetheless,the transition model significantly improves the prediction ofquantities from two-dimensional S809 flowfields overall.
3.2. NREL phase VI wind turbine
For three-dimensional validation, the NREL Phase VI serves as avaluable test case, as comprehensive performance and surfacepressure data is available for this configuration from the UnsteadyAerodynamics Experiment (UAE) [26]. This experiment was con-ducted at a large scale wind tunnel (24.4 m � 36.6 m) located atNASA Ames. The tunnel maintains a freestream turbulence
) for the S809 wind turbine airfoil.
angle of attack for S809 airfoil.

Fig. 3. Pressure coefficient distribution for S809 airfoil.
A.C. Aranake et al. / Renewable Energy 75 (2015) 818e832 821
intensity of below 0.5%. The turbine is a 2-bladed configurationwith a radius of R ¼ 5.029 m. The tip Mach number is Mtip ¼ 0.1135and the rotational velocity is u ¼ 72 rpm. As previously mentioned,the S809 airfoil is used for the blade cross sections. Measurementsof performance and surface pressure are taken for wind speedsranging from U∞ ¼ 3 m/s to 25 m/s.
In this work, the turbine blade is represented by a CeO meshwith dimensions 257 � 51 � 51 in the wrap-around, spanwise, andnormal directions respectively. A view of the mesh near the bladetip is presented in Fig. 5(a). This mesh is embedded in a backgroundmesh with dimensions 201 � 133 � 164 in the azimuthal, radial,and axial directions respectively. The background mesh is semi-cylindrical, and periodic boundary conditions are applied onlateral faces to simulate a full two-bladed rotor. The fluid domainextends 2R upstream and 6.8R downstream and 3.4R laterally. Theazimuthal grid spacing stretches to give fine resolution in a 15�
patch in the vicinity of the turbine blade. Characteristic boundaryconditions are used for the inflow, outflow, and farfield faces. Awallboundary condition imposes no-slip on the blade in the rotatingframe. The singularity at the axis is avoided by beginning the radialpoint distribution at a small value of r ¼ 0.03. An extrapolationboundary condition is applied at this location. The backgroundmesh and boundary conditions are depicted in Fig. 5(b). To evaluate
Fig. 4. Transition locations for S809 airfoil. The square symbols in this plot areexperimental data points. Error bars show the size of the separation bubble in the CFDsolution.
grid convergence, a finer mesh with dimensions 257 � 201 � 101for the blade and 180 � 264 � 228 for the background mesh (withuniform azimuthal spacing) were run for one wind speed, and theintegrated loads and pressure coefficients were all found to differby less than 3%. Since the mesh size is already very high, we did notperform more extensive refinement studies. However, all of thesemeshes were generated using prior experience in dealing with anumber of highly similar problems with the same code over thepast 15 years [12e16].
Fig. 6(a) plots the computed torque of the open turbine atvarious wind speeds. These computations were performed by firstattempting a steady-state solution, which in general did notconverge, and then using the obtained result to restart a time-accurate solution. Error bars show the min and max valuesattained. For comparison, computational results from Potsdamet al. [28] are also included. At low speeds where the flow remainsattached, computational results agree quite well with measureddata. At these speeds, transition plays a small role in the behavior ofthe flow, and the transition model has little effect on the integratedresults. A visualization of the wake from one such result is shown inFig. 6(b), which plots isocontours of q-criterion [29]. The helicalwake vortex persists for several turns with minimal numericaldiffusion. As the freestream velocity increases, transition plays amore significant role in the flow. Pressure distributions at twospanwise stations are shown in Fig. 6(c) and (d) for a wind speed ofU∞ ¼ 10 m/s. The transition model is seen to capture the pressuredistribution more accurately than the fully turbulent assumption atthese locations. At speeds beyond U∞ ¼ 10 m/s, the flow is deeplystalled over much of the turbine blade, leading to an inherentlyunsteady flow for which RANS based calculations are insufficient.Indeed, under such conditions, interaction between the blades andtower plays a significant role in the blade loading, and the towersurface must be included in calculations to produce reasonableresults [30].
4. Baseline (NACA0006) shroud
An initial assessment of the shrouded turbine concept is per-formed by enclosing the NREL VI blade in a simple shroud. Thisshroud, referred to as “baseline,” is generated by extruding aNACA0006 airfoil section at an angle of attack into an annular wing.The blade grid and background grid are the same as those used forvalidation. The dimensions for the shroud grid are 267 � 201 � 49in the wrap-around, spanwise, and normal directions respectively.Fig. 7(a) shows sections of the blade and shroud grids, and Fig. 7(b)
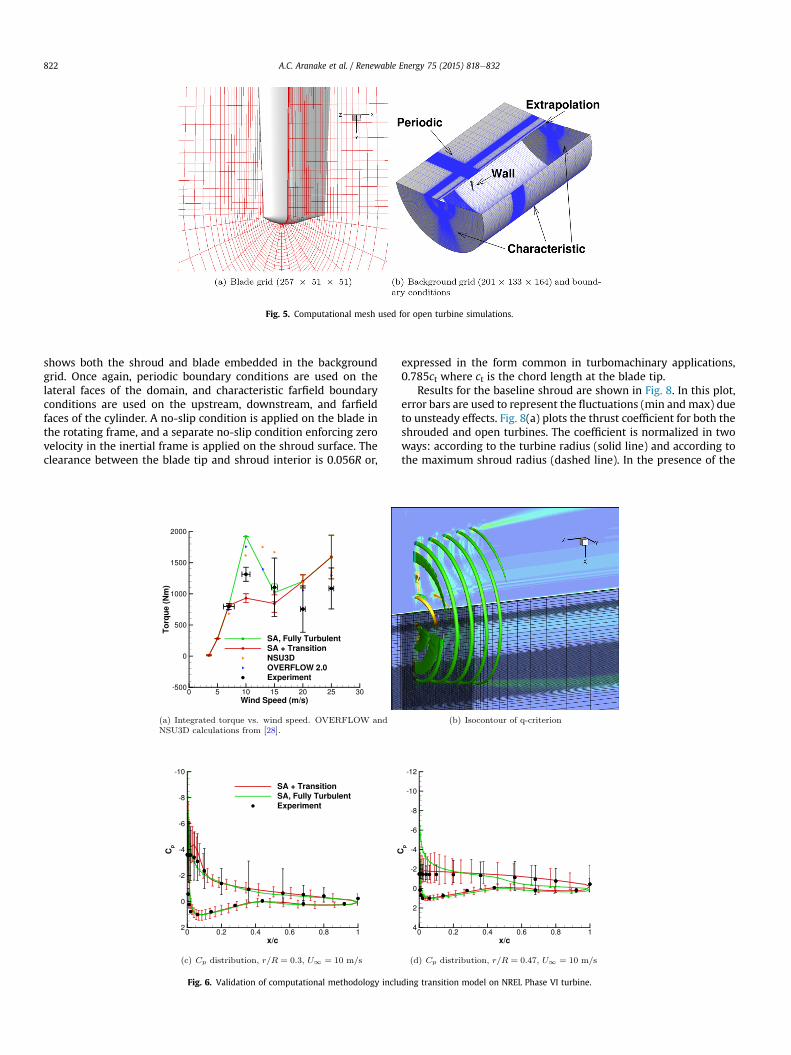
Fig. 5. Computational mesh used for open turbine simulations.
A.C. Aranake et al. / Renewable Energy 75 (2015) 818e832822
shows both the shroud and blade embedded in the backgroundgrid. Once again, periodic boundary conditions are used on thelateral faces of the domain, and characteristic farfield boundaryconditions are used on the upstream, downstream, and farfieldfaces of the cylinder. A no-slip condition is applied on the blade inthe rotating frame, and a separate no-slip condition enforcing zerovelocity in the inertial frame is applied on the shroud surface. Theclearance between the blade tip and shroud interior is 0.056R or,
Fig. 6. Validation of computational methodology inclu
expressed in the form common in turbomachinary applications,0.785ct where ct is the chord length at the blade tip.
Results for the baseline shroud are shown in Fig. 8. In this plot,error bars are used to represent the fluctuations (min andmax) dueto unsteady effects. Fig. 8(a) plots the thrust coefficient for both theshrouded and open turbines. The coefficient is normalized in twoways: according to the turbine radius (solid line) and according tothe maximum shroud radius (dashed line). In the presence of the
ding transition model on NREL Phase VI turbine.

Fig. 7. Overset grids used for 3D shrouded turbine computation.
A.C. Aranake et al. / Renewable Energy 75 (2015) 818e832 823
shroud, the loads on the turbine are higher at all wind speeds. Thisis to be expected due to the acceleration induced by the shroud andshould be considered when selecting materials for shrouded tur-bine blades. In place of power coefficient, a commonly used [4,5]measure of DAWT performance is the augmentation ratio, given by
ra ¼ Cp0:593
(1)
which is simply a ratio of the standard power coefficient to the Betzlimit. The baseline shroud is seen to augment power significantly,with a maximum augmentation ratio of ra ¼ 1.09 at U∞ ¼ 5 m/s. Inthis case, power extraction beyond the Betz limit is achieved evenwith a very simple shroud geometry.
5. 2D analysis of shroud airfoil sections
In the present work, only shrouds which are symmetric about anaxis of rotation are considered. This permits the expedient assess-ment of shrouds generated by several different airfoil sections bysolving the axisymmetric RANS equations. Following the work ofprevious authors [1,11], the effectiveness of a shroud is considereddecoupled from the properties of a turbine, and the turbine is notmodeled in this section. This conclusion is based on the assump-tions of inviscid momentum theory, which will reach their usefullimits when considering the interaction between a three-
Fig. 8. Turbine thrust and augmentation ratio with NACA0006 shroud (u fixed
dimensional blade and shroud. Nonetheless, an axisymmetricinvestigation provides considerable insight into the properties of ashroud airfoil.
One measure of the effectiveness of an airfoil as a shroud profileis the amount of mass flow it induces through the interior of theshroud. For an axisymmetric shroud, an increased circulationwould correspond to a large mass flow rate. The mass flow rate isgiven by
_m ¼Z2p0
ZRs
0
ruzrdrdq (2)
where uz is the axial component of velocity. A non-dimensionalmass flow amplification factor is defined as
Mr ¼_m
rU∞pR2s: (3)
where the shroud radius Rs is measured at the plane of the turbine.In the present work, for both 2D and 3D simulations the turbinewas placed at z/c ¼ 10%, where z is the axial coordinate from theleading edge and c is the shroud chord length.
The KuttaeJoukowksi theorem states that the lift per span isproportional to the circulation induced in the surrounding flow. Ahigh circulation corresponds directly to a high mass flow
). Dashed lines are normalized with respect to maximum shroud radius.

Fig. 9. High-lift sections shapes and performance, black lines are NACA0006.
A.C. Aranake et al. / Renewable Energy 75 (2015) 818e832824
amplification. Considering this, several high-lift airfoils areconsidered. A sample of shapes considered are each shown along-side a NACA0006 profile in Fig. 9(a). The Eppler E423 [31] is anairfoil designed to maximize lift through the use of a concavepressure recovery with no specific regard to the effect on momentcoefficient. The modified NACA0006 was generated by rotating themean camber line downward by 45� for the last 20% of the chordlength while maintaining the original thickness distribution. Thisshape is intended to resemble an airfoil with a deflected controlsurface, and it also approximates the flanged diffuser shape of Abeand Ohya [7,10]. The Selig S1223 is designed with the same high-liftdesign philosophy as the Eppler E423 [31], and is intended tobelong to the FX CL/MS-class of airfoils. The FX 74-CL4-140 is ahigh-lift airfoil designed for a Reynolds number of Re ¼ 106.
Two-dimensional overset grids are once again used for thesecomputations, with 180 � 218 points in the background mesh and267 � 61 points in the near-body mesh. A sample grid of an S1223section at 10� angle of attack is shown in Fig. 10. The Reynolds
Fig. 10. Overset grid system used for vi
number based on shroud length is Re ¼ 3.2 � 106, corresponding toa freestream velocity of 10 m/s and shroud length of 5.029 m. Theaxisymmetric RANS equations are solved along with the Spa-larteAllmaras turbulencemodel. The backgroundmesh is extendedto 25 chord lengths upstream, 25 chord lengths laterally, and 50chord lengths downstream. A small value of r ¼ 0.001 m is used atthe boundary near the symmetry axis, where an extrapolationboundary condition is applied.
The computed performance of these airfoils in terms of radialforce and mass flow is shown in Fig. 9(b) and (c). As suggested bythe KuttaeJakouwski theorem, the mass flow amplification in-creases nearly linearly with radial force coefficient. The angle ofattack for this study is varied from a ¼ 0� to a ¼ 15�, which issufficient to observe the stall of each airfoil considered.
Two lines of the same slope are seen on the curves in Fig. 9(b).The determining factor for which line a particular data point lies onis the location of the stagnation point. For instance, the lift coeffi-cient for the NACA0006 section at a�¼�6� is nearly equal to that of
scous axisymmetric computations.
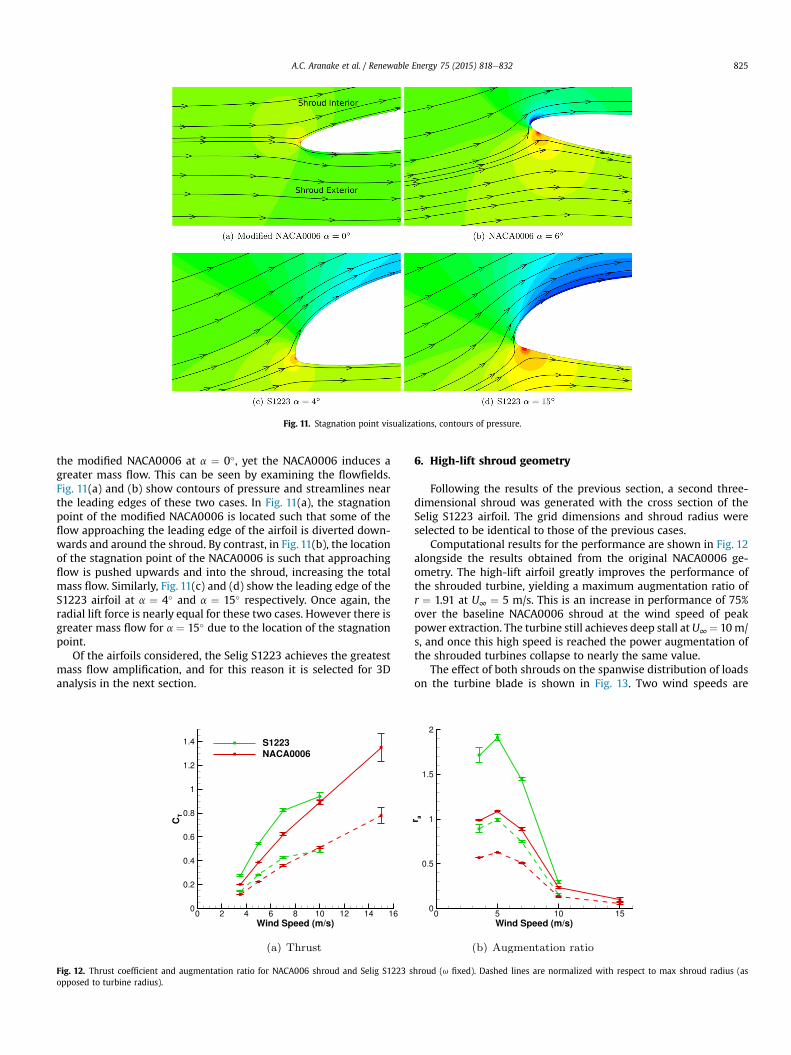
Fig. 11. Stagnation point visualizations, contours of pressure.
A.C. Aranake et al. / Renewable Energy 75 (2015) 818e832 825
the modified NACA0006 at a ¼ 0�, yet the NACA0006 induces agreater mass flow. This can be seen by examining the flowfields.Fig. 11(a) and (b) show contours of pressure and streamlines nearthe leading edges of these two cases. In Fig. 11(a), the stagnationpoint of the modified NACA0006 is located such that some of theflow approaching the leading edge of the airfoil is diverted down-wards and around the shroud. By contrast, in Fig. 11(b), the locationof the stagnation point of the NACA0006 is such that approachingflow is pushed upwards and into the shroud, increasing the totalmass flow. Similarly, Fig. 11(c) and (d) show the leading edge of theS1223 airfoil at a ¼ 4� and a ¼ 15� respectively. Once again, theradial lift force is nearly equal for these two cases. However there isgreater mass flow for a ¼ 15� due to the location of the stagnationpoint.
Of the airfoils considered, the Selig S1223 achieves the greatestmass flow amplification, and for this reason it is selected for 3Danalysis in the next section.
Fig. 12. Thrust coefficient and augmentation ratio for NACA006 shroud and Selig S1223 sopposed to turbine radius).
6. High-lift shroud geometry
Following the results of the previous section, a second three-dimensional shroud was generated with the cross section of theSelig S1223 airfoil. The grid dimensions and shroud radius wereselected to be identical to those of the previous cases.
Computational results for the performance are shown in Fig. 12alongside the results obtained from the original NACA0006 ge-ometry. The high-lift airfoil greatly improves the performance ofthe shrouded turbine, yielding a maximum augmentation ratio ofr ¼ 1.91 at U∞ ¼ 5 m/s. This is an increase in performance of 75%over the baseline NACA0006 shroud at the wind speed of peakpower extraction. The turbine still achieves deep stall at U∞¼ 10m/s, and once this high speed is reached the power augmentation ofthe shrouded turbines collapse to nearly the same value.
The effect of both shrouds on the spanwise distribution of loadson the turbine blade is shown in Fig. 13. Two wind speeds are
hroud (u fixed). Dashed lines are normalized with respect to max shroud radius (as

Fig. 13. Spanwise thrust and torque distribution on open and shrouded blade.
A.C. Aranake et al. / Renewable Energy 75 (2015) 818e832826
shown, U∞ ¼ 5 m/s, where peak augmentation is obtained, andU∞ ¼ 7 m/s, which marks the onset of separation for the shroudedcases. At U∞ ¼ 5 m/s, where the turbine is more efficient in aug-menting the power output, the increase in loading is smooth,peaking near r/R ¼ 0.9. At U∞ ¼ 7 m/s, the force coefficients whichare smooth for the open rotor begin to deteriorate from theoutboard portion of the blade. This is in part due to the fact that theresult is unsteady.
To further investigate the irregularities seen in the outboardportion of the blade, Fig. 14 shows contours of pressure andstreamlines for a blade cross section taken at r/R¼ 0.7 for U∞¼ 7m/s. While the flow over the open turbine shown in Fig. 14(a) remainsfully attached, the flow over the shrouded turbine blade shown inFig. 14(b) exhibits flow separation. This explains the irregularitiesseen in Fig. 13. It can also be seen in these plots that the local angleof attack is higher in the presence of the shrouded, indicating thatthe velocity normal to the blade surface, i.e. the wind speed, hasincreased.
6.1. Flowfield
In order to better understand the aerodynamics of a shroudedturbine, it is valuable to analyze the flowfield in some detail. First,
Fig. 14. Contours of p/p∞ at radial l
the case with U∞ ¼ 5 m/s is considered, as it corresponds to thewind speed of greatest power output.
Velocity profiles, from 2 rotor radii upstream to 1 radii down-stream, are examined in Fig. 15 for the open and shrouded rotor.These profiles have been averaged in the azimuthal direction. Up-stream of the turbine, at z/R¼ 2, the velocity profiles are constant atthe freestream value of 5 m/s. At z/R ¼ 0.5, a deficit is seen in thewake of the open turbine corresponding to an expansion ofincoming streamlines. At this same axial station, a peak is seen inthe vicinity of the shroud (near r/R ¼ 1), and the flow accelerationdue to the shroud prevents an upstreamwake deficit. The incomingvelocity is greater than the freestream velocity across the entirespan of the turbine. At the plane of the turbine, at z/R ¼ 0.0, thewake of the open rotor has decelerated halfway to the downstreamwake, agreeing with the result from actuator disk theory. Theshroud, on the other hand, accelerates the freestream windconsiderably. Downstream of the turbine but ahead of the shroudtrailing edge at z/R ¼ �0.5, the wake of the open turbine hasreduced to its downstream value, whereas the shroud contains anddelays wake expansion. Farther downstream, the wake deficits aremuch larger for the shrouded turbine due to both an increase inturbine thrust and momentum extraction by the shroud itself. Theshrouded turbine wake also expands farther laterally in thisdownstream region, indicating a greater diffusion of momentum,
ocation r/R ¼ 0.7, U∞ ¼ 7 m/s.

Fig. 15. Azimuthally averaged velocity distribution, U∞ ¼ 5 m/s.
A.C. Aranake et al. / Renewable Energy 75 (2015) 818e832 827
which would reduce the wake effect felt by a downstream turbinein a wind farm. The NREL Phase VI blade under consideration in thepresent work is designed to operate in a nearly uniform velocitydistribution like that seen in Fig. 15(a). The large deviation from aflat profile seen in Fig. 15(b) indicates that a redesign of the blade isneeded for shrouded turbines. Such a redesign is deferred to futurework.
Fig. 16. Surface pressure and skin
Contours of the normalized pressure and skin friction along theturbine blades are shown in Fig. 16 for both the open and shroudedcases. The differences between the cases are most pronounced onthe leeward surface. In the plots on the left, lower pressures areseen towards the outer region of the blade in the shrouded case,where the effect of the shroud suction peak is felt most strongly.Streamlines indicating the flow direction immediately adjacent to
friction contours, U∞ ¼ 5 m/s.

Fig. 17. Contours of vorticity magnitude for S1223 shroud.
A.C. Aranake et al. / Renewable Energy 75 (2015) 818e832828
the surface are superimposed on these plots. Laminar separationbubbles, predicted by the transition model, are seen as blue stripesacross the blades. At these locations, the skin friction is negativeand locally the flow direction is reversed. Substantial cross flow andsome leading edge separation are present in the shrouded case.
Interesting features are seen in the interaction between theturbine wake and the shroud. Fig. 17(a) shows contours of vorticitymagnitude taken at an azimuthal cross section in the vicinity of theblade for U∞ ¼ 5 m/s. Downstream of the turbine, the passing he-lical turbine wake appears in close proximity to the shroud,revealing the expansion of the helix within the shroud. Thevorticity shed from the shroud boundary layer oscillates with thepassing wake. The fluid in the boundary layer decelerates towardpressure recovery but is intermittently reenergized by the passingturbine vortex. This phenomenon promotes attached flow, and is
Fig. 18. Pressure coefficient along shroud. Mean value shown alongsid
quite beneficial in preventing stall on the shroud inner surface.Fig. 17(b) shows a similar plot for U∞ ¼ 7 m/s. In this case, there issubstantial flow separation along the turbine blade, and a large andirregular wake is shed into the shroud.
The pressure coefficient along the shroud is plotted in Fig. 18 forwind speeds of U∞ ¼ 5 m/s and U∞ ¼ 7 m/s. Pressure coefficientdistributions at various azimuthal locations are displayed alongsidethe azimuthally averaged distribution. The solution of a 2Daxisymmetric simulation is shown as well for comparison. Asdepicted in Fig. 18(c), the location where the azimuth q ¼ 0� cor-responds to the location of the turbine blade. In both cases, a largepeak in suction is seen at this location, as the suction peak of theshroud interacts with the tip vortex shed by the turbine. The effectof the passing helical wake is readily visible as oscillations in theseplots.
e several stations. Axisymmetric solution shown for comparison.
A.C. Aranake et al. / Renewable Energy 75 (2015) 818e832 829
6.2. Varying tip speed ratio at a fixed wind speed
In practice, it is typically desirable to select a rotor rotation rateu to match the rate at which the gearbox and power generatorperform optimally. Nonetheless, rotation rate plays a crucial role inthe aerodynamics of a wind turbine system. In Fig. 8(b), the powerproduced by the shrouded turbine while maintaining a fixed u
decreases with increasing wind speed beginning at U∞ ¼ 7 m/s. Atand beyond this speed, there is flow separation on the blade surfaceowing to the higher angle of attack experienced by each bladesection. The geometric angle of attack is given by
aðrÞ ¼ fðrÞ þ tan�1�1l
Rr
�(4)
where F(r) is the twist of the blade. Inspection of this relationconfirms that the local angle of attack can be reduced all along theblade by increasing l. In other words, it is possible to reduce theextent of separation on a blade and reduce it altogether byincreasing the rotation rate.
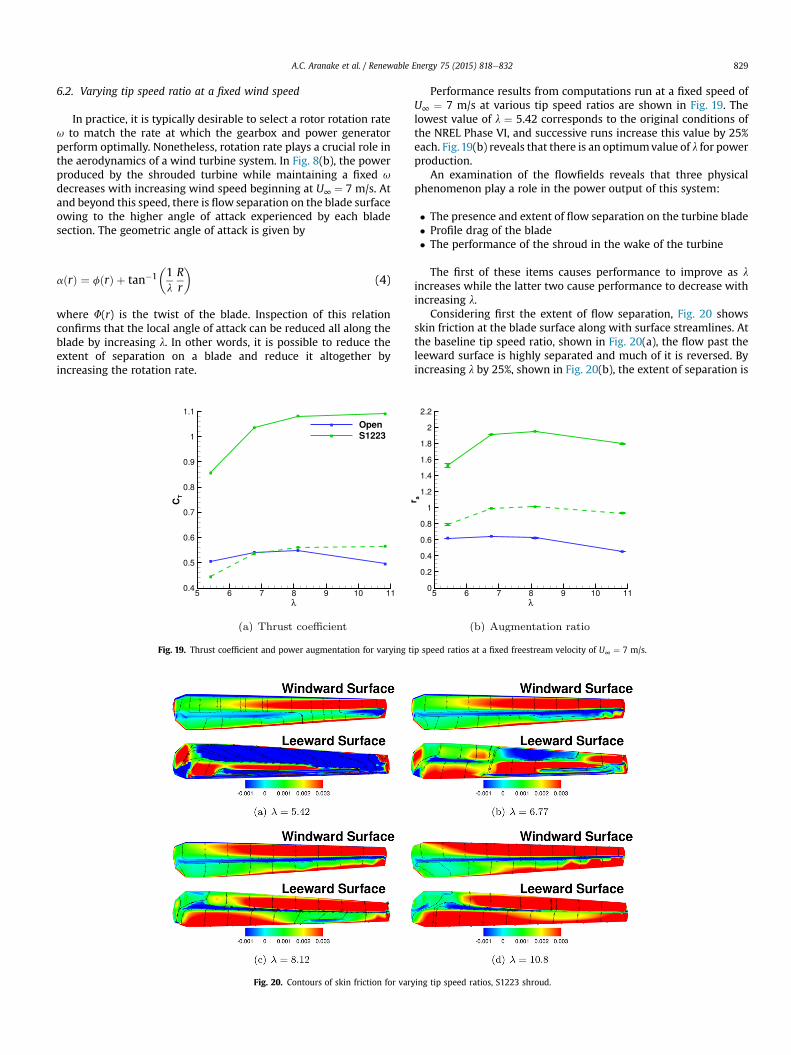
Fig. 19. Thrust coefficient and power augmentation for varying t
Fig. 20. Contours of skin friction for vary
Performance results from computations run at a fixed speed ofU∞ ¼ 7 m/s at various tip speed ratios are shown in Fig. 19. Thelowest value of l ¼ 5.42 corresponds to the original conditions ofthe NREL Phase VI, and successive runs increase this value by 25%each. Fig.19(b) reveals that there is an optimumvalue of l for powerproduction.
An examination of the flowfields reveals that three physicalphenomenon play a role in the power output of this system:
� The presence and extent of flow separation on the turbine blade� Profile drag of the blade� The performance of the shroud in the wake of the turbine
The first of these items causes performance to improve as l
increases while the latter two cause performance to decrease withincreasing l.
Considering first the extent of flow separation, Fig. 20 showsskin friction at the blade surface along with surface streamlines. Atthe baseline tip speed ratio, shown in Fig. 20(a), the flow past theleeward surface is highly separated and much of it is reversed. Byincreasing l by 25%, shown in Fig. 20(b), the extent of separation is
ip speed ratios at a fixed freestream velocity of U∞ ¼ 7 m/s.
ing tip speed ratios, S1223 shroud.

Fig. 21. Contours of vorticity magnitude for varying tip speed ratios, S1223 shroud.
Fig. 22. Pressure coefficient along shroud. Mean value shown alongside several stations. Axisymmetric solution shown for comparison.
A.C. Aranake et al. / Renewable Energy 75 (2015) 818e832830

A.C. Aranake et al. / Renewable Energy 75 (2015) 818e832 831
greatly reduced although there are still large separation regions onthe leeward surface near the leading and trailing edges. Byincreasing l further, in Fig. 20(c) and (d), separation is eliminatedexcept for the thin laminar separation bubbles cutting across thespan of the blades.
Next, the profile drag on a shrouded turbine increases withincreasing tip speed ratio. Neglecting three-dimensional effects, thedrag on a section of a turbine blade is given by
d ¼ Cd12r
�ðurÞ2 þ U2
∞
�¼ Cd
12rU2
∞
"�lrR
�2þ 1
#: (5)
Thus, profile drag is proportional to l2 and can be expected togrow significantly as l increases.
Finally, themass flow amplification of the shroud is also affectedby an increase in l. As the tip speed ratio of a wind turbine in-creases, the distances between successive passes of the tip vortex inthe wake decrease. For a shrouded turbine, this means that moreturns of the wake are present in the shroud interior. This can beseen in Fig. 21, which plots the magnitude of vorticity near theshroud surface in the vicinity of the turbine blade. Increasing the tipspeed ratio draws wake vortices closer to the leading edge of theshroud airfoil and increases the number of times the wake interactswith the shroud boundary layer.
The impact of the increased interaction between the turbinewake and the shroud is examined in Fig. 22, which shows thepressure distribution along the shroud for each tip speed ratioconsidered. (The location of the azimuthal stations in these plots isshown in Fig. 18(c)). The area inside the curve representing themean Cp distribution measures the lift force on the shroud and is anindicator of shroud performance. This area decreases withincreasing l, indicating that the impact of the wake is to reduce theperformance of the shroud as a flow accelerator. Indeed, exami-nation of velocity profiles (not shown) for these cases reveals thatthe amount of acceleration achieved by the shroud at the turbineplane decreases with increasing l.
At the highest tip speed ratio considered, in Fig. 22(c), anespecially intense suction peak appears in the vicinity of the blade(q ¼ 0�). However, the mean suction is lower for this case than anyother. This signifies the presence of strong pressure gradients in theazimuthal direction in this case, and the impact of this high suctionpeak is to set the flow swirling rather than draw flow axiallythrough the shroud.
Of the three phenomena discussed above, the extent of flowseparation outweighs the other two in importance up to the pointwhere the flow is fully attached on the blade. Beyond this point,increasing l further only increases the profile drag and reduces theshroud efficiency.
7. Conclusions and future work
The performance and flowfield of a shrouded wind turbine hasbeen computed and analyzed in detail. High-lift airfoil shapes areconsidered for shroud geometry. Validation has been performed forthe RANS based model used for computations, and the use of atransition model is found to improve the accuracy of results.
An investigation of airfoil sections for shrouds of shroudedwindturbines has been performed. Of a number of airfoil shapesconsidered for shroud cross sectional profiles, the Selig S1223 at-tains the greatest amplification of mass flow. Three-dimensionalanalysis of full shrouded turbine systems verify the benefit ofincreased mass flow through the plane of the turbine. Powerextraction up to 90% beyond the Betz limit is achieved. Theimprovement in power extraction beyond the bare turbine is sub-stantial; the NACA0006 shroud improves power over the bare
turbine by a factor of 1.93 and the S1223 improves it by a factor of3.39 at U∞ ¼ 5 m/s. These results further support the utility of theshrouded wind turbine as a device that can be used effectively atlow cut-in speeds and offer promise to substantially improve theenergy capture when compared to conventional wind turbines.
Based on the preceding analysis, the following conclusions aredrawn regarding the design of a shrouded turbine:
� In the absence of a turbine, mass flow amplification through ashroud increases approximately linearly with radial force, andnonlinear behavior occurs as the stagnation point moves fromthe interior to the exterior side of the shroud.
� The wake of a shrouded turbine expands more rapidly than anopen turbine and can be tailored to promote maximum powerextraction.
� Transition has an important effect on the behavior of a shroudedwind turbine and should be accounted for in analysis wheneverfeasible.
� The shrouded turbine system's performance is maximum at aparticular tip speed ratio. Increasing the tip speed ratio beyondthis optimal value leads to losses due to separation.
The above considerations provide insight for both the analysisand design of both the shroud and the turbine of a shrouded tur-bine. Future work will employ an optimization strategy to design ashrouded turbine with a continued detailed focus on fluid physics.This procedure will include a redesign of the twist, chord, andthickness distribution of the blade. Additionally, the results pre-sented here shall be compared to lower-order theories, such as thecommonly-used actuator disk model. It will also be interesting toconsider the effect of extreme loads on such a system, such as ahigh-speed gust at a high angle of attack.
Acknowledgment
This work is supported by the DoD NDSEG fellowship and by theDoE ASCR program on Fluid/Structure interactions inWind TurbineApplications at Stanford University.
References
[1] Jamieson P. Beating Betz: energy extraction limits in a constrained flow field.J Sol Energy Eng 2009;131.
[2] van Bussel G. The science of making more torque from wind: diffuser ex-periments and theory revisited. J Phys Conf Ser 2007;75.
[3] Lilley GM, Rainbird WJ. A preliminary report on the design and performanceof a ducted windmill. Report 102. College of Aeronautics; 1956.
[4] Gilbert BL, Foreman KM. Experiments with a diffuser-augmented model windturbine. J Energy Resour Technol 1983;105.
[5] Igra O. Research and development for shrouded wind turbines. Energy Con-serv Manag 1981;21:13e48.
[6] Hansen MOL, Sørensen NN, Flay RGJ. Effect of placing a diffuser around a windturbine. Wind Energy 2000;3.
[7] Abe K, Ohya Y. An investigation of flow fields around flanged diffusers usingCFD. J Wind Eng Ind Aerodyn 2004;92.
[8] Abe K, Nishida M, Sakurai A, Ohya Y, Kihara H, Wada E, et al. Experimental andnumerical investigations of flow fields behind a small wind turbine with aflanged diffuser. J Wind Eng Ind Aerodyn 2005;93(12):951e70.
[9] Ohya Y, Karasudani T, Sakurai A, Abe K-i, Inoue M. Development of a shroudedwind turbine with a flanged diffuser. J Wind Eng Ind Aerodyn 2008;96(5):524e39.
[10] Ohya Y, Karasudani T. A shrouded wind turbine generating high output powerwith wind-lens technology. Energies 2010;131.
[11] Werle MJ, Presz Jr WM. Ducted wind/water turbines and propellers revisited.J Propuls Power 2008;24(5).
[12] Baeder J, Duraisamy K, Lakshminarayan V. RANS predictions of complexhovering rotor configurations: from micro scale to full scale. Comput FluidDyn J 2011;18(3e4).
[13] Duraisamy K, Ramasamy M, Baeder J, Leishman G. High resolution wakecapturing methodology for hovering rotor simulations. J Am Helicopter Soc2007;52(2).

A.C. Aranake et al. / Renewable Energy 75 (2015) 818e832832
[14] Duraisamy K, Ramasamy M, Baeder J, Leishman G. High resolution compu-tational and experimental study of hovering rotor tip vortex formation. AIAA J2007;45(11).
[15] Lakshminarayan VK. Computational investigation of micro-scale coaxial rotoraerodynamics in hover. Department of Aerospace Engineering; 2009 [Ph.D.Dissertation].
[16] Lakshminarayan VK, Baeder JD. Computational investigation of microscaleshrouded rotor aerodynamics in hover. J Am Helicopter Soc 2011;56:042002.
[17] Aranake A, Lakshminarayan V, Duraisamy K. Assessment of transition modeland CFD methodology for wind turbine flows. In: 42nd AIAA Fluid DynamicsConference and Exhibit, New Orleans, LA; June 2012.
[18] Medida S, Baeder J. Numerical prediction of static and dynamic stall phe-nomena using the g� Reqt transition model. In: American Helicopter Society67th Annual Forum, Virginia Beach, VA; May 2011.
[19] Aranake A, Lakshminarayan V, Duraisamy K. Computational analysis ofshrouded wind turbine configurations. In: 51st AIAA Aerospace SciencesMeeting, Dallas, TX; January 2013.
[20] Buelow PEO, Schwer DA, Feng J, Merkle CL. A preconditioned dual-time,diagonalized ADI scheme for unsteady computations. In: 13th AIAA Compu-tational Fluid Dynamics Conference, Snowmass Village, CO; June 1997.
[21] Pandya SA, Venkateswaran S, Pulliam TH. Implementation of preconditioneddual-time procedures in overflow. In: 41st AIAA Aerospace Sciences Meetingand Exhibit, Reno, NV; January 2003.
[22] Pulliam T, Chaussee D. A diagonal form of an implicit approximate factor-ization algorithm. J Comput Phys 1981;39(2):347e63.
[23] Turkel E. Preconditioning techniques in computational fluid dynamics. AnnuRev Fluid Mech 1999;31:385e416.
[24] Spalart PR, Allmaras SR. A one-equation turbulence model for aerodynamicflows. In: 30th AIAA Aerospace Sciences Meeting and Exhibit, Reno, NV;January 1992.
[25] Lee Y. On overset grids connectivity and vortex tracking in rotorcraft CFD.Department of Aerospace Engineering; 2008 [Ph.D. Dissertation].
[26] Simms D, Schreck S, Hand M, Fingersh LJ. NREL unsteady aerodynamicsexperiment in the NASA-Ames wind tunnel: a comparison of predictions tomeasurements. 2001. NREL/TP-500-29494.
[27] Somers DM. Design and experimental results for the S809 airfoil. 1997. NREL/SR-440-6918.
[28] Potsdam MA, Mavriplis DJ. Unstructured mesh CFD aerodynamic analysis ofthe NREL phase VI rotor. In: 47th AIAA Aerospace Sciences Meeting; 2009.
[29] Jeong J, Hussain F. On the identification of a vortex. J Fluid Mech1995;285(69):69e94.
[30] Zahle F, Sørensen NN, Johansen J. Wind turbine rotor-tower interaction usingan incompressible overset grid method. Wind Energy 2009;12(6):594e619.
[31] Selig MS, Guglielmo JJ. High-lift low Reynolds number airfoil design. J Aircr1997;34(1).