computational analysis and manipulation of the metabolic
TRANSCRIPT
Computational analysis and manipulation of the metabolic network of drug
producing microorganisms
INAUGURALDISSERTATION
zur Erlangung des Doktorgrades
der Fakultät für Chemie und Pharmazie
der Albert-Ludwigs-Universität Freiburg im Breisgau
Vorgelegt von
Dennis Klementz
aus Wiesbaden-Dotzheim
Freiburg 2017

Dekan: Prof. Dr. Manfred Jung
Vorsitzender des Promotionsausschusses: Prof. Dr. Stefan Weber
Referent: Prof. Dr. Stefan Günther
Korreferent: Prof. Dr. Andreas Bechthold
Drittprüfer: Prof. Dr. Oliver Einsle
Datum der Promotion: 26.02.2018

“What we observe is not nature itself, but nature exposed to our method of questioning.”
Werner Heisenberg
Index
Index
1 Abstract ......................................................................................................................... 1
2 Introduction ................................................................................................................... 3
2.1 Streptomycetes, an important source of natural drugs .................................................... 3
2.2 Nucleocidin production in Streptomyces calvus ............................................................... 6
2.3 Griseorhodin A, a telomerase inhibitor from a marine Streptomyces strain .................... 9
2.4 Genome-scale metabolic modeling and Flux Balance Analysis ....................................... 11
2.5 ‘Omics’ data and genome-scale metabolic models ......................................................... 14
2.6 Enhanced secondary metabolite production and genome-scale metabolic models ...... 16
3 Materials ....................................................................................................................... 19
3.1 Chemicals ......................................................................................................................... 19
3.2 Equipment ....................................................................................................................... 21
3.3 Consumables .................................................................................................................... 23
3.4 Strains .............................................................................................................................. 24
3.5 Programs & Services ........................................................................................................ 25
3.6 Cultivation media ............................................................................................................. 26
3.6.1 TSB (Tryptone Soy Broth) ......................................................................................... 26
3.6.2 MS (Mannitol Soy) .................................................................................................... 26
3.6.3 SG+ (Soytone Glucose) .............................................................................................. 26
3.6.4 Minor Element Solution ........................................................................................... 27
3.6.5 Buffer ........................................................................................................................ 27
3.6.6 Minimal medium ...................................................................................................... 27
Index
4 Methods ....................................................................................................................... 28
4.1 StreptomeDB ................................................................................................................... 28
4.1.1 Data collection .......................................................................................................... 28
4.1.2 Genomes, taxonomy and gene clusters ................................................................... 28
4.1.3 Generation of the phylogenetic tree ....................................................................... 28
4.2 AdpA in Streptomyces asterosporus ............................................................................... 30
4.2.1 Detection of transposons ......................................................................................... 30
4.2.2 Detection of adpA binding sites ............................................................................... 30
4.2.3 Prediction of adpA regulon ...................................................................................... 30
4.2.4 Potential disrupted genes ........................................................................................ 30
4.2.5 G+C content and skew.............................................................................................. 31
4.2.6 Dotplot ...................................................................................................................... 31
4.3 Genome-scale metabolic modeling ................................................................................. 32
4.3.1 Model reconstruction ............................................................................................... 32
4.3.2 Analysis of essential elements ................................................................................. 32
4.3.3 Correlation plot and area under the curve (AUC) .................................................... 32
4.3.4 Knockout candidate identification ........................................................................... 33
4.3.5 Integration of transcriptomic data ........................................................................... 34
4.3.6 Generation of functional subsets ............................................................................. 35
4.3.7 Minimal medium prediction and validation ............................................................. 35
4.4 Strain cultivation .............................................................................................................. 36
4.4.1 Preculture ................................................................................................................. 36
4.4.2 Permanent culture ................................................................................................... 36
4.4.3 Agar cultures ............................................................................................................ 36

Index
4.4.4 Liquid culture in Erlenmeyer flasks .......................................................................... 36
4.4.5 Dry weight measurement ......................................................................................... 36
4.4.6 Sample preparation for HPLC-MS ............................................................................ 37
4.4.7 HPLC measurement .................................................................................................. 37
5 Results .......................................................................................................................... 38
5.1 StreptomeDB update ....................................................................................................... 38
5.2 Data Overview ................................................................................................................. 38
5.3 Phylogenetic tree ............................................................................................................. 43
5.3.1 NMR and MS prediction ........................................................................................... 45
5.3.2 Scaffold browser ....................................................................................................... 47
5.4 bldA function in Streptomyces calvus ............................................................................. 49
5.4.1 Metabolic model ...................................................................................................... 49
5.4.2 Gene expression ....................................................................................................... 50
5.4.3 Protein production ................................................................................................... 61
5.5 Role of adpA function in Streptomyces asterosporus ..................................................... 67
5.5.1 Genome Overview .................................................................................................... 67
5.5.2 Putative disrupted genes ......................................................................................... 70
5.5.3 Proteomic analysis ................................................................................................... 73
5.6 Enhancement of Griseorhodin A production in Streptomyces avermitilis SUKA22 ........ 75
5.6.1 Metabolic model ...................................................................................................... 75
5.6.2 Minimal-medium validation experiment ................................................................. 76
5.6.3 Knockout candidate identification ........................................................................... 79
5.6.4 Overview of all knockout candidates ..................................................................... 112
5.7 Experimental results ...................................................................................................... 114

Index
6 Discussion & Conclusion .............................................................................................. 118
6.1 StreptomeDB ................................................................................................................. 118
6.2 The effect of bldA in Streptomyces calvus..................................................................... 121
6.3 adpA regulon in Streptomyces asterosporus ................................................................. 125
6.4 Enhancing Griseorhodin A expression in Streptomyces avermitilis SUKA22 ................ 126
6.4.1 Minimal medium validation of the model of S. avermitilis SUKA22 ...................... 126
6.4.2 Knockout candidate identification ......................................................................... 127
6.4.3 Conclusion & Future perspective ........................................................................... 133
7 References .................................................................................................................. 134
8 Licenses ....................................................................................................................... 147
9 Acknowledgments ....................................................................................................... 148
10 Publications ................................................................................................................ 149
11 Conference contributions ............................................................................................ 150

Index
Abbreviations
% percent
°C degree celcius
A adenine
abs. absolute
ACN acetonitrile
ADP adenosine diphosphate
AMP adenosine monophosphate
ATP adenosine triphosphate
AUC area under the curve
bp base pairs
C cysteine
CDS coding sequence
CoA coenzyme A
COG cluster of orthologus groups
∆ deleted gene
DNA desoxiribonucleic acid
EC enzyme class
EtOH ethanol
e.g. exempli gratia
ENA european nucleotide archive
et al. et alii
FAD flavin adenine dinucleotide
FADH flavin adenine dinucleotide (semiquinone)
FADH2 flavin adenine dinucleotide (hydroquinone)
FBA flux balance analysis
fc fold change
G guanine
g gram
H+ proton
h hour
HCl hydrochloric acid
HPLC high performance liquid chromatography
HSCoA coenzyme A
kDa kilo Dalton
KEGG Kyoto encyclopedia of genes and genomes
m mass
m/z mass per charge
MB megabyte
mbp mega base pairs
Index
MeOH methanol
min minute
ml milliliter
mm millimeter
mmol millimole
mol mole
MS mass spectrometry
MS Medium mannitol soy medium
NAD nicotinamide adenine dinucleotide (oxidized)
NADH nicotinamide adenine dinucleotide (reduced)
NADPH nicotinamide adenine dinucleotide phosphate (oxidized)
NADPH nicotinamide adenine dinucleotide phosphate (reduced)
NMR nuclear magnetic resonance spectroscopy
NRPS non-ribosomal peptide synthetase
nt nucleotide substitutions per side
PAPS 3'-phosphoadenosine-5'-phosphosulfate PAP adenosine 3',5'-bisphosphate pH potential of hydrogen
PKBC polyketide backbone chain
PKS polyketide synthase
Ppi pyrophosphate
RNA ribonucleic acid
rpm revolutions per minute
rRNA ribosomal ribonucleic acid
s seconds
SAH S-adenosly homocysteine
SAM S-adenosyl methionine
SBML systems biology markup language
T thymine
tRNA transfer ribonucleic acid
TSB tryptone soy broth
U uracil
V volt
Index
List of figures
Figure 1 Lifecycle of Streptomycetes on solid media ....................................................................... 3
Figure 2 Albert Schatz (left) and Selman Waksman (right) discoverers of Streptomycin................ 4
Figure 3 Bioactive compounds from Streptomyces species ............................................................ 4
Figure 4 Fluorinated natural compounds ......................................................................................... 6
Figure 5 Proposed effects of bldA (25) ............................................................................................. 6
Figure 6 Pointmutation of bldA A ..................................................................................................... 7
Figure 7 Annimycin ........................................................................................................................... 8
Figure 8 Biosynthesis of Rubromycines ........................................................................................... 9
Figure 9 Overview of the important principles and steps in FBA .................................................. 12
Figure 10 E-Flux Method ................................................................................................................ 15
Figure 11 Paclitaxel......................................................................................................................... 16
Figure 12 Genome of S. avermitilis wildtype compared to genome of S. avermitilis SUKA22 ...... 17
Figure 13 Flowchart phylogenetic tree generation ........................................................................ 29
Figure 14 Flowchart knockout candidate identification ................................................................ 34
Figure 15 Coverage of papers reviewed for StreptomeDB ............................................................ 39
Figure 16 Distribution of biological activities among annotated compounds in StreptomeDB .... 40
Figure 17 Distribution of synthesis pathways among annotated compounds in StreptomeDB ... 41
Figure 18 Molecular weight distribution of StreptomeDB compared to DrugBank ...................... 42
Figure 19 Vizualization of the phylogenetic tree ........................................................................... 44
Figure 20 Visualization of predicted mass fragmentation products .............................................. 45
Figure 21 Visualization of NMR data .............................................................................................. 46
Figure 22 Scaffold browser of StreptomeDB ................................................................................. 47
Figure 23 Overview of gene transcription levels............................................................................ 51
Figure 24 Gene regulation in COGs ................................................................................................ 52
Figure 25 Overview of transcriptomic and proteomic data ........................................................... 54
Figure 26 Fold change density in subsystems ................................................................................ 56
Figure 27 Overview of genes in predicted subsystems .................................................................. 57
Figure 28 Correlation curves of Biomass vs Secondary Metabolite production ............................ 58
Index
Figure 29 Glyoxylate and Dicarboxylate metabolism from KEGG .................................................. 60
Figure 30 Hydroxypyruvate isomerase reaction overview from KEGG.......................................... 60
Figure 31 Overview of proteins related to Primary Metabolism organized by predicted functional
subsets ............................................................................................................................................ 66
Figure 32 Overview of Streptomyces asterosporus genome properties ....................................... 67
Figure 33 Dotplot of Nucleocidin cluster in S. calvus and S. asterosporus .................................... 69
Figure 34 Phylogenetic tree based on 16S rRNA............................................................................ 70
Figure 35 Proteomic results and adpA regulon .............................................................................. 73
Figure 36 Griseorhodin A synthesis including co-factors ............................................................... 75
Figure 37 pyrB in pyrimidine metabolism ...................................................................................... 84
Figure 38 pyrB in propanoate metabolism .................................................................................... 86
Figure 39 kbl in glycine, serine and threonine metabolism ........................................................... 90
Figure 40 pta in retinol metabolism ............................................................................................... 92
Figure 41 pta in pyruvate metabolism ........................................................................................... 94
Figure 42 pta in propanoate metabolism....................................................................................... 95
Figure 43 fadE4 in fatty acid degradation ...................................................................................... 97
Figure 44 fadE4 in valine, leucine and isoleucine degradation ...................................................... 99
Figure 45 rocA in arginine and proline metabolism ..................................................................... 107
Figure 46 plcA in ether lipid metabolism ..................................................................................... 109
Figure 47 rpe in pentose phosphate pathway ............................................................................. 111
Figure 48 Overview of the simulated effect of all knockout candidates with relative biomass
production values ......................................................................................................................... 112
Figure 49 Overview of the simulated effect of all knockout candidates with absolute biomass
production values ......................................................................................................................... 112
Figure 50 Differing morphology of the different Griseorhodin A producing SUKA22 mutants ... 114
Figure 51 Dry weights of all mutants and wildtype after 10 days of cultivation in TSB liquid
medium ........................................................................................................................................ 115
Figure 52 Varying Griseorhodin production of the different SUKA22 mutants ........................... 116
Figure 53 Model based data integration and interpretation ....................................................... 122
Index
List of tables
Table 1 HPLC gradient pattern ....................................................................................................... 37
Table 2 Content overview of StreptomeDB in 2013 and 2015 ...................................................... 38
Table 3 Number of rRNA sequences for each filtering step........................................................... 43
Table 4 Number of scaffolds per scaffold-level ............................................................................. 48
Table 5 Predicted functional subsets ............................................................................................. 55
Table 6 Key values from correlation plots of bldA effect on energy distribution .......................... 59
Table 7 Overproduced proteins with active bldA in Streptomyces calvus ..................................... 61
Table 8 Predicted rRNA genes in S. asterosporus .......................................................................... 68
Table 9 Mobile genetic elements in S. asterosporus predicted by ISfinder ................................. 70
Table 10 Comparison of correlation simulation of Griseorhodin A and biomass production in
wildtype and SUKA22 ..................................................................................................................... 80
Table 11 Knockout candidates competing for NADPH ................................................................... 81
Table 12 Knockout candidates competing for Malonyl-CoA. ......................................................... 83
Table 13 Knockout candidates competing for Acetyl-CoA. ............................................................ 87
Table 14 Knockout candidates competing for FAD ........................................................................ 96
Table 15 Knockout candidates competing for NAD ..................................................................... 101
Table 16 Summary of all knockout candidates ............................................................................ 113
Abstract
1
1 Abstract
Streptomycetes are an important source of biogenic drugs. The production of these compounds
is often associated with complex changes within these organisms. In addition to morphological
differentiation, such as the formation of aerial hyphae and spore chains, the cells globally
reorganize their metabolic machinery. This phenomenon is known as metabolic switch. Despite
these extensive metabolic changes, however, the yield in the production of these natural
substances is typically very low.
Genome-scale metabolic models are comprehensive mathematical networks of reactions and
metabolites occurring within an organism. The generation of such a model requires extensive
amounts of background information. Comprehensive scientific databases, such as StreptomeDB
presented in this work, are a valuable tool for the creation of these models. Simulations based
on such models can grant profound insights of the interrelationships of complex metabolic
changes and the underlying regulatory context. This knowledge can in turn be used to efficiently
develop rational metabolic engineering strategies.
In the course of this work, we used a genome-scale metabolic model of Streptomyces calvus to
interpret the effect of the pleiotropic regulator bldA, a key player in the metabolic switch of this
strain (1). For that, we gathered proteomic and transcriptomic data of the naturally bldA
deficient wildtype strain and a mutant with restored bldA function. With the help of the
genome-scale metabolic model, we could organize the data in a functional context and predict
their regulatory effect on the metabolic machinery. The herein gained insights on the natural
regulation of metabolic flux between primary and secondary metabolism were used to develop
new methods for the generation of metabolic engineering strategies. Contrary to common
methods, the aim of this approach is not to directly increase the secondary metabolite
production rate, but to improve the ratio of produced secondary metabolite per produced
biomass by decreasing the efficiency of the competing primary metabolism. This strategy was
used with a genome-scale metabolic model of the already genome minimized host strain
Streptomyces avermitilis SUKA22 to identify knockout candidates that have the potential to
redirect the flux of metabolites and energy in favor of the production of Griseorhodin A, a

Abstract
2
promising telomerase and viral reverse transcriptase inhibitor (2, 3). First semi quantitative
experiments indicate, that growth and production rate are influenced by these knockouts.

Introduction
3
2 Introduction
2.1 Streptomycetes, an important source of natural drugs
Streptomycetes are a group of ubiquitous gram-positive soil bacteria that can be found from the
bottom of the sea to even burning coal seam (4, 5). Their unusual lifecycle on solid media led to
a false classification as fungi when they were discovered. After forming vegetative hyphae that
reach inside the medium, they start forming aerial hyphae when aging. Finally, these areal
hyphae differentiate into spore chains. (6, 7).
Figure 1: Lifecycle of Streptomycetes on solid media. Starting with a single spore, a vegetative mycelium is formed, followed by
aerial hyphae in later phases of culture growth. These aerial hyphae finally differentiate into spore chains. Modified from (7) and
(6).
Introduction
4
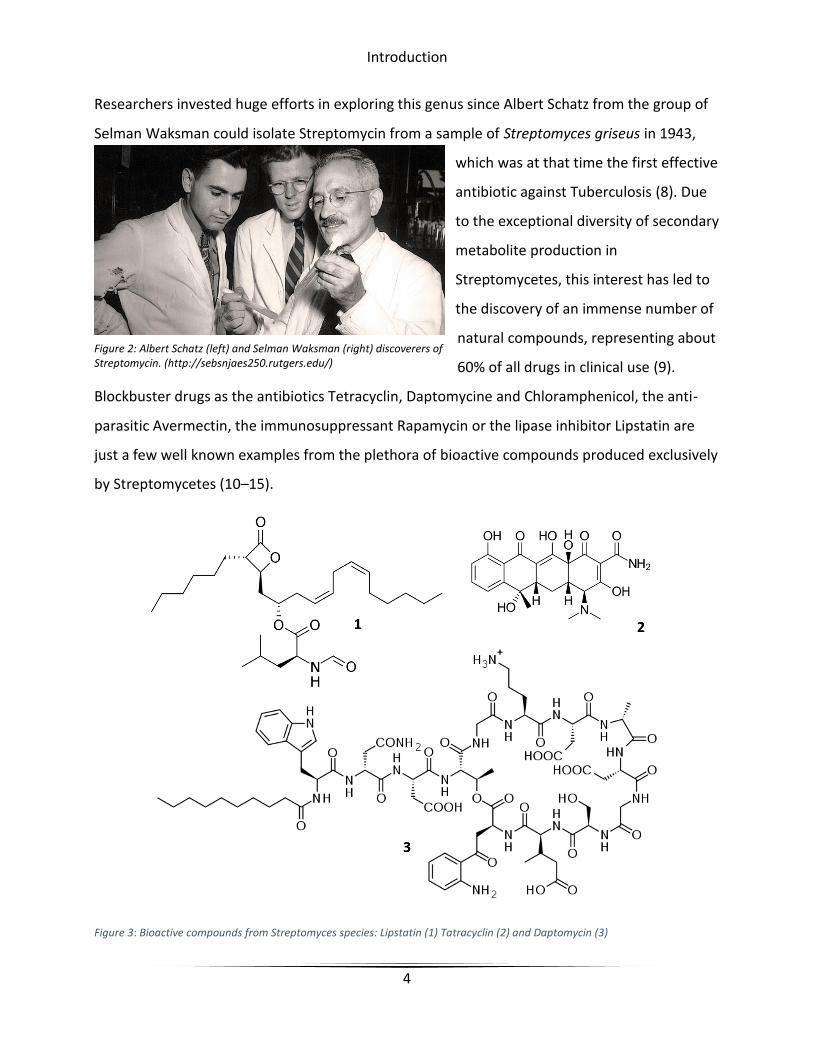
Researchers invested huge efforts in exploring this genus since Albert Schatz from the group of
Selman Waksman could isolate Streptomycin from a sample of Streptomyces griseus in 1943,
which was at that time the first effective
antibiotic against Tuberculosis (8). Due
to the exceptional diversity of secondary
metabolite production in
Streptomycetes, this interest has led to
the discovery of an immense number of
natural compounds, representing about
60% of all drugs in clinical use (9).
Blockbuster drugs as the antibiotics Tetracyclin, Daptomycine and Chloramphenicol, the anti-
parasitic Avermectin, the immunosuppressant Rapamycin or the lipase inhibitor Lipstatin are
just a few well known examples from the plethora of bioactive compounds produced exclusively
by Streptomycetes (10–15).
Figure 3: Bioactive compounds from Streptomyces species: Lipstatin (1) Tatracyclin (2) and Daptomycin (3)
Figure 2: Albert Schatz (left) and Selman Waksman (right) discoverers of Streptomycin. (http://sebsnjaes250.rutgers.edu/)
Introduction
5
The important role of these products for human society was most recently honored in 2015 by
presenting the Nobel-prize in medicine to William C. Campbell and Satoshi Ōmura for the
discovery of Avermectines in Streptomyces avermitilis (16). Even though being examined for
nearly 80 years, these bacteria are still a source of novel discoveries and potential new drug
substances (17). Throughout these decades, researchers had various interests and demands in
their studies. In the first half of the 20th century, infectious diseases were a common cause of
death, so the search for new antibiotics was a typical goal in working with Streptomycetes. This
interest changed over the time from infectious to cardiovascular diseases and lately anti-cancer
drugs. Nevertheless, the broad interest in compounds produced by these bacteria also lead to a
huge number of molecules that were isolated but did not show activity to the interest of their
age. These compounds are a rich source of potential new drug substances whose activities have
to be elucidated yet. A comprehensive collection of these compounds can be found in
StreptomeDB1. With more than 4.000 substances, it is currently the largest collection for this
genus and holds a broad spectrum of different background information (Chapter 6.1). Even
though there are already thousands of products known, their number is still increasing rapidly
with emerging methods (17, 18).
1 http://pharmazeutische-bioinformatik.de/streptomedb/
Introduction
6
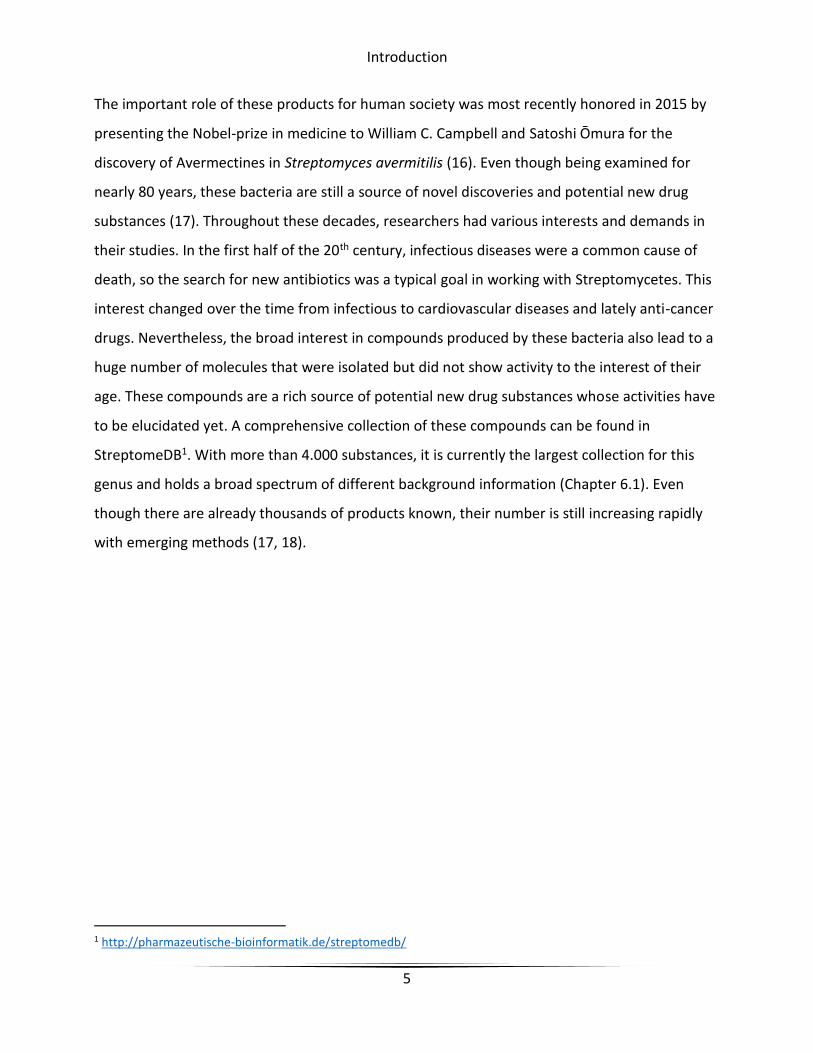
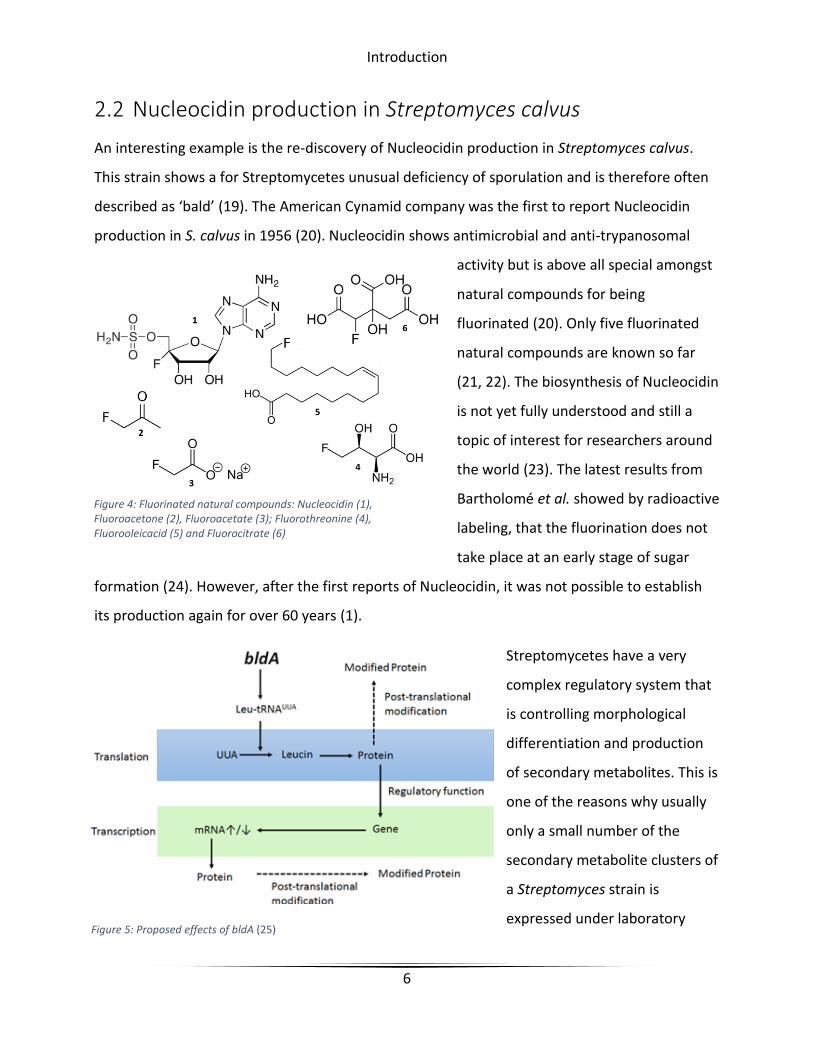
2.2 Nucleocidin production in Streptomyces calvus
An interesting example is the re-discovery of Nucleocidin production in Streptomyces calvus.
This strain shows a for Streptomycetes unusual deficiency of sporulation and is therefore often
described as ‘bald’ (19). The American Cynamid company was the first to report Nucleocidin
production in S. calvus in 1956 (20). Nucleocidin shows antimicrobial and anti-trypanosomal
activity but is above all special amongst
natural compounds for being
fluorinated (20). Only five fluorinated
natural compounds are known so far
(21, 22). The biosynthesis of Nucleocidin
is not yet fully understood and still a
topic of interest for researchers around
the world (23). The latest results from
Bartholomé et al. showed by radioactive
labeling, that the fluorination does not
take place at an early stage of sugar
formation (24). However, after the first reports of Nucleocidin, it was not possible to establish
its production again for over 60 years (1).
Streptomycetes have a very
complex regulatory system that
is controlling morphological
differentiation and production
of secondary metabolites. This is
one of the reasons why usually
only a small number of the
secondary metabolite clusters of
a Streptomyces strain is
expressed under laboratory
Figure 4: Fluorinated natural compounds: Nucleocidin (1), Fluoroacetone (2), Fluoroacetate (3); Fluorothreonine (4), Fluorooleicacid (5) and Fluorocitrate (6)
Figure 5: Proposed effects of bldA (25)

Introduction
7
conditions. These regulation mechanisms can be divided in cluster specific and pleiotropic
regulation. The latter usually also interacts with the former and a whole network of other
regulators. One of the best studied pleiotropic regulators in Streptomycetes is a gene called
bldA. It is encoding for a t-RNA that is supplying TTA or UUA codons with Leucine (25). This
codon is very rare in Streptomycetes which are known for their high G+C-content. Genes
including such a codon can only be translated if bldA is expressed. This happens commonly in
the static phase of the culture, when aerial hyphae are formed and sporulation is induced (26).
Besides translational regulation, bldA is also reported to play a role in transcriptional regulation
and post translational modification as shown in Figure 5: Proposed effects of bldA. In 2013,
Kalan et al. could show that Streptomyces calvus was the victim of a momentous point mutation
in its bldA gene. This mutation leads to a misfolding of the corresponding t-RNA and thus to a
complete loss of function (1).
Figure 6: Point mutation of bldA (A) bldA sequence from different Streptomyces strains; (B) Secondary structure of mutated
tRNA; (C) Secondary structure of active tRNA; (D) top/bottom: S. calvus with restored bldA function, middle: S. calvus wildtype
with disrupted bldA (1)

Introduction
8
By a complementation experiment, it could be shown, that like reported in Streptomyces
coelicolor, bldA plays also an important role in differentiation and secondary metabolite
production of S. calvus. With a functional bldA
gene, S. calvus showed morphological
differentiation to aerial hyphae and sporulation.
Additionally to Nucleocidin, it started to produce
Annimycin, a polyketide that has no antimicrobial
effect but inhibits sporulation in other
Actinomycetales.
Another example for bod strain is S. asterosporus, which is a close relative of S. calvus. Its
genome is also containing the rare Nucleocidin gene cluster. It has several similar phenotypical
features, such as the inability to form spores or aerial hyphae. However, this incapacity is not
caused by a mutation of bldA but is probably related to adpA, a regulatory gene that belongs to
the same network as bldA. According to Higo et al., adpA is forming a feedback loop with bldA
(26). Mutations in either of these genes caused a bald phenotype in Streptomyces griseus and
suppressed the production of Streptomycin. In Streptomyces coelicolor, these genes also control
the morphological differentiation but do not influence the production of secondary metabolites
(27).
Figure 7: Annimycin
Introduction
9
2.3 Griseorhodin A, a telomerase inhibitor from a marine
Streptomyces strain
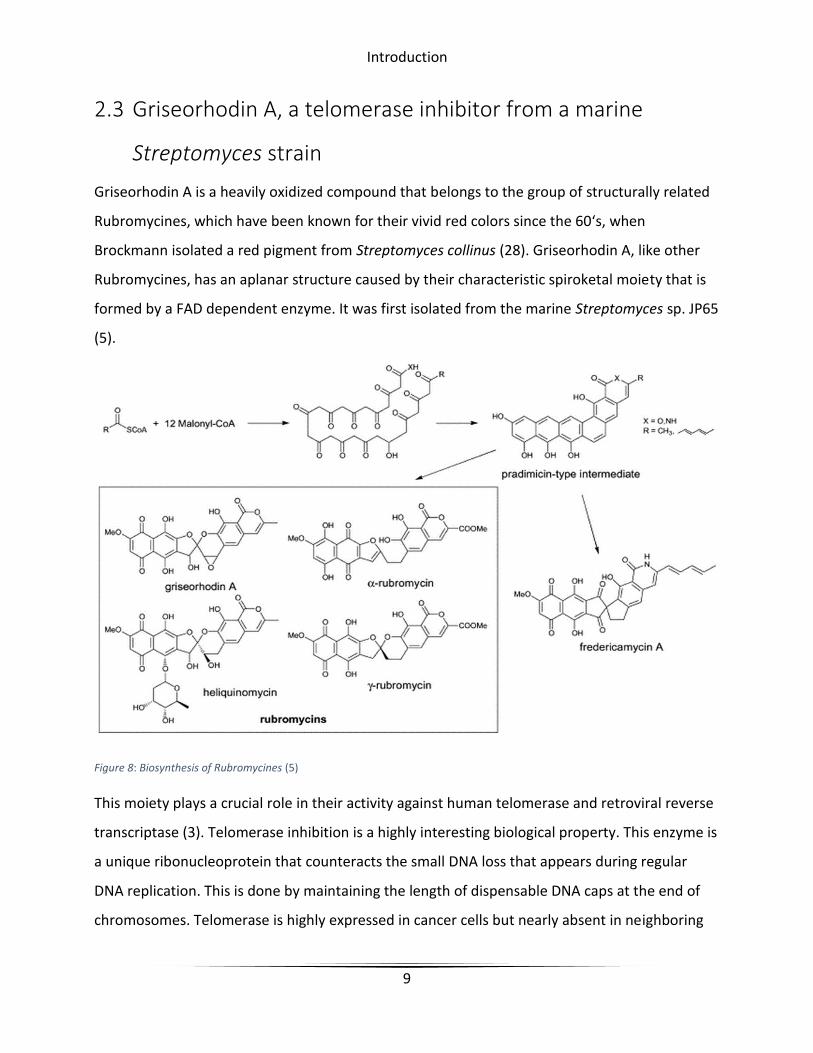
Griseorhodin A is a heavily oxidized compound that belongs to the group of structurally related
Rubromycines, which have been known for their vivid red colors since the 60‘s, when
Brockmann isolated a red pigment from Streptomyces collinus (28). Griseorhodin A, like other
Rubromycines, has an aplanar structure caused by their characteristic spiroketal moiety that is
formed by a FAD dependent enzyme. It was first isolated from the marine Streptomyces sp. JP65
(5).
Figure 8: Biosynthesis of Rubromycines (5)
This moiety plays a crucial role in their activity against human telomerase and retroviral reverse
transcriptase (3). Telomerase inhibition is a highly interesting biological property. This enzyme is
a unique ribonucleoprotein that counteracts the small DNA loss that appears during regular
DNA replication. This is done by maintaining the length of dispensable DNA caps at the end of
chromosomes. Telomerase is highly expressed in cancer cells but nearly absent in neighboring

Introduction
10
tissue (29). Although extensive efforts towards the total synthesis of Rubromycines have been
undertaken, the available synthetic routes are still limited and ineffective (30).
Introduction
11
2.4 Genome-scale metabolic modeling and Flux Balance Analysis
Metabolic models are sets of chemical reactions and according reactants that can occur in an
organism. A genome-scale metabolic model is based on the information that can be extracted
from an organism’s genome. Genes and their products are predicted and functionally annotated
to chemical reactions with the help of curated databases such as KEGG or BioCyc (31, 32).
Although this already results in a set of hundreds of reactions and reactants, these drafts still
contain gaps that impede simulations. Additional reactions, such as free diffusion or
spontaneous reactions have to be added and the results of the automated annotations have to
be carefully checked (33). In the past, the reconstruction of a genome-scale metabolic model
was a laborious task that included a lot of manual curation and correction (34). With strongly
increasing number of available sequenced genomes, the quality of automated annotation
databases is rapidly improving (35). Since genome-scale metabolic models are gaining
popularity, there are also automated gap-filling algorithms available (36–38). The latest release
of the RAST server and modelSEED is capable of generating directly usable models within few
hours. Once purged from essential gaps and errors, a model can be used for simulations and is
usually iteratively optimized with experimental data (33)
One of the most popular simulations that can be performed with such a model is constraint-
based Flux Balance Analysis (FBA). Metabolic models are usually stored in lists of
stoichiometrical reactions and reactants with varying amounts of additional information. For
FBA this data has to be translated to a mathematical matrix (S) of m rows (number of reactions)
and n columns (number of reactants). Each field of this matrix contains a value that displays if a
reaction consumes or produces a certain reactant. Consumed substrates are described by
negative numbers. The unit of these numbers is usually mmol per gram dry weight per hour
[mmol/g*h]. A vector (v) contains all reaction fluxes of the network. The upper and lower
boundary of the turnover rate of a reaction is defined in the model. A negative lower boundary
value herby defines a reversible reaction. To be able to simplify the differential reaction
equations to linear ones, the network has to be assumed to be in steady state S x v = 0. With
linear programming, it is possible to find a solution for this equation network where a particular
Introduction
12
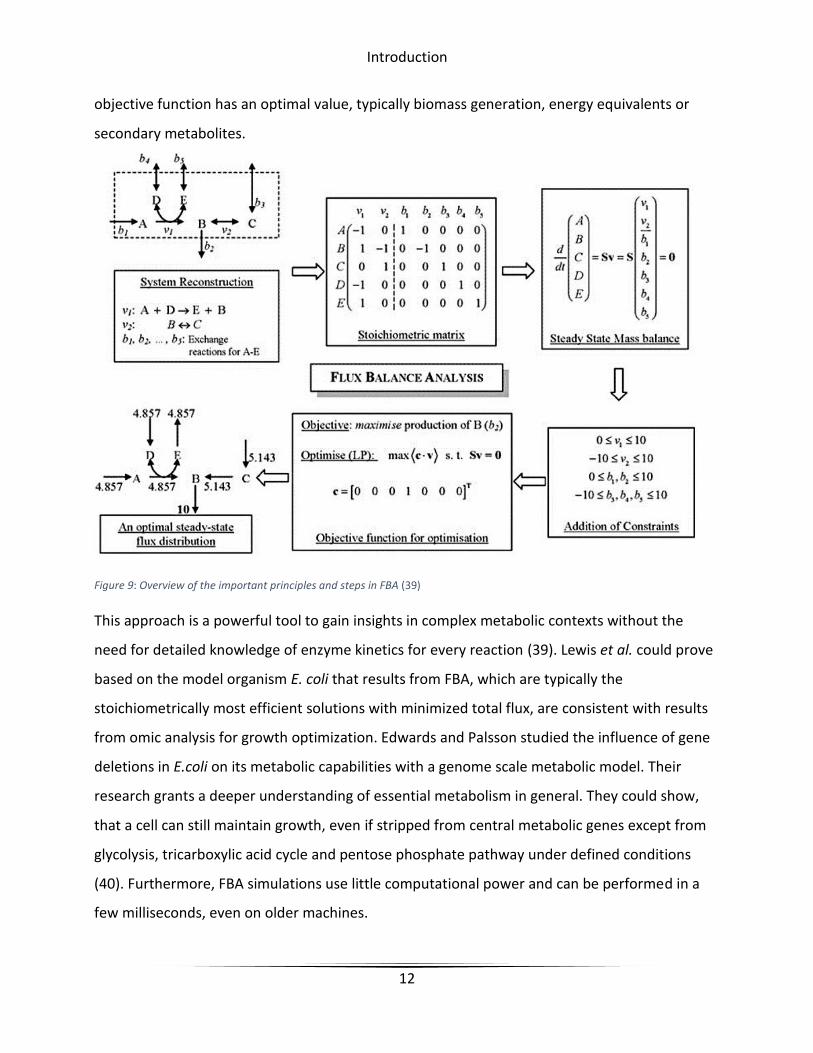
objective function has an optimal value, typically biomass generation, energy equivalents or
secondary metabolites.
Figure 9: Overview of the important principles and steps in FBA (39)
This approach is a powerful tool to gain insights in complex metabolic contexts without the
need for detailed knowledge of enzyme kinetics for every reaction (39). Lewis et al. could prove
based on the model organism E. coli that results from FBA, which are typically the
stoichiometrically most efficient solutions with minimized total flux, are consistent with results
from omic analysis for growth optimization. Edwards and Palsson studied the influence of gene
deletions in E.coli on its metabolic capabilities with a genome scale metabolic model. Their
research grants a deeper understanding of essential metabolism in general. They could show,
that a cell can still maintain growth, even if stripped from central metabolic genes except from
glycolysis, tricarboxylic acid cycle and pentose phosphate pathway under defined conditions
(40). Furthermore, FBA simulations use little computational power and can be performed in a
few milliseconds, even on older machines.

Introduction
13
Despite these huge benefits, metabolic simulations have some limitations. Though simulations
assume a steady state, it is hard to predict the effect of changing concentrations. Moreover,
regulatory mechanisms are typically not taken into account, resulting in inaccurate quantitative
predictions.
Introduction
14
2.5 ‘Omics’ data and genome-scale metabolic models
The analysis of ‘omics’-data and the prediction of resulting effects on a cell is still a challenging
task. Extensive changes in a cells metabolic machinery, such as morphological differentiation are
controlled by complex regulatory systems which are often not yet fully understood or even not
known so far (41).
Interpreting metabolomic data with the help of genome-scale metabolic models seems to be
fairly straightforward and is performed successfully, but they also offer the possibility to
incorporate other omics data (42, 43). Transcriptomic and proteomic data grant insights on the
regulation of the metabolic machinery of an organism on different levels, but are commonly not
correlating very well due to posttranslational modifications (44). This makes them particularly
difficult to interpret in context with simulations of conversion rates of the reactions that are
catalyzed by them (45).
However, there are several methods available to approach this problem. Experimental results
can be used to constrain the model and create a specific model for a certain phenotype or
disease. Such a model can be used to organize the gathered data or to compare predicted with
measured results in order to find differences that help to improve the model and provide a
deeper insight in underlying biological processes (46, 47).
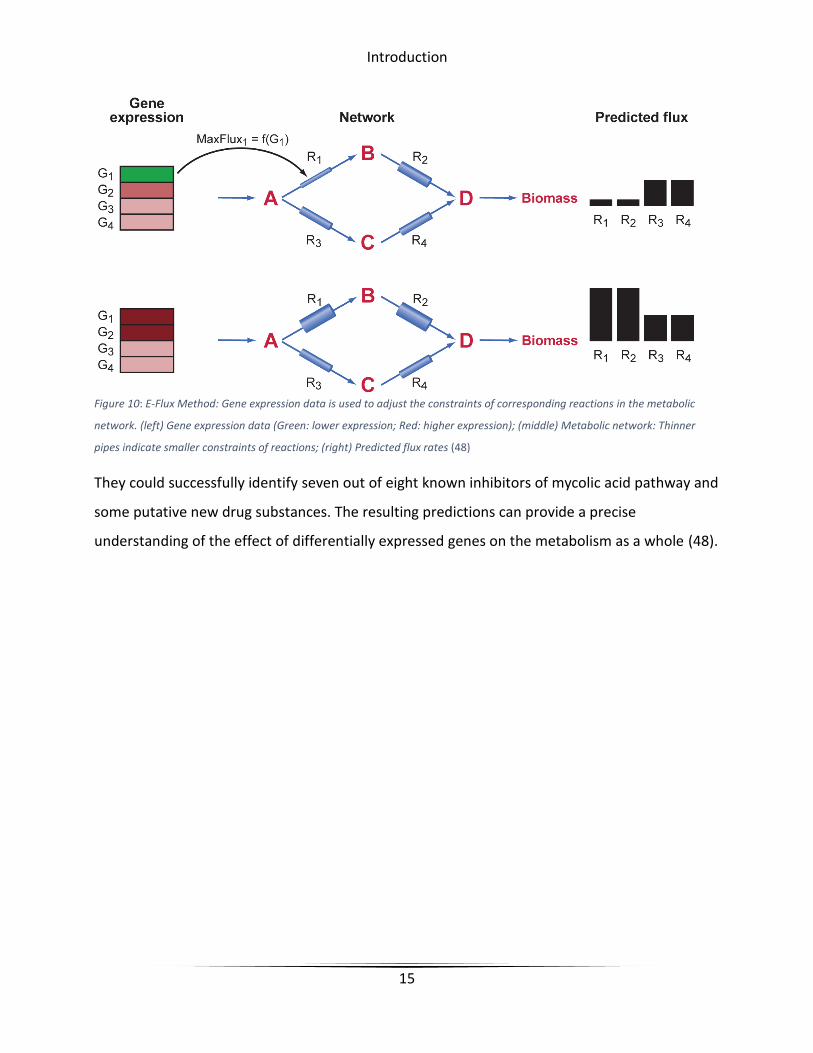
Colijn et al. have successfully shown, that Flux Balance Analysis is a powerful tool to predict the
effect of different gene expression levels on the metabolic capabilities of an organism.
Constraints, the possible ranges of turnover rates of a certain reaction in the simulations, are
adjusted according to fold changes of annotated genes. They used this ‘valve’-approach to
analyze transcriptome profiles of M. tuberculosis after being exposed to several inhibitors of its
metabolism.
Introduction
15
Figure 10: E-Flux Method: Gene expression data is used to adjust the constraints of corresponding reactions in the metabolic
network. (left) Gene expression data (Green: lower expression; Red: higher expression); (middle) Metabolic network: Thinner
pipes indicate smaller constraints of reactions; (right) Predicted flux rates (48)
They could successfully identify seven out of eight known inhibitors of mycolic acid pathway and
some putative new drug substances. The resulting predictions can provide a precise
understanding of the effect of differentially expressed genes on the metabolism as a whole (48).
Introduction
16
2.6 Enhanced secondary metabolite production and genome-
scale metabolic models
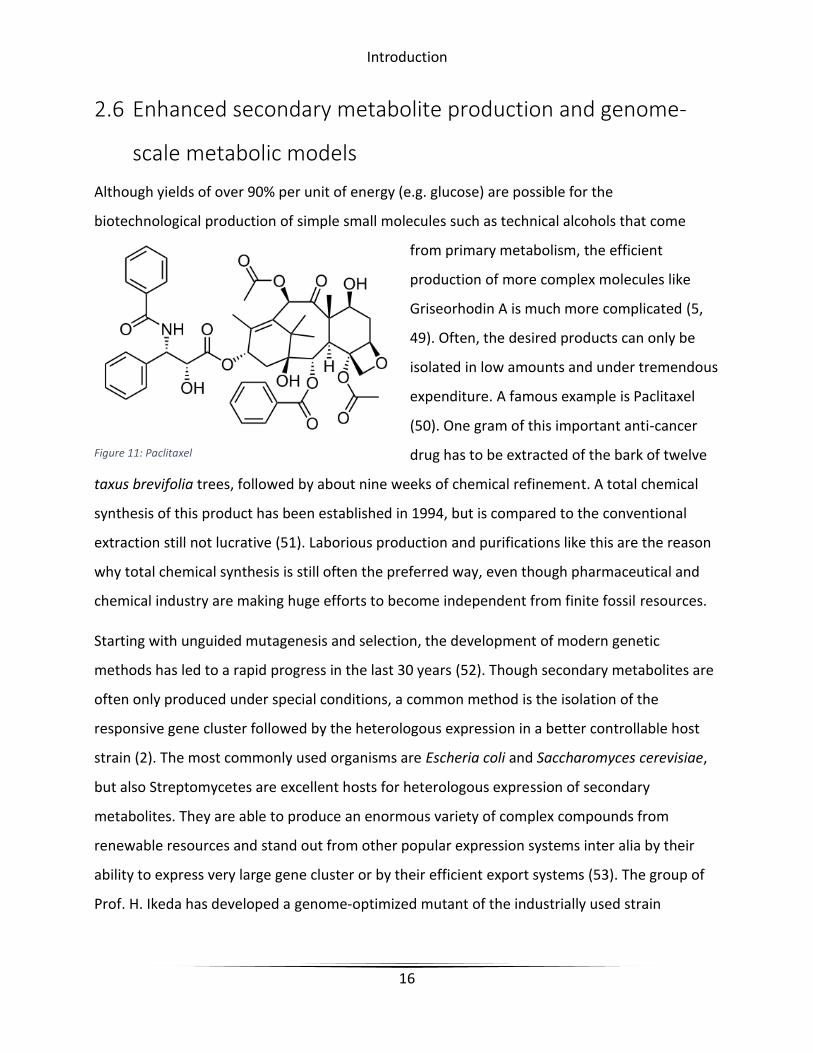
Although yields of over 90% per unit of energy (e.g. glucose) are possible for the
biotechnological production of simple small molecules such as technical alcohols that come
from primary metabolism, the efficient
production of more complex molecules like
Griseorhodin A is much more complicated (5,
49). Often, the desired products can only be
isolated in low amounts and under tremendous
expenditure. A famous example is Paclitaxel
(50). One gram of this important anti-cancer
drug has to be extracted of the bark of twelve
taxus brevifolia trees, followed by about nine weeks of chemical refinement. A total chemical
synthesis of this product has been established in 1994, but is compared to the conventional
extraction still not lucrative (51). Laborious production and purifications like this are the reason
why total chemical synthesis is still often the preferred way, even though pharmaceutical and
chemical industry are making huge efforts to become independent from finite fossil resources.
Starting with unguided mutagenesis and selection, the development of modern genetic
methods has led to a rapid progress in the last 30 years (52). Though secondary metabolites are
often only produced under special conditions, a common method is the isolation of the
responsive gene cluster followed by the heterologous expression in a better controllable host
strain (2). The most commonly used organisms are Escheria coli and Saccharomyces cerevisiae,
but also Streptomycetes are excellent hosts for heterologous expression of secondary
metabolites. They are able to produce an enormous variety of complex compounds from
renewable resources and stand out from other popular expression systems inter alia by their
ability to express very large gene cluster or by their efficient export systems (53). The group of
Prof. H. Ikeda has developed a genome-optimized mutant of the industrially used strain
Figure 11: Paclitaxel

Introduction
17
Streptomyces avermitilis. These so called SUKA strains have proven superior to many natural
hosts in terms of secondary metabolite production (2).
Figure 12: Genome of S. avermitilis wildtype compared to genome of S. avermitilis SUKA22. white arrows: OriC; black arrows:
rRNA genes; black bar: core region containing essential genes; letters: cutting pattern of endonuclease, modified regions are in
grey. Modified from (2) Copyright (2001) National Academy of Sciences.
By deleting about 1.7 mbp from its chromosomes arms, they could remove several secondary
gene clusters, competing for resources supplied by primary metabolism that are needed for the
generation of heterologous expressed compounds.
Other common methods that are applied in order to increase the outcome of fermentations are
overexpression of the desired products gene cluster or its transcriptional regulator, export
mechanisms, genes that are responsible for supply of precursors or knockouts of degrading
reactions (52).
Cofactors also play an important role in the production of secondary metabolites. They
transport precursors or provide for example the reductive or oxidative energy that is necessary
for enzymatic reactions. Experiments on increasing the supply of cofactors such as NADPH have
shown that influencing the redox balance of a cell can lead to a disproportional loss of
metabolic efficiency or even cell death. There are several emerging techniques available for the
optimization of cofactor supply but the understanding of the effects in the complex and strongly
interlinked metabolism of a cell regulations systems preventing the cell from redox imbalance
damage is still little (54).
The selection of a host for heterologous expression is a common step towards an enhanced
production of a certain secondary metabolite, but is often not guided by the evaluation of its
metabolic capabilities but by the availability and selection of strains that are available in the
researchers’ lab. Flux Balance Analysis can be used to identify the putatively most efficient host
for a certain secondary metabolite. Zakrewski et al. offered with their software MultiMetEval
Introduction
18
that already included a dataset of 38 genome scale metabolic models of Actinomycetales and 15
secondary metabolite synthesis pathways a powerful tool for this problem. Based on Pareto
font calculation, they could show that the correlation between primary and secondary
metabolism can differ significantly between different species (55).
In the last years, metabolic models have been utilized, often in combination with omics data, to
develop and enhance overproduction strategies. Genome-scale simulations offer the
opportunity to rationally guide metabolic engineering. Not only manipulation candidates can be
predicted but also the cellular metabolic response to the predicted manipulations (56). This
offers in-depth insights in the underlying effect of wanted and unwanted phenotypes and helps
to delimit the number of time consuming and expensive lab experiments. Dang et al. could
recently demonstrate the power of predictions based on a genome-scale metabolic model by
enhancing the rapamycin production in S. hygrosopicus. By in silico studies of the effect of
decreased and increased flux values on the product of the ratio of weighted and dimensionless
specific growth rate and specific rapamycin production rate they could identify pfk as knockout
and dahP as well as rapK as overexpression candidates. These manipulations lead to an
increased Rapamycin production rate of 142.3% compared to the wildtype strain (57).
Materials
19
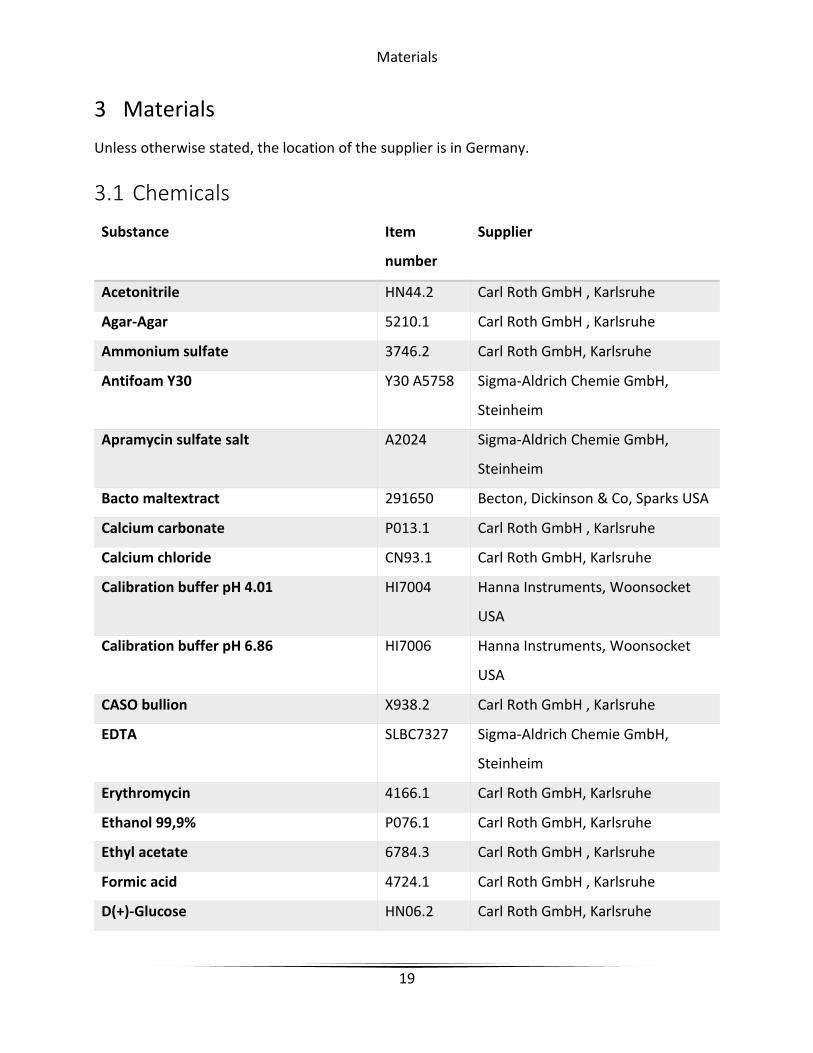
3 Materials
Unless otherwise stated, the location of the supplier is in Germany.
3.1 Chemicals
Substance Item
number
Supplier
Acetonitrile HN44.2 Carl Roth GmbH , Karlsruhe
Agar-Agar 5210.1 Carl Roth GmbH , Karlsruhe
Ammonium sulfate 3746.2 Carl Roth GmbH, Karlsruhe
Antifoam Y30 Y30 A5758 Sigma-Aldrich Chemie GmbH,
Steinheim
Apramycin sulfate salt A2024 Sigma-Aldrich Chemie GmbH,
Steinheim
Bacto maltextract 291650 Becton, Dickinson & Co, Sparks USA
Calcium carbonate P013.1 Carl Roth GmbH , Karlsruhe
Calcium chloride CN93.1 Carl Roth GmbH, Karlsruhe
Calibration buffer pH 4.01 HI7004 Hanna Instruments, Woonsocket
USA
Calibration buffer pH 6.86 HI7006 Hanna Instruments, Woonsocket
USA
CASO bullion X938.2 Carl Roth GmbH , Karlsruhe
EDTA SLBC7327 Sigma-Aldrich Chemie GmbH,
Steinheim
Erythromycin 4166.1 Carl Roth GmbH, Karlsruhe
Ethanol 99,9% P076.1 Carl Roth GmbH, Karlsruhe
Ethyl acetate 6784.3 Carl Roth GmbH , Karlsruhe
Formic acid 4724.1 Carl Roth GmbH , Karlsruhe
D(+)-Glucose HN06.2 Carl Roth GmbH, Karlsruhe

Materials
20
Hydrochloric acid 37% 9277.1 Carl Roth GmbH , Karlsruhe
Iron(II) sulfate heptahydrate 3722.1 Carl Roth GmbH, Karlsruhe
Isopropanol AE73.1 Carl Roth GmbH , Karlsruhe
Dipotassium phosphate P749.1 Carl Roth GmbH, Karlsruhe
Kanamycin sulfate T832.1 Carl Roth GmbH, Karlsruhe
Lab Lemco meatextract LP0029 Oxoid Ltd, Basingstoke UK
L-Lysin hydrochloride 1700.2 Carl Roth GmbH, Karlsruhe
Magnesium chloride hexahydrate HN03.1 Carl Roth GmbH, Karlsruhe
Magnesium sulfate heptahydrate T888.1 Carl Roth GmbH, Karlsruhe
Manganese(II) chloride tetrahydrate 0276.1 Carl Roth GmbH, Karlsruhe
D(-)-Mannit 4175.1 Carl Roth GmbH, Karlsruhe
2-Mercaptoethanol 4227.3 Carl Roth GmbH , Karlsruhe
Methanol AE71.2 Carl Roth GmbH , Karlsruhe
Nalidixic acid CN32.1 Carl Roth GmbH, Karlsruhe
Natrium chloride HN00.1 Carl Roth GmbH, Karlsruhe
Mononatrium hydrogenphosphate
dihydrate
T879.1 Carl Roth GmbH, Karlsruhe
RNAseZAP SCBC9516V Sigma-Aldrich Chemie GmbH,
Steinheim
D(+)-Saccharose 4621.1 Carl Roth GmbH, Karlsruhe
Sodium hydroxide 40% 4347.1 Carl Roth GmbH , Karlsruhe
Sucrose 4621.1 Carl Roth GmbH , Karlsruhe
Soy flour 2004246 W.Schoenenberger, Magstadt
Soluble starch 4701.1 Carl Roth GmbH, Karlsruhe
L-Tryptophan 1739.1 Carl Roth GmbH, Karlsruhe
Zinc sulfate heptahydrate K301.1 Carl Roth GmbH, Karlsruhe
Materials
21
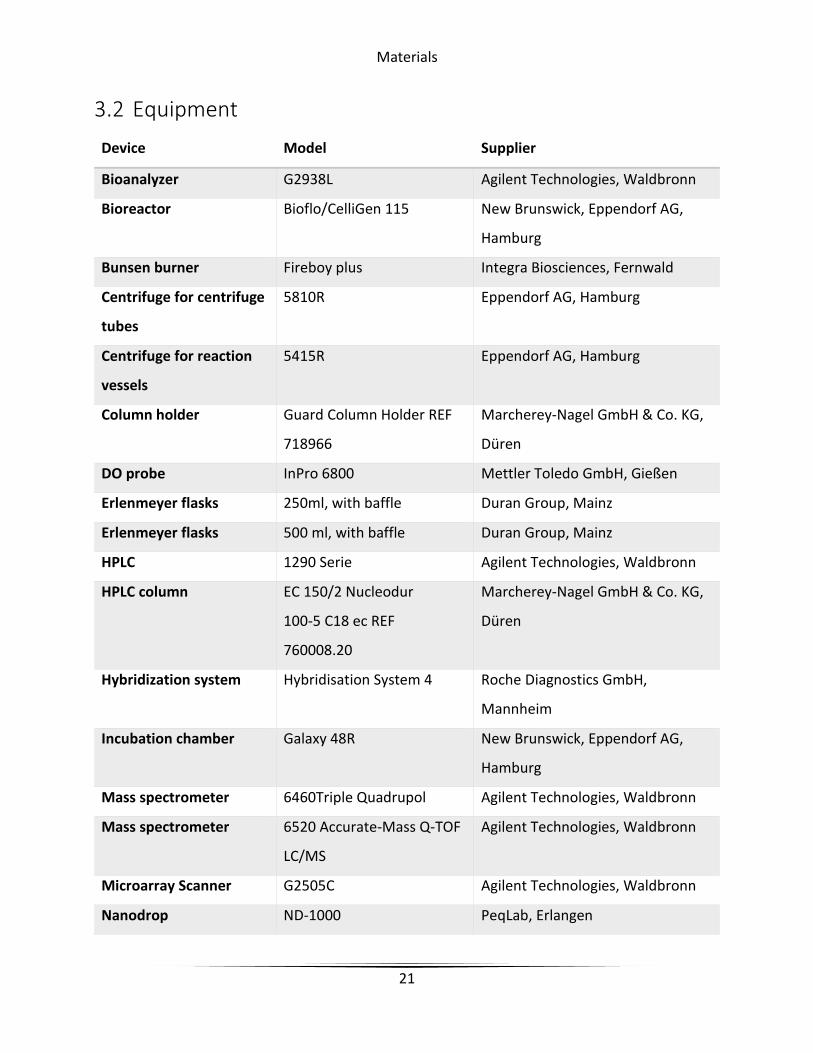
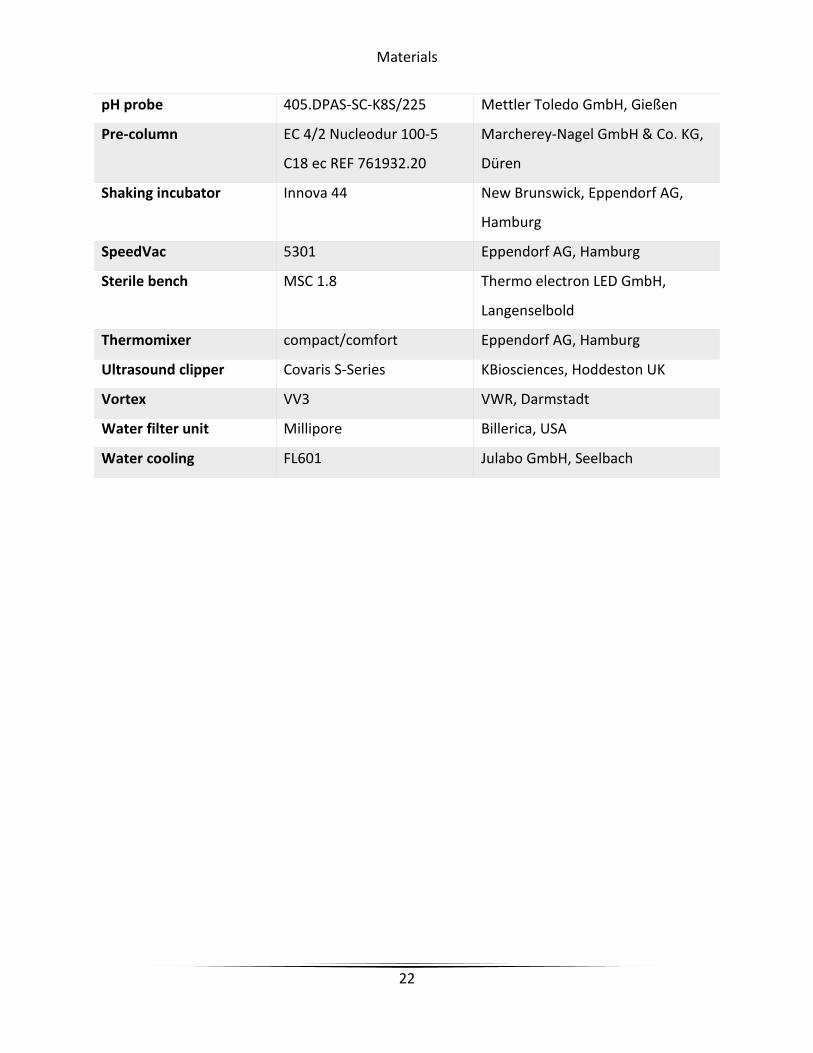
3.2 Equipment
Device Model Supplier
Bioanalyzer G2938L Agilent Technologies, Waldbronn
Bioreactor Bioflo/CelliGen 115 New Brunswick, Eppendorf AG,
Hamburg
Bunsen burner Fireboy plus Integra Biosciences, Fernwald
Centrifuge for centrifuge
tubes
5810R Eppendorf AG, Hamburg
Centrifuge for reaction
vessels
5415R Eppendorf AG, Hamburg
Column holder Guard Column Holder REF
718966
Marcherey-Nagel GmbH & Co. KG,
Düren
DO probe InPro 6800 Mettler Toledo GmbH, Gießen
Erlenmeyer flasks 250ml, with baffle Duran Group, Mainz
Erlenmeyer flasks 500 ml, with baffle Duran Group, Mainz
HPLC 1290 Serie Agilent Technologies, Waldbronn
HPLC column EC 150/2 Nucleodur
100-5 C18 ec REF
760008.20
Marcherey-Nagel GmbH & Co. KG,
Düren
Hybridization system Hybridisation System 4 Roche Diagnostics GmbH,
Mannheim
Incubation chamber Galaxy 48R New Brunswick, Eppendorf AG,
Hamburg
Mass spectrometer 6460Triple Quadrupol Agilent Technologies, Waldbronn
Mass spectrometer 6520 Accurate-Mass Q-TOF
LC/MS
Agilent Technologies, Waldbronn
Microarray Scanner G2505C Agilent Technologies, Waldbronn
Nanodrop ND-1000 PeqLab, Erlangen
Materials
22
pH probe 405.DPAS-SC-K8S/225 Mettler Toledo GmbH, Gießen
Pre-column EC 4/2 Nucleodur 100-5
C18 ec REF 761932.20
Marcherey-Nagel GmbH & Co. KG,
Düren
Shaking incubator Innova 44 New Brunswick, Eppendorf AG,
Hamburg
SpeedVac 5301 Eppendorf AG, Hamburg
Sterile bench MSC 1.8 Thermo electron LED GmbH,
Langenselbold
Thermomixer compact/comfort Eppendorf AG, Hamburg
Ultrasound clipper Covaris S-Series KBiosciences, Hoddeston UK
Vortex VV3 VWR, Darmstadt
Water filter unit Millipore Billerica, USA
Water cooling FL601 Julabo GmbH, Seelbach
Materials
23
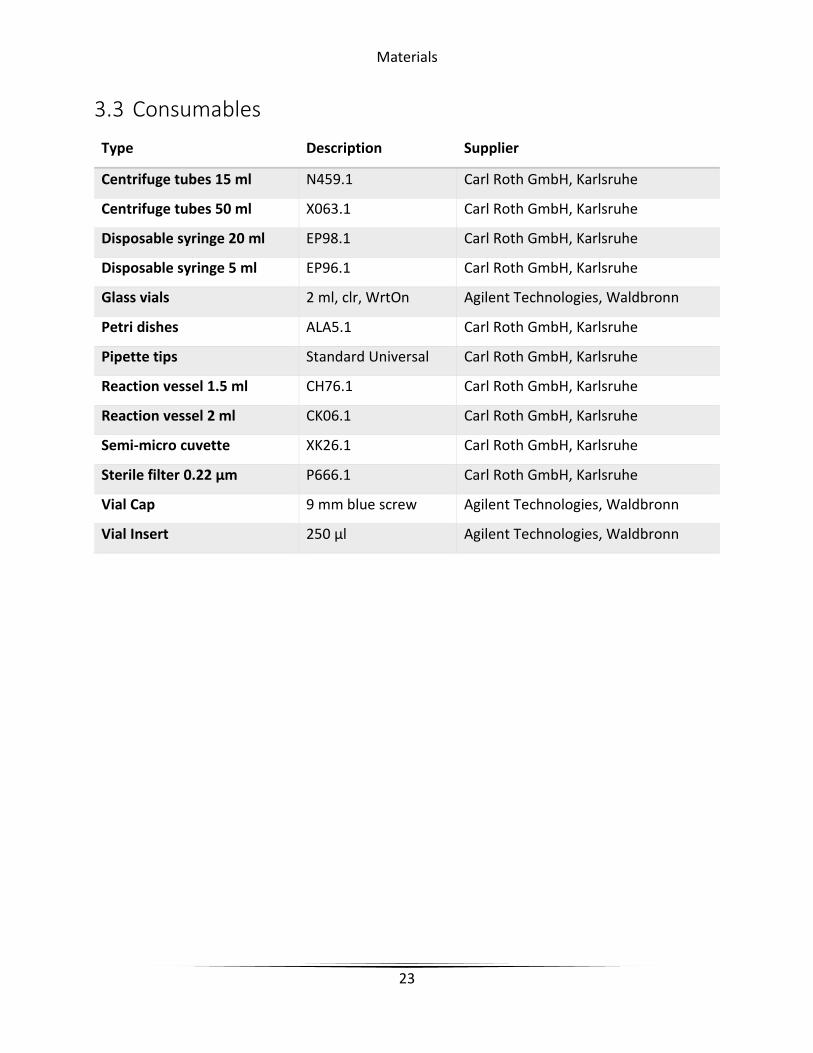
3.3 Consumables
Type Description Supplier
Centrifuge tubes 15 ml N459.1 Carl Roth GmbH, Karlsruhe
Centrifuge tubes 50 ml X063.1 Carl Roth GmbH, Karlsruhe
Disposable syringe 20 ml EP98.1 Carl Roth GmbH, Karlsruhe
Disposable syringe 5 ml EP96.1 Carl Roth GmbH, Karlsruhe
Glass vials 2 ml, clr, WrtOn Agilent Technologies, Waldbronn
Petri dishes ALA5.1 Carl Roth GmbH, Karlsruhe
Pipette tips Standard Universal Carl Roth GmbH, Karlsruhe
Reaction vessel 1.5 ml CH76.1 Carl Roth GmbH, Karlsruhe
Reaction vessel 2 ml CK06.1 Carl Roth GmbH, Karlsruhe
Semi-micro cuvette XK26.1 Carl Roth GmbH, Karlsruhe
Sterile filter 0.22 µm P666.1 Carl Roth GmbH, Karlsruhe
Vial Cap 9 mm blue screw Agilent Technologies, Waldbronn
Vial Insert 250 μl Agilent Technologies, Waldbronn
Materials
24
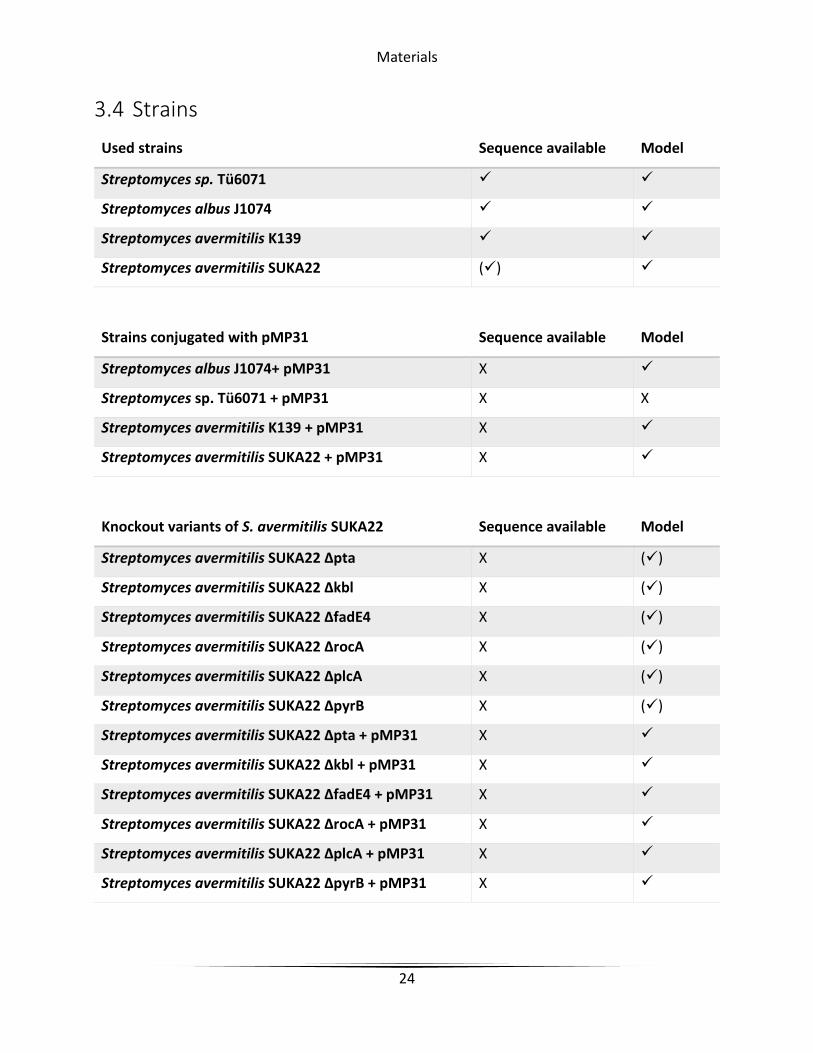
3.4 Strains
Used strains Sequence available Model
Streptomyces sp. Tü6071
Streptomyces albus J1074
Streptomyces avermitilis K139
Streptomyces avermitilis SUKA22 ()
Strains conjugated with pMP31 Sequence available Model
Streptomyces albus J1074+ pMP31 X
Streptomyces sp. Tü6071 + pMP31 X X
Streptomyces avermitilis K139 + pMP31 X
Streptomyces avermitilis SUKA22 + pMP31 X
Knockout variants of S. avermitilis SUKA22 Sequence available Model
Streptomyces avermitilis SUKA22 Δpta X ()
Streptomyces avermitilis SUKA22 Δkbl X ()
Streptomyces avermitilis SUKA22 ΔfadE4 X ()
Streptomyces avermitilis SUKA22 ΔrocA X ()
Streptomyces avermitilis SUKA22 ΔplcA X ()
Streptomyces avermitilis SUKA22 ΔpyrB X ()
Streptomyces avermitilis SUKA22 Δpta + pMP31 X
Streptomyces avermitilis SUKA22 Δkbl + pMP31 X
Streptomyces avermitilis SUKA22 ΔfadE4 + pMP31 X
Streptomyces avermitilis SUKA22 ΔrocA + pMP31 X
Streptomyces avermitilis SUKA22 ΔplcA + pMP31 X
Streptomyces avermitilis SUKA22 ΔpyrB + pMP31 X
Materials
25
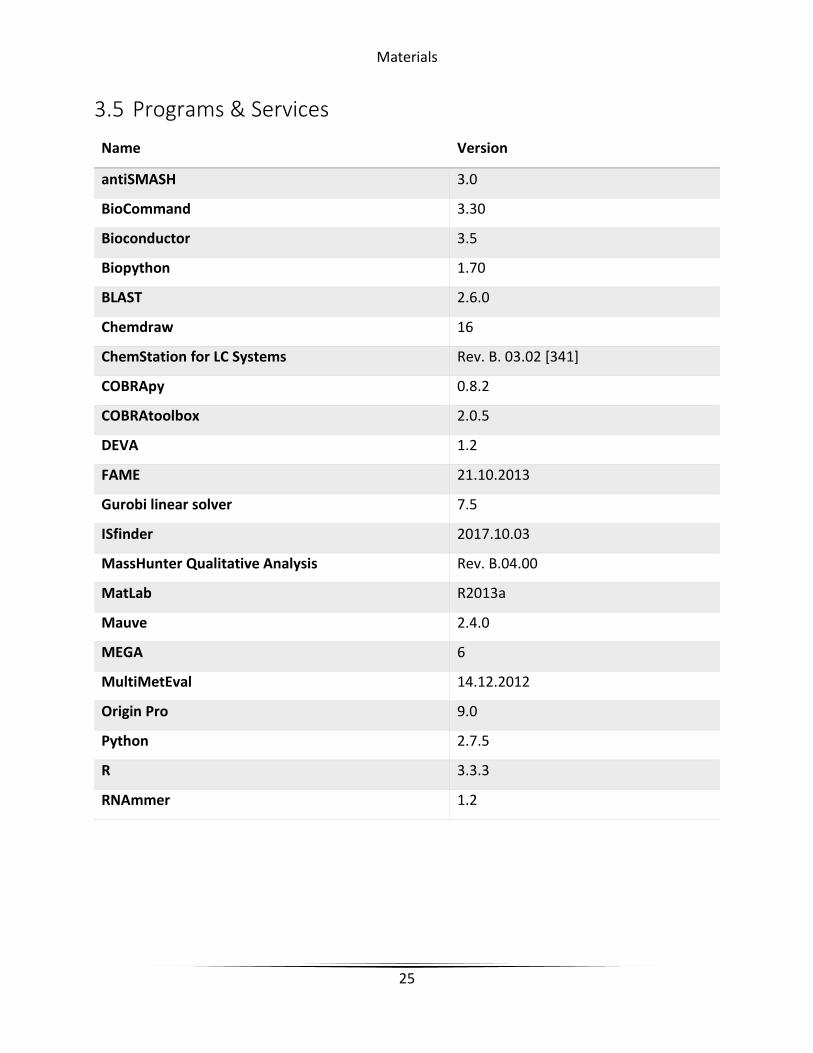
3.5 Programs & Services
Name Version
antiSMASH 3.0
BioCommand 3.30
Bioconductor 3.5
Biopython 1.70
BLAST 2.6.0
Chemdraw 16
ChemStation for LC Systems Rev. B. 03.02 [341]
COBRApy 0.8.2
COBRAtoolbox 2.0.5
DEVA 1.2
FAME 21.10.2013
Gurobi linear solver 7.5
ISfinder 2017.10.03
MassHunter Qualitative Analysis Rev. B.04.00
MatLab R2013a
Mauve 2.4.0
MEGA 6
MultiMetEval 14.12.2012
Origin Pro 9.0
Python 2.7.5
R 3.3.3
RNAmmer 1.2

Materials
26
3.6 Cultivation media
All media were used as liquid and solid media. The solid Media included 1% Agar-Agar.
3.6.1 TSB (Tryptone Soy Broth)
Ingredient Content
CASO-Bullion 30 g
Tab water ad 1000 ml
3.6.2 MS (Mannitol Soy)
Ingredient Content
D(-)-Mannit 20 g
Soy flour 20 g
Magnesium chloride hexahydrate 2 g
Tab water ad 1000 ml
3.6.3 SG+ (Soytone Glucose)
Ingredient Content
Glucose 20 g
Soytone 10 g
Calcium carbonat 2 g
L-Valine 1 g
Cobalt chloride 2.34 mg
Tab water ad 1000 ml

Materials
27
3.6.4 Minor Element Solution
Ingredient Content
Zinc sulfate heptahydrate 1 g
Iron(II) sulfate heptahydrate 1 g
Manganese(II) chloride tetrahydrate 1 g
Calcium chloride 1 g
Purified water ad 1000 ml
3.6.5 Buffer
Ingredient Content
Dipotassium phosphate 8.7 g
Mononatrium hydrogenphosphate dihydrate 7.8 g
Purified water ad 1000 ml
3.6.6 Minimal medium
Ingredient Content
L-Lysine hydrochloride 0.286 g
L-Tryptophan 4.714 g
Ammonium sulfate 2 g
Magnesium sulfate heptahydrate 0.6 g
Carbon source 5 g
Minor Element Soulution 1 ml
Buffer 150 ml
Purified water ad 1000 ml

Methods
28
4 Methods
4.1 StreptomeDB
4.1.1 Data collection
The Data was automatically extracted from literature and manually curated according to the
protocol presented in the first StreptomeDB publication (58). Additionally, we put a special
focus on compounds described in the most recent publicly available full texts. This includes
hundreds of compounds that cannot yet be found in popular databases such as PubChem or
Zinc (59).
4.1.2 Genomes, taxonomy and gene clusters
If available, the organisms have been assigned to their taxonomic ID and freely accessible
complete genome sequences from GenBank (60, 61). Compounds were linked to their gene
clusters in DoBISCUT and MiBIG (62, 63).
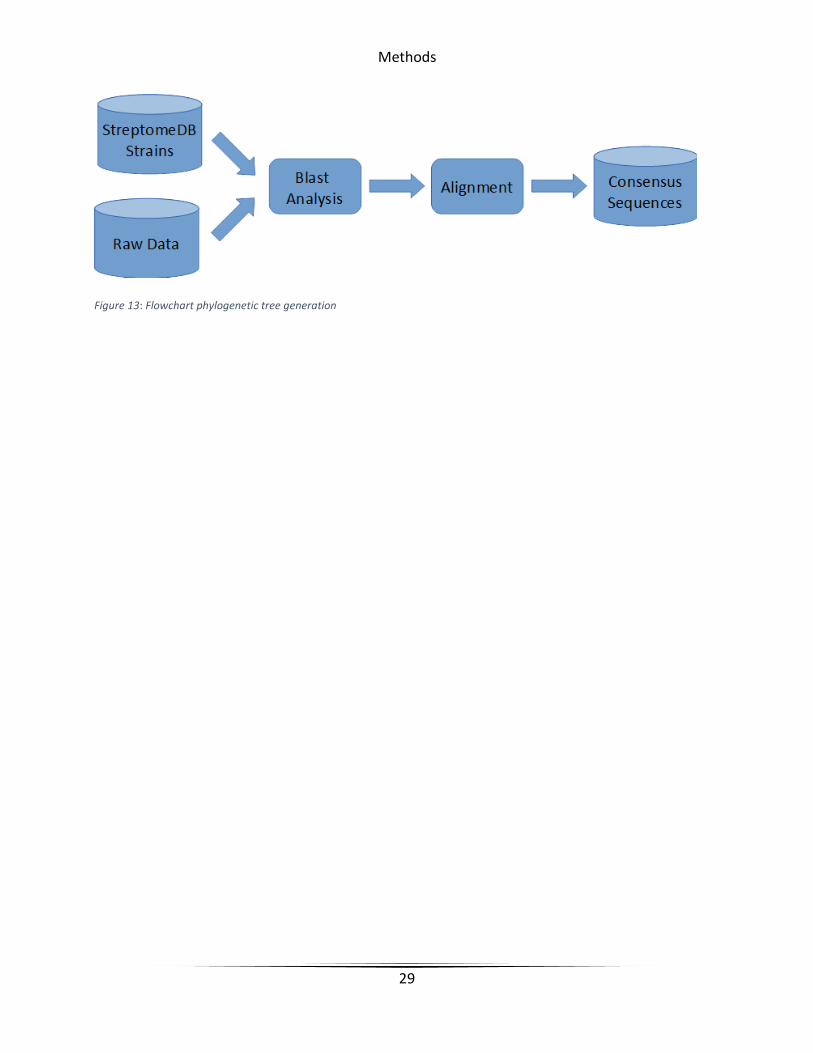
4.1.3 Generation of the phylogenetic tree
26,201 16S rRNA sequences were collected from ArB silva and ENA (61, 64). They were matched
to the strains represented in StreptomeDB. Sequences with low quality or an untypical length
were omitted. For strains where several sequences were available (in some cases over 150 from
different sources), a consensus sequence was calculated. For this purpose, all sequences
available for one strain were compared with each by BLAST analysis. The sequences with the
most hits were used to calculate a consensus sequence with the dump_consensus function of
Biopython (65). Subsequently, all sequences were aligned with ClustalW (66). The resulting
alignment was analyzed with the MEGA software package using maximum likehood and
maximum parsimony algorithms with 250 bootstrap replications (67). Sub-cluster within 0.07 nt
substitutions per side of the same ancestor node were summarized using DendroPy (68).
Visualization and final editing was performed with the ETE Toolkit (69).
Methods
29
Figure 13: Flowchart phylogenetic tree generation
Methods
30
4.2 AdpA in Streptomyces asterosporus
4.2.1 Detection of transposons
Transposons were detected with the services from ISfinder (70). The resulting Blast analysis was
filtered by length and quality. Only matches with more than 95% sequence identity and a p-
value below 0.005 were considered.
4.2.2 Detection of adpA binding sites
According to Yao et al., the sequence of the adpA binding site is 5’–TGGCSNGWWY-3’ (S is G or
C, W is A or T, Y is T or C, and N is any nucleotide) (71). The genome of S. asterosporus was
screened with the regular expression “TGGC[GC][GCAT]G[AT][AT][TC]” on sense and antisense
strand.
4.2.3 Prediction of adpA regulon
Genes potentially interacting with adpA were extracted from STRING database (72). In addition
to genes that have been found to interact directly with adpA in S. griseus and S. coelicolor, this
also includes the genes of the next level of interaction. This includes all genes that are in direct
relation with those that interact directly with adpA. If these genes are present in the genome of
S. calvus, they were included in the circos diagram (Figure 25).
4.2.4 Potential disrupted genes
In order to find genes that have been disrupted by transposons, the area around the transposon
sequences have been scanned. For this purpose, gene segments of 2500 bp were extracted
before and after the corresponding transposon and joined together without the transposon
sequence. The newly created sequences were blasted against UniProt/SwissProt for hits that
were not found in the original annotation (73).

Methods
31
4.2.5 G+C content and skew
The average G+C content and G+C skew were calculated in chunks of 5000 bp with the following
formulas:
G+C content: 100% ∙𝐺+𝐶
𝐺+𝐶+𝐴+𝑇
G+C skew: 𝐺−𝐶
𝐺+𝐶
4.2.6 Dotplot
The dotplot of the Nucleocidin clusters form S. asterosporus and S. calvus were computed with
the services of YASS with default options (74). The gene clusters were extracted according to
antiSMASH annotations.

Methods
32
4.3 Genome-scale metabolic modeling
For the simulation of the model, several functions from COBRApy were used together with the
Gurobi linear solver2 (75).
4.3.1 Model reconstruction
The models were reconstructed with the services provided by RAST and ModelSEED followed by
manual curation (76, 77). RAST automated annotation was performed with options adapted to
the results of the respective sequencing project with the latest FIGfams available. Errors and
gaps that could not be fixed automatically or were caused by the gap-filling algorithm used
during the automated reconstruction were identified manually or by validation experiments
that will be described later.
4.3.2 Analysis of essential elements
Essential reactions were detected by using the single_reaction_deletion method from COBRApy.
Reactions that lead to a flux value of 0.0 mmol/(g*h) for the objective function were considered
essential for this objective function.
Essential genes were detected by using the single_gene_deletion method from COBRApy. Genes
that lead to a flux value of 0.0 mmol/(g*h) for the objective function were considered essential
for this objective function.
Essential metabolites were detected by stepwise knocking the transport reactions from the
boundary condition out. Metabolites that are transported by reactions whose knockout resulted
in a flux value of 0.0 mmol/(g*h) for the objective function were considered to be essential. For
further analysis, these reactions were enabled again. This approach results in the minimal set of
boundary reactions that is necessary for the objective function.
4.3.3 Correlation plot and area under the curve (AUC)
The correlation curve was calculated for two objective functions in dependence of each other.
First, the optimal flux value of secondary metabolite production was determined. Next, the
2 www.gurobi.com
Methods
33
constraints of the final reaction of secondary metabolite production were both set to this value
to force a fixed turnover rate. Then the model was iteratively optimized on growth rate, while
the fixed turnover rate of secondary metabolite production was stepwise reduced to zero. The
area under the resulting curve was calculated according to Simpson’s rule (78). The relative AUC
was calculated in relation to the area stretched between the two maximal values.
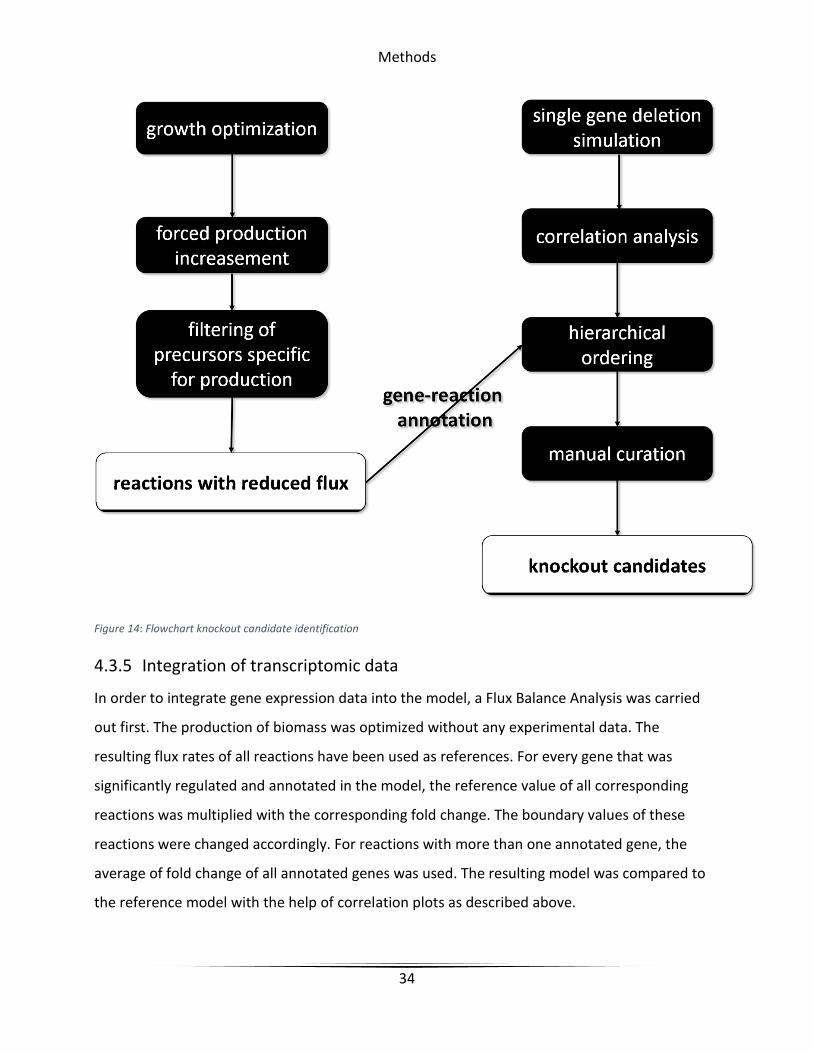
4.3.4 Knockout candidate identification
Essential genes were identified by single gene deletion simulation. For this, the constraints of all
reactions annotated to a certain gene are set to zero. If the following optimization on biomass
production resulted in a value equal or close to zero, the respective gene was considered to be
essential. These genes were no longer taken into account.
Knockout simulations were evaluated by their influence on the generation of biomass and
correlation of biomass and secondary metabolite production. For this, the area under the curve
(AUC) of a correlation plot was used. Knockouts resulting in a significantly reduced production
rate of the secondary metabolite were also omitted.
Reactions from primary metabolism that are directly competing for resources with secondary
metabolite production were identified by comparing their flux values during the different steps
of the correlation plot generation. Reactions showing a decreased flux value while secondary
metabolite production is increased were considered to be competing for resources. The found
candidates were classified according to the precursors needed for secondary metabolite
synthesis. In addition, two candidates were determined on the basis of single knockout
correlation analysis only, independent of precursors. Finally, all knockout candidates were
screened for suitability. The more exclusively reactions are annotated to the knockout candidate
the better.
Methods
34
Figure 14: Flowchart knockout candidate identification
4.3.5 Integration of transcriptomic data
In order to integrate gene expression data into the model, a Flux Balance Analysis was carried
out first. The production of biomass was optimized without any experimental data. The
resulting flux rates of all reactions have been used as references. For every gene that was
significantly regulated and annotated in the model, the reference value of all corresponding
reactions was multiplied with the corresponding fold change. The boundary values of these
reactions were changed accordingly. For reactions with more than one annotated gene, the
average of fold change of all annotated genes was used. The resulting model was compared to
the reference model with the help of correlation plots as described above.
Methods
35
4.3.6 Generation of functional subsets
Gene expression data was analyzed with the help of the metabolic model. The model was
individually optimized for the production of Nucleocidin, Annimycin and biomass. For each
simulation, a subset of genes was compiled, based on whether their reactions showed a flux
rate other than zero. Additional subsets were created by subtracting reactions involved in the
generation of biomass from the reaction sets needed for secondary metabolite production. This
resulted in a set of genes from primary metabolism that are required exclusively for the
production of precursors of secondary metabolites.
4.3.7 Minimal medium prediction and validation
The composition of the minimum medium should not consist of more than two amino acids, a
carbon source and a defined salt composition. Tryptophan and lysine were chosen as amino
acids, starch, glucose, sucrose, and mannitol were tested as carbon sources. The salt solution
and the ratio between nitrogen to carbon sources were chosen according to the minimum
medium composition from Hopwood et al. (79). The simulation of the media was carried out by
manipulating the exchange reactions between defined model space and boundary condition.
The constraints of reactions transporting substances that were not necessary to grow the strains
in vitro were set to zero. In case no growth could be simulated, the model was revised
accordingly. The flux rates of lysine and tryptophan uptake in the simulation of cell growth were
used to determine the optimal ratio of the two amino acids for the minimal medium.

Methods
36
4.4 Strain cultivation
4.4.1 Preculture
Inoculation was done with a cropped 1 ml pipet tips that was pricked in frozen sucrose
permanent culture. The tip was then ejected into the prepared medium. All strains were
cultivated for 48 h in 50 ml Tryptone Soy Both (TSB) in 250 ml Erlenmeyer flasks with baffle at
28 °C and 180 rpm in a shaking incubator.
4.4.2 Permanent culture
The respective culture was cultivated for 48 h in 50 ml TSB at 28 °C and 180 rpm in 250 ml
Erlenmeyer flasks with baffle in a shaking incubator. The cells were transferred into 50 ml
centrifuge tubes and centrifuged for 10 min at 5000 rpm. The supernatant was discarded. The
pellet was redispersed in 10 ml of 20% sucrose solution, transferred to a 15 ml centrifuge tube
and stored at -20 °C.
4.4.3 Agar cultures
The sterile petri dishes were poured with freshly autoclaved medium under a sterile bench and
stored there until they solidified. Depending on the antibiotic used, it was added to the medium
before autoclaving, or the plate was subsequently treated with a sterile filtered solution. The
cultures were applied to the agar by dilution smear or with a Drigalski spatula. Plates were
cultivated at 28 °C and stored at 6 °C for up to three months.
4.4.4 Liquid culture in Erlenmeyer flasks
Strains were cultivated in 500 ml Erlenmeyer flasks with baffle and a stainless steel spiral.
200 ml cultivation medium was inoculated with 1 ml pre-culture. They were incubated at 28 °C
and 180 rpm in a shaking incubator.
4.4.5 Dry weight measurement
3 ml (2 ml +1 ml) of the bacterial culture were centrifuged for 10 minutes at maximal speed in a
tared 2 ml reaction flask. The supernatant was discarded. Pellets were tree times washed with
1 ml of purified water. Remaining pellets were dried in a SpeedVac overnight at 30 °C.
Methods
37
4.4.6 Sample preparation for HPLC-MS
1 ml of frozen bacterial culture was thawed, mixed with a standard solution and acidified with
150 µl of 0.5 M HCl. Cells were mechanically broken with 300 mg of glass beads in a ball mill at
room temperature. The resulting solution was three times extracted with 0.5 ml of ethyl
acetate. The organic phase was collected and dried overnight in a SpeedVac at room
temperature.
Dried samples were either stored at -20 °C or dissolved in MeOH/H2O (50/50), if necessary in an
ultrasound bath. The resulting solution was centrifuged for 10 minutes at maximal speed before
it was transferred to an injection vial with insert.
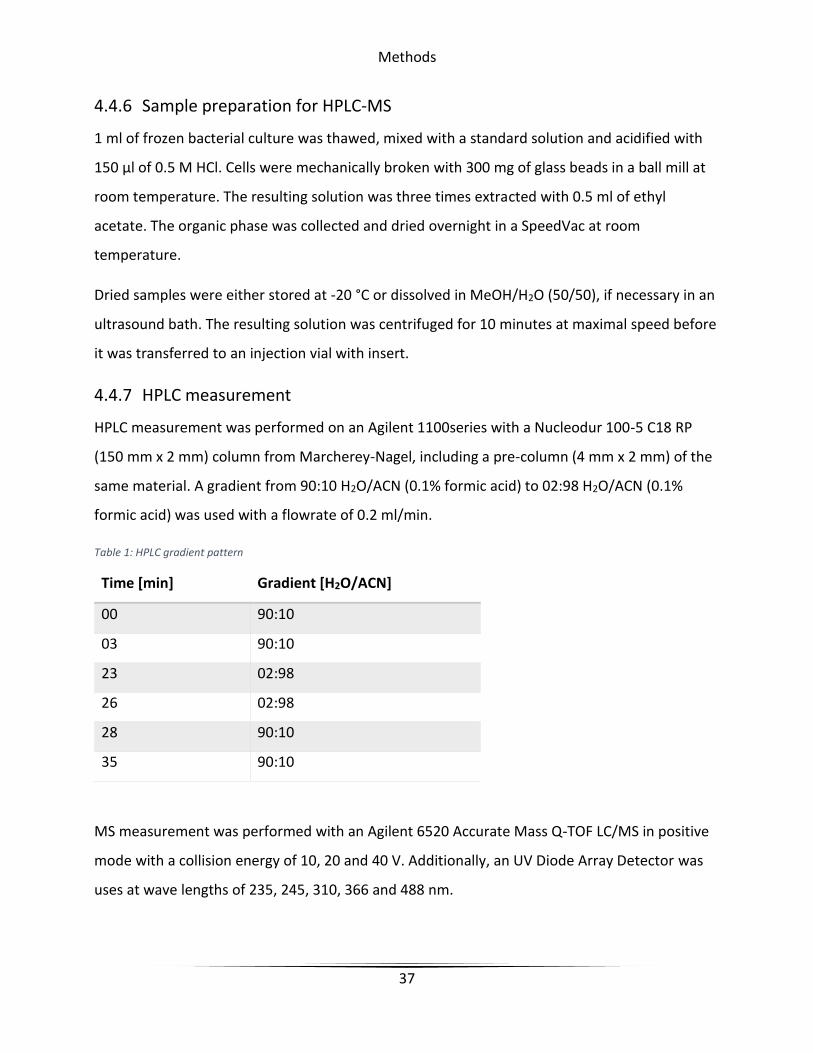
4.4.7 HPLC measurement
HPLC measurement was performed on an Agilent 1100series with a Nucleodur 100-5 C18 RP
(150 mm x 2 mm) column from Marcherey-Nagel, including a pre-column (4 mm x 2 mm) of the
same material. A gradient from 90:10 H2O/ACN (0.1% formic acid) to 02:98 H2O/ACN (0.1%
formic acid) was used with a flowrate of 0.2 ml/min.
Table 1: HPLC gradient pattern
Time [min] Gradient [H2O/ACN]
00 90:10
03 90:10
23 02:98
26 02:98
28 90:10
35 90:10
MS measurement was performed with an Agilent 6520 Accurate Mass Q-TOF LC/MS in positive
mode with a collision energy of 10, 20 and 40 V. Additionally, an UV Diode Array Detector was
uses at wave lengths of 235, 245, 310, 366 and 488 nm.

Results
38
5 Results
5.1 StreptomeDB update
StreptomeDB is currently the largest collection of metabolites reported to be produced in
Streptomycetes (58). With its advanced features, it allows for navigation through this vast
amount of structures in many scientific contexts. In 2015, we introduced this comprehensive
update(80).
5.2 Data Overview
Table 2: Content overview of StreptomeDB in 2013 and 2015
Release 2013 2015
No. of Compounds 2,444 4,040
No. of Organisms 1,985 2,584
No. of Synthesis Pathways 9 12
No. of Activities 579 905
No. of References 4,544 6,717
The update of StreptomeDB significantly increased its content. The number of included
compounds was nearly doubled to about 4,000 structures. The number auf annotated host
organisms, different synthesis pathways, and biological activities could be supplemented
accordingly. Additionally, further background information and several new features were
implemented:
- Interactive phylogenetic tree
- Scaffold-based navigation and search system
- Gene cluster information

Results
39
- Predicted MS data
- Predicted NMR data
- Physicochemical search options
This new data includes 4,485 different scaffolds, 6,717 compound-organism relationships, 1,945
MS-spectra in positive mode with 10, 20, and 40 eV, 3,989 NMR-spectra, 251 gene clusters, and
390 complete genomes. For sake of computational time, the MS-spectra prediction was limited
to compounds with 30 or less heavy atoms.
Figure 15: Coverage of papers reviewed for StreptomeDB
Even though Streptomycetes are examined since the beginning of the 20th century, Figure 15
shows that the number of publications concerning this genus is still increasing every year by

Results
40
more than 15 publications per year in average. For the update, we focused especially on the
most recent publications until October 2014.
Figure 16: Distribution of biological activities among annotated compounds in StreptomeDB
In total, 905 different activities could be annotated to 2,011 compounds. These activities were
extracted as they were reported in the corresponding publications. This includes very specific
activities such as the inhibition of a certain enzyme to very unspecific activities like toxicity.
Some of the activities, such as ‘toxic’ and ‘cytotoxic’ could be summarized but others such as the
inhibition of a certain enzyme could not be subsumed under a more general description. The
most common activity of the reported compounds in StreptomeDB is antibiosis with 666
substances. 160 of them were reported to have anticancer activity, 96 to be antifungal and 70
to be cytotoxic. All other activities have less than 10 representatives.
49,67%
33,21%
7,92%
4,83%
3,48%0,46% 0,43%
others - 49,67%
antibiotic - 33,21%
anticancer - 7,92%
antifungal - 4,83%
cytotoxic - 3,48%
antiviral - 0,46%
antiparasitic - 0,43%

Results
41
Figure 17: Distribution of synthesis pathways among annotated compounds in StreptomeDB
690 compounds could be annotated to 12 different synthesis pathways. These pathways were
only included if they were reported in the corresponding publications. They also include hybrid
pathways such as, NRPS-PKS hybrid cluster, etc. With more than two-thirds of all compounds
with reported synthesis pathway, polyketides are by far the biggest group. With only about 13%,
nonribosomal peptides are the second most common compound class. Terpenes, which are
actually a typical compound class produces by plants, are on third place. This supports the
reputation of Streptomycetes as remarkable efficient producers of this type of structures (81).
69,08%
13,41%
9,99%
4,65%
1,50%1,37%
PKS - 69,08%
NRPS - 13,41%
terpene - 9,99%
hybrid PKS/NRPS - 4,65%
shikimate - 1,50%
others - 1,37%
Results
42
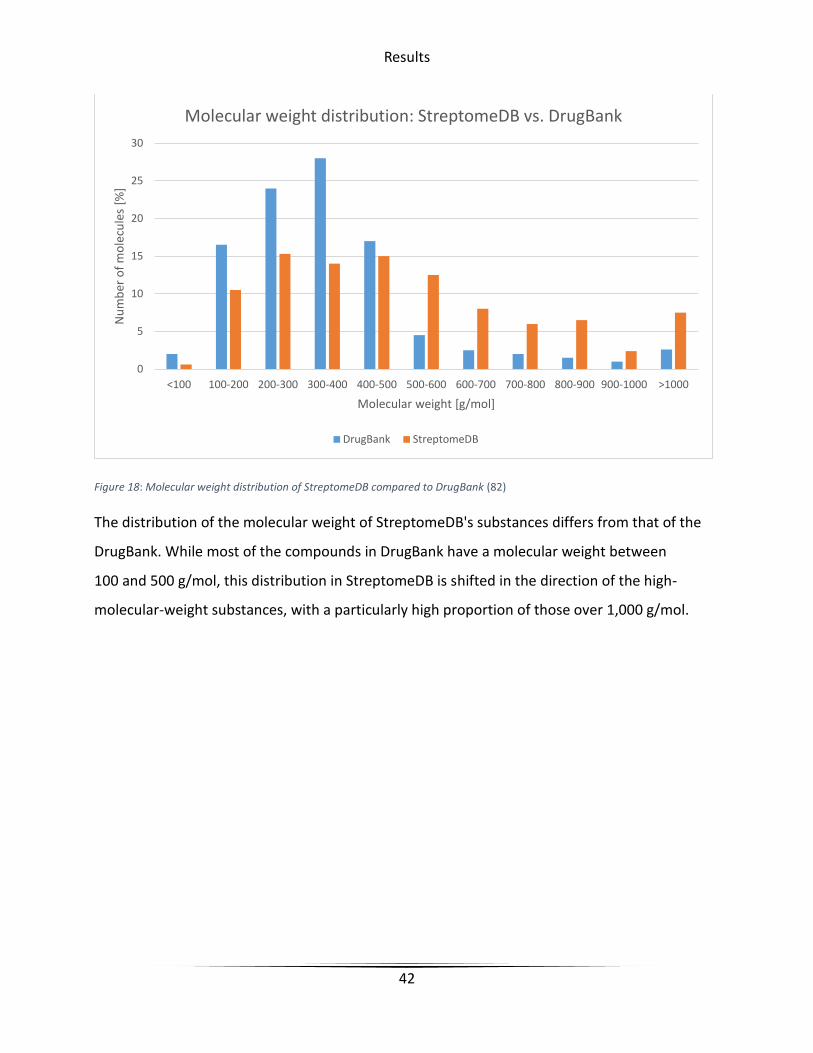
Figure 18: Molecular weight distribution of StreptomeDB compared to DrugBank (82)
The distribution of the molecular weight of StreptomeDB's substances differs from that of the
DrugBank. While most of the compounds in DrugBank have a molecular weight between
100 and 500 g/mol, this distribution in StreptomeDB is shifted in the direction of the high-
molecular-weight substances, with a particularly high proportion of those over 1,000 g/mol.
0
5
10
15
20
25
30
<100 100-200 200-300 300-400 400-500 500-600 600-700 700-800 800-900 900-1000 >1000
Nu
mb
er o
f m
ole
cule
s [%
]
Molecular weight [g/mol]
Molecular weight distribution: StreptomeDB vs. DrugBank
DrugBank StreptomeDB

Results
43
5.3 Phylogenetic tree
A new feature of StreptomeDB is a comprehensive phylogenetic tree based on 16S rRNA
sequences. In total, 26,201 unique rRNA sequences were available on the two largest databases
for 16S rRNA: ArbSilva and ENA (64, 83). This also includes results from metagenomics analysis,
old ones with meanwhile changed designation and sequences from rather doubtful origin and
quality. After mapping the sequences to the strains reported in StreptomeDB, their number
could be reduced to 12,807. This still included sequences with low quality or wrong annotation.
After thorough filtering for coverage and length, the dataset was reduced to about 5% of its
initial size. Considering the up to six 16S rRNA (40) sequences present in a Streptomyces
genome, and in some cases several similar sequencing attempts for one sequence, which
cannot be distinguished in quality or length, a single consensus sequence was generated for
each strain. For a better overview and because of the relatively short evolutionary distance,
more than 1200 sub strains are represented by 319 parent stains, e.g. clicking on ‘Streptomyces
griseus’ leads to 128 compounds produced either by S. griseus itself or one of its 58 sub-strains,
such as S. griseus or S. griseus var. psychrophilus.
Table 3: Number of rRNA sequences for each filtering step
“High Quality” Streptomyces 16S rRNA
sequences from ArbSilva and ENA
26,201 (270 MB)
Sequences from Organisms in StreptomeDB 12,807 (133 MB)
Sequences with correct length
(1400-1600 bp)
1,240 (4.5 MB)
Consensus sequences 319
Results
44
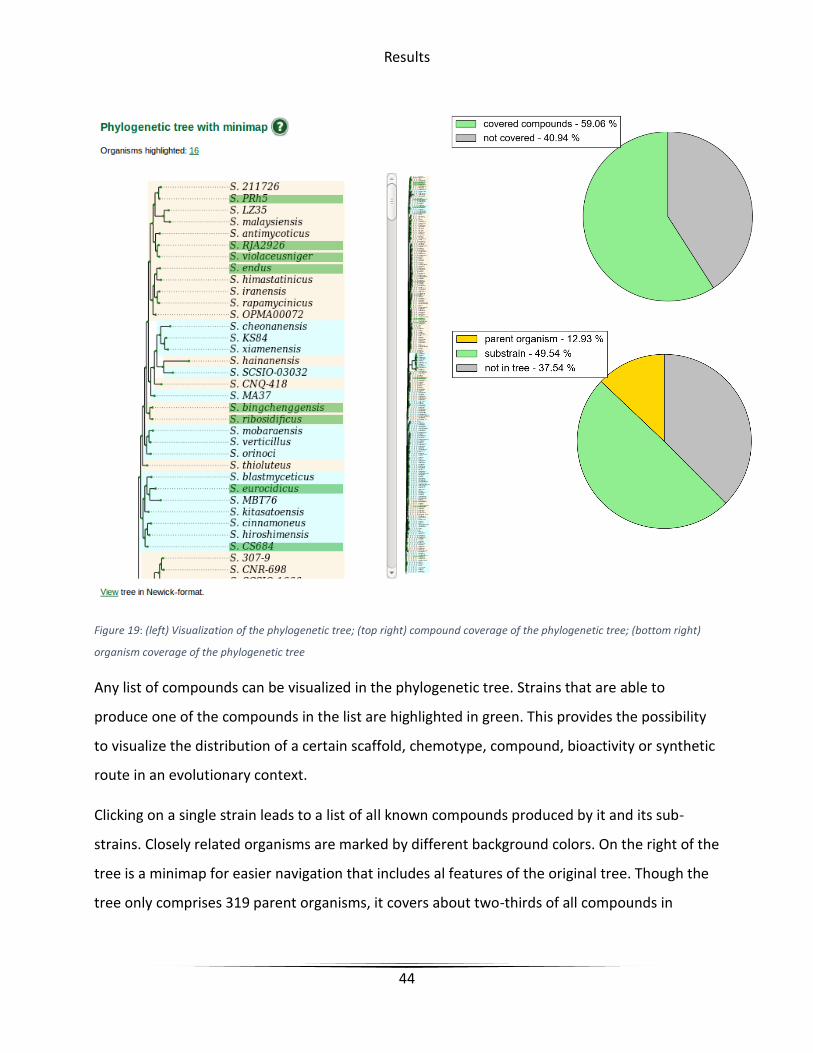
Figure 19: (left) Visualization of the phylogenetic tree; (top right) compound coverage of the phylogenetic tree; (bottom right)
organism coverage of the phylogenetic tree
Any list of compounds can be visualized in the phylogenetic tree. Strains that are able to
produce one of the compounds in the list are highlighted in green. This provides the possibility
to visualize the distribution of a certain scaffold, chemotype, compound, bioactivity or synthetic
route in an evolutionary context.
Clicking on a single strain leads to a list of all known compounds produced by it and its sub-
strains. Closely related organisms are marked by different background colors. On the right of the
tree is a minimap for easier navigation that includes al features of the original tree. Though the
tree only comprises 319 parent organisms, it covers about two-thirds of all compounds in

Results
45
StreptomeDB. For a more detailed analysis, the whole tree is also available for download in
Newick-format.
5.3.1 NMR and MS prediction
Figure 20: Visualization of predicted mass fragmentation products
MS fragments were predicted with CFM-ID (84). The predicted MS-spectra are visualized in the
compounds cards of the corresponding compounds. The five most common masses are shown
with the predicted structure for each fragmentation energy level.
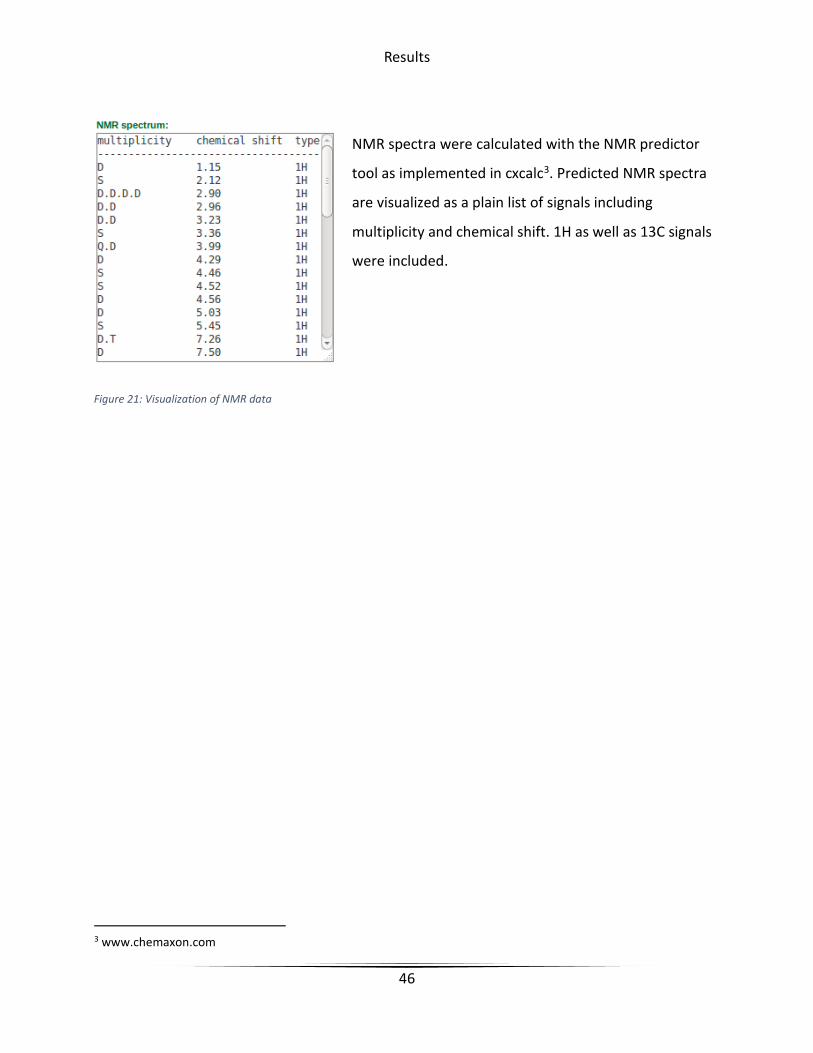
Results
46
NMR spectra were calculated with the NMR predictor
tool as implemented in cxcalc3. Predicted NMR spectra
are visualized as a plain list of signals including
multiplicity and chemical shift. 1H as well as 13C signals
were included.
3 www.chemaxon.com
Figure 21: Visualization of NMR data

Results
47
5.3.2 Scaffold browser
Figure 22: Screenshot of scaffold browser of StreptomeDB
The scaffolds were generated by means of their scaffold framework by Xavier Lucas (85). The
scaffold navigation system was implemented as a clickable map of scaffold pictures. The
scaffolds are organized in levels, where each level represents the number of rings or ring
systems that are attached by aliphatic bridges or heteroatoms. It is possible to choose a number
of scaffolds of interest and jump to different scaffold levels. The number of compounds
including the chosen scaffolds is calculated live and a list of these compounds can be opened
any time.

Results
48
Table 4: Number of scaffolds per scaffold-level
Lvl 0 1 2 3 4 5 6 7 8 9
No. of
scaffolds
1,032 732 672 559 469 314 213 137 96 91

Results
49
5.4 bldA function in Streptomyces calvus
As shown in chapter 2.2, bldA plays an important role in the morphological differentiation and
induction of secondary metabolism. To study the effect of bldA, Stefanie Hackl complemented a
functional bldA gene in Streptomyces calvus. As a dualomic approach, gene expression and
proteomic data were collected for both strains in late stationary phase after 48h of cultivation
at 28 °C in SG+ liquid medium. The main aim was to analyze the pleiotropic effect of bldA on the
transcriptional and posttranslational stage of expression. The manuscript of this project is
currently in preparation.
5.4.1 Metabolic model
The genome-scale metabolic model was generated from a whole genome sequence of
Streptomyces calvus with the services provided by ModelSeed followed by careful manual
revision (33). It consists of 1,659 reactions and 1,589 metabolites, which are annotated to
1,533 genes from primary metabolism and was generated in SBML format. Due to its automated
reconstruction, it includes mainly genes form primary metabolism. Genes belonging to rare
pathways, like Annimycin and Nucleocidin synthesis, were included manually.
A reaction encoding the synthesis of Nucleocidin was reconstructed based on the work of Zhu et
al.:
Adenosine + Fluoride + PAPS + NAD + amino acid → PAP + α-Ketoacid + NADH + Nucleocidin
(86).
Though the biosynthesis of this compound is not yet fully resolved, the fluorination mechanism
was assumed to be a SN-type reaction where a proton and two electrons are abstracted NAD
dependently. The amino acid used by the aminotransferase is also not yet identified. Therefore,
the reaction was designed for all amino acids that are available in the model and whose
respective products can be processed without adding additional reactions.
Results
50
A reaction encoding the biosynthesis of Annimycin was reconstructed based on the work of
Kalan et al.:
Succinyl-CoA + Glycin + 5 NADPH + 2 ATP + Propionyl-CoA + Metylmalonyl-CoA + 4 Malonyl-CoA
→ 4 H2O + 5 NADP + 6 CO2 + HSCoA + 2 AMP + 2 PPi + Annimycin
Both synthesis pathways were reconstructed as single reactions and added to the model,
including an exchange reacting to boundary condition.
5.4.2 Gene expression
The transcription of 6,862 genes in S. calvus could be measured by next generation sequencing.
The data of the strain with the complemented bldA gene had a fivefold less read coverage and
strong forward strand bias that made rather strong normalization necessary. This, together with
the absence of replicates made a significance test based filtering not suitable. Alternatively, the
data was filtered by fold change and with the help of predicted subsets from the genome-scale
metabolic model.
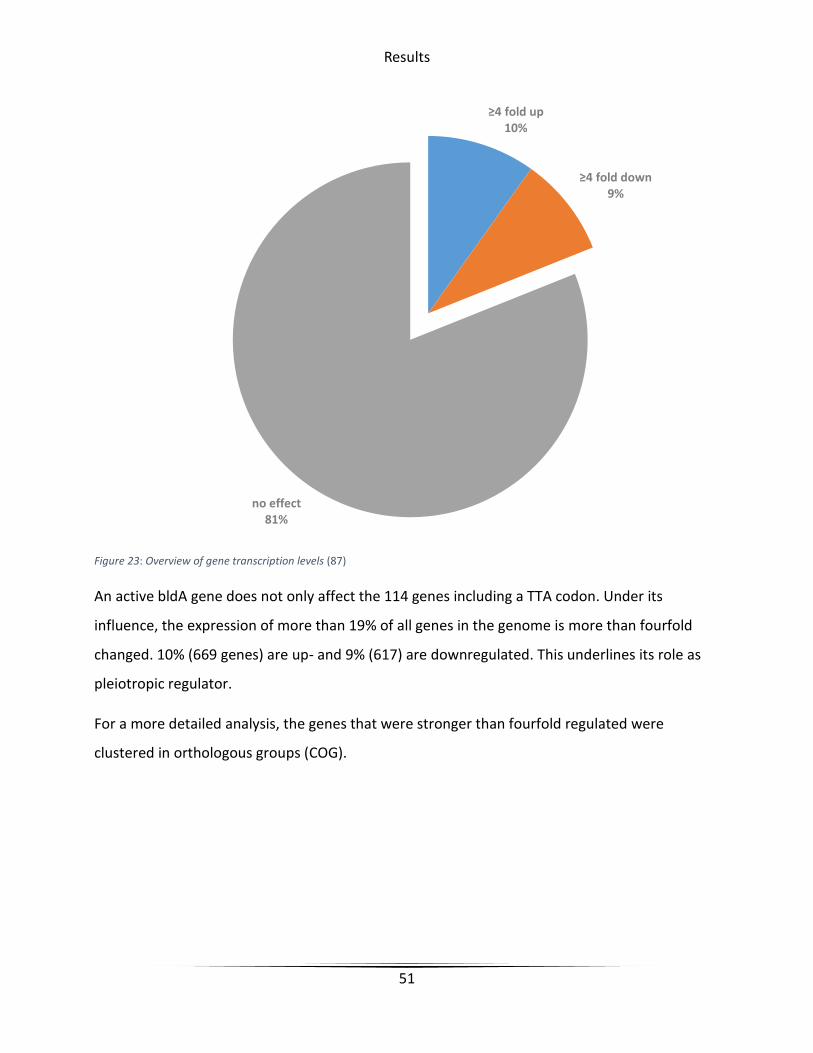
Results
51
Figure 23: Overview of gene transcription levels (87)
An active bldA gene does not only affect the 114 genes including a TTA codon. Under its
influence, the expression of more than 19% of all genes in the genome is more than fourfold
changed. 10% (669 genes) are up- and 9% (617) are downregulated. This underlines its role as
pleiotropic regulator.
For a more detailed analysis, the genes that were stronger than fourfold regulated were
clustered in orthologous groups (COG).
≥4 fold up10%
≥4 fold down9%
no effect81%

Results
52
Figure 24: Gene regulation in COGs (87)
The groups “cell cycle control”, “cell wall, membrane and envelope biogenesis”, “signal
transduction”, and “replication and repair” are predominantly upregulated. It is probable that
they are related to the incipient sporulation.
From most groups from primary metabolism, the majority of genes is downregulated. This
effect can be observed most strongly for carbohydrate metabolism, presumably as a reaction to
the decreasing sugar concentration in the nutrient medium after 48 h. In addition, amino acid
production, energy production and conversion, lipid metabolism, and nucleotide metabolism
are mainly downregulated. Surprisingly, in this overview a bigger portion of genes from
0
20
40
60
80
100
120
Gen
enu
mb
ero
fC
OG
Cat
ego
ries
Upregulated bldA Downregulated bldA

Results
53
secondary metabolism is downregulated. However, this only includes 33 genes and the majority
of secondary metabolite genes is not represented in this analysis. All 12 genes from Annimycin
and all 36 genes from Nucleocidin cluster are strongly up and all 20 genes from WS9326A
cluster are strongly down regulated. This is also consistent with the phenotypical observations.
Besides Nucleocidin, Annimycin, and WS9326A cluster, no other secondary metabolite gene
cluster seems to be explicitly regulated by the presence of bldA. It can also be seen, that the
presence of a TTA codon does not necessarily lead to an increased transcription when bldA is
expressed. Nucleocidin cluster contain several TTA codons, but Annimycin cluster does not
contain any. They show the highest density in the subtelomeric regions, but are also present in
the whole core region of the genome.

Results
54
Figure 25: Overview of transcriptomic and proteomic data: (A) secondary gene cluster predicted by antiSMASH; (B) location of
TTA codons; (C) gene expression levels, more than two fold upregulated genes with active bldA are highlighted in blue, more than
two fold downregulated ones in orange; (D) overproduced proteins, (red) primary metabolism, (blue) transcriptional and
translational regulators, (yellow) peptidases; the links in the meddle lead from Annimycin (blue), Nucleocidin (orange) and
WS9326A (grey) cluster to found overproduced proteins that are needed for their production
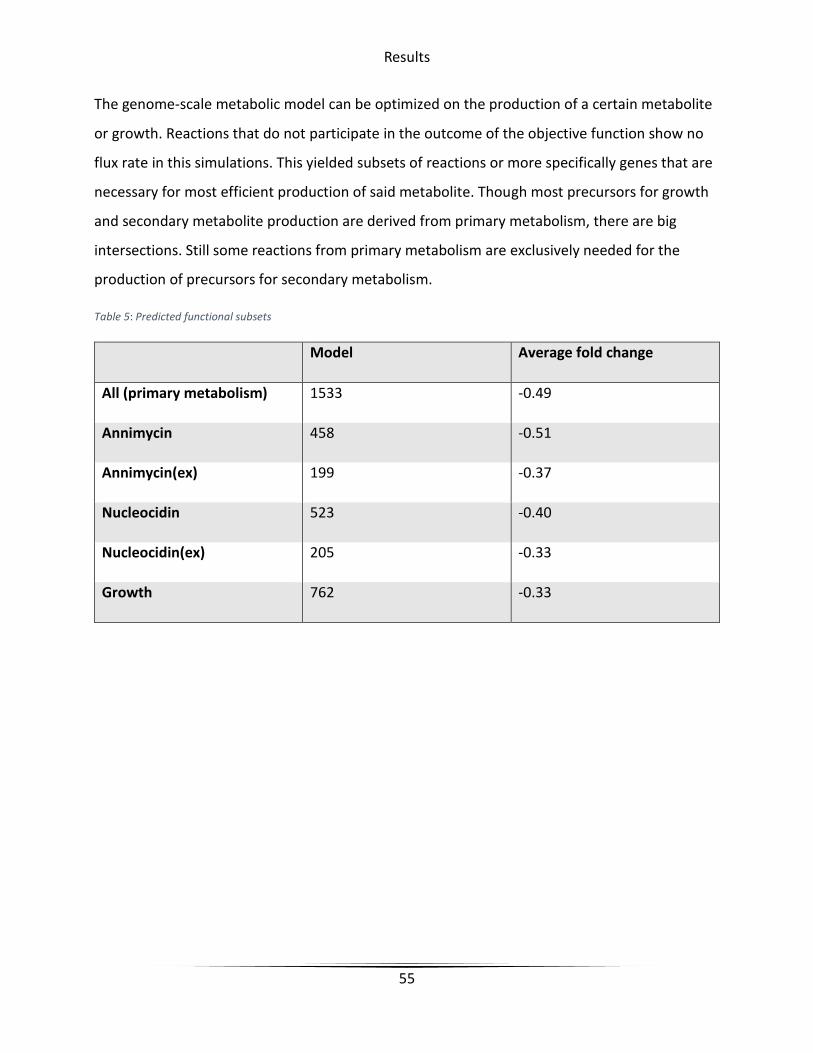
Results
55
The genome-scale metabolic model can be optimized on the production of a certain metabolite
or growth. Reactions that do not participate in the outcome of the objective function show no
flux rate in this simulations. This yielded subsets of reactions or more specifically genes that are
necessary for most efficient production of said metabolite. Though most precursors for growth
and secondary metabolite production are derived from primary metabolism, there are big
intersections. Still some reactions from primary metabolism are exclusively needed for the
production of precursors for secondary metabolism.
Table 5: Predicted functional subsets
Model Average fold change
All (primary metabolism) 1533 -0.49
Annimycin 458 -0.51
Annimycin(ex) 199 -0.37
Nucleocidin 523 -0.40
Nucleocidin(ex) 205 -0.33
Growth 762 -0.33

Results
56
Nucleocidin production, for which in total 523 reactions are needed for maximal production
possible in this network, can utilize
205 reactions that are not needed for
optimal growth. Annimycin
production can be supported by
458 reactions of which 199 are not
strictly needed for growth. The
762 reactions annotated to biomass
generation are in this case not the
minimal set of essential reactions, but
the reactions that allow for optimal
growth speed. The average fold
change of genes in these subgroups
does not significantly differ from the average of all genes that are annotated in the model. Also
the density of different fold changes within the subgroups is similar normal distributed. The fold
changes in all subgroups range from -10 to 10. Surprisingly, the genes that are exclusively
needed for the generation of Nucleocidin and Annimycin have the highest ratio of genes that
are not differentially regulated with functional bldA.
Figure 26: Fold change density in subsystems

Results
57
Figure 27: Overview of genes in predicted subsystems: (top left) all upregulated; (top right) all more than two fold upregulated;
(bottom left) all downregulated; (bottom right) all more than two fold down regulated
The ratio of genes in the different subsets did not significantly differ when filtered for up and
down regulated genes, no matter if they were additionally filtered by fold change or not. These
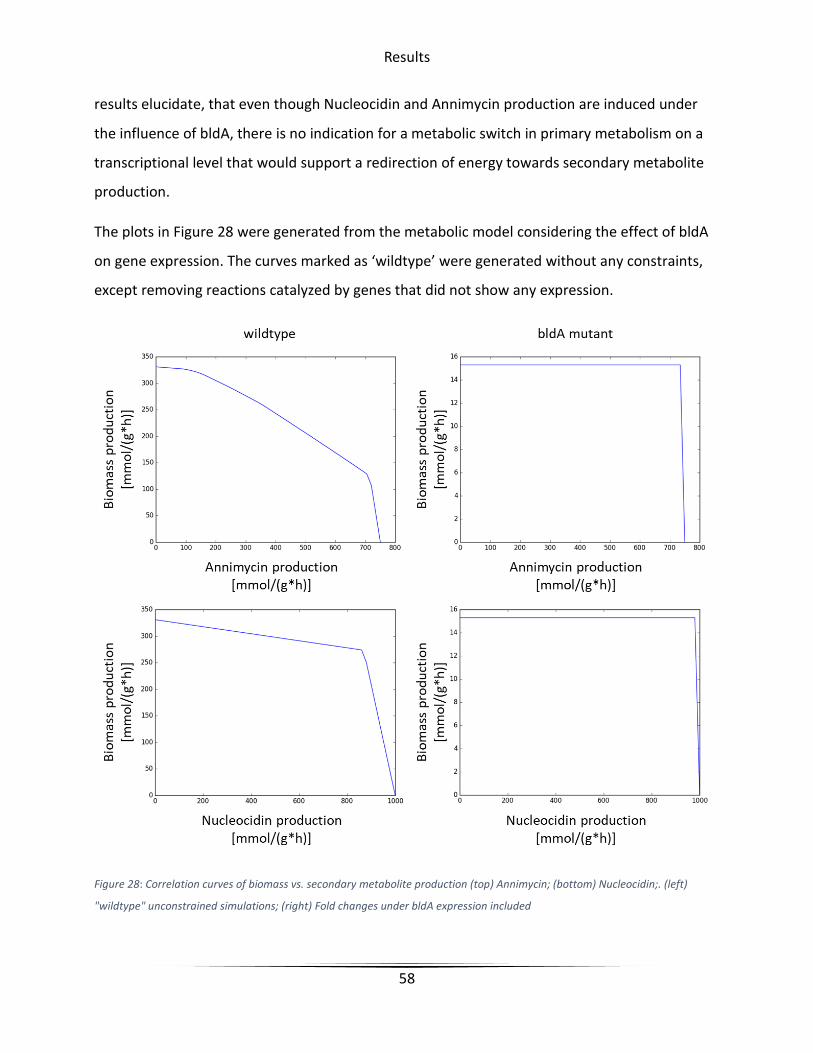
Results
58
results elucidate, that even though Nucleocidin and Annimycin production are induced under
the influence of bldA, there is no indication for a metabolic switch in primary metabolism on a
transcriptional level that would support a redirection of energy towards secondary metabolite
production.
The plots in Figure 28 were generated from the metabolic model considering the effect of bldA
on gene expression. The curves marked as ‘wildtype’ were generated without any constraints,
except removing reactions catalyzed by genes that did not show any expression.
Figure 28: Correlation curves of biomass vs. secondary metabolite production (top) Annimycin; (bottom) Nucleocidin;. (left)
"wildtype" unconstrained simulations; (right) Fold changes under bldA expression included

Results
59
For the simulations of the influence of bldA, the fold changes of strongly regulated genes
(|log2(fc)| > 2) were used to adjust the boundary values of reactions corresponding to the
calculated flux rates from the wildtype simulation. This was done for the correlation of biomass
and Nucleocidin as well as for biomass and Annimycin production. In both cases, the
correlations plots show a strongly decreased maximal biomass production rate, but also an
increased relative area under the curve (AUC) compared to the unconstrained wildtype
simulation. These plots have been calculated according to chapter 0.
Table 6: Key values from correlation plots of bldA effect on energy distribution. All units except AUC are in [mmol/(g*h)]
Max Biomass Min Biomass Max production AUC [%]
WT Annimycin 330.9 0.0 750.0 85.2
bldA Annimycin 15.3 0.0 750.0 99.6
WT Nucleocidin 330.9 0.0 1000.0 92.1
bldA Nucleocidin 15.3 0.0 1000.0 98.5
In both cases, the inclusion of gene expression data lead to a strong decrease of growth rate
without impairing the maximal production value of the respective secondary metabolite. The
relative AUC values are in both cases increased under the influence of bldA.
A thorough analysis showed that the reactions rxn00102 (KEGG reaction R10092), rxn00898
(KEGG reaction R01209), rxn03437 (KEGG reaction R05070) and rxn01015 (KEGG reaction
R01394) were mainly responsible for this result. Rxn01015 had by far the strongest effect and
can be annotated to a single essential gene: SCLAV_01143, a hydroxypyruvate isomerase (EC
5.3.1.22). It is catalyzing the reaction from hydroxypyruvate to 2-hydroxy-3-oxopropanoate.

Results
60
Figure 29: Glyoxylate and Dicarboxylate metabolism from KEGG. Reaction catalyzed by hydroxypyruvate isomerase is marked.
Figure 30: Hydroxypyruvate isomerase reaction overview from KEGG (31)
By splitting up the condensed biomass reaction in the model, it could be shown that this
reaction plays an important role in the precursor supply of folate metabolism, which is needed
for the synthesis of RNA and DNA (88).

Results
61
5.4.3 Protein production
Proteomic data was limited to the intracellular fraction within a pH range of 4 to 7 and protein
masses between 6.5 and 112.0 kDa. The proteins were collected under the same conditions as
the transcriptomic data. 34 protein spots on a 2D gel could be identified to be overproduced
under the influence of bldA.
Table 7: Overproduced proteins with active bldA in Streptomyces calvus (complemented from (87))
Spot
number
S. calvus
Amino
acids
Predicted
function
Homologue,
origin
Identity
[%]
Accession Fold[a]
change
mRNA
Subsystem
Central carbon metabolism
9 SCALV05263
507 MULTISPECIES: glucose-6-phosphate dehydrogenase
Streptomyces 98/99
WP_030820913.1
1.0 A, N, G
17 SCALV06768
331 glyceraldehyde-3-phosphate dehydrogenase
S. longwoodensis
92/96 KUN40924.1|
3.6 A, N
21 SCALV00992
281 inositol monophosphatase
S. ghanaensis 87/93 WP_004981222.1
0.9 -
22 SCALV05543
228 phosphoglycerate mutase
Streptomyces sp. MMG1533
95/97 WP_053752811.1
0.6 -
Aamino acid metabolism
5 SCALV02968
617 dihydroxy-acid dehydratase
S. aureofaciens
97/98 WP_052843504.1
0.5 N, G
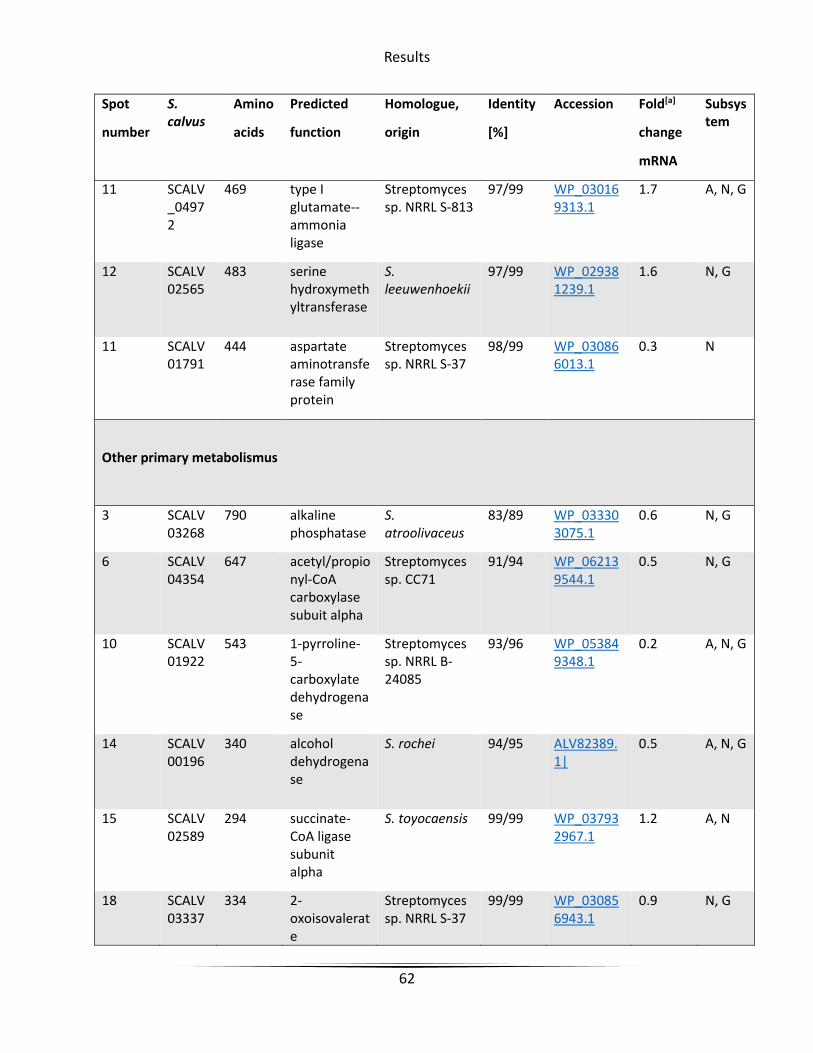
Results
62
Spot
number
S. calvus
Amino
acids
Predicted
function
Homologue,
origin
Identity
[%]
Accession Fold[a]
change
mRNA
Subsystem
11 SCALV_04972
469 type I glutamate--ammonia ligase
Streptomyces sp. NRRL S-813
97/99 WP_030169313.1
1.7 A, N, G
12 SCALV02565
483 serine hydroxymethyltransferase
S. leeuwenhoekii
97/99 WP_029381239.1
1.6 N, G
11 SCALV01791
444 aspartate aminotransferase family protein
Streptomyces sp. NRRL S-37
98/99 WP_030866013.1
0.3 N
Other primary metabolismus
3 SCALV03268
790 alkaline phosphatase
S. atroolivaceus
83/89 WP_033303075.1
0.6 N, G
6 SCALV04354
647 acetyl/propionyl-CoA carboxylase subuit alpha
Streptomyces sp. CC71
91/94 WP_062139544.1
0.5 N, G
10 SCALV01922
543 1-pyrroline-5-carboxylate dehydrogenase
Streptomyces sp. NRRL B-24085
93/96 WP_053849348.1
0.2 A, N, G
14 SCALV00196
340 alcohol dehydrogenase
S. rochei 94/95 ALV82389.1|
0.5 A, N, G
15 SCALV02589
294 succinate-CoA ligase subunit alpha
S. toyocaensis 99/99 WP_037932967.1
1.2 A, N
18 SCALV03337
334 2-oxoisovalerate
Streptomyces sp. NRRL S-37
99/99 WP_030856943.1
0.9 N, G

Results
63
Spot
number
S. calvus
Amino
acids
Predicted
function
Homologue,
origin
Identity
[%]
Accession Fold[a]
change
mRNA
Subsystem
dehydrogenase
23 SCALV02628
374 guanosine monophosphate reductase
S. toyocaensis 98/99 WP_037939546.1
0.6 N
26 SCALV05618
286 3-hydroxybutyryl-CoA dehydrogenase
Streptomyces sp. NRRL WC-3626
98/98 WP_030225233.1
0.6 A, N
27 SCALV00211
879 bifunctional acetaldehyde-CoA/alcohol dehydrogenase
Streptomyces sp. CCM_MD2014
95/97 WP_061441054.1
0.6 A, N, G
30 SCALV03565
355 phosphoribosylformylglycinamidine cyclo-ligase
Streptomyces sp. NRRL S-37
97/98 WP_030872125.1
2.9 -
32 SCALV02925
331 delta-aminolevulinic acid dehydratase
S. griseoflavus 97/98 WP_004927902.1
1.2 N, G
33 SCALV02590
392 succinate-CoA ligase subunit beta
S. toyocaensis 98/99 WP_037932970.1
1.3 A, N
Proteases
1 SCALV04494
1100 serine protease
S. griseoflavus 89/94 WP_004931316.1
0.03 -

Results
64
Spot
number
S. calvus
Amino
acids
Predicted
function
Homologue,
origin
Identity
[%]
Accession Fold[a]
change
mRNA
Subsystem
2 SCALV04598
1085 peptidase S41
S. ghanaensis 94/96 WP_004988295.1
2.0 -
16 SCALV00605
476 peptidase S8 S. viridosporus 88/92 WP_016823609.1
1.3 -
31 SCALV04617
360 peptidase M4
S. griseoflavus 94/96 WP_004931533.1
8.6 -
Secondary Metabolism
25 SCALV00122
273 5'-methylthioadenosine phosphorylase
Kitasatospora griseola
70/77 WP_043915700.1
151.4 N
Transcription
20 SCALV02194
468 Crp/Fnr family transcriptional regulator
Streptomyces sp. XY152
97/98 WP_053637103.1
3.6 -
28 SCALV01290
429 AraC family transcriptional regulator
S. albulus ZPM 58/69 AKA07479.1
6.9 -
Translation
4 SCALV01772
566 proline--tRNA ligase
Streptomyces sp. NRRL WC-3626
93/97 WP_030216781.1
1.2 -
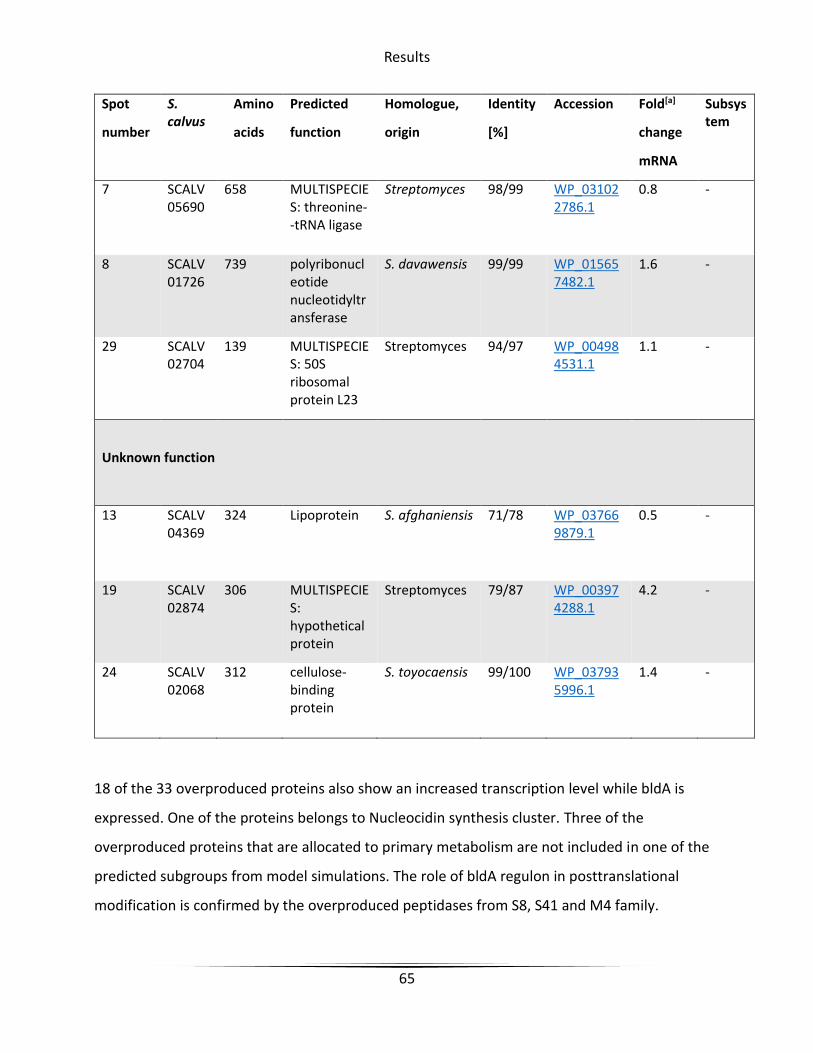
Results
65
Spot
number
S. calvus
Amino
acids
Predicted
function
Homologue,
origin
Identity
[%]
Accession Fold[a]
change
mRNA
Subsystem
7 SCALV05690
658 MULTISPECIES: threonine--tRNA ligase
Streptomyces 98/99 WP_031022786.1
0.8 -
8 SCALV01726
739 polyribonucleotide nucleotidyltransferase
S. davawensis 99/99 WP_015657482.1
1.6 -
29 SCALV02704
139 MULTISPECIES: 50S ribosomal protein L23
Streptomyces 94/97 WP_004984531.1
1.1 -
Unknown function
13 SCALV04369
324 Lipoprotein S. afghaniensis 71/78 WP_037669879.1
0.5 -
19 SCALV02874
306 MULTISPECIES: hypothetical protein
Streptomyces 79/87 WP_003974288.1
4.2 -
24 SCALV02068
312 cellulose-binding protein
S. toyocaensis 99/100 WP_037935996.1
1.4 -
18 of the 33 overproduced proteins also show an increased transcription level while bldA is
expressed. One of the proteins belongs to Nucleocidin synthesis cluster. Three of the
overproduced proteins that are allocated to primary metabolism are not included in one of the
predicted subgroups from model simulations. The role of bldA regulon in posttranslational
modification is confirmed by the overproduced peptidases from S8, S41 and M4 family.

Results
66
Figure 31: Overview of proteins related to primary metabolism organized by predicted functional subsets
Analyzing the overproduced proteins from primary metabolism shows a different picture as
results from gene expression. All of them can be allocated to the production of Nucleocidin.
17% are exclusively need for Nucleocidin production. 61% are intersecting with Biomass
production, 50% are intersecting with Annimycin production, and about 50% of Annimycin and
Biomass production are intersecting themselves. This includes proteins that catalyze central
reactions from carbohydrate and amino acid metabolism, but also rather unspecific enzymes
such as alcohol dehydrogenases. This indicates in contrast to results from transcriptomic
analysis, that under the influence of bldA the protein machinery is optimized towards the
production of Nucleocidin. Manipulating the constraints of reactions catalyzed by the
overproduced proteins did not lead to significant outcome.
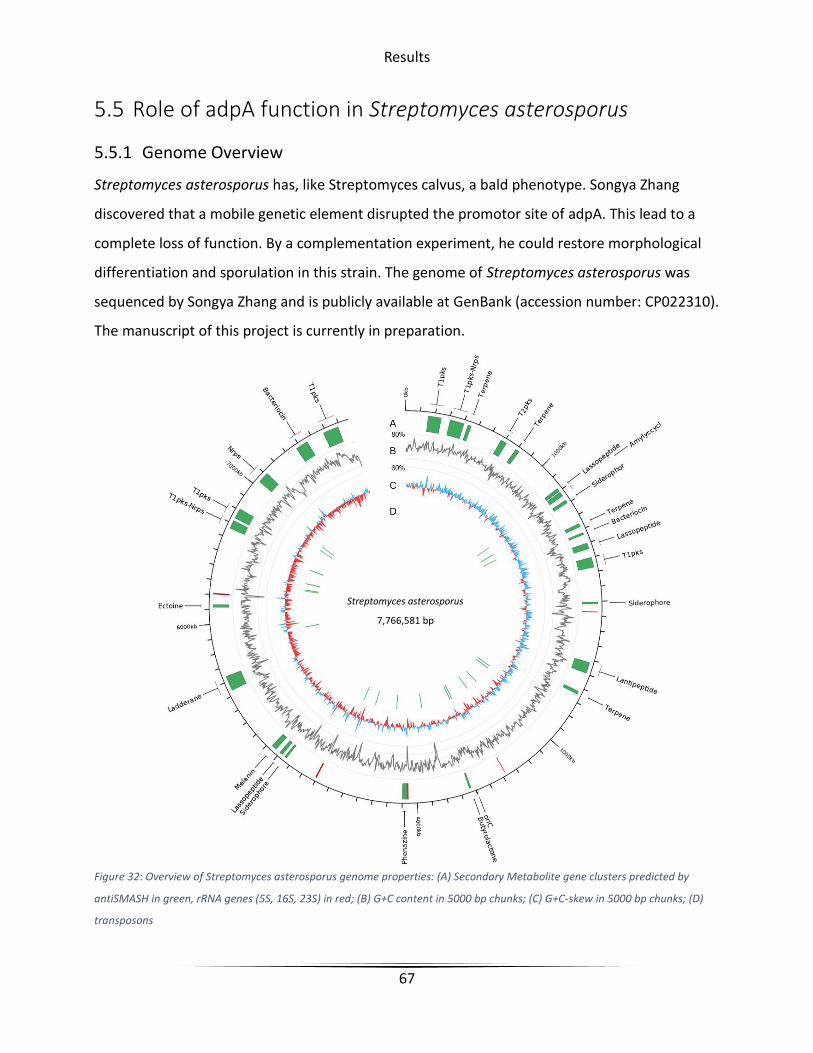
Results
67
5.5 Role of adpA function in Streptomyces asterosporus
5.5.1 Genome Overview
Streptomyces asterosporus has, like Streptomyces calvus, a bald phenotype. Songya Zhang
discovered that a mobile genetic element disrupted the promotor site of adpA. This lead to a
complete loss of function. By a complementation experiment, he could restore morphological
differentiation and sporulation in this strain. The genome of Streptomyces asterosporus was
sequenced by Songya Zhang and is publicly available at GenBank (accession number: CP022310).
The manuscript of this project is currently in preparation.
Figure 32: Overview of Streptomyces asterosporus genome properties: (A) Secondary Metabolite gene clusters predicted by
antiSMASH in green, rRNA genes (5S, 16S, 23S) in red; (B) G+C content in 5000 bp chunks; (C) G+C-skew in 5000 bp chunks; (D)
transposons
Streptomyces asterosporus
7,766,581 bp
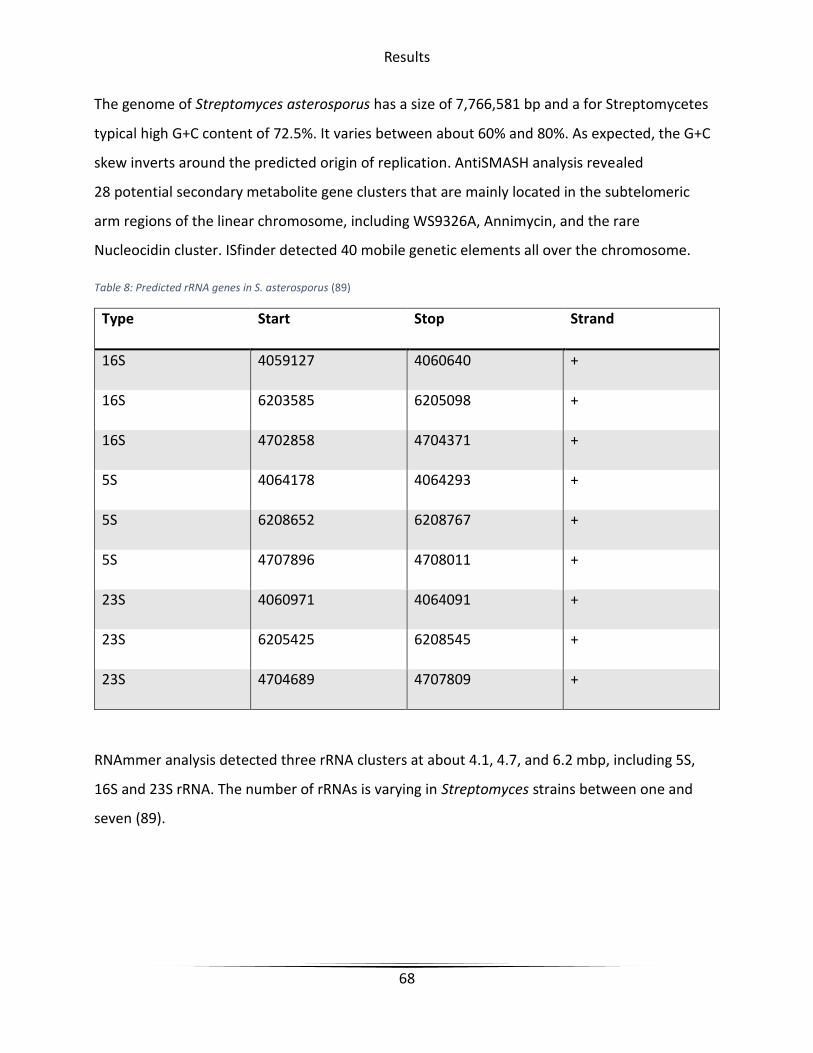
Results
68
The genome of Streptomyces asterosporus has a size of 7,766,581 bp and a for Streptomycetes
typical high G+C content of 72.5%. It varies between about 60% and 80%. As expected, the G+C
skew inverts around the predicted origin of replication. AntiSMASH analysis revealed
28 potential secondary metabolite gene clusters that are mainly located in the subtelomeric
arm regions of the linear chromosome, including WS9326A, Annimycin, and the rare
Nucleocidin cluster. ISfinder detected 40 mobile genetic elements all over the chromosome.
Table 8: Predicted rRNA genes in S. asterosporus (89)
Type Start Stop Strand
16S 4059127 4060640 +
16S 6203585 6205098 +
16S 4702858 4704371 +
5S 4064178 4064293 +
5S 6208652 6208767 +
5S 4707896 4708011 +
23S 4060971 4064091 +
23S 6205425 6208545 +
23S 4704689 4707809 +
RNAmmer analysis detected three rRNA clusters at about 4.1, 4.7, and 6.2 mbp, including 5S,
16S and 23S rRNA. The number of rRNAs is varying in Streptomyces strains between one and
seven (89).

Results
69
Figure 33: Dotplot of Nucleocidin cluster in S. calvus and S. asterosporus (74)
Comparison of the Nucleocidin gene cluster in S. calvus and S. asterosporus showed a high
similarity of over 99%. However, Nucleocidin production could not be detected in S.
asterosporus, even with functional adpA gene.

Results
70
Figure 34: Phylogenetic tree based on 16S rRNA
Phylogenetic analysis of 16S rRNA showed a close relationship between S. asterosporus, S. albus
and S. coelicolor. The resolution of this approach was not big enough to show a difference
between S. asterosporus and S. calvus.
5.5.2 Putative disrupted genes
Table 9: Mobile genetic elements in S. asterosporus predicted by ISfinder (70)
ID Type Start Stop Frame Strand Lenght
fig|285570.5.peg.1032 CDS 1235325 1236185 3 + 861
fig|285570.5.peg.1126 CDS 1339922 1340884 2 + 963
fig|285570.5.peg.1195 CDS 1416513 1417373 3 + 861
fig|285570.5.peg.1601 CDS 1956404 1956829 2 + 426
fig|285570.5.peg.1602 CDS 1956913 1957314 1 + 402
fig|285570.5.peg.2155 CDS 2611844 2612863 2 + 1020
fig|285570.5.peg.2200 CDS 2655416 2655961 2 + 546
fig|285570.5.peg.2361 CDS 2833284 2832322 -3 - 963
fig|285570.5.peg.2395 CDS 2867522 2868484 2 + 963
fig|285570.5.peg.2586 CDS 3093068 3092208 -2 - 861
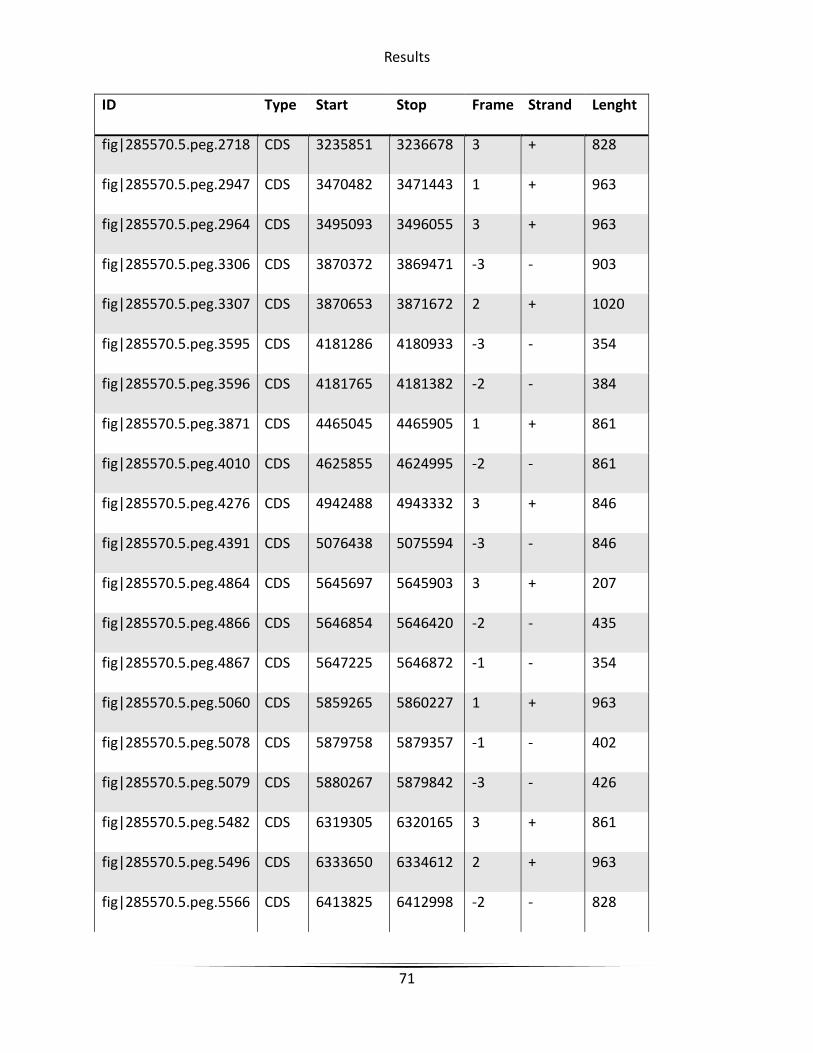
Results
71
ID Type Start Stop Frame Strand Lenght
fig|285570.5.peg.2718 CDS 3235851 3236678 3 + 828
fig|285570.5.peg.2947 CDS 3470482 3471443 1 + 963
fig|285570.5.peg.2964 CDS 3495093 3496055 3 + 963
fig|285570.5.peg.3306 CDS 3870372 3869471 -3 - 903
fig|285570.5.peg.3307 CDS 3870653 3871672 2 + 1020
fig|285570.5.peg.3595 CDS 4181286 4180933 -3 - 354
fig|285570.5.peg.3596 CDS 4181765 4181382 -2 - 384
fig|285570.5.peg.3871 CDS 4465045 4465905 1 + 861
fig|285570.5.peg.4010 CDS 4625855 4624995 -2 - 861
fig|285570.5.peg.4276 CDS 4942488 4943332 3 + 846
fig|285570.5.peg.4391 CDS 5076438 5075594 -3 - 846
fig|285570.5.peg.4864 CDS 5645697 5645903 3 + 207
fig|285570.5.peg.4866 CDS 5646854 5646420 -2 - 435
fig|285570.5.peg.4867 CDS 5647225 5646872 -1 - 354
fig|285570.5.peg.5060 CDS 5859265 5860227 1 + 963
fig|285570.5.peg.5078 CDS 5879758 5879357 -1 - 402
fig|285570.5.peg.5079 CDS 5880267 5879842 -3 - 426
fig|285570.5.peg.5482 CDS 6319305 6320165 3 + 861
fig|285570.5.peg.5496 CDS 6333650 6334612 2 + 963
fig|285570.5.peg.5566 CDS 6413825 6412998 -2 - 828

Results
72
ID Type Start Stop Frame Strand Lenght
fig|285570.5.peg.5568 CDS 6414172 6415134 1 + 963
fig|285570.5.peg.5736 CDS 6592778 6593740 2 + 963
fig|285570.5.peg.5967 CDS 6874932 6874384 -3 - 549
fig|285570.5.peg.5970 CDS 6876516 6877471 3 + 957
fig|285570.5.peg.6011 CDS 6923918 6923058 -2 - 861
fig|285570.5.peg.6133 CDS 7050344 7049853 -2 - 492
fig|285570.5.peg.6260 CDS 7195642 7195241 -1 - 402
fig|285570.5.peg.6261 CDS 7196151 7195726 -3 - 426
fig|285570.5.peg.6272 CDS 7212914 7212159 -2 - 756
fig|285570.5.peg.6684 CDS 7757712 7758642 3 + 927
The Analysis of the bordering regions of the transposons showed, that they did not split any
genes. Only three genes are located in such close neighborhood that their promoter region may
have been disturbed: The transcriptional regulator YdeE, a Tagatose-6-phosphat kinase and a
zinc carboxypeptidase.
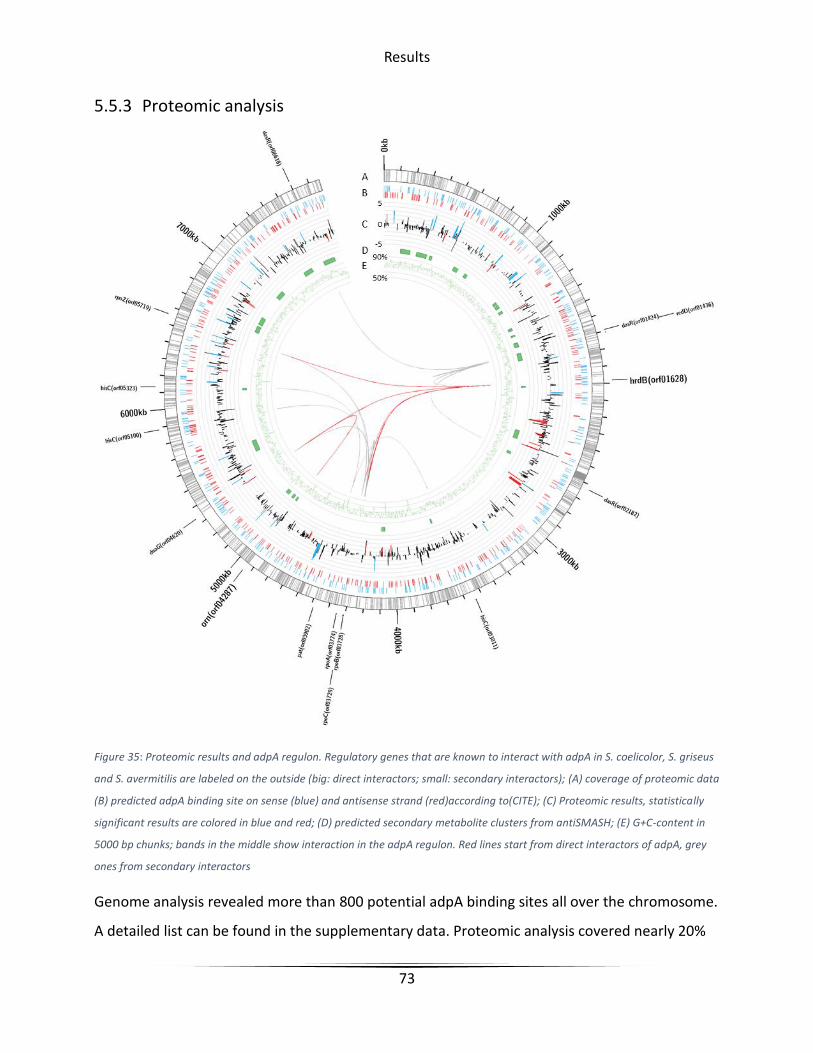
Results
73
5.5.3 Proteomic analysis
Figure 35: Proteomic results and adpA regulon. Regulatory genes that are known to interact with adpA in S. coelicolor, S. griseus
and S. avermitilis are labeled on the outside (big: direct interactors; small: secondary interactors); (A) coverage of proteomic data
(B) predicted adpA binding site on sense (blue) and antisense strand (red)according to(CITE); (C) Proteomic results, statistically
significant results are colored in blue and red; (D) predicted secondary metabolite clusters from antiSMASH; (E) G+C-content in
5000 bp chunks; bands in the middle show interaction in the adpA regulon. Red lines start from direct interactors of adpA, grey
ones from secondary interactors
Genome analysis revealed more than 800 potential adpA binding sites all over the chromosome.
A detailed list can be found in the supplementary data. Proteomic analysis covered nearly 20%

Results
74
(1260) of all genes, with about 50 proteins, which were expressed differentially under the
influence of a complemented adpA gene. Many of the interactors of adpA reported from S.
griseus and S. coelicolor care also present in S. asterosporus. The manuscript of this project is
currently in preparation.

Results
75
5.6 Enhancement of Griseorhodin A production in Streptomyces
avermitilis SUKA22
5.6.1 Metabolic model
The genome-scale metabolic model was generated from the whole genome sequence of
Streptomyces avermitilis MA-4680 (GenBank ID: 1040) with the services provided by ModelSeed
followed by careful manual revision (33). It includes 1,721 metabolites and 1,635 reactions,
which are annotated to 1,221 genes from primary metabolism. According to the regions
removed during the creation of the SUKA22 strain, reactions catalyzed by the products of genes
from these regions were deleted.
Figure 36: Griseorhodin A synthesis

Results
76
Griseorhodin A synthesis was reconstructed according to the work of Yunt et al. (3). It was
subdivided in five steps in order to be able to analyze the ratio of all produced intermediates
that could be detected experimentally so far. These steps are summarized in the metabolic
model as follows:
1: Acetyl-CoA + 12 Malonyl-CoA Polyketide backbone chain (PKBC) +12 HSCoA + 11 CO2
2: PKBC + 2 NADPH Intermediate 1 + 6 H2O + 2 NADP
3: Intermediate 1 + SAM + 4 O2 + 4 NADPH +2 NAD Collinone + SAH + 4 H2O + 4 NADP + 2
NADH
4: Collinone + 3 FADH + 3 O2 -> Intermediate 2 + 3 FAD + CO2 + 3 H2O
5: Intermediate 2 + FADH + O2 + 2 NADPH -> Griseorhodin A + FAD + CO2 + 2 NADP + H2O
Additionally, an exchange reaction for Griseorhodin A to the boundary condition was added.
5.6.2 Minimal-medium validation experiment
For model validation, a minimal medium composition was generated in silico and tested in vitro.
The formula should consist of one carbon source, two amino acids and a defined inorganic salt
composition. For metal ions are mostly used as co-substrates in transport reactions or as
coordination center in proteins, they are not properly represented in the model. Therefore, an
established salt solution from Hopwood et al. was used (79). Since it has, according to Barton et
al., the highest synthesis cost, tryptophan was chosen as one of the amino acids (90). The
second one used was Lysine. Model simulations predicted a ratio of 16.5/1 (Tryptophan/Lysine)
of optimal growth. Sven Enderle as part of his diploma thesis tested glucose, mannitol, sucrose
and starch as possible carbon sources on solid medium. S. avermitilis, S. avermitilis SUKA22 and
S. avermitilis SUKA22 pMP31 grew well on all different media. All strains grew more densely on
mannitol and starch. Glucose medium showed a yellow discoloration, presumably cause by
products of Maillard reaction that are known to have a negative impact on bacterial growth.
Adding sterile filtered glucose after autoclaving lead to an increased growth rate.
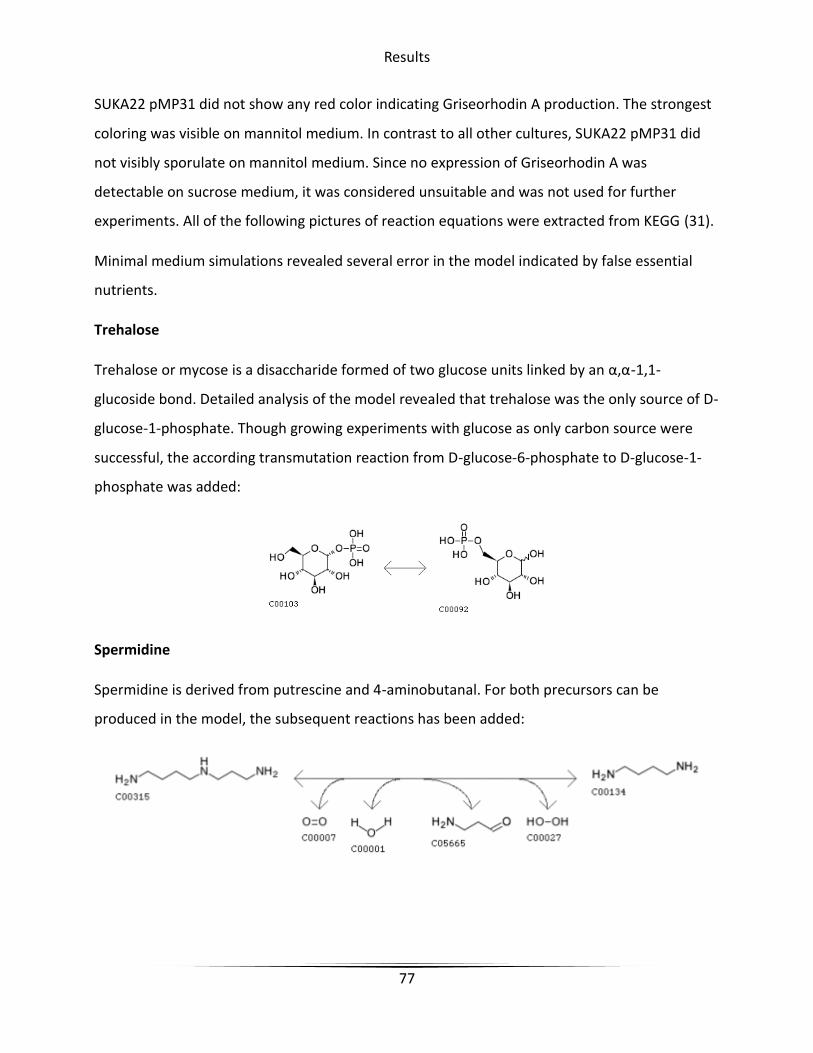
Results
77
SUKA22 pMP31 did not show any red color indicating Griseorhodin A production. The strongest
coloring was visible on mannitol medium. In contrast to all other cultures, SUKA22 pMP31 did
not visibly sporulate on mannitol medium. Since no expression of Griseorhodin A was
detectable on sucrose medium, it was considered unsuitable and was not used for further
experiments. All of the following pictures of reaction equations were extracted from KEGG (31).
Minimal medium simulations revealed several error in the model indicated by false essential
nutrients.
Trehalose
Trehalose or mycose is a disaccharide formed of two glucose units linked by an α,α-1,1-
glucoside bond. Detailed analysis of the model revealed that trehalose was the only source of D-
glucose-1-phosphate. Though growing experiments with glucose as only carbon source were
successful, the according transmutation reaction from D-glucose-6-phosphate to D-glucose-1-
phosphate was added:
Spermidine
Spermidine is derived from putrescine and 4-aminobutanal. For both precursors can be
produced in the model, the subsequent reactions has been added:
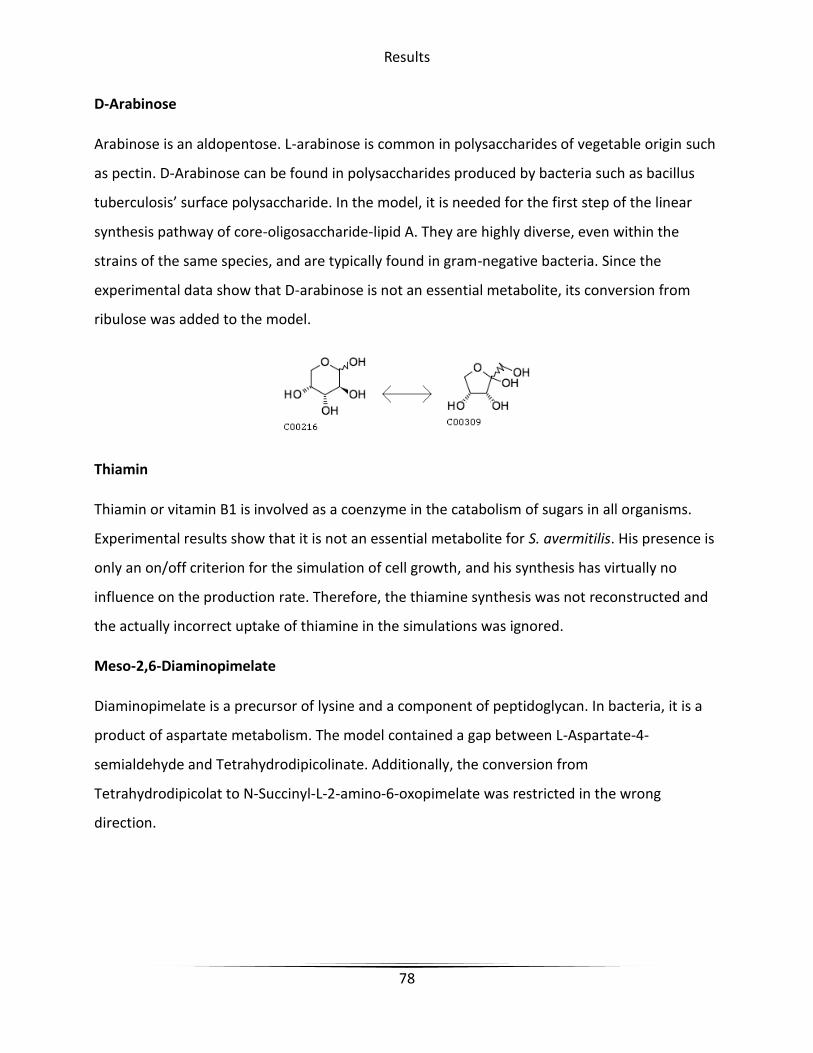
Results
78
D-Arabinose
Arabinose is an aldopentose. L-arabinose is common in polysaccharides of vegetable origin such
as pectin. D-Arabinose can be found in polysaccharides produced by bacteria such as bacillus
tuberculosis’ surface polysaccharide. In the model, it is needed for the first step of the linear
synthesis pathway of core-oligosaccharide-lipid A. They are highly diverse, even within the
strains of the same species, and are typically found in gram-negative bacteria. Since the
experimental data show that D-arabinose is not an essential metabolite, its conversion from
ribulose was added to the model.
Thiamin
Thiamin or vitamin B1 is involved as a coenzyme in the catabolism of sugars in all organisms.
Experimental results show that it is not an essential metabolite for S. avermitilis. His presence is
only an on/off criterion for the simulation of cell growth, and his synthesis has virtually no
influence on the production rate. Therefore, the thiamine synthesis was not reconstructed and
the actually incorrect uptake of thiamine in the simulations was ignored.
Meso-2,6-Diaminopimelate
Diaminopimelate is a precursor of lysine and a component of peptidoglycan. In bacteria, it is a
product of aspartate metabolism. The model contained a gap between L-Aspartate-4-
semialdehyde and Tetrahydrodipicolinate. Additionally, the conversion from
Tetrahydrodipicolat to N-Succinyl-L-2-amino-6-oxopimelate was restricted in the wrong
direction.
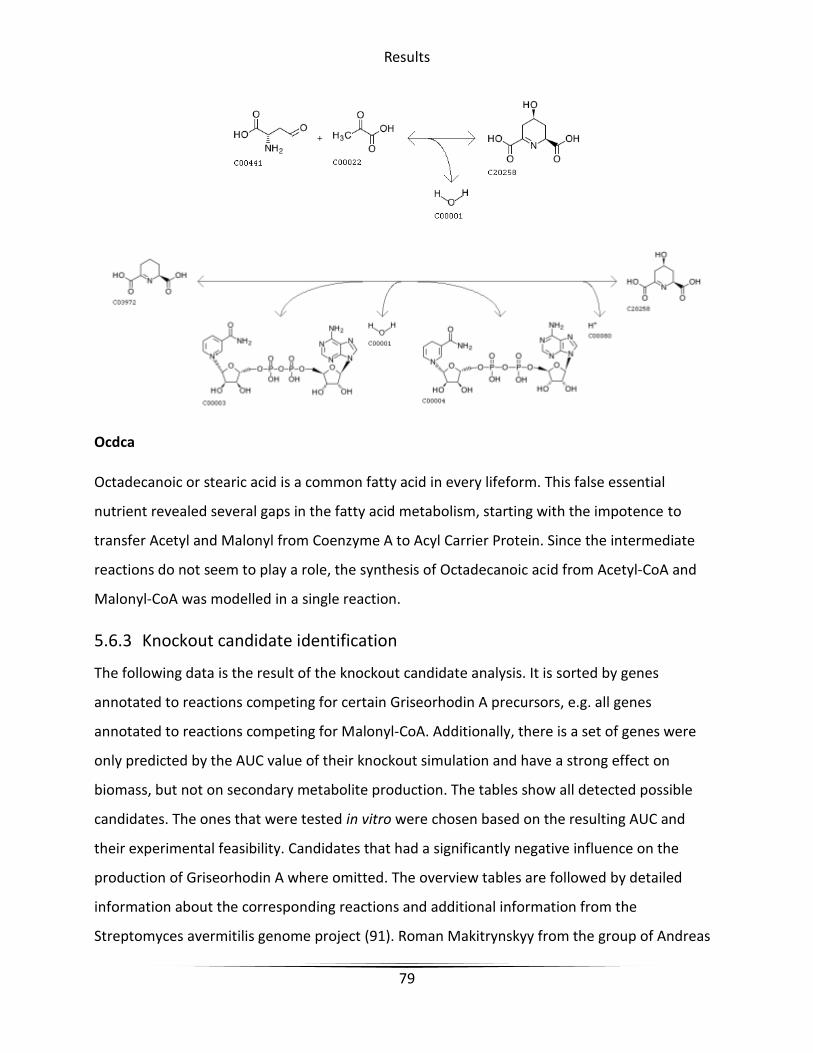
Results
79
Ocdca
Octadecanoic or stearic acid is a common fatty acid in every lifeform. This false essential
nutrient revealed several gaps in the fatty acid metabolism, starting with the impotence to
transfer Acetyl and Malonyl from Coenzyme A to Acyl Carrier Protein. Since the intermediate
reactions do not seem to play a role, the synthesis of Octadecanoic acid from Acetyl-CoA and
Malonyl-CoA was modelled in a single reaction.
5.6.3 Knockout candidate identification
The following data is the result of the knockout candidate analysis. It is sorted by genes
annotated to reactions competing for certain Griseorhodin A precursors, e.g. all genes
annotated to reactions competing for Malonyl-CoA. Additionally, there is a set of genes were
only predicted by the AUC value of their knockout simulation and have a strong effect on
biomass, but not on secondary metabolite production. The tables show all detected possible
candidates. The ones that were tested in vitro were chosen based on the resulting AUC and
their experimental feasibility. Candidates that had a significantly negative influence on the
production of Griseorhodin A where omitted. The overview tables are followed by detailed
information about the corresponding reactions and additional information from the
Streptomyces avermitilis genome project (91). Roman Makitrynskyy from the group of Andreas

Results
80
Bechthold performed the proposed knockouts and cultivated the strains on solid medium. All of
the following reaction equations and pathway maps were extracted from KEGG (31). To the best
of our knowledge, the herein predicted knockouts have not been proposed for the
overproduction of secondary metabolites.
Production simulation in wildtype and engineered organism:
Table 10: Comparison of correlation simulation of Griseorhodin A and biomass production in wildtype and SUKA22. All units are
in [mmol/(g*h)] except area under the curve (AUC) which was calculated according to Chapter 4.3.3.
Model max prod. AUC (abs.) max biomass min biomass AUC [%]
S. avermitilis 76.98 17739.64 233.48 224.17 98.70
S. avermitilis SUKA22 76.97 14952.84 207.05 176.86 93.83
Even though S. avermitilis SUKA22 is known to be faster growing and a more efficient
heterologous producer of secondary metabolites than its wildtype, simulations imply that it is
exactly the other way around. The maximal flux rate of biomass production in the wildtype
model is about 13% higher, and the production of Griseorhodin A has a lower effect on it,
indicated by the higher AUC value. The experimental data on S. avermitilis SUKA22's speed of
growth in comparison to the wild type shows, that this prediction is wrong (2).

Results
81
NADPH:
Table 11: Knockout candidates competing for NADPH. All units are in [mmol/(g*h)] except area under the curve (AUC) which was
calculated according to Chapter 4.3.3.
Gene max prod. AUC (abs.) max biom. min biom. AUC [%]
peg.4449 76.97 14952.84 207.05 176.86 93.83
peg.6180 76.97 14952.84 207.05 176.86 93.83
peg.4943 76.97 14952.84 207.05 176.86 93.83
peg.6156 76.97 14952.84 207.05 176.86 93.83
peg.2513 76.97 14952.84 207.05 176.86 93.83
peg.4370 76.97 13671.15 198.23 157.04 94.66
peg.3495 76.97 13671.15 198.23 157.04 94.66
peg.338 76.97 14952.84 207.05 176.86 93.83
peg.5776 76.97 14952.84 207.05 176.86 93.83
peg.1152 76.97 14952.84 207.05 176.86 93.83
peg.3189 76.97 14952.84 207.05 176.86 93.83
peg.413 76.97 14952.84 207.05 176.86 93.83
peg.1763 76.97 14952.84 207.05 176.86 93.83
peg.4644 76.97 14952.84 207.05 176.86 93.83
peg.4645 76.97 14952.84 207.05 176.86 93.83
NADPH is the most common reactive power equivalent in biosynthesis. It is required for eight
reduction steps in the synthesis of Griseorhodin A. Removing the reaction related to the genes
peg.4370 and peg.3495 leads to an increased AUC value. That both modifications lead to the

Results
82
same value shows, that they are either annotated to the same reaction, or that they are part of
a linear series of reactions.
Unfortunately, none of the genes catalyzing a reaction competing for NADPH was suitable for a
knockout. They were either catalyzing unspecific reactions that were also annotated to several
other gene products or catalyzing essential reactions.
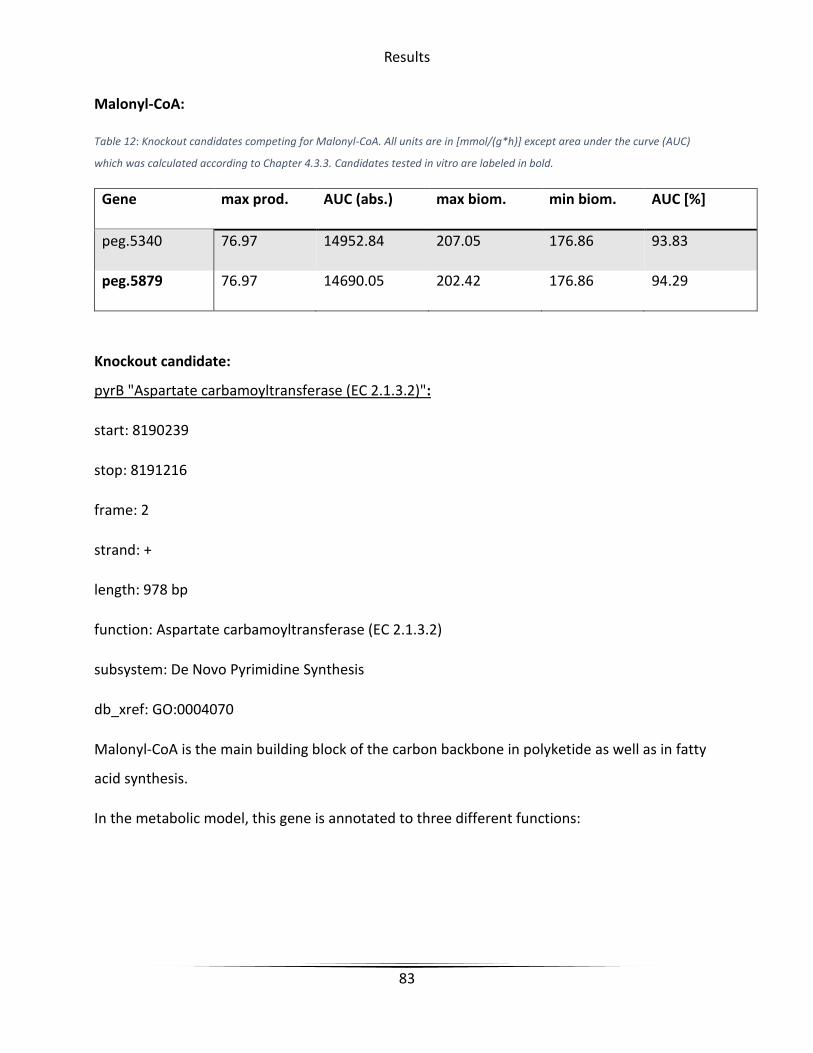
Results
83
Malonyl-CoA:
Table 12: Knockout candidates competing for Malonyl-CoA. All units are in [mmol/(g*h)] except area under the curve (AUC)
which was calculated according to Chapter 4.3.3. Candidates tested in vitro are labeled in bold.
Gene max prod. AUC (abs.) max biom. min biom. AUC [%]
peg.5340 76.97 14952.84 207.05 176.86 93.83
peg.5879 76.97 14690.05 202.42 176.86 94.29
Knockout candidate:
pyrB "Aspartate carbamoyltransferase (EC 2.1.3.2)":
start: 8190239
stop: 8191216
frame: 2
strand: +
length: 978 bp
function: Aspartate carbamoyltransferase (EC 2.1.3.2)
subsystem: De Novo Pyrimidine Synthesis
db_xref: GO:0004070
Malonyl-CoA is the main building block of the carbon backbone in polyketide as well as in fatty
acid synthesis.
In the metabolic model, this gene is annotated to three different functions:

Results
84
Carbamoyl-phosphate: L-aspartate carbamoyltransferase (EC 2.1:3.2)
Figure 37: pyrB in pyrimidine metabolism
The formation of N-carbamoyl-aspartate is an important reaction in one of two possible
pathways for the generation of pyrimidines. The gene catalyzing this reaction is reported to be
essential in other bacterial strains (92).
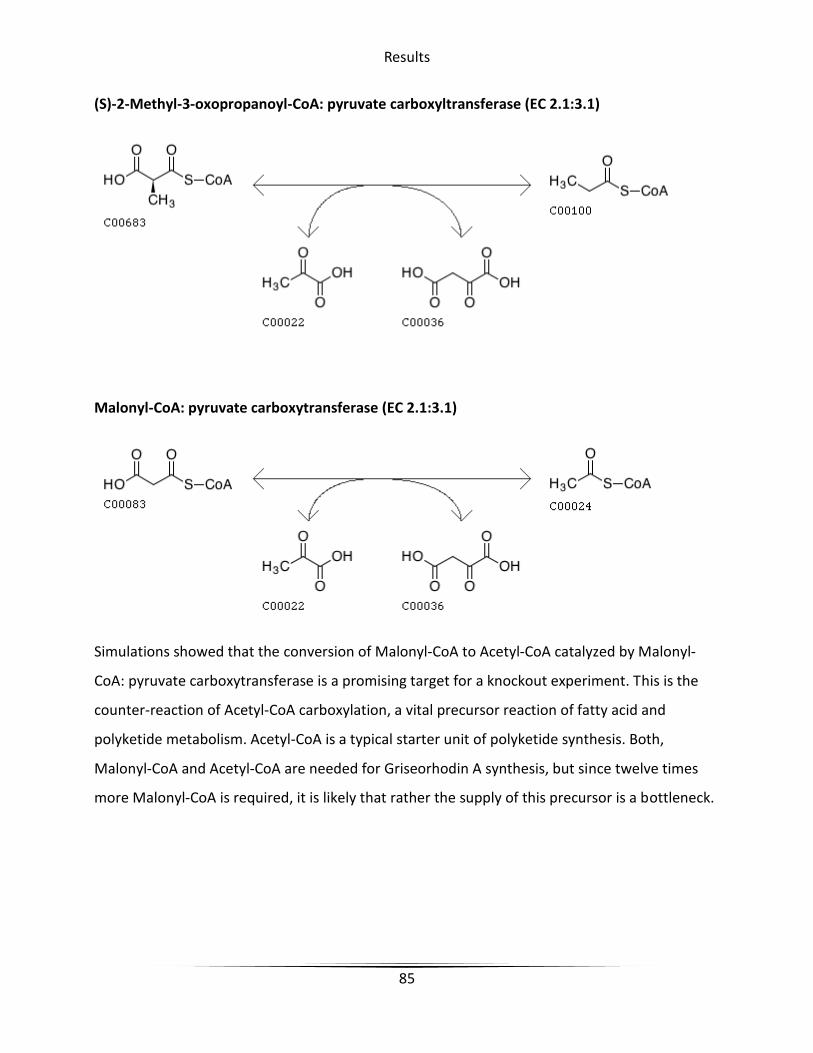
Results
85
(S)-2-Methyl-3-oxopropanoyl-CoA: pyruvate carboxyltransferase (EC 2.1:3.1)
Malonyl-CoA: pyruvate carboxytransferase (EC 2.1:3.1)
Simulations showed that the conversion of Malonyl-CoA to Acetyl-CoA catalyzed by Malonyl-
CoA: pyruvate carboxytransferase is a promising target for a knockout experiment. This is the
counter-reaction of Acetyl-CoA carboxylation, a vital precursor reaction of fatty acid and
polyketide metabolism. Acetyl-CoA is a typical starter unit of polyketide synthesis. Both,
Malonyl-CoA and Acetyl-CoA are needed for Griseorhodin A synthesis, but since twelve times
more Malonyl-CoA is required, it is likely that rather the supply of this precursor is a bottleneck.
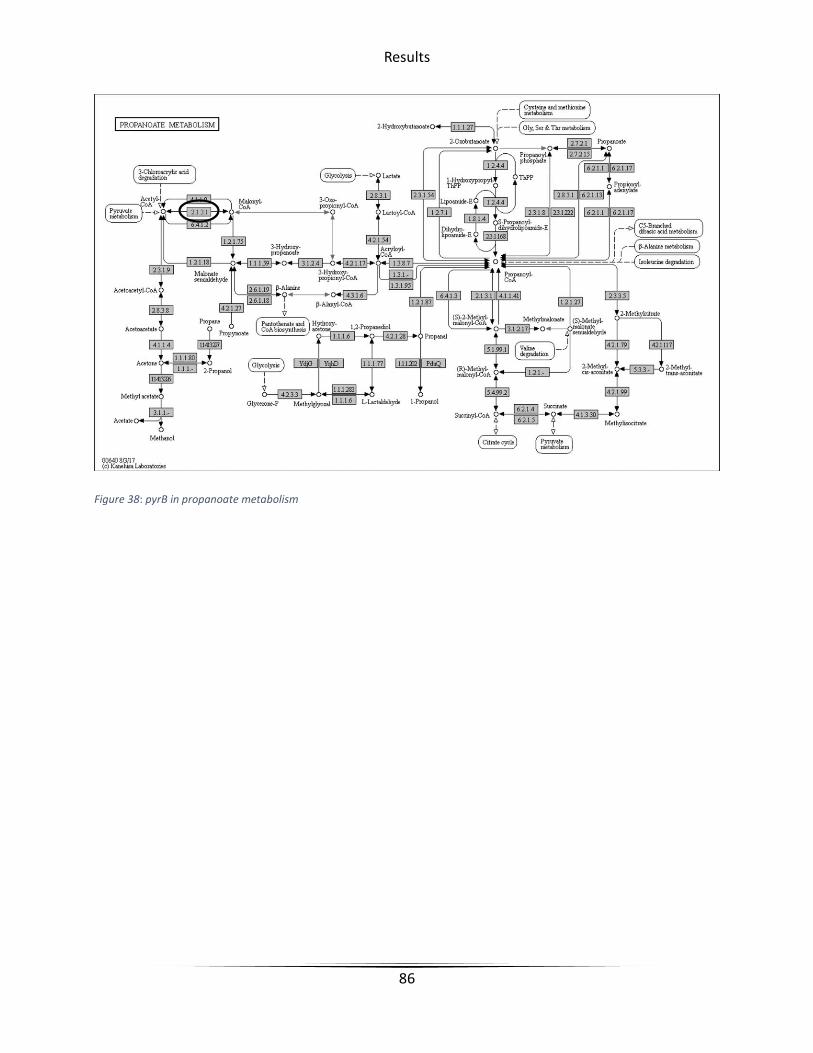
Results
86
Figure 38: pyrB in propanoate metabolism

Results
87
Acetyl-CoA:
Table 13: Knockout candidates competing for Acetyl-CoA. All units except AUC are in [mmol/(g*h)]. Candidates tested in vitro are
labeled in bold.
Gene max prod. AUC (abs.) max biom. min biom. AUC [%]
peg.1274 76.97 14952.84 207.05 176.86 93.83
peg.439 76.97 14485.20 201.10 173.59 93.58
peg.4580 76.97 14952.84 207.05 176.86 93.83
peg.3638 76.97 14952.84 207.05 176.86 93.83
peg.1273 76.97 14952.84 207.05 176.86 93.83
peg.838 76.97 14952.84 207.05 176.86 93.83
peg.2202 76.97 14952.84 207.05 176.86 93.83
peg.4705 76.97 14952.84 207.05 176.86 93.83
peg.4300 76.97 14952.84 207.05 176.86 93.83
peg.882 76.97 14952.84 207.05 176.86 93.83
peg.1139 76.97 14952.84 207.05 176.86 93.83
peg.5777 76.97 14952.84 207.05 176.86 93.83
peg.1695 76.97 14946.68 205.99 176.86 94.27
peg.2754 76.97 14952.84 207.05 176.86 93.83
peg.1203 76.97 14952.84 207.05 176.86 93.83
peg.1567 76.97 14952.84 207.05 176.86 93.83
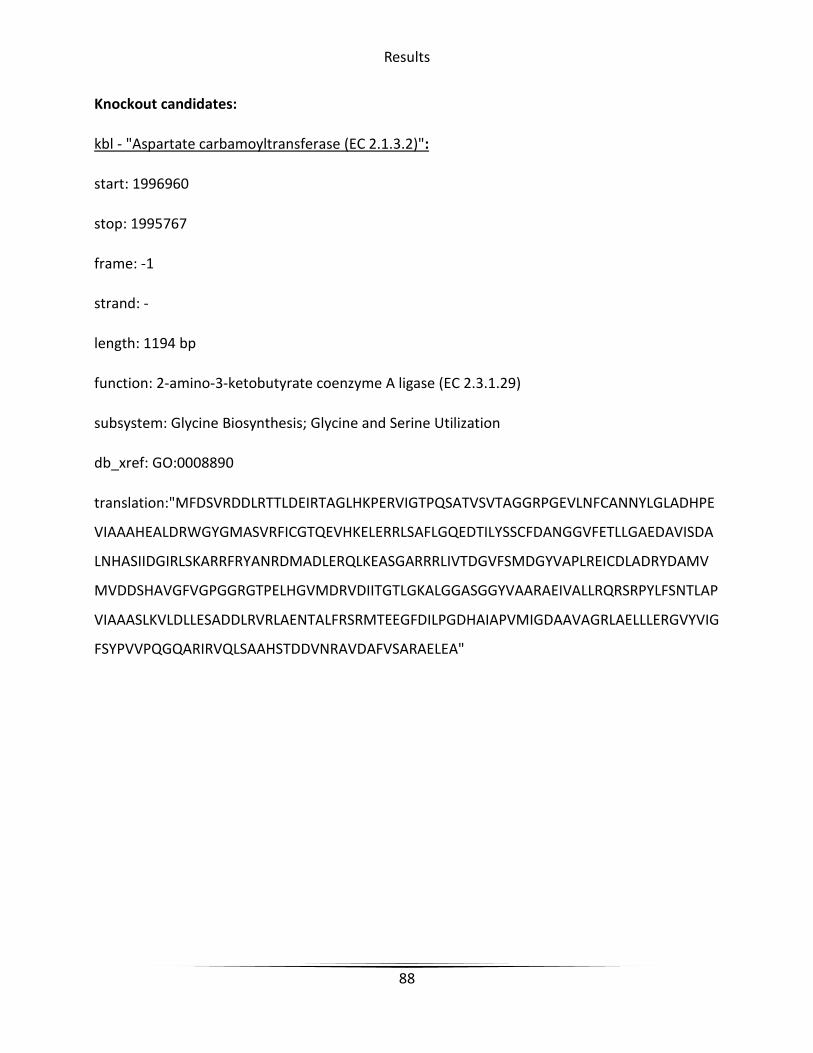
Results
88
Knockout candidates:
kbl - "Aspartate carbamoyltransferase (EC 2.1.3.2)":
start: 1996960
stop: 1995767
frame: -1
strand: -
length: 1194 bp
function: 2-amino-3-ketobutyrate coenzyme A ligase (EC 2.3.1.29)
subsystem: Glycine Biosynthesis; Glycine and Serine Utilization
db_xref: GO:0008890
translation:"MFDSVRDDLRTTLDEIRTAGLHKPERVIGTPQSATVSVTAGGRPGEVLNFCANNYLGLADHPE
VIAAAHEALDRWGYGMASVRFICGTQEVHKELERRLSAFLGQEDTILYSSCFDANGGVFETLLGAEDAVISDA
LNHASIIDGIRLSKARRFRYANRDMADLERQLKEASGARRRLIVTDGVFSMDGYVAPLREICDLADRYDAMV
MVDDSHAVGFVGPGGRGTPELHGVMDRVDIITGTLGKALGGASGGYVAARAEIVALLRQRSRPYLFSNTLAP
VIAAASLKVLDLLESADDLRVRLAENTALFRSRMTEEGFDILPGDHAIAPVMIGDAAVAGRLAELLLERGVYVIG
FSYPVVPQGQARIRVQLSAAHSTDDVNRAVDAFVSARAELEA"
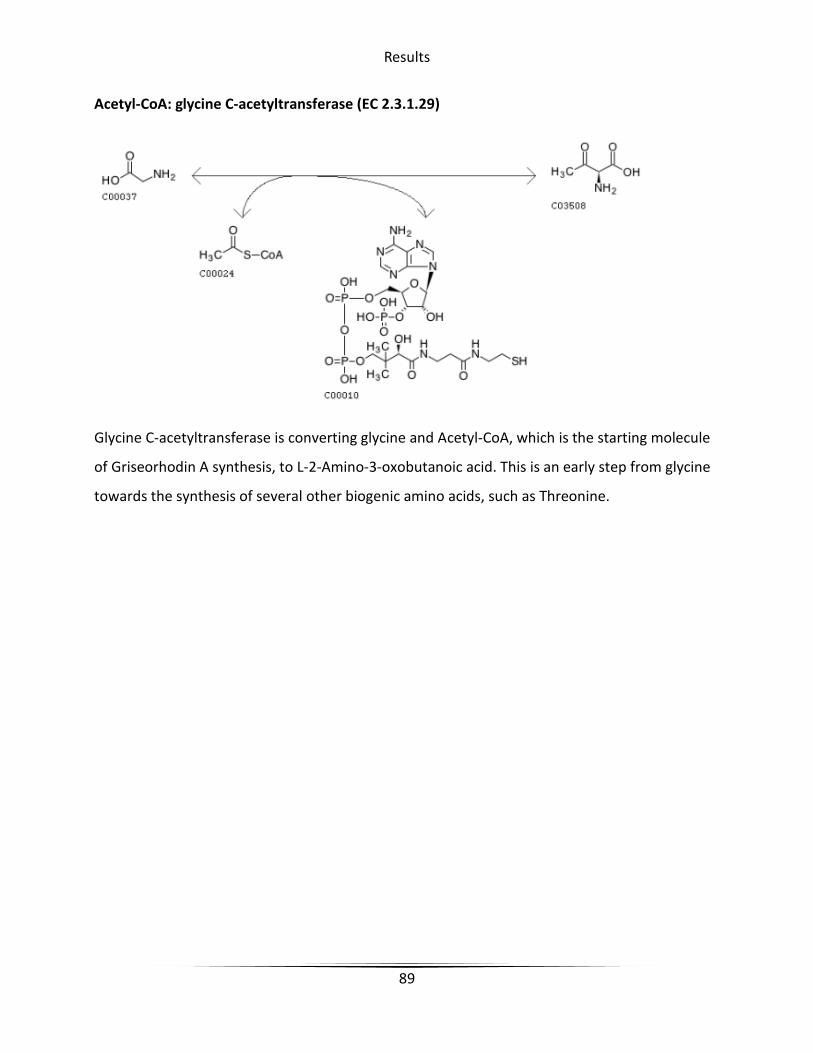
Results
89
Acetyl-CoA: glycine C-acetyltransferase (EC 2.3.1.29)
Glycine C-acetyltransferase is converting glycine and Acetyl-CoA, which is the starting molecule
of Griseorhodin A synthesis, to L-2-Amino-3-oxobutanoic acid. This is an early step from glycine
towards the synthesis of several other biogenic amino acids, such as Threonine.

Results
90
Figure 39: kbl in glycine, serine and threonine metabolism
pta - "Phosphate acetyltransferase (EC 2.3.1.8)":
start: 3467325
stop: 3469415
frame: 3
strand: +
length: 2091 bp
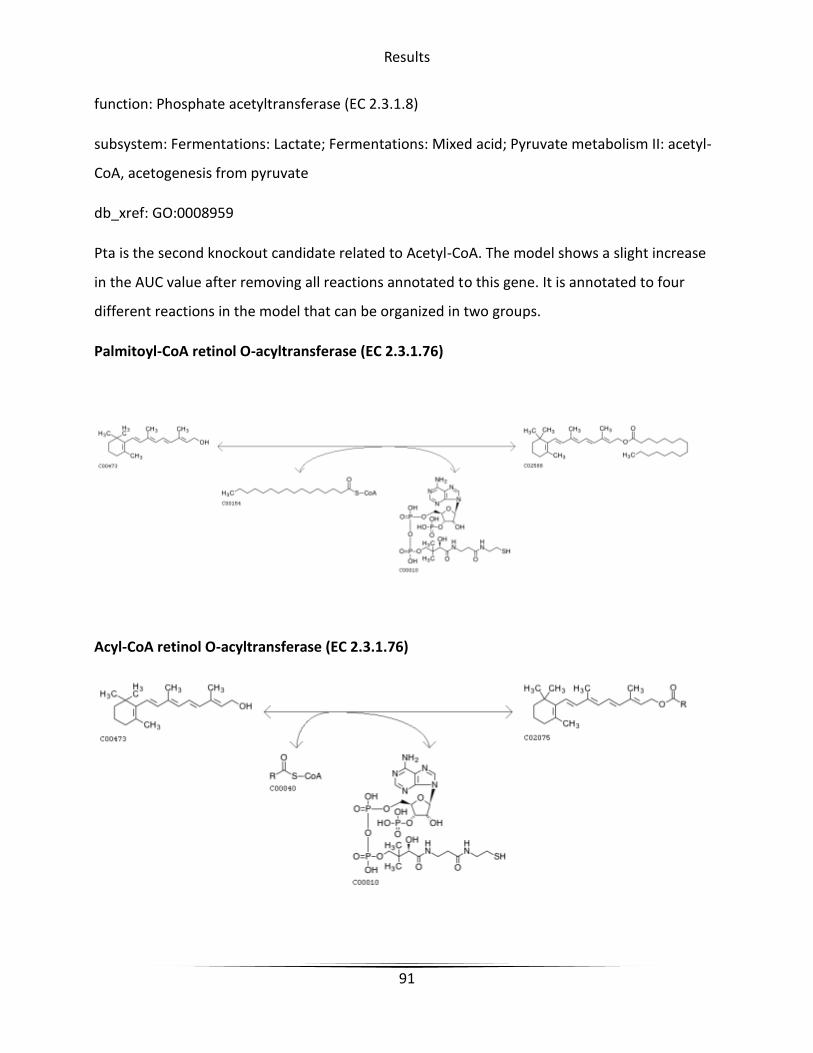
Results
91
function: Phosphate acetyltransferase (EC 2.3.1.8)
subsystem: Fermentations: Lactate; Fermentations: Mixed acid; Pyruvate metabolism II: acetyl-
CoA, acetogenesis from pyruvate
db_xref: GO:0008959
Pta is the second knockout candidate related to Acetyl-CoA. The model shows a slight increase
in the AUC value after removing all reactions annotated to this gene. It is annotated to four
different reactions in the model that can be organized in two groups.
Palmitoyl-CoA retinol O-acyltransferase (EC 2.3.1.76)
Acyl-CoA retinol O-acyltransferase (EC 2.3.1.76)

Results
92
Figure 40: pta in retinol metabolism
Different families of Retinol O-acyltransferases are found very widespread in bacteria, but also
in eukaryotes and viruses. They play a role in Vitamin A storage or mobilization, and generation
of different chromophores in eukaryotes. It is suspected that they participate in the maturation
of lipoproteins in viral capsids. In bacteria, structurally related proteins are responsible for
hydrolyzations of peptidoglycan bounds that are necessary for reorganization of the cell wall
during vegetative growth (93).

Results
93
Acetyl-CoA phosphate acetyltransferase (EC 2.3.1.8)
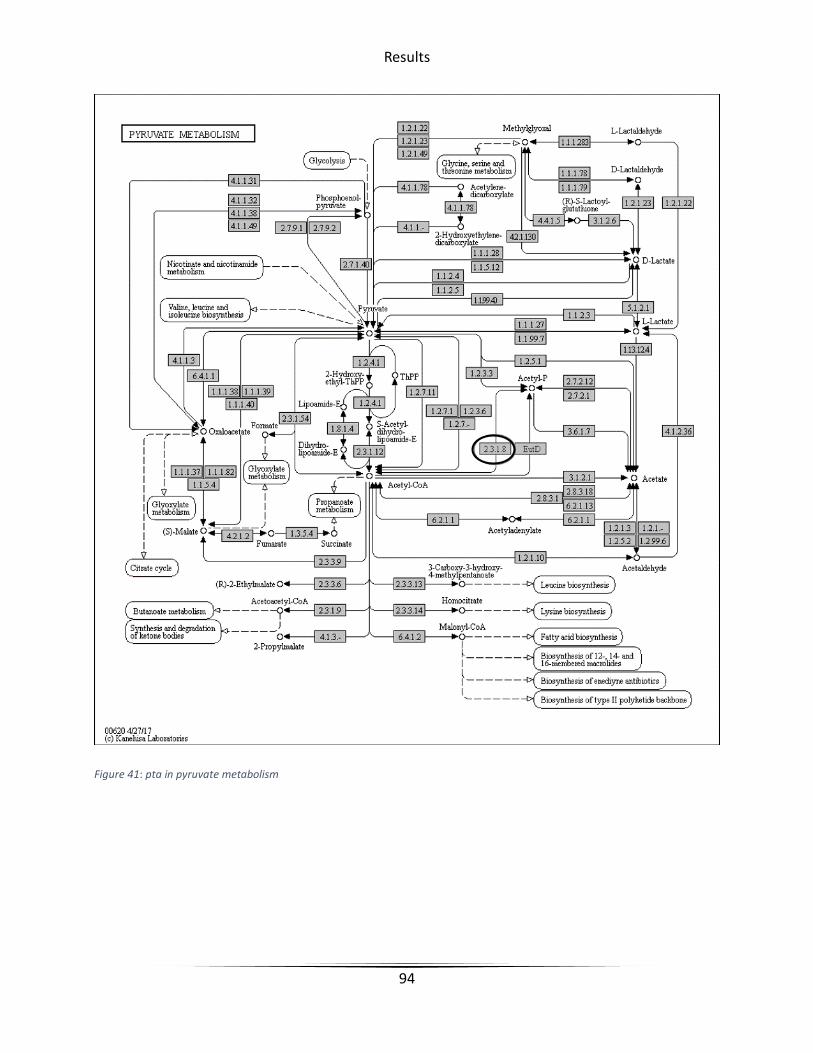
Results
94
Figure 41: pta in pyruvate metabolism

Results
95
Propanoyl-CoA phosphate propanoyltransferase (EC 2.3.1.8)
Figure 42: pta in propanoate metabolism
The generation of ATP from acetyl or propionyl phosphate are the last steps in Lactic acid
fermentation. Even though these reactions are generating ATP, they are also consuming
precursors that are needed for Griseorhodin A production.

Results
96
FAD:
Table 14: Knockout candidates competing for FAD. All units except AUC are in [mmol/(g*h)]. Candidates tested in vitro are
labeled in bold.
Gene max prod. AUC (abs.) max biom. min biom. AUC [%]
peg.3800 76.97 14952.84 207.05 176.86 93.83
peg.4242 76.97 14952.17 206.87 176.86 93.90
peg.3804 76.97 14952.84 207.05 176.86 93.83
peg.406 76.97 14952.17 206.87 176.86 93.90
Knockout candidate:
fadE4 - "Isovaleryl-CoA dehydrogenase (EC 1.3.99.10)"
start: 6391645
stop: 6390485
frame: -1
strand: -
length: 1161 bp
function: Isovaleryl-CoA dehydrogenase (EC 1.3.99.10) new: (EC 1.3.8.4)
subsystem: HMG CoA Synthesis; Leucine Degradation and HMG-CoA Metabolism
db_xref: GO:0008470
FAD is a common electron donator in eukaryotic and prokaryotic metabolism. Unlike NAD it is
also able to transfer single electrons. It is the central cofactor in the generation of spiroketal
moiety of Griseorhodin A. This knockout candidate is annotated to two FAD dependent
reactions in the model.
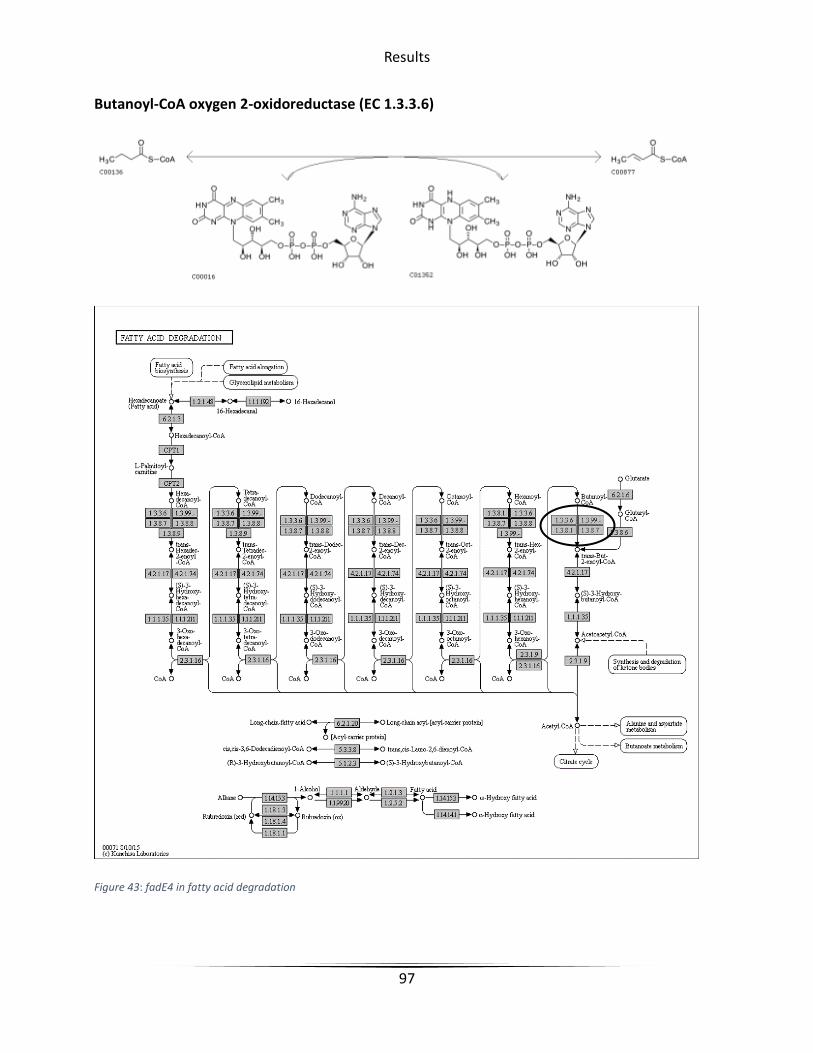
Results
97
Butanoyl-CoA oxygen 2-oxidoreductase (EC 1.3.3.6)
Figure 43: fadE4 in fatty acid degradation

Results
98
3-methylbutanoyl-CoA (acceptor) 2,3-oxidoreductase(EC 1.3.8.4)

Results
99
Figure 44: fadE4 in valine, leucine and isoleucine degradation
Although these reactions only differ in one methyl group, they can be assigned to two different
metabolic pathways. Butanoyl oxidation is part beta-oxidation in fatty acid. In the simulations,
however, the effect of knocking out the other reaction is predominate. It is an early stage of

Results
100
valine, leucine and isoleucine biosynthesis, and besides FAD it is also utilizing precursors of
terpene biosynthesis.
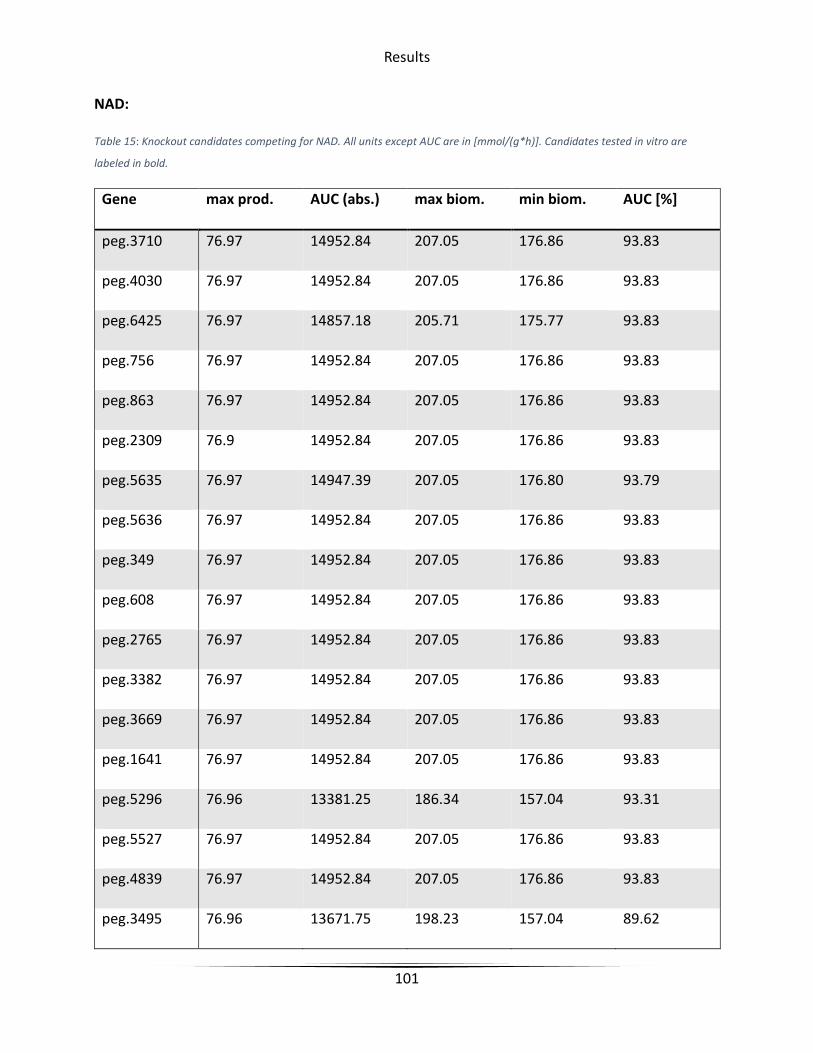
Results
101
NAD:
Table 15: Knockout candidates competing for NAD. All units except AUC are in [mmol/(g*h)]. Candidates tested in vitro are
labeled in bold.
Gene max prod. AUC (abs.) max biom. min biom. AUC [%]
peg.3710 76.97 14952.84 207.05 176.86 93.83
peg.4030 76.97 14952.84 207.05 176.86 93.83
peg.6425 76.97 14857.18 205.71 175.77 93.83
peg.756 76.97 14952.84 207.05 176.86 93.83
peg.863 76.97 14952.84 207.05 176.86 93.83
peg.2309 76.9 14952.84 207.05 176.86 93.83
peg.5635 76.97 14947.39 207.05 176.80 93.79
peg.5636 76.97 14952.84 207.05 176.86 93.83
peg.349 76.97 14952.84 207.05 176.86 93.83
peg.608 76.97 14952.84 207.05 176.86 93.83
peg.2765 76.97 14952.84 207.05 176.86 93.83
peg.3382 76.97 14952.84 207.05 176.86 93.83
peg.3669 76.97 14952.84 207.05 176.86 93.83
peg.1641 76.97 14952.84 207.05 176.86 93.83
peg.5296 76.96 13381.25 186.34 157.04 93.31
peg.5527 76.97 14952.84 207.05 176.86 93.83
peg.4839 76.97 14952.84 207.05 176.86 93.83
peg.3495 76.96 13671.75 198.23 157.04 89.62
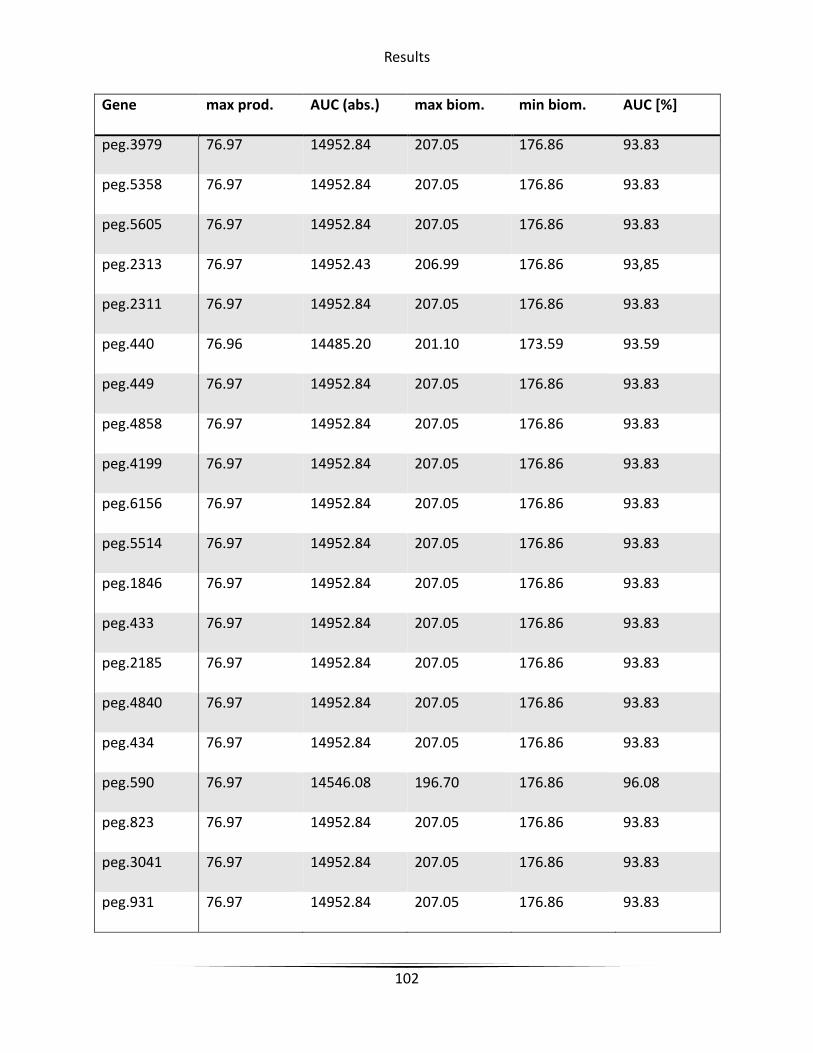
Results
102
Gene max prod. AUC (abs.) max biom. min biom. AUC [%]
peg.3979 76.97 14952.84 207.05 176.86 93.83
peg.5358 76.97 14952.84 207.05 176.86 93.83
peg.5605 76.97 14952.84 207.05 176.86 93.83
peg.2313 76.97 14952.43 206.99 176.86 93,85
peg.2311 76.97 14952.84 207.05 176.86 93.83
peg.440 76.96 14485.20 201.10 173.59 93.59
peg.449 76.97 14952.84 207.05 176.86 93.83
peg.4858 76.97 14952.84 207.05 176.86 93.83
peg.4199 76.97 14952.84 207.05 176.86 93.83
peg.6156 76.97 14952.84 207.05 176.86 93.83
peg.5514 76.97 14952.84 207.05 176.86 93.83
peg.1846 76.97 14952.84 207.05 176.86 93.83
peg.433 76.97 14952.84 207.05 176.86 93.83
peg.2185 76.97 14952.84 207.05 176.86 93.83
peg.4840 76.97 14952.84 207.05 176.86 93.83
peg.434 76.97 14952.84 207.05 176.86 93.83
peg.590 76.97 14546.08 196.70 176.86 96.08
peg.823 76.97 14952.84 207.05 176.86 93.83
peg.3041 76.97 14952.84 207.05 176.86 93.83
peg.931 76.97 14952.84 207.05 176.86 93.83

Results
103
Gene max prod. AUC (abs.) max biom. min biom. AUC [%]
peg.1780 76.97 14952.84 207.05 176.86 93.83
peg.6006 76.97 14952.84 207.05 176.86 93.83
peg.3593 76.97 14952.84 207.05 176.86 93.83
peg.4176 76.97 14952.84 207.05 176.86 93.83
peg.659 76.97 14952.84 207.05 176.86 93.83
peg.1601 76.97 14952.84 207.05 176.86 93.83
peg.222 76.97 14952.84 207.05 176.86 93.83
peg.1541 76.97 14952.84 207.05 176.86 93.83
peg.5901 76.97 14952.84 207.05 176.86 93.83
peg.4370 76.96 13671.15 198.23 157.04 94.66
peg.6176 76.97 14952.84 207.05 176.86 93.83
peg.1837 76.97 14952.84 207.05 176.86 93.83
peg.2063 76.97 14952.84 207.05 176.86 93.83
peg.2219 76.97 14952.84 207.05 176.86 93.83
peg.346 76.96 14857.18 205.71 175.77 93.85
peg.318 76.97 14952.84 207.05 176.86 93.83
peg.1201 76.97 14952.84 207.05 176.86 93.83
peg.5964 76.97 14952.84 207.05 176.86 93.83
peg.1446 76.97 14952.84 207.05 176.86 93.83
peg.5966 76.97 14952.84 207.05 176.86 93.83
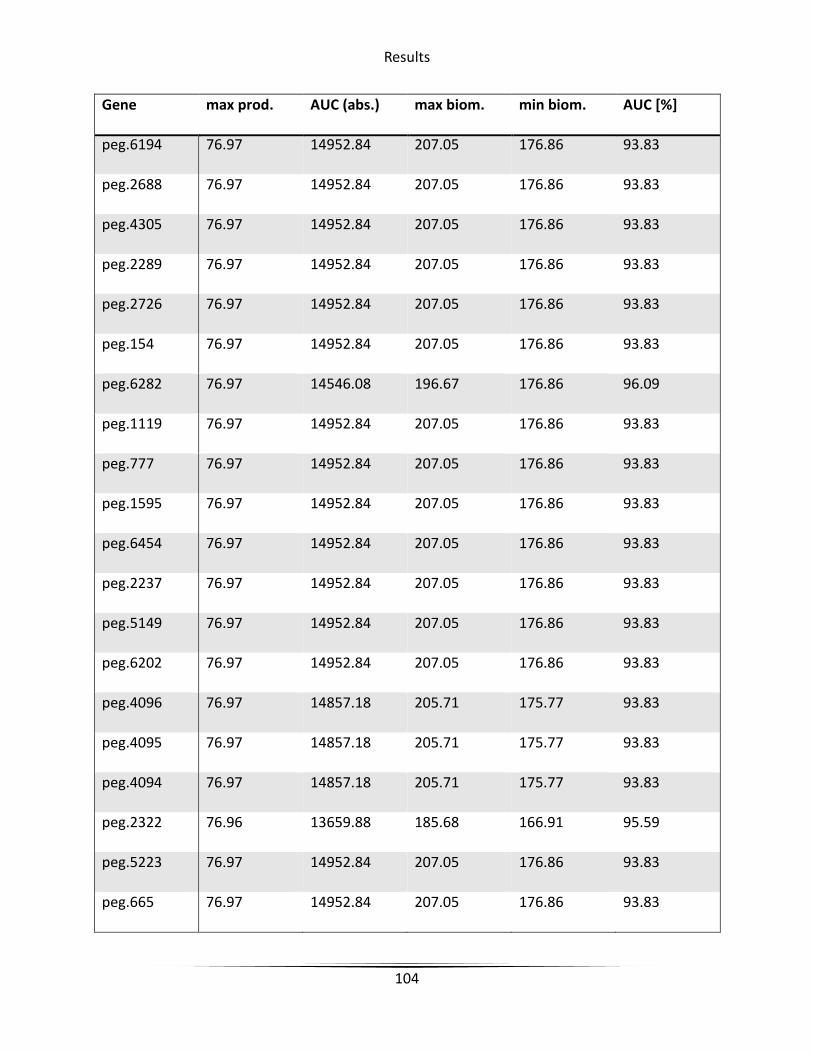
Results
104
Gene max prod. AUC (abs.) max biom. min biom. AUC [%]
peg.6194 76.97 14952.84 207.05 176.86 93.83
peg.2688 76.97 14952.84 207.05 176.86 93.83
peg.4305 76.97 14952.84 207.05 176.86 93.83
peg.2289 76.97 14952.84 207.05 176.86 93.83
peg.2726 76.97 14952.84 207.05 176.86 93.83
peg.154 76.97 14952.84 207.05 176.86 93.83
peg.6282 76.97 14546.08 196.67 176.86 96.09
peg.1119 76.97 14952.84 207.05 176.86 93.83
peg.777 76.97 14952.84 207.05 176.86 93.83
peg.1595 76.97 14952.84 207.05 176.86 93.83
peg.6454 76.97 14952.84 207.05 176.86 93.83
peg.2237 76.97 14952.84 207.05 176.86 93.83
peg.5149 76.97 14952.84 207.05 176.86 93.83
peg.6202 76.97 14952.84 207.05 176.86 93.83
peg.4096 76.97 14857.18 205.71 175.77 93.83
peg.4095 76.97 14857.18 205.71 175.77 93.83
peg.4094 76.97 14857.18 205.71 175.77 93.83
peg.2322 76.96 13659.88 185.68 166.91 95.59
peg.5223 76.97 14952.84 207.05 176.86 93.83
peg.665 76.97 14952.84 207.05 176.86 93.83
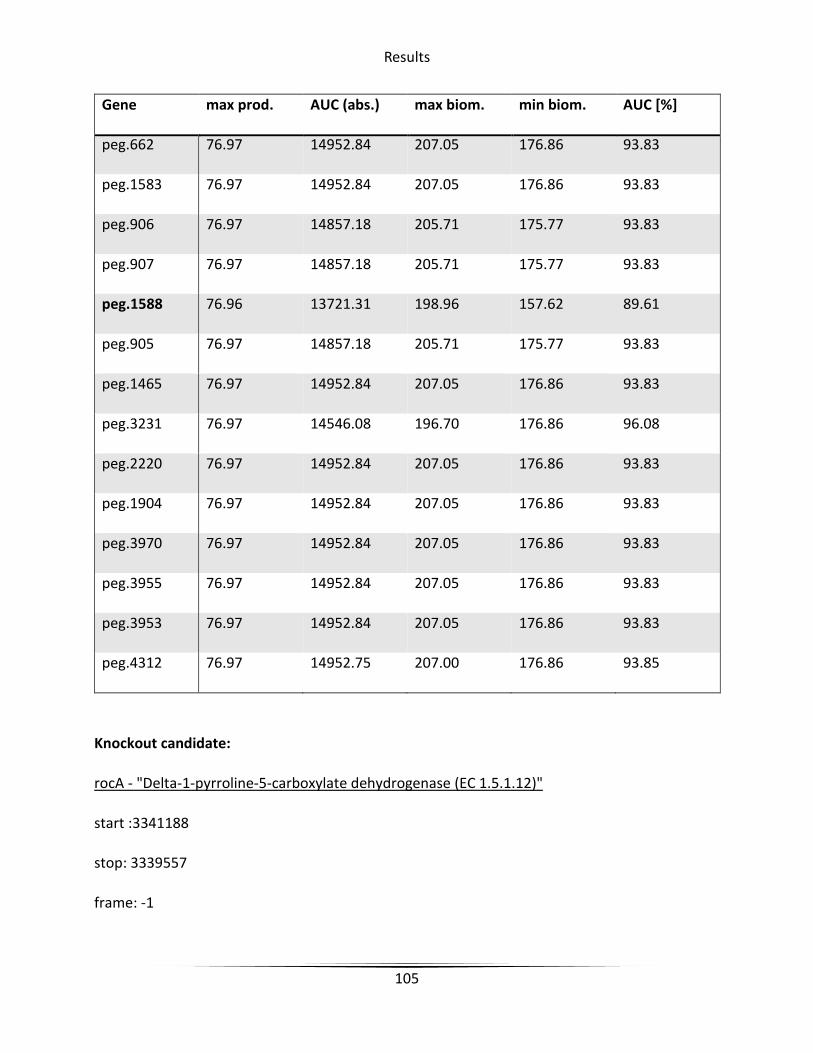
Results
105
Gene max prod. AUC (abs.) max biom. min biom. AUC [%]
peg.662 76.97 14952.84 207.05 176.86 93.83
peg.1583 76.97 14952.84 207.05 176.86 93.83
peg.906 76.97 14857.18 205.71 175.77 93.83
peg.907 76.97 14857.18 205.71 175.77 93.83
peg.1588 76.96 13721.31 198.96 157.62 89.61
peg.905 76.97 14857.18 205.71 175.77 93.83
peg.1465 76.97 14952.84 207.05 176.86 93.83
peg.3231 76.97 14546.08 196.70 176.86 96.08
peg.2220 76.97 14952.84 207.05 176.86 93.83
peg.1904 76.97 14952.84 207.05 176.86 93.83
peg.3970 76.97 14952.84 207.05 176.86 93.83
peg.3955 76.97 14952.84 207.05 176.86 93.83
peg.3953 76.97 14952.84 207.05 176.86 93.83
peg.4312 76.97 14952.75 207.00 176.86 93.85
Knockout candidate:
rocA - "Delta-1-pyrroline-5-carboxylate dehydrogenase (EC 1.5.1.12)"
start :3341188
stop: 3339557
frame: -1

Results
106
strand: -
length: 1632 bp
function: Delta-1-pyrroline-5-carboxylate dehydrogenase (EC 1.5.1.12) new: (EC 1.2.1.88)
subsystem: Arginine and Ornithine Degradation; Proline, 4-hydroxyproline uptake and
utilization
db_xref: GO:0003842
In contrast to NADP, NAD usually serves as oxidation agent in physiological reactions. Although
a large number of possible knockout candidates have been predicted, only few show effect or
are feasible. This knockout candidate is annotated to two reactions that can both be linked to
the same enzyme type:
(S)1-pyrroline-5-carboxylate NAD oxidoreductase (EC 1.2.1.88)
L-Glutamate-5-semialdehyde NAD oxidoreductase (EC 1.2.1.88)
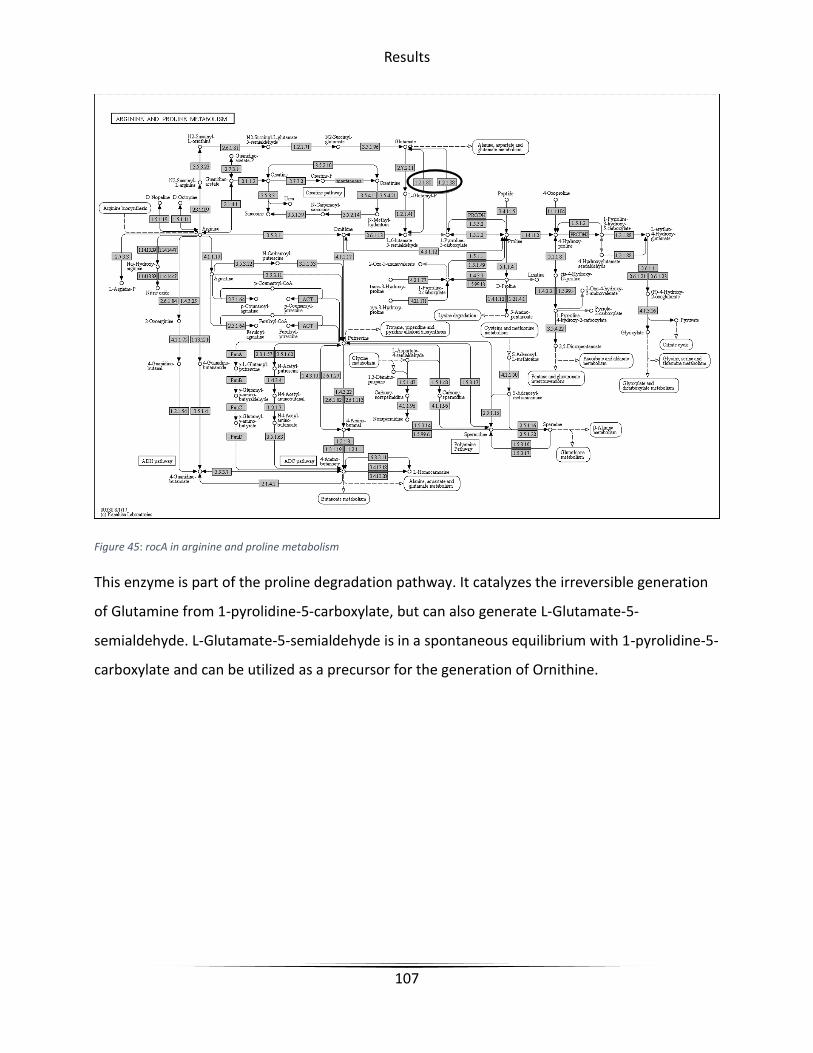
Results
107
Figure 45: rocA in arginine and proline metabolism
This enzyme is part of the proline degradation pathway. It catalyzes the irreversible generation
of Glutamine from 1-pyrolidine-5-carboxylate, but can also generate L-Glutamate-5-
semialdehyde. L-Glutamate-5-semialdehyde is in a spontaneous equilibrium with 1-pyrolidine-5-
carboxylate and can be utilized as a precursor for the generation of Ornithine.
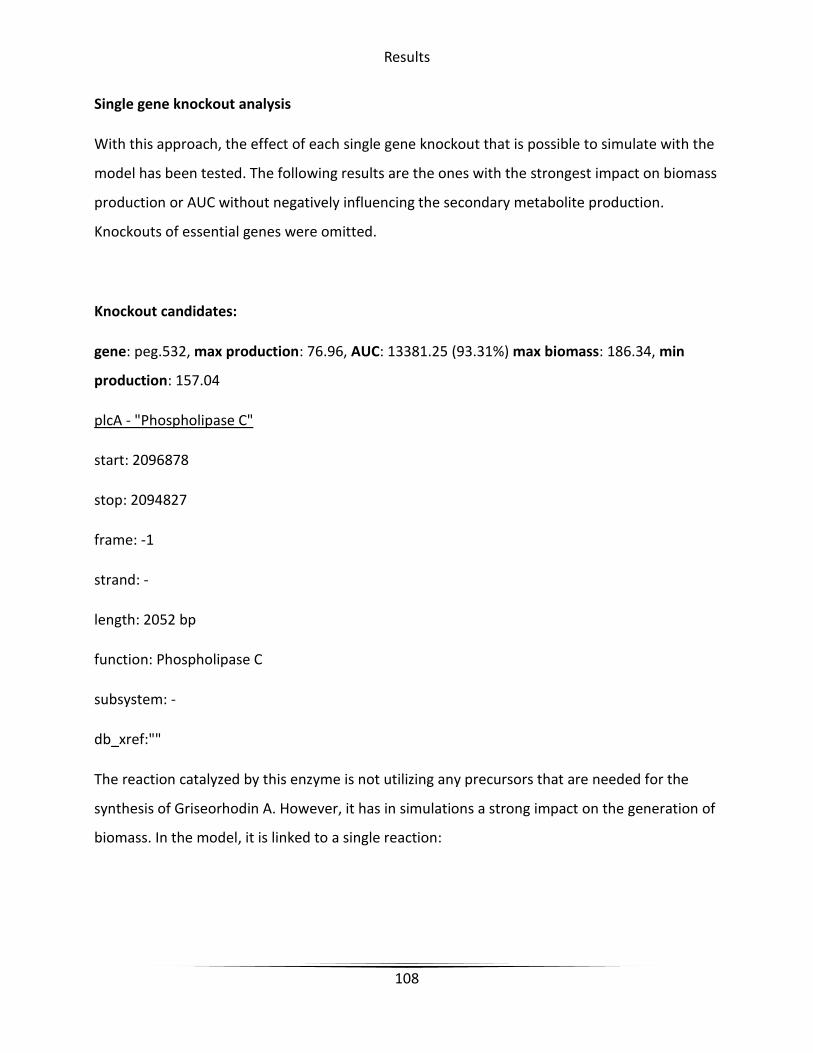
Results
108
Single gene knockout analysis
With this approach, the effect of each single gene knockout that is possible to simulate with the
model has been tested. The following results are the ones with the strongest impact on biomass
production or AUC without negatively influencing the secondary metabolite production.
Knockouts of essential genes were omitted.
Knockout candidates:
gene: peg.532, max production: 76.96, AUC: 13381.25 (93.31%) max biomass: 186.34, min
production: 157.04
plcA - "Phospholipase C"
start: 2096878
stop: 2094827
frame: -1
strand: -
length: 2052 bp
function: Phospholipase C
subsystem: -
db_xref:""
The reaction catalyzed by this enzyme is not utilizing any precursors that are needed for the
synthesis of Griseorhodin A. However, it has in simulations a strong impact on the generation of
biomass. In the model, it is linked to a single reaction:

Results
109
Plasmenylethanolamine-ethanolamine-phosphohydrolase (EC 3.1.4.3)
Figure 46: plcA in ether lipid metabolism
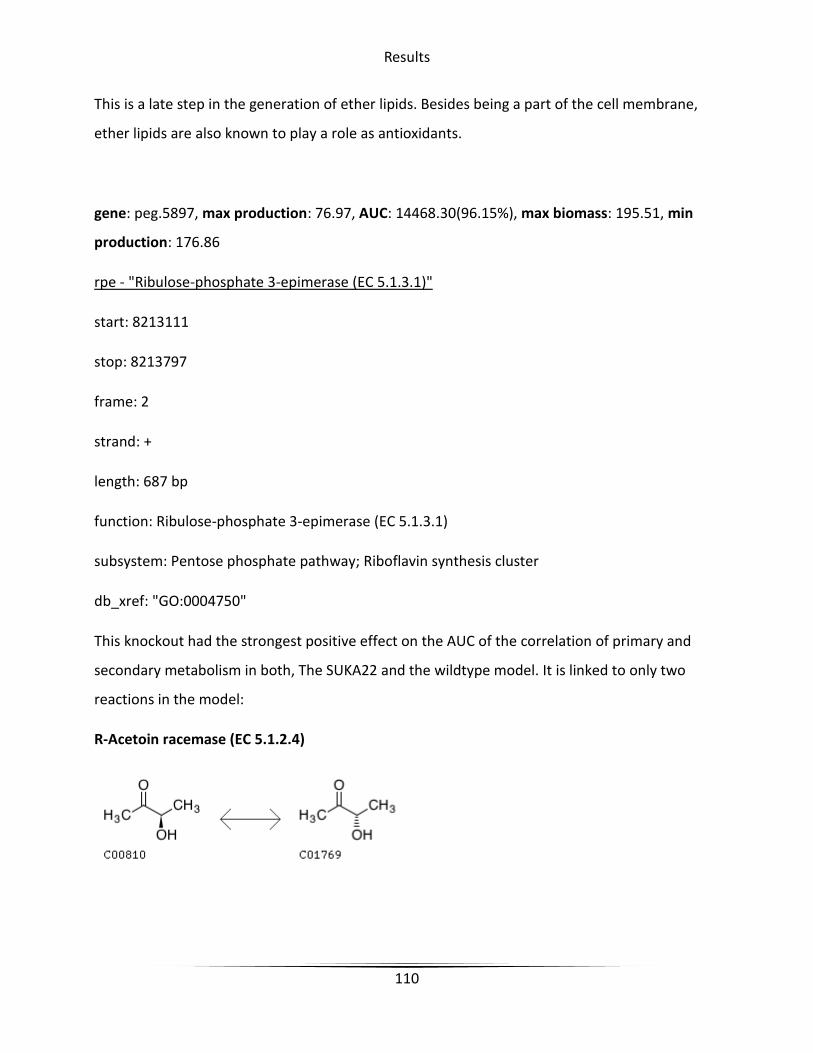
Results
110
This is a late step in the generation of ether lipids. Besides being a part of the cell membrane,
ether lipids are also known to play a role as antioxidants.
gene: peg.5897, max production: 76.97, AUC: 14468.30(96.15%), max biomass: 195.51, min
production: 176.86
rpe - "Ribulose-phosphate 3-epimerase (EC 5.1.3.1)"
start: 8213111
stop: 8213797
frame: 2
strand: +
length: 687 bp
function: Ribulose-phosphate 3-epimerase (EC 5.1.3.1)
subsystem: Pentose phosphate pathway; Riboflavin synthesis cluster
db_xref: "GO:0004750"
This knockout had the strongest positive effect on the AUC of the correlation of primary and
secondary metabolism in both, The SUKA22 and the wildtype model. It is linked to only two
reactions in the model:
R-Acetoin racemase (EC 5.1.2.4)

Results
111
D-Ribulose-5-phosphate-3-epimerase (EC 5.1.3.1)
The observed effect is mainly caused by the removal of the reaction from D-xylose phosphate to
D-Ribulose phosphate. This is an early step towards the generation of DNA and RNA, but also
histidine metabolism. It is important to keep in mind that the model is considering the energy
needed for transcription and translation only generalized in the biomass equation but not
specifically in the synthesis of Griseorhodin A.
Figure 47: rpe in pentose phosphate pathway
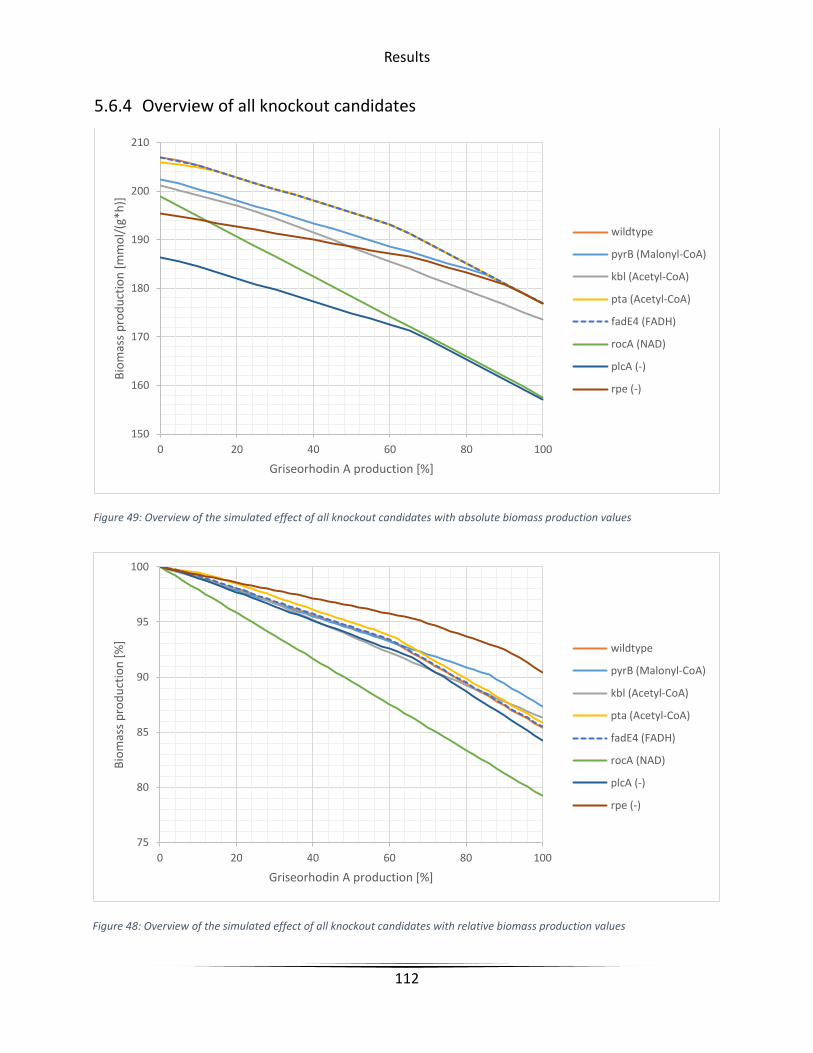
Results
112
5.6.4 Overview of all knockout candidates
150
160
170
180
190
200
210
0 20 40 60 80 100
Bio
mas
s p
rod
uct
ion
[m
mo
l/(g
*h)]
Griseorhodin A production [%]
wildtype
pyrB (Malonyl-CoA)
kbl (Acetyl-CoA)
pta (Acetyl-CoA)
fadE4 (FADH)
rocA (NAD)
plcA (-)
rpe (-)
Figure 49: Overview of the simulated effect of all knockout candidates with absolute biomass production values
Figure 48: Overview of the simulated effect of all knockout candidates with relative biomass production values
75
80
85
90
95
100
0 20 40 60 80 100
Bio
mas
s p
rod
uct
ion
[%
]
Griseorhodin A production [%]
wildtype
pyrB (Malonyl-CoA)
kbl (Acetyl-CoA)
pta (Acetyl-CoA)
fadE4 (FADH)
rocA (NAD)
plcA (-)
rpe (-)

Results
113
In comparison, the effects of the seven knockouts differ greatly from each other. Apart from
their influence on the maximum production of Griseorhodin A, they all lead to a different
maximum biomass production rate. The fadE4 (peg.4242) knockout simulation shows the
slightest variation from the simulation of the unmodified SUKA22 strain. Despite a small
decrease of the initial maximal biomass production, the course of the curves are nearly
identical. This still leads to a little higher AUC value in the percentage comparison. The most
promising result achieves the rpe (peg.5897) mutant. With the second strongest influence on
maximum biomass production, it reaches by far the highest AUC value. The lowest AUC value is
determined by the rocA (peg.1588) mutant, although it can still be associated to a reaction that
is competing for precursors. Its curve form indicates that by this modification the two functions
become linearly dependent on each other. Especially interesting are the impacts of kbl
(peg.439) and pyrB (peg.5879) as they lead to correlation curves that cut the curve of the
wildtype. This implies that depending on the actual ratio of biomass and Griseorhodin A
production, their effect can be both,
Table 16: Summary of all knockout candidates. All units except AUC are in [mmol/(g*h)]
Gene max prod. AUC (abs.) max biom. min biom. AUC [%]
WT 76,97 14952.84 207,05 176,86 93.83
peg.439 (kbl) 76.97 14485.20 201,10 173,59 93.58
peg.5879 (pyrB) 76.97 14690.05 202,42 176,86 94.29
peg.1695 (pta) 76.97 14946.68 205,99 176,86 94.27
peg.4242 (fadE4) 76.97 14952.17 206,87 176,86 93.90
peg.1588 (rocA) 76.96 13721.31 198.96 157.62 89.61
peg.532 (plcA) 76.96 13381.25 186.34 157.04 93.31
peg.5897 (rpe) 76.97 14468.30 195.51 176.86 96.15

Results
114
5.7 Experimental results
Dr. Roman Makitrynskyy was able to successfully execute all knockouts and cultivate the
different mutants. As expected, they are all capable of growth and production of Griseorhodin
A.
Figure 50: Differing morphology of the different Griseorhodin A producing SUKA22 mutants
All mutants grow and produce Griseorhodin A on agar plates. The ∆pyrB mutant develops only
few spores chains and aerial hyphae and has a bald and wrinkled surface. The other strains
produce a dark aerial mycelium and spore chains.
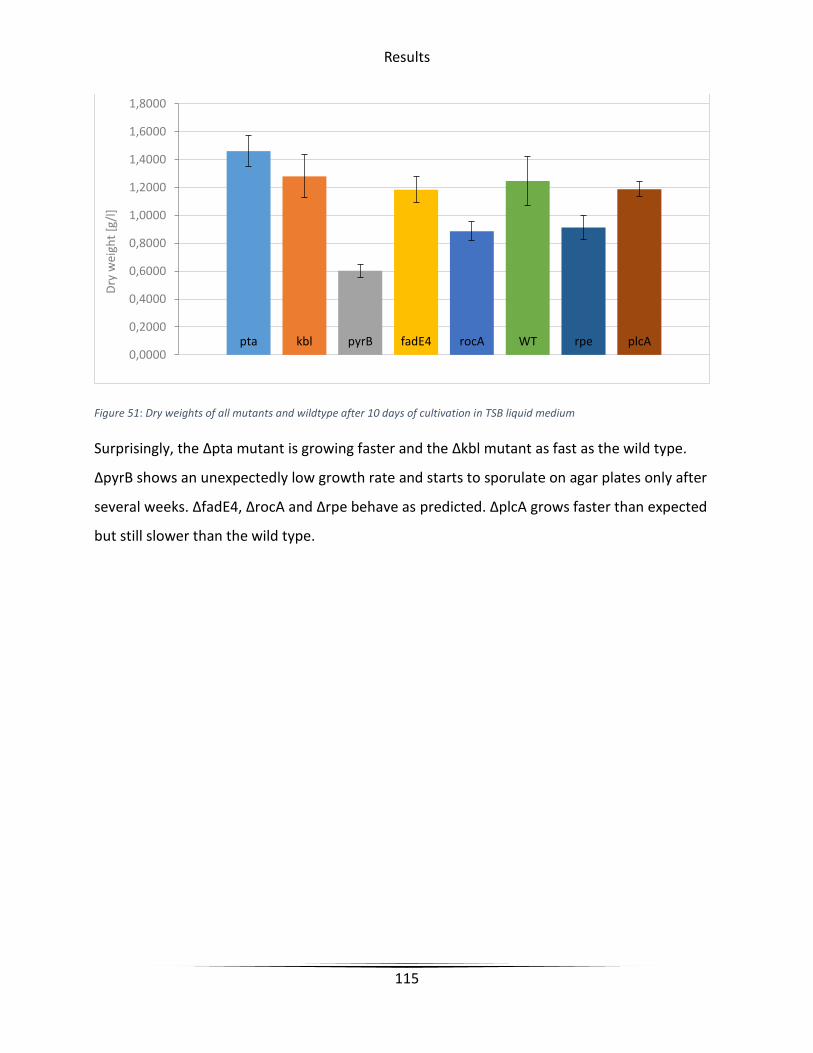
Results
115
Figure 51: Dry weights of all mutants and wildtype after 10 days of cultivation in TSB liquid medium
Surprisingly, the ∆pta mutant is growing faster and the ∆kbl mutant as fast as the wild type.
∆pyrB shows an unexpectedly low growth rate and starts to sporulate on agar plates only after
several weeks. ∆fadE4, ∆rocA and ∆rpe behave as predicted. ∆plcA grows faster than expected
but still slower than the wild type.
pta kbl pyrB fadE4 rocA WT rpe plcA0,0000
0,2000
0,4000
0,6000
0,8000
1,0000
1,2000
1,4000
1,6000
1,8000D
ry w
eigh
t [g
/l]
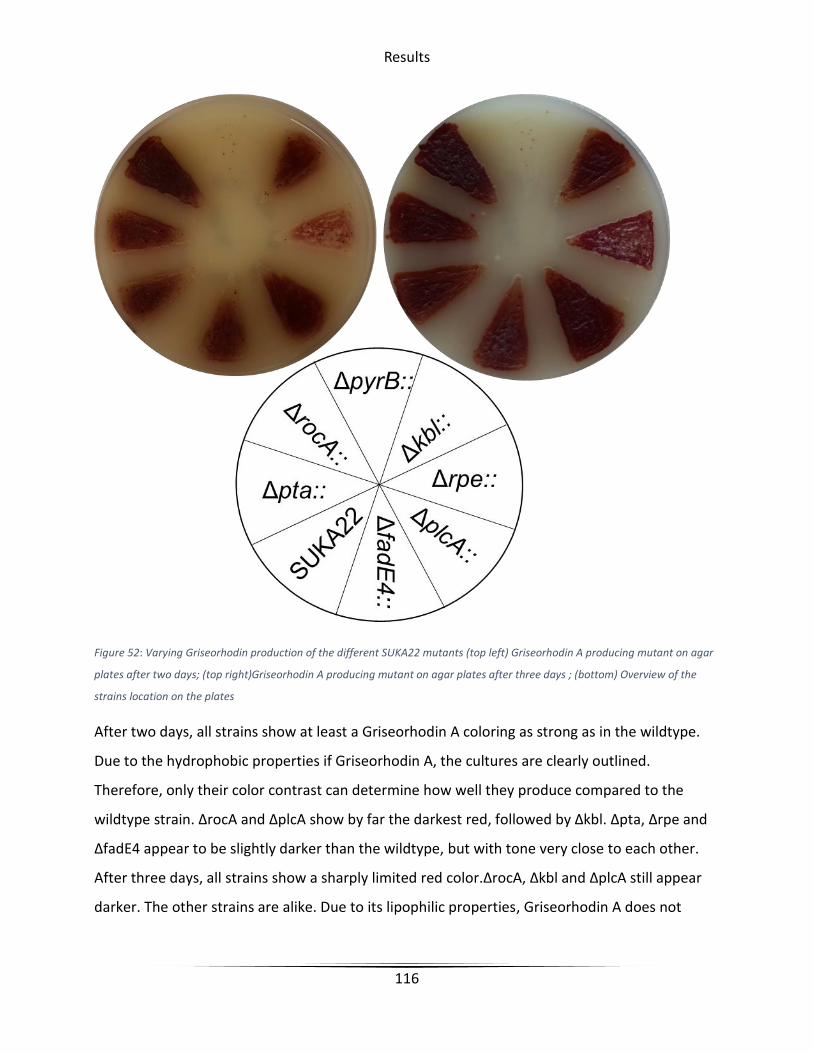
Results
116
Figure 52: Varying Griseorhodin production of the different SUKA22 mutants (top left) Griseorhodin A producing mutant on agar
plates after two days; (top right)Griseorhodin A producing mutant on agar plates after three days ; (bottom) Overview of the
strains location on the plates
After two days, all strains show at least a Griseorhodin A coloring as strong as in the wildtype.
Due to the hydrophobic properties if Griseorhodin A, the cultures are clearly outlined.
Therefore, only their color contrast can determine how well they produce compared to the
wildtype strain. ∆rocA and ∆plcA show by far the darkest red, followed by ∆kbl. ∆pta, ∆rpe and
∆fadE4 appear to be slightly darker than the wildtype, but with tone very close to each other.
After three days, all strains show a sharply limited red color.∆rocA, ∆kbl and ∆plcA still appear
darker. The other strains are alike. Due to its lipophilic properties, Griseorhodin A does not

Results
117
seem to diffuse into the medium and thus clearly delimits the edge of the colonies. ∆pyrB is not
growing fast enough for a comparison after this time.

Discussion & Conclusion
118
6 Discussion & Conclusion
6.1 StreptomeDB
The presented update of StreptomeDB includes, besides the enlargement of the dataset, several
new features that provide easier access to huge amount of knowledge about Streptomycetes
hidden in literature. These new features allow for browsing this data in a chemical, biological,
and evolutionary context.
The new update includes mainly the publications since the first release of StreptomeDB in 2013.
As Figure 15 shows, we could cover nearly all publications available at PubMed and we ensured
high quality of the data by extensive manual curation in addition to the automated screening of
full texts.
The rich diversity of secondary metabolites produced by Streptomycetes is also represented in
the manifold biological activities we could extract from literature. About 40% of all substances
are associated with antibiotic activity. This result was foreseeable for various reasons. Since this
genus is well known for producing a broad variety of antibiotics, it seems straightforward to test
new substances for this activity, especially since these tests are fast and inexpensive. This
probably leads to the report of rather weak activities. Until the end of the sixties, the search for
new antibiotics was a very popular topic, but was then slowly superseded by the search for anti-
cancer drugs. This can also be seen in the high proportion of anti-cancer and cytotoxic activity of
compounds in this dataset. In contrast to antibiotic (33.2%), antiviral (0.4%), or antifungal (4.8%)
compounds, it is unlikely that soil living bacteria have an evolutionary advantage in producing
substances that have a specific effect against human cancer cells. Due to extensive screening for
this activity, suitable substances have been found, even if this may not be their main biological
function.
Almost half of the reported activities cannot easily be assigned to a general group. This includes
very exceptional activities such as effects on the rotting speed of sea wheat or very specific ones
such as the inhibition of a certain enzyme. Since there is no comprehensive ontology of

Discussion & Conclusion
119
secondary metabolites activities yet, it could be an interesting enrichment for the community
and a project for future StreptomeDB updates.
With nearly 70%, the majority of substances for which a synthesis pathway is reported are
polyketides. This is also the generally best studied group of secondary metabolites (94). Since
only a small part of the substances in the StreptomeDB are assigned to a specific synthetic
pathway, it is difficult to say if this result is representative. It is possible that polyketide
synthases are actually the largest and most diverse group of secondary metabolite clusters in
Streptomycetes. However, it is also possible that a large part of the substances could not yet be
assigned to other synthetic pathways, since the methods for their identification are not yet so
well developed.
The phylogenetic tree makes it possible to bring the data of StreptomeDB into a biological or
evolutionary context. It allows easy access to data of closely related strains or strains with gene
clusters of structures with similar chemotypes. The analysis of the publicly available data
showed, that despite major efforts, the quality of many published sequences is still doubtful and
analysis requires strict filtering. Even though, 16S rRNA sequences are the by far most popular
tool to determine evolutionary distance, it still has some drawbacks. For example, the
discriminatory power within one genus can be rather poor (95). Nevertheless, this approach was
the best way to generate a dataset as comprehensive as possible for StreptomeDB.
Although the phylogenetic tree represents only a little more than 300 strains, it covers the
majority of the included substances. Due to decreasing sequencing costs and the resulting
rapidly increasing numbers of published genomes, we hope to be able to further expand this
feature (35).
Due to the newly implemented predicted NMR and MS data, it is now possible to efficiently
support screening for new compounds. They allow for identifying structurally similar substances
or substructures at an early stage, and protect against investing a lot of effort in the rediscovery
of already known structures (96).

Discussion & Conclusion
120
In conclusion, StreptomeDB is a comprehensive source of information about Streptomycetes
and the compounds produced by them (97). It differs from other popular databases of natural
products such as KNAPsACK or NORINE by the extensive networking of the contained data (98,
99). Thanks to the versatile new access possibilities, it offers an ideal starting point and vast
background information for a wide variety of scientific projects, from virtual screening
campaigns to the development of bioengineering strategies.
Discussion & Conclusion
121
6.2 The effect of bldA in Streptomyces calvus
As described in chapter 2.2 bldA is an important pleiotropic regulator that is inter alia
responsible for the induction of the sporulation and induction of secondary metabolism of
several Streptomyces strains (25, 100, 101). This differentiation is accompanied by global
changes of the organism’s metabolic machinery and is commonly referred to as “metabolic
switch” (102). The underlying regulation mechanisms are however far more intricate than just
allowing for the transcription of genes that include the TTA codon that is mediated by the tRNA
encoded by bldA. Several of those genes encode for transcriptional regulators, translational
regulators, or enzymes influencing the conservation or posttranslational modification of
proteins. Understanding these complex regulatory networks is a rich source for bioengineering
approaches and an important step in the development of new strategies in the fight against the
spreading of antibiotic-resistant pathogens (103).
The presented experiment compares Streptomyces calvus in batch liquid cultures in a late state.
One of the strains is expressing a miss folding Leu-tRNA mutant as shown in Figure 6. This ‘bald’
mutant is not capable of differentiating an aerial mycelium or spores. The only secondary
metabolite that could be detected in this culture was the nonribosomal peptide WS9326A. The
culture with the complemented functional bldA gene could reestablish an aerial mycelium and
spore production. WS9326A production was significantly reduced, but additionally the
secondary metabolites Annimycin and Nucleocidin could be detected.
Next generation sequencing and 2D-gelelectrophoresis have been used to gather detailed
information from theses cultures.
To support the analysis of comprehensive effects of bldA, we constructed a genome scale
metabolic model of S. calvus. Such models are powerful tools for the recognition of global
coherences that are otherwise difficult to interpret from mere omic data (104).
A major challenge in the generation of the metabolic model was the reconstruction of
Nucleocidin synthesis, since only little is known about it yet. Especially the fluorination is still a
black box, although research has been carried out on it for years (24, 86). The reactions used in
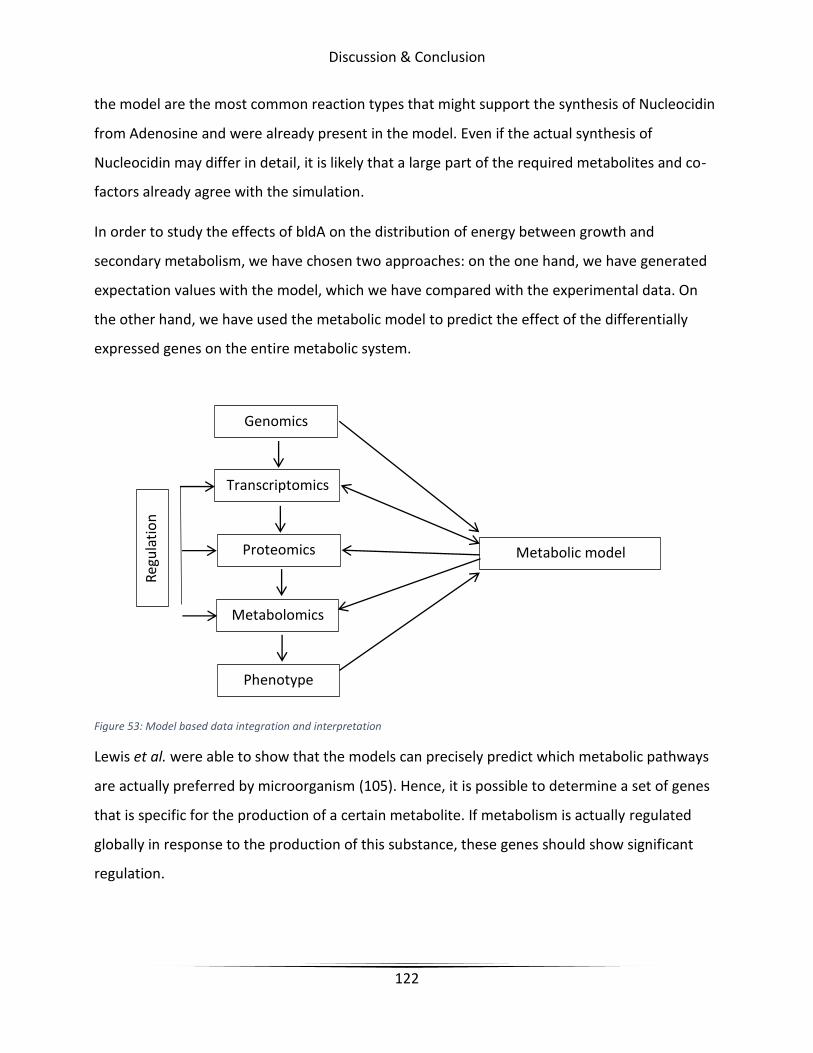
Discussion & Conclusion
122
the model are the most common reaction types that might support the synthesis of Nucleocidin
from Adenosine and were already present in the model. Even if the actual synthesis of
Nucleocidin may differ in detail, it is likely that a large part of the required metabolites and co-
factors already agree with the simulation.
In order to study the effects of bldA on the distribution of energy between growth and
secondary metabolism, we have chosen two approaches: on the one hand, we have generated
expectation values with the model, which we have compared with the experimental data. On
the other hand, we have used the metabolic model to predict the effect of the differentially
expressed genes on the entire metabolic system.
Figure 53: Model based data integration and interpretation
Lewis et al. were able to show that the models can precisely predict which metabolic pathways
are actually preferred by microorganism (105). Hence, it is possible to determine a set of genes
that is specific for the production of a certain metabolite. If metabolism is actually regulated
globally in response to the production of this substance, these genes should show significant
regulation.
Genomics
Transcriptomics
Proteomics
Metabolomics
Phenotype
Metabolic model
Discussion & Conclusion
123
The expression of genes in the predicted groups of primary metabolism presented in Figure 25
and Figure 26 does not support this hypothesis. There are multiple possible reasons for this. Due
to several strong normalization steps that were necessary during the analysis of the gene
expression data and to the lack of replicates, it was not possible to filter the data by statistical
significance. The normal distribution of fold changes within the groups also indicates that
further filtering steps are necessary. Alternatively, it cannot be ruled out that there is actually
no specific regulation towards the production of secondary metabolites. Lastly, it is possible that
the model is not adapted specifically enough to the environmental conditions during expression
of bldA and is including pathways that are unspecific for the simulated phenotype.
In contrast, the proteomics data supports the hypothesis. Apart from three, all detected
proteins of primary metabolism could be allocated to the production of Nucleocidin. This also
includes some proteins that can also be allocated to growth and Annimycin production. 10% of
the proteins are exclusively needed for Nucleocidin production.
The used method to interpret transcriptomic data with the help of a genome-scale metabolic
model is based on two assumptions: The amount of available mRNA controls the amount of
available proteins. The amount of proteins, in return, controls the turnover rates of the
associated reactions. This approach is of course a strong simplification and contains a few
systematical biases. As already shown in this study, protein levels do not necessarily correlate
with gene expression levels. Gene regulation can have different reasons. Despite guiding
metabolite fluxes to a certain pathway, it can also be a reaction to abundance or shortage of a
certain metabolite and does not necessarily have to lead to higher turnover rates.
Additionally, while simulations with experimentally determined endpoints such as biomass
production or sugar uptake are a precise and powerful tool to understand the difficult to
measure fluxes of metabolites within an organism, extrapolations are more difficult to evaluate.
Typically, the simulated results are more efficient than reality. Nevertheless, van Berlo et al.
could demonstrate that especially for drastically regulated genes, these assumptions and the
resulting simulated results are correlating very well with experimental data (106). The method
used in this project uses expression levels as linear adjustments to the constraints of annotated
Discussion & Conclusion
124
reactions. Colijn et al. successfully applied this approach for analysis of the metabolic network
of Mycobacterium tuberculosis under the influence of potential new therapeutics (107).
Due to the lack of experimental data such as growth rate, nutrient uptake or gas exchange, the
predictions are based on reference values from an unrestricted simulation with no experimental
background and should only be considered quantitatively.
Interestingly, this analysis revealed that the regulation of a single essential gene with a global
effect. It is necessary for the generation of folic acid metabolism and therefor controls the
synthesis of DNA and RNA.
In summary, we can observe the influence of bldA at all levels from transcription to phenotype.
In transcription, we can observe the regulation of secondary metabolite gene clusters and
changes in orthologous clusters such as carbohydrate metabolism that indicate an adaption to
changing environmental conditions. Even though we could not find indications for a global
reorganization of primary metabolism in favor of secondary metabolite production, we could
find a pattern in the overexpressed proteins from primary metabolism. Together with the weak
correlation of transcriptomic and proteomic data and the detected specific proteases that play a
role in the modifications of proteins, these results emphasize the important role of post
translational modifications guided by bldA. Especially in context with the predicted general
downregulation of DNA and RNA synthesis and possible starvation conditions after 48 hours of
cultivation, the conservation and specific degradation of proteins gains importance in the
reorganization of the metabolic machinery during morphological differentiation and secondary
metabolite production.
Discussion & Conclusion
125
6.3 adpA regulon in Streptomyces asterosporus
Streptomyces calvus and Streptomyces asterosporus are very close relatives. For example, both
strains contain the rare Nucleocidin gene cluster that has a sequence similarity of over 98%.
It is surprising, that the genomic analysis performed by Songya Zhang indicates, that their bald
phenotype is caused by completely different mutation mechanisms within the same regulative
network. While a point mutation in S. calvus has led to a wrong folding and thus to the loss of
function of a tRNA, a transposon in S. asterosporus has disrupted the promoter site of a
downstream regulation factor. Nevertheless, the phenotypic result is in both strains the same.
The presented results confirm the high quality of genome sequencing. The G+C skew shown in
Figure 32 has a typical pattern with an inversion at the origin of replications. The uniform course
indicates that there were no irregular shifts of bigger sequence blocks during the assembly.
Detailed analysis of the neighboring regions of all transposons in the genome yielded only two
genes in close proximity, but no complete gene disruption.
Genomic analysis revealed more than 500 potential adpA binding sites. This underlines the
global regulatory role of adpA and is consistent with the observed function of adpA in
Streptomyces griseus (108).
Figure 35 demonstrates the high quality of the proteomic profiling of the wildtype strain and a
mutant with restored adpA function. With very high coverage and significance, this dataset
together with the detailed analysis of the adpA binding sites will facilitate the development of
an in-depth understanding of this complex regulon.
Discussion & Conclusion
126
6.4 Enhancing Griseorhodin A expression in Streptomyces
avermitilis SUKA22
As shown in chapter 2.2, 5.4 and 5.5, Streptomycetes have a very complex secondary
metabolism and regulatory network (109). This makes them an interesting resource for new
compounds but also hard to handle as producers of natural compounds. Usually the titers of
produced compounds are very low and sometimes the production is only inducible under very
specific conditions (110). Therefore, researcher are working on genomical minimized strains in
order to increase the production efficiency, reduce complexity of regulatory networks and
minimize the number of unwanted side products. The strain S. avermitilis SUKA22 is an excellent
example of a minimized host strain and that has already proven superior to the natural hosts of
several biogenetic products (2). A minimized host is also a huge benefit for genome-scale
metabolic simulations due to the reduced complexity of the organism. Especially synthesis
pathways for secondary metabolites are strongly affected by regulation mechanisms that can
influence the complete metabolic network. These effects are rarely well described yet and are
difficult to integrate into the simulations. Fortunately, the group of Prof. Dr. Haruo Ikeda has
stripped S. avermitilis SUKA22 of most of its secondary metabolite gene clusters. The popularity
of Streptomyces avermitilis as research topic and as industrial producer is an additional benefit,
since the generation of genome-scale metabolic model depends heavily on published
background information. The available cosmid database is also a great advantage for the
realization of the experimental parts of this project (91).
6.4.1 Minimal medium validation of the model of S. avermitilis SUKA22
Minimal media are ideal for collecting experimental data in order to validate and optimize
metabolic models (111). Their exact composition allows for eliminating a large portion of
uncertainty. The validation approach presented herein was able to efficiently identify several
gaps and errors in the model and thus strongly increase its significance.
Discussion & Conclusion
127
Most of the detected errors were the results of the gap-filling algorithm, which could not close
gaps bigger than two reactions and therefore simply added the required products of the missing
reactions as a nutrient.
The in vitro growth rates on different carbon sources are usually lower and differ more from
each other than in the simulations (112). Since the model does not take enzyme kinetics and
regulatory effects into account, the use of the different carbon sources is probably displayed
unrealistically efficient. Therefore, they have to be compared experimentally.
Although minimal media usually do not achieve as good production results as full media, they
are a good starting point to develop rational strategies with the help of metabolic models to
further improve conventional production media, e.g. by adding certain amino acids. Song et al.
could successfully predict an optimal medium composition for the production of succinic acid in
Mannheimia succiniciproducens with FBA. It did not only increase the production rate by 15%,
but could also reduce the amount of unwanted by-products by 30% (113).
Especially in this project, which aims to reduce the efficiency of certain metabolic pathways,
minimal media are an excellent medium for iteratively validating the generated models.
6.4.2 Knockout candidate identification
Compared to chemical synthesis, biological production of secondary metabolites has an
important efficiency deficiency: the generation of biomass. Most of the energy provided by the
cultivation medium is not used for the production of the desired metabolite but for cell growth.
Secondary metabolites, as their name suggests, are only produced in secondary
importance/priority. As it can be seen in chapter 5.4 and in the results from Nieselt et al.,
bacteria strains have developed a way to reduce cell growth in order to support the production
of secondary metabolites by a so called metabolic switch, for example in a starvation situation
where resources are anyway rare and need to be used efficiently (102).
In this project, we have identified knockout candidates in robust pathways that lead to a
stoichiometrically less efficient synthesis route of certain metabolites. From the assumption that
Discussion & Conclusion
128
the stoichiometrical or resource wise simplest pathway is also the most efficient way in
turnover rates, we can predict that a stoichiometrically less efficient pathway is also slower.
One of the biggest strengths of Flux Balance Analysis (FBA) is the possibility to simulate
metabolic processes within an organism without detailed knowledge of enzyme kinetics. These
predictions are surprisingly accurate as long as you interpolate between experimentally
measured endpoints like the amount of produced biomass and nutrient uptake. Lewis et al.
could demonstrate that E.coli in exponential growth phase actually behaves as predicted by a
genome-scale metabolic model. Thereby, it does not only upregulate genes from the
stoichiometrically most efficient metabolic pathways, but also downregulates ones from
alternative routes (105).
Flux Balance Analysis can only predict the optimal value of a single reaction within the reaction
network. To predict the correlation of biomass production and secondary metabolism, we have
applied an approximation of a multi-objective optimization. The resulting relative solution space
indicates how strongly the two reactions are competing for metabolites. A similar approach is
utilized by OptKnock and MultiMetEval, whereas the underlying idea is differing fundamentally
(55, 114). OptKnock enables the development of strategies how to couple the production of a
desired metabolite to the production of biomass in order to make it a necessary byproduct. The
correlation plot is thereby used to calculate the Pareto-Front of the two reactions, which is the
most efficient production ratio. This is a powerful method for increasing the yield of biogenic
products from primary metabolism. However, the application possibilities for products of
secondary metabolism are limited to optimization of the generation of certain precursors (114).
Zakrzewski et al. used their tool MultiMetEval to compare the production capability of
metabolic networks of different host strains for different secondary metabolites based on a
correlation plot. Besides the comparison of the resulting Pareto-Fronts, they also concluded that
a bigger plateau of these plots indicates a smaller burden on the production of biomass if the
secondary metabolite production is increased (55). Additionally they demonstrated that the
quality of automatically generated models that have barely been revised was already sufficient
to make usable predictions in 2012. Since then, the accuracy of automated reconstruction
Discussion & Conclusion
129
pipelines has significantly increased up to the most recent version of modelSEED that has been
released in 2017 but is not published yet (115).
As mentioned before, we did not focus on increasing of the production of a certain precursor
but on decreasing the efficiency of biomass production in general. For the evaluation of the
proposed knockout mutants, we used an approach that is based on the MultiMetEval method.
However, we used a relative scale for the generation of biomass to be able to better compare
the different results. The size and steepness of the plateau of the plot was compared based on
the resulting AUC value, on the assumption that a lower burden on the production of biomass
per produced unit of secondary metabolite will naturally lead to a higher production of
secondary metabolite in relation to produced biomass.
From all possible knockout mutants, the ∆rpe mutant obtains the highest AUC value and is not
related to the consumption of a certain metabolite that is needed for the generation of
Griseorhodin A. As the reaction predicted to be the driving force behind the reallocation of
resources triggered by bldA, this reactions play a role in the generation of precursors needed for
the synthesis of DNA and RNA. The preliminary experimental results indicate that this mutation
actually obtains the predicted effect. Even though this mutant is slower growing than the
wildtype, it shows a significantly darker coloring on agar plate after two days of cultivation.
Additionally, knockout candidates have been predicted, that have a strong negative effect on
the generation of biomass but not on the Griseorhodin A production. The resulting AUC values
were hereby only of secondary importance. This analysis lead to the prediction of plcA as a
knockout target, which has the strongest impact on the generation of biomass without
decreasing Griseorhodin A production in simulations. This gene is related to a late step in the
generation of ether lipids, which are a part of bacterial membranes. The most interesting
question herein was if reducing the production of a single component of the biomass would
actually lead to the predicted general reduction of growing efficiency. The biomass equation in
the metabolic model is only considering one composition of typical cell components. Therefore,
the decrease of a single component always leads to a general decrease of biomass generation in
simulations, even though e.g. a decrease of peptidoglycan production would only lead to a

Discussion & Conclusion
130
thinner cell wall. The experimental results indicate that the ratio of certain cell components is
actually regulated. As the ∆rpe mutant, the ∆plcA mutant is showing a decreased growing
speed, even though it is not the slowest growing mutant, and a darker coloring than the
unmodified SUKA22 strain.
Even though the preliminary experimental data is difficult to interpret and not quantitatively
exact, it is clearly indicating a successful change of the ratio for produced biomass and
secondary metabolite in favor of Griseorhodin A.
The methods shown in chapter 0 were used to identify reactions that are competing the most
for a certain precursors that is needed for the synthesis of Griseorhodin A. By disrupting
reactions in robust pathways, this method forces the utilization of less efficient alternative
synthesis routes. This does not necessarily change the production rate of a certain metabolite
but shall decrease the efficiency of primary metabolism to utilize it. As in the previous approach,
knockout candidates that had a negative effect on Griseorhodin A production were omitted.
The screening for knockout candidates utilizing NADPH did unfortunately not yield a suitable
candidate. The reactions were either essential, annotated to multiple genes or also negatively
influencing the Griseorhodin A production. In fatty acid synthesis, NADPH is known to be a
constraining precursor and is therefore a prominent target in the development of
overproduction strategies, especially in the biofuel community (116). Even though the
consumption of NADPH is usually lower in the mechanistically very similar polyketide synthesis,
it is probably still a limiting precursor and valuable target. As most of the NADPH dependent
reactions are annotated very unspecifically to several genes, it is probably possible to further
refine these assignments and to identify a candidate after all.
The knockout candidate pyrB is annotated to two different types of reactions in the model. One
that is competing for Malonyl-CoA and one that is playing an important role in the pyrimidine
synthesis pathway. These reactions are catalyzed by related but different carbamoylases. Even
though the knockout of the related reaction did indicate neither their essentiality, nor a strong
impact on the biomass production, the morphology and growing rate of the knockout mutant in
vitro is strongly differing from the other strains. For pyrB was reported to be essential in

Discussion & Conclusion
131
Helicobacter pylori, it is interesting that Streptomyces avermitilis SUKA22 is able to maintain
growth without a functional pyrB gene (92). However, this knockout did probably not disrupt
the predicted reaction and this experiment should be considered for a repetition after a more
specialized screening for the actual gene catalyzing the reaction of interest.
Kbl is catalyzing a reaction that can utilize Acetyl-CoA and Glycine for the generation of
precursors of Threonine. This reaction is reversible and might also contribute to the production
of Acetyl-CoA under the right conditions, for example in a Glycine deficient medium that
contains a high concentration of Threonine. The preliminary experimental results match the
computational predictions and indicate that this reaction is rather consuming Acetyl-CoA in a
complex medium. The ∆kbl mutant showed a growing speed that is indistinguishable from the
unmodified SUKA22 strain, but showed a significantly darker coloring after two days of
cultivation on the agar plate.
Pta is annotated to two classes of reactions in the model. One class is associated to the storage
and mobilization of vitamin A and plays only a minor role in the model simulations. The other
one is a late step in lactic acid fermentation, which leads to the generation of ATP for Acetyl-
CoA. This process is most likely very dependent on environmental conditions. Lactic acid
fermentation is an alternative anaerobic pathway for energy generation, which is less efficient
than cellular respiration and is hence only activated under anaerobic conditions. This is a typical
example for regulation processes that are not sufficiently represented in genome-scale
metabolic models. Surprisingly, this modification leads to an increased biomass production,
whose underlying process could not be elucidated yet and is not correlating to the model
predictions. The experiments do neither indicate an increased Griseorhodin A production.
However, it is possible that this mutant can only show its potential under anaerobic conditions.
FadE4 is catalyzing a reaction that is consuming FAD for the generation of a precursor for the
generation of Valine, Leucine and Isoleucine. As described for the ∆kbl mutant, it is possible that
the effect of this knockout can either be amplified, or reversed by a corresponding media
composition. The measured growth rate is reduced and corresponds to the expectations. The
production rate of Griseorhodin seems to be slightly increased after two days in comparison to
Discussion & Conclusion
132
the unmodified SUKA22 strain. Another remarkable feature of this mutant is, that the knocked
out reaction is positioned at a metabolic bifurcation, where 3-methylbutanoyl-CoA is either
used for amino acid, or terpene backbone synthesis. Although it only shows limited effect on
the production of polyketides, this might be an efficient mutant for the production of terpenes.
RocA is involved in the conversion of Proline, Glutamate, and Arginine. It is catalyzing a
reversible reaction that can either produce NADPH or consume NAD. Therefore, its role might
again be dependent on the media composition. The growing speed of the mutant corresponds
to the in silico predictions. Even though it has the lowest AUC value of all knockout candidates,
preliminary results indicate that this is a potent overproducer of Griseorhodin A.
Figure 48 shows the predicted relative, and Figure 49 shows the absolute correlation of growth
and Griseorhodin A production in SUKA22 and all knockout mutants in comparison. Although all
three methods used could successfully predict overproducers, it is difficult to assess their
potential with the help of the AUC value, apart from the candidate directly determined by the
AUC value. Since, as mentioned above, the effects of many of the candidates are likely to be
strongly influenced by environmental conditions, it can be assumed that the quality and
resolution of the predictions can still be further improved, taking into account the
corresponding experimental data.

Discussion & Conclusion
133
6.4.3 Conclusion & Future perspective
The methods presented here represent a novel tool for the development of metabolic
engineering strategies that aim on the optimization of secondary metabolite production. While
common methods focus on increasing the secondary metabolite production or the production
of precursors needed for their synthesis, we focus on decreasing the efficiency of primary
metabolism and its ability to efficiently utilize those precursors. These different approaches are
likely to complement each other very well. We could predict several promising modifications,
which already proved their potential in preliminary in vitro experiments that will soon be
complemented by detailed quantitative measurements. One of the knockouts is using an
approach that we could also observe in the regulation of the metabolic switch in Streptomyces
calvus by bldA. It limits the production of DNA and RNA, leading to a global downregulation of
the metabolism, which seems to affect secondary metabolite clusters less severely.
Most of the knockout mutants show great potential and versatility. They are not specifically
improving the production of a certain secondary metabolite, but specifically decreasing the
efficiency of primary metabolism or the ability of primary metabolism to utilize a certain
precursor. Though current results indicate that the effect of the modifications is guided by
environmental conditions, we are planning to further explore these properties using the
gathered knowledge to improve our model and thereby gain a deep understanding of the
mechanism guiding metabolic flux.
References
134
7 References
1. Kalan,L., Gessner,A., Thaker,M.N., Waglechner,N., Zhu,X., Szawiola,A., Bechthold,A.,
Wright,G.D. and Zechel,D.L. (2013) A cryptic polyene biosynthetic gene cluster in
Streptomyces calvus is expressed upon complementation with a functional bldA gene.
Chem. Biol., 20, 1214–1224.
2. Komatsu,M., Komatsu,K., Koiwai,H., Yamada,Y., Kozone,I., Izumikawa,M., Hashimoto,J.,
Takagi,M., Omura,S., Shin-ya,K., et al. (2013) Engineered Streptomyces avermitilis host for
heterologous expression of biosynthetic gene cluster for secondary metabolites. ACS Synth.
Biol., 2, 384–96.
3. Yunt,Z., Reinhardt,K., Li,A., Engeser,M., Dahse,H.-M., Gutschow,M., Bruhn,T., Bringmann,G.
and Piel,J. (2009) Cleavage of four carbon−carbon bonds during biosynthesis of the
Griseorhodin A spiroketal pharmacophore. J. Am. Chem. Soc., 131, 2297–2305.
4. Wang,X., Elshahawi,S.I., Cai,W., Zhang,Y., Ponomareva,L. V., Chen,X., Copley,G.C., Hower,J.C.,
Zhan,C.-G., Parkin,S., et al. (2017) Bi- and tetracyclic spirotetronates from the coal mine fire
isolate Streptomyces sp. LC-6-2. J. Nat. Prod., 80, 1141–1149.
5. Li,A., Piel,J., Hopwood,D.., Rawlings,B.., Piel,J., Hertweck,C., Shipley,P.., Hunt,D..,
Newman,M.., Moore,B.., et al. (2002) A gene cluster from a marine Streptomyces encoding
the biosynthesis of the aromatic spiroketal polyketide Griseorhodin A. Chem. Biol., 9, 1017–
1026.
6. Schlimpert,S., Flärdh,K. and Buttner,M. (2016) Fluorescence time-lapse imaging of the
complete S. venezuelae life cycle using a microfluidic device. J. Vis. Exp., 10.3791/53863.
7. McGREGOR,J.F. (1954) Nuclear division and the life cycle in a Streptomyces sp. J. Gen.
Microbiol., 11, 52–6.
8. Zetterström,R. (2007) Selman A. Waksman (1888–1973) Nobel Prize in 1952 for the discovery
of streptomycin, the first antibiotic effective against tuberculosis*. Acta Paediatr., 96, 317–
319.

References
135
9. Procópio,R.E. de L., Silva,I.R. da, Martins,M.K., Azevedo,J.L. de and Araújo,J.M. de (2012)
Antibiotics produced by Streptomyces. Braz. J. Infect. Dis., 16, 466–71.
10. Sladden,M.J. and Hutchinson,P.E. (2017) The BLISTER study: possible overestimation of
tetracycline efficacy. Lancet, 390, 735.
11. Belley,A., Lalonde-Seguin,D., Arhin,F.F. and Moeck,G. (2017) Comparative
pharmacodynamics of single-dose Oritavancin and daily high-dose Daptomycin regimens
against Vancomycin-resistant Enterococcus faecium isolates in an in vitro PK/PD model of
infection. Antimicrob. Agents Chemother., 10.1128/AAC.01265-17.
12. Giricz,Z., Varga,Z. V., Koncsos,G., Nagy,C.T., Görbe,A., Mentzer,R.M., Gottlieb,R.A. and
Ferdinandy,P. (2017) Autophagosome formation is required for cardioprotection by
chloramphenicol. Life Sci., 186, 11–16.
13. Kose,L.P., Gulçin,İ., Özdemir,H., Atasever,A., Alwasel,S.H. and Supuran,C.T. (2015) The
effects of some avermectins on bovine carbonic anhydrase enzyme. J. Enzyme Inhib. Med.
Chem., 10.3109/14756366.2015.1064406.
14. Krenzien,F., ElKhal,A., Quante,M., Biefer,H.R.C., Hirofumi,U., Gabardi,S. and Tullius,S.G.
(2015) A rationale for age-adapted immunosuppression in organ transplantation.
Transplantation, 10.1097/TP.0000000000000842.
15. Bai,T., Zhang,D., Lin,S., Long,Q., Wang,Y., Ou,H., Kang,Q., Deng,Z., Liu,W. and Tao,M. (2014)
Operon for biosynthesis of lipstatin, the Beta-lactone inhibitor of human pancreatic lipase.
Appl. Environ. Microbiol., 80, 7473–83.
16. Chen,W.-J. (2016) Honoring antiparasitics: The 2015 Nobel Prize in Physiology or Medicine.
Biomed. J., 39, 93–97.
17. Landwehr,W., Wolf,C. and Wink,J. (2016) Actinobacteria and MyxobacteriatTwo of the most
important bacterial resources for novel antibiotics. In Current topics in microbiology and
immunology.Vol. 398, pp. 273–302.

References
136
18. Ikeda,H. (2017) Natural products discovery from micro-organisms in the post-genome era †.
Biosci. Biotechnol. Biochem., 81, 13–22.
19. Chater,K.F. (2013) Curing baldness activates antibiotic production. Chem. Biol., 20, 1199–
1200.
20. Thomas,S.O., Singleton,V.L., Lowery,J.A., Sharpe,R.W., Pruess,L.M., Porter,J.N., Mowat,J.H.
and Bohonos,N. Nucleocidin, a new antibiotic with activity against Trypanosomes. Antibiot.
Annu., 1956–1957, 716–21.
21. Chan,K.K.J. and O’Hagan,D. (2012) The rare fluorinated natural products and
biotechnological prospects for fluorine enzymology. In Methods in enzymology.Vol. 516,
pp. 219–235.
22. Murphy,C.D., Schaffrath,C. and O’Hagan,D. (2003) Fluorinated natural products: the
biosynthesis of fluoroacetate and 4-fluorothreonine in Streptomyces cattleya.
Chemosphere, 52, 455–461.
23. Zhu,X.M., Hackl,S., Thaker,M.N., Kalan,L., Weber,C., Urgast,D.S., Krupp,E.M., Brewer,A.,
Vanner,S., Szawiola,A., et al. (2015) Biosynthesis of the fluorinated natural product
Nucleocidin in Streptomyces calvus Is dependent on the bldA-specified Leu-tRNA(UUA)
molecule. Chembiochem, 10.1002/cbic.201500402.
24. Bartholomé,A., Janso,J.E., Reilly,U., O’Hagan,D., Inagaki,K., Urgast,D.S., Krupp,E.M.,
Brewer,A., Vanner,S., Szawiola,A., et al. (2017) Fluorometabolite biosynthesis: isotopically
labelled glycerol incorporations into the antibiotic nucleocidin in Streptomyces calvus. Org.
Biomol. Chem., 15, 61–64.
25. Hackl,S. and Bechthold,A. (2015) The Gene bldA , a regulator of morphological
differentiation and antibiotic production in Streptomyces. Arch. Pharm. (Weinheim)., 348,
455–462.

References
137
26. Higo,A., Horinouchi,S. and Ohnishi,Y. (2011) Strict regulation of morphological
differentiation and secondary metabolism by a positive feedback loop between two global
regulators AdpA and BldA in Streptomyces griseus. Mol. Microbiol., 81, 1607–22.
27. Takano,E., Tao,M., Long,F., Bibb,M.J., Wang,L., Li,W., Buttner,M.J., Bibb,M.J., Deng,Z.X. and
Chater,K.F. (2003) A rare leucine codon in adpA is implicated in the morphological defect of
bldA mutants of Streptomyces coelicolor. Mol. Microbiol., 50, 475–86.
28. Brockmann,H., Lenk,W., Schwantje,G. and Zeeck,A. (1966) The structure of rubromycin.
Tetrahedron Lett., 30, 3525–30.
29. Ivancich,M., Schrank,Z., Wojdyla,L., Leviskas,B., Kuckovic,A., Sanjali,A. and Puri,N. (2017)
Treating cancer by targeting telomeres and telomerase. Antioxidants, 6, 15.
30. Atkinson,D.J. and Brimble,M.A. (2015) Isolation, biological activity, biosynthesis and
synthetic studies towards the rubromycin family of natural products. Nat. Prod. Rep., 32,
811–40.
31. Kanehisa,M., Furumichi,M., Tanabe,M., Sato,Y. and Morishima,K. (2017) KEGG: new
perspectives on genomes, pathways, diseases and drugs. Nucleic Acids Res., 45, D353–
D361.
32. Latendresse,M., Paley,S. and Karp,P.D. (2012) Browsing metabolic and regulatory networks
with BioCyc. Methods Mol. Biol., 804, 197–216.
33. Henry,C.S., DeJongh,M., Best,A.A., Frybarger,P.M., Linsay,B. and Stevens,R.L. (2010) High-
throughput generation, optimization and analysis of genome-scale metabolic models. Nat.
Biotechnol., 28, 977–82.
34. Durot,M., Bourguignon,P.-Y. and Schachter,V. (2009) Genome-scale models of bacterial
metabolism: reconstruction and applications. FEMS Microbiol. Rev., 33, 164–90.
35. Land,M., Hauser,L., Jun,S.-R., Nookaew,I., Leuze,M.R., Ahn,T.-H., Karpinets,T., Lund,O.,
Kora,G., Wassenaar,T., et al. (2015) Insights from 20 years of bacterial genome sequencing.
Funct. Integr. Genomics, 15, 141–61.

References
138
36. Benedict,M.N., Mundy,M.B., Henry,C.S., Chia,N. and Price,N.D. (2014) Likelihood-based gene
annotations for gap filling and quality assessment in genome-scale metabolic models. PLoS
Comput. Biol., 10, e1003882.
37. Hosseini,Z. and Marashi,S.-A. (2017) Discovering missing reactions of metabolic networks by
using gene co-expression data. Sci. Rep., 7, 41774.
38. Cuevas,D.A., Edirisinghe,J., Henry,C.S., Overbeek,R., O’Connell,T.G. and Edwards,R.A. (2016)
From DNA to FBA: How to build your own genome-scale metabolic model. Front.
Microbiol., 7, 907.
39. Raman,K. and Chandra,N. (2009) Flux balance analysis of biological systems: applications
and challenges. Brief. Bioinform., 10, 435–449.
40. Edwards,J.S. and Palsson,B.O. (2000) The Escherichia coli MG1655 in silico metabolic
genotype: its definition, characteristics, and capabilities. Proc. Natl. Acad. Sci. U. S. A., 97,
5528–33.
41. Lovén,J., Orlando,D.A., Sigova,A.A., Lin,C.Y., Rahl,P.B., Burge,C.B., Levens,D.L., Lee,T.I. and
Young,R.A. (2012) Revisiting global gene expression analysis. Cell, 151, 476–482.
42. Montezano,D., Meek,L., Gupta,R., Bermudez,L.E. and Bermudez,J.C.M. (2015) Flux balance
analysis with objective function defined by proteomics data-metabolism of mycobacterium
tuberculosis exposed to mefloquine. PLoS One, 10, e0134014.
43. Toya,Y. and Shimizu,H. (2013) Flux analysis and metabolomics for systematic metabolic
engineering of microorganisms. Biotechnol. Adv., 31, 818–26.
44. Vogel,C. and Marcotte,E.M. (2012) Insights into the regulation of protein abundance from
proteomic and transcriptomic analyses. Nat. Rev. Genet., 13, 227–32.
45. Song,H.-S., Reifman,J. and Wallqvist,A. (2014) Prediction of metabolic flux distribution from
gene expression data based on the flux minimization principle. PLoS One, 9, e112524.
References
139
46. Hyduke,D.R., Lewis,N.E. and Palsson,B.Ø. (2013) Analysis of omics data with genome-scale
models of metabolism. Mol. Biosyst., 9, 167–74.
47. Lerman,J.A., Hyduke,D.R., Latif,H., Portnoy,V.A., Lewis,N.E., Orth,J.D., Schrimpe-
Rutledge,A.C., Smith,R.D., Adkins,J.N., Zengler,K., et al. (2012) In silico method for
modelling metabolism and gene product expression at genome scale. Nat. Commun., 3,
929.
48. Colijn,C., Brandes,A., Zucker,J., Lun,D.S., Weiner,B., Farhat,M.R., Cheng,T.-Y., Moody,D.B.,
Murray,M. and Galagan,J.E. (2009) Interpreting expression data with metabolic flux
models: predicting Mycobacterium tuberculosis mycolic acid production. PLoS Comput.
Biol., 5, e1000489.
49. Kremer,F., Blank,L.M., Jones,P.R. and Akhtar,M.K. (2015) A comparison of the microbial
production and combustion characteristics of three alcohol biofuels: Ethanol, 1-Butanol,
and 1-Octanol. Front. Bioeng. Biotechnol., 3, 112.
50. Khanna,C., Rosenberg,M. and Vail,D.M. (2015) A review of Paclitaxel and novel formulations
including those suitable for use in dogs. J. Vet. Intern. Med., 29, 1006–1012.
51. Meng,Z., Lv,Q., Lu,J., Yao,H., Lv,X., Jiang,F., Lu,A. and Zhang,G. (2016) Prodrug strategies for
paclitaxel. Int. J. Mol. Sci., 17, 796.
52. Tamano,K. (2014) Enhancing microbial metabolite and enzyme production: current
strategies and challenges. Front. Microbiol., 5, 718.
53. Nah,H.-J., Pyeon,H.-R., Kang,S.-H., Choi,S.-S. and Kim,E.-S. (2017) Cloning and heterologous
expression of a large-sized natural product biosynthetic gene cluster in Streptomyces
species. Front. Microbiol., 8, 394.
54. Chen,X., Li,S. and Liu,L. (2014) Engineering redox balance through cofactor systems. Trends
Biotechnol., 32, 337–343.

References
140
55. Zakrzewski,P., Medema,M.H., Gevorgyan,A., Kierzek,A.M., Breitling,R. and Takano,E. (2012)
MultiMetEval: comparative and multi-objective analysis of genome-scale metabolic
models. PLoS One, 7, e51511.
56. Yoshikawa,K., Toya,Y. and Shimizu,H. (2017) Metabolic engineering of Synechocystis sp. PCC
6803 for enhanced ethanol production based on flux balance analysis. Bioprocess Biosyst.
Eng., 40, 791–796.
57. Dang,L., Liu,J., Wang,C., Liu,H. and Wen,J. (2017) Enhancement of rapamycin production by
metabolic engineering in Streptomyces hygroscopicus based on genome-scale metabolic
model. J. Ind. Microbiol. Biotechnol., 44, 259–270.
58. Lucas,X., Senger,C., Erxleben,A., Grüning,B.A., Döring,K., Mosch,J., Flemming,S. and
Günther,S. (2013) StreptomeDB: a resource for natural compounds isolated from
Streptomyces species. Nucleic Acids Res., 41, D1130-6.
59. Lucas,X., Grüning,B.A., Bleher,S. and Günther,S. (2015) The purchasable chemical space: a
detailed picture. J. Chem. Inf. Model., 55, 915–24.
60. Sayers,E.W., Barrett,T., Benson,D.A., Bryant,S.H., Canese,K., Chetvernin,V., Church,D.M.,
DiCuccio,M., Edgar,R., Federhen,S., et al. (2009) Database resources of the National Center
for Biotechnology Information. Nucleic Acids Res., 37, D5-15.
61. Benson,D.A., Cavanaugh,M., Clark,K., Karsch-Mizrachi,I., Lipman,D.J., Ostell,J. and
Sayers,E.W. (2013) GenBank. Nucleic Acids Res., 41, D36-42.
62. Ichikawa,N., Sasagawa,M., Yamamoto,M., Komaki,H., Yoshida,Y., Yamazaki,S. and Fujita,N.
(2013) DoBISCUIT: a database of secondary metabolite biosynthetic gene clusters. Nucleic
Acids Res., 41, D408-14.
63. Medema,M.H., Kottmann,R., Yilmaz,P., Cummings,M., Biggins,J.B., Blin,K., de Bruijn,I.,
Chooi,Y.H., Claesen,J., Coates,R.C., et al. (2015) Minimum Information about a Biosynthetic
Gene cluster. Nat. Chem. Biol., 11, 625–631.
References
141
64. Quast,C., Pruesse,E., Yilmaz,P., Gerken,J., Schweer,T., Yarza,P., Peplies,J. and Glöckner,F.O.
(2013) The SILVA ribosomal RNA gene database project: improved data processing and
web-based tools. Nucleic Acids Res., 41, D590-6.
65. Cock,P.J.A., Antao,T., Chang,J.T., Chapman,B.A., Cox,C.J., Dalke,A., Friedberg,I., Hamelryck,T.,
Kauff,F., Wilczynski,B., et al. (2009) Biopython: freely available Python tools for
computational molecular biology and bioinformatics. Bioinformatics, 25, 1422–3.
66. McWilliam,H., Li,W., Uludag,M., Squizzato,S., Park,Y.M., Buso,N., Cowley,A.P. and Lopez,R.
(2013) Analysis tool web services from the EMBL-EBI. Nucleic Acids Res., 41, W597-600.
67. Tamura,K., Stecher,G., Peterson,D., Filipski,A. and Kumar,S. (2013) MEGA6: Molecular
Evolutionary Genetics Analysis version 6.0. Mol. Biol. Evol., 30, 2725–9.
68. Sukumaran,J. and Holder,M.T. (2010) DendroPy: a Python library for phylogenetic
computing. Bioinformatics, 26, 1569–71.
69. Huerta-Cepas,J., Dopazo,J. and Gabaldón,T. (2010) ETE: a python Environment for Tree
Exploration. BMC Bioinformatics, 11, 24.
70. Siguier,P., Perochon,J., Lestrade,L., Mahillon,J. and Chandler,M. (2006) ISfinder: the
reference centre for bacterial insertion sequences. Nucleic Acids Res., 34, D32-6.
71. Yao,M.D., Ohtsuka,J., Nagata,K., Miyazono,K.-I., Zhi,Y., Ohnishi,Y. and Tanokura,M. (2013)
Complex structure of the DNA-binding domain of AdpA, the global transcription factor in
Streptomyces griseus, and a target duplex DNA reveals the structural basis of its tolerant
DNA sequence specificity. J. Biol. Chem., 288, 31019–29.
72. Szklarczyk,D., Morris,J.H., Cook,H., Kuhn,M., Wyder,S., Simonovic,M., Santos,A.,
Doncheva,N.T., Roth,A., Bork,P., et al. (2017) The STRING database in 2017: quality-
controlled protein-protein association networks, made broadly accessible. Nucleic Acids
Res., 45, D362–D368.
73. The UniProt Consortium (2017) UniProt: the universal protein knowledgebase. Nucleic Acids
Res., 45, D158–D169.
References
142
74. Noé,L. and Kucherov,G. (2005) YASS: enhancing the sensitivity of DNA similarity search.
Nucleic Acids Res., 33, W540-3.
75. Ebrahim,A., Lerman,J.A., Palsson,B.O. and Hyduke,D.R. (2013) COBRApy: COnstraints-Based
Reconstruction and Analysis for Python. BMC Syst. Biol., 7, 74.
76. Aziz,R.K., Bartels,D., Best,A.A., DeJongh,M., Disz,T., Edwards,R.A., Formsma,K., Gerdes,S.,
Glass,E.M., Kubal,M., et al. (2008) The RAST Server: Rapid Annotations using Subsystems
Technology. BMC Genomics, 9, 75.
77. Fritzemeier,C.J., Hartleb,D., Szappanos,B., Papp,B. and Lercher,M.J. (2017) Erroneous
energy-generating cycles in published genome scale metabolic networks: Identification and
removal. PLOS Comput. Biol., 13, e1005494.
78. Zhu,S. and Chen,G. (2016) Explicit numerical solutions of a microbial survival model under
nonisothermal conditions. Food Sci. Nutr., 4, 284–289.
79. Hopwood,D.A., Bibb,M.J., Chater,K.F., Kieser,T., Bruton,C.J., Kieser,H.M., Lydiate,D.J.,
Smith,C.P., Ward,J.M. and Schrempf,H. (1986) Genetic manipulation of Streptomyces: A
laboratory manual Headington Hill Hall.
80. Klementz,D., Döring,K., Lucas,X., Telukunta,K.K., Erxleben,A., Deubel,D., Erber,A.,
Santillana,I., Thomas,O.S., Bechthold,A., et al. (2016) StreptomeDB 2.0—an extended
resource of natural products produced by streptomycetes. Nucleic Acids Res., 44, D509–
D514.
81. Yamada,Y., Kuzuyama,T., Komatsu,M., Shin-Ya,K., Omura,S., Cane,D.E. and Ikeda,H. (2015)
Terpene synthases are widely distributed in bacteria. Proc. Natl. Acad. Sci. U. S. A., 112,
857–62.
82. Law,V., Knox,C., Djoumbou,Y., Jewison,T., Guo,A.C., Liu,Y., Maciejewski,A., Arndt,D.,
Wilson,M., Neveu,V., et al. (2014) DrugBank 4.0: shedding new light on drug metabolism.
Nucleic Acids Res., 42, D1091–D1097.

References
143
83. Cochrane,G., Alako,B., Amid,C., Bower,L., Cerdeño-Tárraga,A., Cleland,I., Gibson,R.,
Goodgame,N., Jang,M., Kay,S., et al. (2013) Facing growth in the European Nucleotide
Archive. Nucleic Acids Res., 41, D30-5.
84. Allen,F., Greiner,R. and Wishart,D. (2014) Competitive fragmentation modeling of ESI-
MS/MS spectra for putative metabolite identification. Metabolomics, 11, 98–110.
85. Langdon,S.R., Brown,N. and Blagg,J. (2011) Scaffold diversity of exemplified medicinal
chemistry space. J. Chem. Inf. Model., 51, 2174–85.
86. Zhu,X.M., Hackl,S., Thaker,M.N., Kalan,L., Weber,C., Urgast,D.S., Krupp,E.M., Brewer,A.,
Vanner,S., Szawiola,A., et al. (2015) Biosynthesis of the fluorinated natural product
Nucleocidin in Streptomyces calvus is dependent on the bldA -specified Leu-tRNA UUA
molecule. ChemBioChem, 16, 2498–2506.
87. Hackl,S. (2017) Untersuchungen zur Biosynthese des nichtribosomalen Peptides WS9326A
und zum Einfluss von BldA auf das Transkriptom und Proteom von Streptomyces calvus.
88. de Windt,F.E. and van der Drift,C. (1980) Purification and some properties of
hydroxypyruvate isomerase of Bacillus fastidiosus. Biochim. Biophys. Acta, 613, 556–62.
89. Lagesen,K., Hallin,P., Rødland,E.A., Staerfeldt,H.-H., Rognes,T. and Ussery,D.W. (2007)
RNAmmer: consistent and rapid annotation of ribosomal RNA genes. Nucleic Acids Res., 35,
3100–8.
90. Barton,M.D., Delneri,D., Oliver,S.G., Rattray,M. and Bergman,C.M. (2010) Evolutionary
systems biology of amino acid biosynthetic cost in yeast. PLoS One, 5, e11935.
91. Ikeda,H., Ishikawa,J., Hanamoto,A., Shinose,M., Kikuchi,H., Shiba,T., Sakaki,Y. and Hattori,M.
(2003) Complete genome sequence and comparative analysis of the industrial
microorganism. Nat. Biotechnol., 21, 526–31.
92. Burns,B.P., Hazell,S.L., Mendz,G.L., Kolesnikow,T., Tillet,D. and Neilan,B.A. (2000) The
Helicobacter pylori pyrB gene encoding aspartate carbamoyltransferase is essential for
bacterial survival. Arch. Biochem. Biophys., 380, 78–84.
References
144
93. Anantharaman,V. and Aravind,L. (2003) Evolutionary history, structural features and
biochemical diversity of the NlpC/P60 superfamily of enzymes. Genome Biol., 4, R11.
94. Cimermancic,P., Medema,M.H., Claesen,J., Kurita,K., Wieland Brown,L.C., Mavrommatis,K.,
Pati,A., Godfrey,P.A., Koehrsen,M., Clardy,J., et al. (2014) Insights into secondary
metabolism from a global analysis of prokaryotic biosynthetic gene clusters. Cell, 158, 412–
421.
95. Janda,J.M. and Abbott,S.L. (2007) 16S rRNA gene sequencing for bacterial identification in
the diagnostic laboratory: pluses, perils, and pitfalls. J. Clin. Microbiol., 45, 2761–4.
96. Tulp,M. and Bohlin,L. (2005) Rediscovery of known natural compounds: Nuisance or
goldmine? Bioorg. Med. Chem., 13, 5274–5282.
97. Weber,T. and Kim,H.U. (2016) The secondary metabolite bioinformatics portal:
Computational tools to facilitate synthetic biology of secondary metabolite production.
10.1016/j.synbio.2015.12.002.
98. Nakamura,Y., Mochamad Afendi,F., Kawsar Parvin,A., Ono,N., Tanaka,K., Hirai Morita,A.,
Sato,T., Sugiura,T., Altaf-Ul-Amin,M. and Kanaya,S. (2013) KNApSAcK Metabolite activity
database for retrieving the relationships between metabolites and biological activities.
Plant Cell Physiol., 55, e7–e7.
99. Caboche,S., Pupin,M., Leclère,V., Fontaine,A., Jacques,P. and Kucherov,G. (2008) NORINE: a
database of nonribosomal peptides. Nucleic Acids Res., 36, D326-31.
100. Chandra,G. and Chater,K.F. (2008) Evolutionary flux of potentially bldA-dependent
Streptomyces genes containing the rare leucine codon TTA. Antonie Van Leeuwenhoek, 94,
111–26.
101. Higo,A., Horinouchi,S. and Ohnishi,Y. (2011) Strict regulation of morphological
differentiation and secondary metabolism by a positive feedback loop between two global
regulators AdpA and BldA in Streptomyces griseus. Mol. Microbiol., 81, 1607–1622.
References
145
102. Nieselt,K., Battke,F., Herbig,A., Bruheim,P., Wentzel,A., Jakobsen,Ø.M., Sletta,H.,
Alam,M.T., Merlo,M.E., Moore,J., et al. (2010) The dynamic architecture of the metabolic
switch in Streptomyces coelicolor. BMC Genomics, 11, 10.
103. Chater,K.F. (2016) Recent advances in understanding Streptomyces. F1000Research, 5,
2795.
104. Kim,M.K. and Lun,D.S. (2014) Methods for integration of transcriptomic data in genome-
scale metabolic models. Comput. Struct. Biotechnol. J., 11, 59–65.
105. Lewis,N.E., Hixson,K.K., Conrad,T.M., Lerman,J.A., Charusanti,P., Polpitiya,A.D., Adkins,J.N.,
Schramm,G., Purvine,S.O., Lopez-Ferrer,D., et al. (2010) Omic data from evolved E. coli are
consistent with computed optimal growth from genome-scale models. Mol. Syst. Biol., 6,
10.1038/msb.2010.47.
106. van Berlo,R.J.P., de Ridder,D., Daran,J.-M., Daran-Lapujade,P.A.S., Teusink,B. and
Reinders,M.J.T. (2011) Predicting metabolic fluxes using gene expression differences as
constraints. IEEE/ACM Trans. Comput. Biol. Bioinforma., 8, 206–216.
107. Colijn,C., Brandes,A., Zucker,J., Lun,D.S., Weiner,B., Farhat,M.R., Cheng,T.-Y., Moody,D.B.,
Murray,M. and Galagan,J.E. (2009) Interpreting expression data with metabolic flux
models: predicting Mycobacterium tuberculosis mycolic acid production. PLoS Comput.
Biol., 5, e1000489.
108. Higo,A., Hara,H., Horinouchi,S. and Ohnishi,Y. (2012) Genome-wide distribution of adpA, a
global regulator for secondary metabolism and morphological differentiation in
Streptomyces, revealed the extent and complexity of the adpA regulatory network. DNA
Res., 19, 259–274.
109. Castro-Melchor,M., Charaniya,S., Karypis,G., Takano,E. and Hu,W.-S. (2010) Genome-wide
inference of regulatory networks in Streptomyces coelicolor. BMC Genomics, 11, 578.
References
146
110. Azman,A.-S., Othman,I., Velu,S.S., Chan,K.-G. and Lee,L.-H. (2015) Mangrove rare
actinobacteria: taxonomy, natural compound, and discovery of bioactivity. Front.
Microbiol., 6, 856.
111. Weaver,D.S., Keseler,I.M., Mackie,A., Paulsen,I.T. and Karp,P.D. (2014) A genome-scale
metabolic flux model of Escherichia coli K-12 derived from the EcoCyc database. BMC Syst.
Biol., 8, 79.
112. Liao,Y.-C., Huang,T.-W., Chen,F.-C., Charusanti,P., Hong,J.S.J., Chang,H.-Y., Tsai,S.-F.,
Palsson,B.O. and Hsiung,C.A. (2011) An experimentally validated genome-scale metabolic
reconstruction of Klebsiella pneumoniae MGH 78578, iYL1228. J. Bacteriol., 193, 1710–7.
113. Song,H., Kim,T.Y., Choi,B.-K., Choi,S.J., Nielsen,L.K., Chang,H.N. and Lee,S.Y. (2008)
Development of chemically defined medium for Mannheimia succiniciproducens based on
its genome sequence. Appl. Microbiol. Biotechnol., 79, 263–272.
114. Burgard,A.P., Pharkya,P. and Maranas,C.D. (2003) Optknock: A bilevel programming
framework for identifying gene knockout strategies for microbial strain optimization.
Biotechnol. Bioeng., 84, 647–657.
115. Newman,J.D., Marshall,J., Chang,M., Nowroozi,F., Paradise,E., Pitera,D., Newman,K.L. and
Keasling,J.D. (2006) High-level production of amorpha-4,11-diene in a two-phase
partitioning bioreactor of metabolically engineered Escherichia coli. Biotechnol. Bioeng.,
95, 684–91.
116. Sheng,J. and Feng,X. (2015) Metabolic engineering of yeast to produce fatty acid-derived
biofuels: bottlenecks and solutions. Front. Microbiol., 6, 554.

Licenses
147
8 Licenses
The use of the following pictures required a license:
Figure 5: License Number: 4245921450913 (John Wiley and Sons)
Figure 6: License Number: 4245930393513 (Elsevier)
Figure 8: License Number: 4245940231732 (Elsevier)
Figure 9: License Number: 4245940535526 (Oxford University Press)

Acknowledgments
148
9 Acknowledgments
I would like to thank everyone without whom it would not have been possible to complete this
dissertation. I would particularly like to thank the following:
Prof. Dr. Stefan Günther for giving me the chance to do a PhD in his group, the opportunity to
work on these exciting projects, and the freedoms and development possibilities he gave to me.
Prof. Dr. Andreas Bechthold for being my co-supervisor, and him and his group for their support
and their expertise that they shared with me.
Prof. Dr. Oliver Einsle for agreeing to be my third examiner.
Dr. Robin Teufel and his group for their support and for giving me the opportunity to work with
the Griseorhodin A gene cluster.
Prof. Dr. Bernd Kammerer and his group for their support, the chance to work on their HPLC
machines and all the coffees.
Prof. Dr. Haruo Ikeda for giving me the chance to work with his outstanding genome minimized
host strain.
Dr. Kersten Döring, Dr. Stefanie Hackl, Dr. Roman Makitrynskyy, and Songya Zhang for our
rewarding collaborations.
My group for the awesome time we spent together.
Everyone who helped me with proofreading and especially Viola Steiert who endured me while I
was writing.
Finally, my parents who always supported me, even though I sometimes forgot to call them
back.
Publications
149
10 Publications
Kiske C†, Erxleben A†, Lucas X, Willmann L, Klementz D, Günther S, Römer W, Kammerer B; „Metabolic pathway monitoring of phenalinolactone biosynthesis from Streptomyces sp. Tü6071 by liquid chromatography/mass spectrometry coupling“– Rapid Communications in Mass Spectrometry, 2014, Vol. 28(13): 1459-67
Klementz D†, Döring K†, Lucas X, Telukunta KK, Erxleben A, Deubel D, Erber A, Santillana I, Thomas OS, Bechthold A, Günther S. „StreptomeDB 2.0—an extended resource of natural products produced by streptomycetes“- Nucleic Acids Research, 2016, Vol. 44: D509-14
Zierep PF, Padilla N, Yonchev DG, Telukunta KK, Klementz D, Günther S; „SeMPI: a genome-based secondary metabolite prediction and identification web server“- Nucleic Acids Research, 2017, Vol. 45(W1): W64-71
Hackl S†, Klementz D†, Simon D, BiniossekM, TokovenkoB, LuzhetskyyA, Koch HG, Oleschuk R, Zechel DL, Günther S, Bechthold A; “BldA, a trigger of antibiotic production in Streptomyces calvus, investigated through combined transcriptomic, proteomic and metabolic analysis”
(in preperation)
Zhang S, Klementz D, Günther S, Bechthold A; “The complete genome sequence of Streptomyces asterosporus DSM 41452, a high producer of the neurokinin A antagonist WS9326A”
(in preperation)
Zhang S, Klementz D, Wang, M, Zhu J,Dumit VI, Günther S, Bechthold A; “Comparative Proteomic Analysis of Streptomyces asterosporus DSM 41452 reveals the adpA regulon in a native non-sporulating Streptomyces species”
(in preperation)
Klementz D†, Makitrynskyy R†, Bechthold A, Gunther S; “Novel Methods for the enhancement of Moenomycin production in Streptomyces avermitilis SUKA22”
(in preperation)
†Contributed equally to this work
Conference contributions
150
11 Conference contributions
Talks
“Metabolic modeling of Griseorhodin A production in Streptomycetes”- International VAAM-Workshop “Biology of Bacteria producing natural Products” 28-30 September 2016, Freiburg
“Simulating and optimizing metabolic flux in Streptomycetes for production of natural products“- RTG-Symposium "Unique cofactor-dependent enzymes in microbes” 12-13 October 2017, Freiburg
Posters
Klementz D, Döring K, Lucas X, Gunther S; “StreptomeDB 2.0: an update“- Directing Biosynthesis IV, 25-27 March 2015, John Innes Centre, Norwich (UK)
Klementz D, Döring K, Lucas X, Telukunta KK, Thomas OS, Gunther S; “The StreptomeDB 2.0 – Knowledge database of secondary metabolites produced by streptomycetes”- Day of Science 2015, Albert-Ludwigs-University Freiburg (posterprize)
Klementz D, Günther S; “Genome-scale metabolic modeling of rubromycin production in a genome-reduced Streptomyces avermitilis strain” RTG Symposium ”Structural Biology ” 15-16 October 2015, Freiburg
Klementz D, Enderle S, Günther S; “Metabolic modeling of Griseorhodin A production in Streptomycetes”- International VAAM-Workshop 28-30 September 2016, Freiburg
Klementz D, Makitrynskyy R, Enderle S, Buhl N, Bechthold A, Gunther S; “Metabolic modeling of griseorhodin A production in Streptomyces avermitilis SUKA22“- Directing Biosynthesis V, 22-24 March 2017, Warwick (UK)
Zhang S, Klementz D, Wang, M, Zhu J,Dumit VI, Günther S, Bechthold A; “Complete genome sequencing and comparative Proteomic Analysis of Streptomyces asterosporus DSM 41452 reveals the adpA regulon in a native non-sporulating Streptomyces species” International VAAM-Workshop 27-29 September 2017, Tübingen