compugroup medical ag - handelsblattircenter.handelsblatt.com/download/companies... ·...
TRANSCRIPT

CompuGroup Medical AGFinancial Report 1 January – 31 March 2015

Contents
Key Events and Figures . . . . . . . . . . . . . . . . . . . . . . . . . . . . . . . 1
Management report . . . . . . . . . . . . . . . . . . . . . . . . . . . . . . . . . . 2
The CGM Group . . . . . . . . . . . . . . . . . . . . . . . . . . . . . . . . . . . . . . . .2Course of Business . . . . . . . . . . . . . . . . . . . . . . . . . . . . . . . . . . . . . .2Post Balance Sheet Events . . . . . . . . . . . . . . . . . . . . . . . . . . . . . . . .4Results of Group Operations . . . . . . . . . . . . . . . . . . . . . . . . . . . . . .5Report on Expected Developments . . . . . . . . . . . . . . . . . . . . . . . . .8Report on Opportunities and Risks . . . . . . . . . . . . . . . . . . . . . . . . .9
Interim Statement of Financial Position . . . . . . . . . . . . . . . . . . . 10
Interim Income Statement . . . . . . . . . . . . . . . . . . . . . . . . . . . . . 12
Interim Statement of Comprehensive Income . . . . . . . . . . . . . 13
Interim Cash Flow Statement . . . . . . . . . . . . . . . . . . . . . . . . . . 14
Interim Changes in Consolidated Equity . . . . . . . . . . . . . . . . . . 15
Explanatory notes . . . . . . . . . . . . . . . . . . . . . . . . . . . . . . . . . . . . 16
Additional Information . . . . . . . . . . . . . . . . . . . . . . . . . . . . . . . . 26
Financial Calendar 2015 . . . . . . . . . . . . . . . . . . . . . . . . . . . . . . . . . .26Share information . . . . . . . . . . . . . . . . . . . . . . . . . . . . . . . . . . . . . . .26Contact . . . . . . . . . . . . . . . . . . . . . . . . . . . . . . . . . . . . . . . . . . . . . .26
Management Responsibility Statement . . . . . . . . . . . . . . . . . . . 27

Key Events and Figures
+ First quarter revenue of EUR 132 .3 million, an increase of 8 percent compared to the same period in 2014 + Organic growth of 3 percent + Operating profit (EBITDA) of EUR 28 .5 million, up from EUR 22 .0 million last year + Operating margin of 22 percent, up from 18 percent last year + Telematics Infrastructure project in Germany on track + Market position in South Africa strengthened through the acquisition of MedEDI + Market position in Belgium strengthened through the acquisition of Compufit + 2015 guidance reaffirmed
01 .01-31 .03 01 .01-31 .03EUR ́ 000 2015 2014 Change
Revenue 132,337 122,067 8%
EBITDA 28,502 21,966 30%
margin 22% 18%
EBITA 26,609 20,025 33%
margin 20% 16%
EPS (EUR) 0 .42 0 .10
Cash net income (EUR)* 29,010 11,986
Cash net income per share (EUR) 0 .58 0 .24 143%
Cash flow from operating activities 43,310 40,187
Cash flow from investing activities -24,368 -30,646
of which equity acquisitions -18,147 -23,551
Number of shares outstanding (‘000) 49,724 49,724
Net debt 316,233 289,019
* Cash net income: net income before minority interests plus amortization of intangible assets except amortization on in-house capitalized software .
1

Management report
THE CGM GROUPCompuGroup Medical AG Group (CGM) develops and sells efficiency- and quality-enhancing software as well as information techno-logy services exclusively for the healthcare sector . The company plays a leading role in the development of global e-health solutions and enjoys market leadership in Germany as well as in other key European countries . CGM’s software products and related services are designed to support all medical and organizational activities in doctors’ offices, medical laboratories, pharmacies, hospitals and other provider organizations . Its information services for health insurance companies and pharmaceutical producers contribute towards safer and more efficient healthcare . The company’s services are based on a unique customer base of doctors, dentists, hos-pitals and pharmacies, as well as other service providers in healthcare .
CGM is currently represented with offices and employees in 19 countries . According to internal figures, CGM has software main-tenance contracts in the HPS I segment (AIS and PCS) corresponding to approximately 250,000 healthcare professionals (doctors, dentists and pharmacists) . Total reach across all segments is estimated at approximately 400,000 healthcare professionals .
The Group had an average of 4,029 full-time equivalent employees during the first quarter of 2015 (previous year: 3,937) .
COURSE OF BUSINESSThe following sections describe the main operational developments during the first quarter of 2015 .
Ambulatory Information Systems The doctor and dental software business in Europe started the year with 2 percent year-on-year organic growth at constant ex-change rates in the first quarter . The Telematics Infrastructure and Electronic Health Card (eGK) project in Germany recognized lower revenue compared to the same period last year and outside of this project the European AIS business recorded 4 percent organic growth at constant exchange rates .
In the United States, the revenue side of the business has reached a turning point following the transition to a more subscription based business model and the ending of some legacy product lines during 2014 . In local currency, revenue was mostly flat year-on-year at USD 11 .0 million in the first quarter 2015 . Due to the significant strengthening of the US dollar, reported revenue in the US grew 18 percent from EUR 8 .3 million in the first quarter 2014 to EUR 9 .8 million in the same period this year .
Telematics Infrastructure and Electronic Health Card (eGK)At the Berlin trade fair conhIT in April, CGM showed live for the first time the insured master data update (VSDM) based on the eGK . With the official presentation of the fully secure online connection at conhIT, CGM showed that an important milestone has been reached for a successful rollout to test the Telematics Infrastructure in the pilot region North / West . CGM has already recruited all required doctors to participate in the pilot and the interest in the project from the provider side has been stronger than expected . The testing of all participants is now expected in Q3 2015 with commissioning and certification of all relevant components and pro-cesses having been completed beforehand . According to current planning, the testing of the qualified electronic signature (QES) will be tested alongside the testing of VSDM .
After successful completion of the testing and parallel evaluation the Telematics Infrastructure network will be ready for the nation-wide connection of all clinics and hospitals in Germany .
The Telematics Infractructure is a long-term growth opportunity for CGM and the pilot project is only the first stage in a transfor-mation to a significantly higher revenue opportunity . With a potential full rollout (est . begin 2016) CGM has the opportunity to sell new eGK-compliant online access products to all existing customers in Germany: ~44,200 doctors offices (69,400 doctors), ~15,000 dentists offices (19,800 dentists), ~4,000 pharmacies (8,000 pharmacists), ~100 hospitals, ~300 rehabilitation centers and ~550 so-cial care institutions . Even more important; the Telematik Infrastructure fits perfectly with CGMs strategy to provide more products and services to its customers, such as eServices, ePrescriptions, eLabOrder, physician networks, online clinical pathways, hosting services etc .
International Dental Show, Cologne, GermanyEvery two years, the International Dental Show (IDS) in Cologne is the top event for the international dental market . Also at this year‘s IDS from 10 to 14 March 2015, the stand of CGM showed the latest innovations and value-added products and services for visitors . This was assured by the unveiling of the latest generation of CGM’s dental information system presented exclusively at this year‘s IDS – the CGM Z1 PRO . The design and functionality of this upgrade received a high level of booth visitors’ praise and was an excellent basis for many contracts signed at the fair .
CompuGroup Medical AG Financial Report for the period 1 January - 31 March 20152

Acquisition of MedEDI Pty Ltd, South AfricaIn January, the 100 percent owned subsidiary of CGM AG, CGM South Africa Pty Ltd, completed a transaction to acquire all shares in MedEDI Pty Ltd (“MedEDI”) . The primary business activities of MedEDI are development, sale and support of MedEDI Practice Management Application software as well as bill switching to Medical Insurers (electronic bill transfer and associated services) . The company also sells complimentary products such as Electronic Health Records to its customers . MedEDI operates from office loca-tions in Margate (headquarter), Pretoria and Cape Town . Through this acquisition, CGM has considerably strengthened its market position in South Africa . The total turnover of MedEDI was in 2014 approximately EUR 6 million with an EBITDA of approximately EUR 2 million .
Acquisition of Compufit Bvba, BelgiumIn March, CGM AG completed a transaction to acquire all shares in of Compufit Bvba, a market leader in software for physiothe-rapists as well as rehabilitation clinics . With this acquisition, CGM will now serve 50% of the physiotherapists as well as 30% of the rehabilitation clinics in Belgium . Compufit is with 6,000 customers number one in these markets . Out of 141 Belgian hospitals which offer rehabilitation, 44 use Compufit‘s software product . Additionally, it sells hardware and other products . The total turnover of Compufit was in 2014 approx . EUR 2 million with an EBITDA of EUR 0 .2 million .
Acquisition of BS Concept Realization BV, The NetherlandsIn March, CompuGroup Medical Holding Cooperatief UA, a 100 percent owned subsidiary of CGM AG, concluded a transaction to acquire BS Concept Realization BV based in Hilversum/The Netherlands . With this acquisition, CompuGroup Medical enters the new upcoming market of software services for homecare . BS Concept Realization, with its software product „Zorgverband“, is the Dutch market leader in communication products between healthcare professionals and patients in homecare together with their family members . Recent legislation in The Netherlands confirms the tendency towards patients staying at home for a longer period while increasing the participation of patients/clients and their families in the care at home . The Zorgverband system supports both professional and non-professional caregivers, thus providing for more efficiency in health care .
Pharmacy Information Systems The pharmacy software business started the year with 3 percent year-on-year organic in the first quarter 2015 and a further 18 per-cent growth contribution from the new companies in Italy which were acquired in July and September 2014 (farma3tec, Mondofarma and Puntofarma) . A new add-on product „CGM METIS“ is an important growth driver in the German market for 2015 . CGM METIS is a business intelligence solution that supports pharmacies, branches and branch networks in all key business decisions . Whether purchasing, inventory , sales, marketing or staff - with CGM METIS pharmacist are not only fully informed, they are also provided in-depth analyzes and forecasts which put them in a position to control the pharmacy optimally in all areas .
Hospital Information Systems In the hospital segment, the start to 2015 has been according to the plans with 2 percent organic growth at constant exchange rates . Good growth is seen in Poland and other markets in Eastern Europe, whereas the markets in Austria, Switzerland and Germany have gone through a phase of transition both in terms of specific customer projects and in terms of product and market focus with lower revenue in the first quarter compared with the same period last year . In Switzerland, significant resources have been allocated to delivery projects for early adopters of the new software generation “G3” from CGM . The extraordinary efforts to ensure a successful deployment and commissioning with the first G3 hospital customers will continue also in the following quarters in 2015 .
Focusing of the German HIS businessThe add-on modules in areas of accounting, controlling and business intelligence (Rechnungswesen & Controlling – ‘REWE’) as well as document management software / electronic archiving solutions (Document Management Solutions – ‘DMS’) were sold to a strategic buyer in December 2014 . Beginning in 2015, the new product owner of REWE and DMS will maintain the current products and in parallel develop a new product generation based on web-technology to offer the CGM customers .
Communication & Data The Communication & Data business starts 2015 with 6 percent organic growth . The positive development is a result from an incre-ased number of projects in medical value communication for originator companies (e .g . vaccination reminders, genetic classification of patients, drug safety alerts, value tracking for stroke risk patients etc .) .
3

Workflow & Decision Support The workflow & decision support business starts 2015 with -9 percent organic revenue contraction . Several projects which contribu-ted to revenue in 2014, such as the cooperation between CGM and Microsoft on mobile healthcare applications and the develop-ment of an electronic invoicing solution for privately insured patients together with IBM, were not replaced or followed-up this year . Some new workflow & decision support contracts have also been signed, but the pace of such new business is slow with long sales and implementation cycles .
Internet Service ProviderThe Internet Service Provider business starts 2015 with 41 percent organic growth . The positive development is a result from more revenue recognized in the Telematics Infrastructure and Electronic Health Card (eGK) project in Germany (24 percent growth contri-bution) as well as growth from more value added services to the existing ISP customers in France (17 percent growth contribution) . Overall, the development of the ISP business is positive with many growth opportunities ahead, especially in Germany .
Other segments and corporate headquarterAt its meeting on 19 March 2015, the Supervisory Board of CGM AG decided to expand the Management Board with the function of process and efficiency management . At the same time, Frank Brecher was appointed in the new position as Chief Process Officer with effect from 1 April 2015 . In addition to the CEO and company founder Frank Gotthardt, Brecher will be the fourth member of the board together with Christian B . Teig (Chief Financial Officer) and Uwe Eibich (manager of DA-CH region) .
45 year-old Frank Brecher has been with CompuGroup Medical since 1998 . During his time at CGM, he occupied different manage-ment positions in the Group‘s dental software business . Starting in 2007, he was responsible for CGM‘s business in the hospital, cli-nic and rehabilitation sector in Germany . In 2011, Mr . Brecher was a key manager involved in the acquisition of LAUER-FISCHER and played a vital role in the successful integration of this new subsidiary in CGM within only a few months . Since April 2014, Mr . Brecher has been responsible for the leadership and coordination of the worldwide rollout of CGM‘s new uniform IT platform „OneGroup IT“ which includes SAP ERP and SAP CRM .
POST BALANCE SHEET EVENTSAcquisition of Stock Informatik GmbH & Co KG, GermanyIn May, CompuGroup Medical Deutschland AG, a 100 percent owned subsidiary of CGM AG, acquired the company „Stock Informa-tik GmbH & Co KG“ headquartered in Fröndenberg/Ruhr . Stock Informatik is the market leader for software services in occupational medicine, preventative medicine and occupational safety in Germany . The comprehensive software suite „ISIS“ supports companies in the prevention and active care regarding the health of their employees and is used in numerous institutions ranging from clinics and businesses to major corporations . As a European specialist, Stock Informatik also offers its solutions in Switzerland and Austria . The total turnover of Stock Informatik was in 2014 approx . EUR 3 .0 million with an EBITDA of EUR 0 .9 million .
Management Report Continued
CompuGroup Medical AG Financial Report for the period 1 January - 31 March 20154

RESULTS OF GROUP OPERATIONSUnless stated otherwise, all figures in the management report refer to the first quarter of 2015 and 2014 respectively, i .e . the three month period 01 .01 – 31 .03 (Q1) .
RevenueRevenue in the first quarter of 2015 was EUR 132 .3 million compared to EUR 122 .1 million in the same period last year . This corre-sponds to 8 percent growth . Acquisitions give a 5 percent contribution to growth and organic growth was 3 percent (2 percent at constant exchange rates) .
In the HPS I segment, first quarter revenue was EUR 100 .5 million compared to EUR 90 .2 million in 2014 . This corresponds to 11 per-cent growth . Acquisitions contribute EUR 7 .3 million to revenue and organic growth was 3 percent (2 percent at constant exchange rates) . First quarter revenue in Ambulatory Information Systems (AIS) was EUR 78 .4 million compared to EUR 72 .0 million in 2014 . This corresponds to 9 percent growth of which organic growth was 3 percent (2 percent at constant exchange rates) . First quarter revenue in Pharmacy Information Systems (PCS) was EUR 22 .0 million compared to EUR 18 .2 million in 2014 . This represents 21 percent growth of which 3 percent is organic growth .
HPS I revenue development (including acquisitions and exchange rate effects):01 .01-31 .03 01 .01-31 .03
EUR m 2015 2014 Change
Ambulatory Information Systems 78 .4 72 .0 9%
Pharmacy Information Systems 22 .0 18 .2 21%
SUM 100 .5 90 .2 11%
In the HPS II segment, the year-on-year organic contraction in Hospital Information Systems (HIS) was -4 percent going from the first quarter 2014 to 2015 . Adjusted for the revenue related to the REWE/DMS product areas, which were sold in 2014, the organic growth was 3 percent (2 percent at constant exchange rates) .
HPS II revenue development (including divestitures and exchange rate effects):01 .01-31 .03 01 .01-31 .03
EUR m 2015 2014 Change
Hospital Information Systems 17 .1 17 .8 -4%
SUM 17 .1 17 .8 -4%
In the HCS segment, revenue was EUR 14 .8 million compared to EUR 14 .0 million in the first quarter 2014 . This represents an increase of approximately 5 percent, all of which is organic growth (4 percent at constant exchange rates) .
HCS revenue development (including exchange rate effects):01 .01-31 .03 01 .01-31 .03
EUR m 2015 2014 Change
Communication & Data 5 .1 4 .8 6%
Workflow & Decision Support 6 .0 6 .6 -9%
Internet Service Provider 3 .7 2 .6 41%
SUM 14 .8 14 .0 5%
Changes to currency exchange rates increased Group revenue by EUR 1 .7 million going from the first quarter of 2014 to the first quarter of 2015 .
5
ProfitConsolidated EBITDA amounted to EUR 28 .5 million compared to EUR 22 .0 million in the first quarter of 2014 . The corresponding operating margin was 21 .5 percent compared to 18 .0 percent in 2014 . The main developments in operating expenses were:
+ Expenses for goods and services increase EUR 0 .8 million year-on-year with a gross margin of 82 percent, which is 1 percent higher than in the first quarter last year . The slight change in gross margin represents normal business fluctuations .
+ Personnel expenses are up 3 percent from last year at EUR 62 .3 million (first quarter 2014: 60 .6 million) . In relationship to re-venue, personnel expenses have dropped from 50 percent in the first quarter last year to 47 percent this year . This efficiency improvement is consistent with the restructuring measures performed in 2014 and also the main driver behind the improved Group profitability .
+ Other expenses are EUR 1 .1 million higher than last year at EUR 20 .6 million (first quarter 2014: 19 .5 million) . The ratio of other expenses to revenue is stable at around 16 percent .
Depreciation of tangible fixed assets in the first quarter is mostly unchanged from last year at EUR 1 .9 million . Amortization of int-angible fixed assets went from EUR 8 .0 million in 2014 to EUR 8 .6 million in 2015 . This is primarily driven by the amortization of int-angible assets related to companies acquired during the last 12 months as well as adjustments to the useful life of intangible assets and changes in foreign exchange rates .
Financial income increased from EUR 0 .5 million in the first quarter 2014 to EUR 14 .8 million this year due largely to changes in cur-rency exchange rates which lead to non-cash translation gains on Group internal debt .
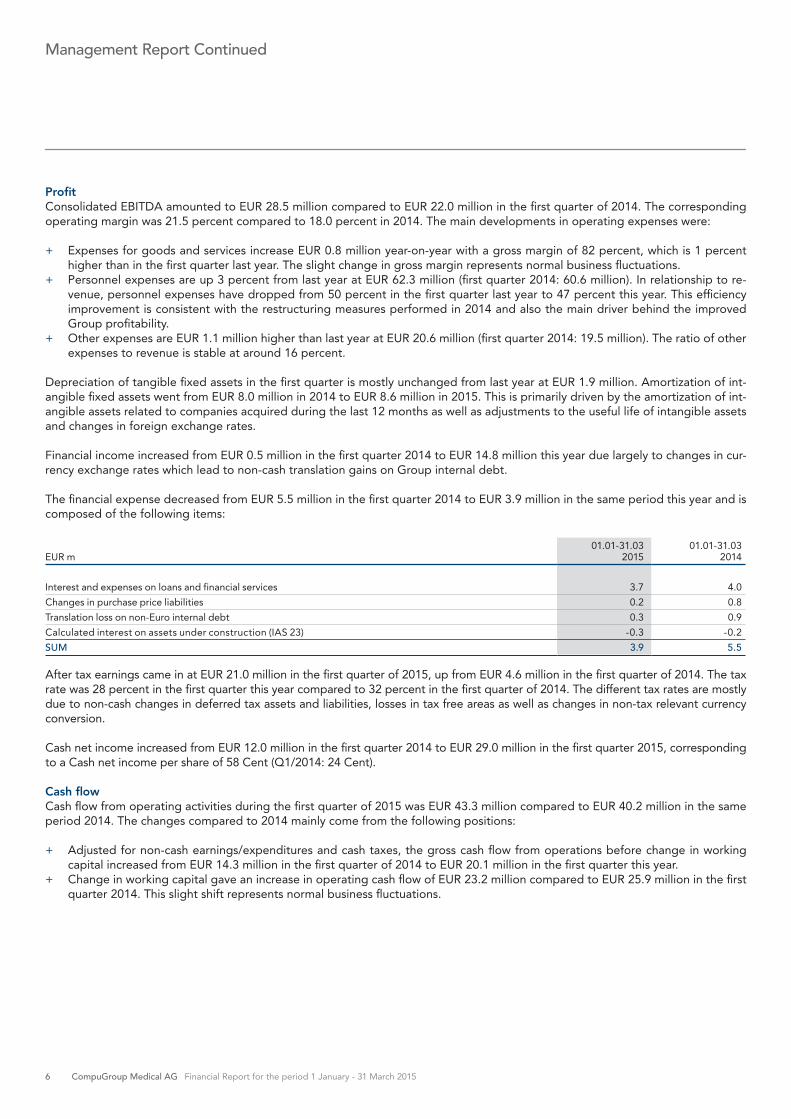
The financial expense decreased from EUR 5 .5 million in the first quarter 2014 to EUR 3 .9 million in the same period this year and is composed of the following items:
01 .01-31 .03 01 .01-31 .03EUR m 2015 2014
Interest and expenses on loans and financial services 3 .7 4 .0
Changes in purchase price liabilities 0 .2 0 .8
Translation loss on non-Euro internal debt 0 .3 0 .9
Calculated interest on assets under construction (IAS 23) -0 .3 -0 .2
SUM 3 .9 5 .5
After tax earnings came in at EUR 21 .0 million in the first quarter of 2015, up from EUR 4 .6 million in the first quarter of 2014 . The tax rate was 28 percent in the first quarter this year compared to 32 percent in the first quarter of 2014 . The different tax rates are mostly due to non-cash changes in deferred tax assets and liabilities, losses in tax free areas as well as changes in non-tax relevant currency conversion .
Cash net income increased from EUR 12 .0 million in the first quarter 2014 to EUR 29 .0 million in the first quarter 2015, corresponding to a Cash net income per share of 58 Cent (Q1/2014: 24 Cent) .
Cash flowCash flow from operating activities during the first quarter of 2015 was EUR 43 .3 million compared to EUR 40 .2 million in the same period 2014 . The changes compared to 2014 mainly come from the following positions:
+ Adjusted for non-cash earnings/expenditures and cash taxes, the gross cash flow from operations before change in working capital increased from EUR 14 .3 million in the first quarter of 2014 to EUR 20 .1 million in the first quarter this year .
+ Change in working capital gave an increase in operating cash flow of EUR 23 .2 million compared to EUR 25 .9 million in the first quarter 2014 . This slight shift represents normal business fluctuations .
Management Report Continued
CompuGroup Medical AG Financial Report for the period 1 January - 31 March 20156

Cash flow from investment activities during the first quarter of 2015 amounted to EUR –24 .4 million compared to EUR -30 .6 million in the same period last year . During the first quarter of 2015, CGM’s capital expenditure consisted of the following:
01 .01-31 .03 01 .01-31 .03EUR m 2015 2014
Company acquisitions 18 .1 23 .6
Purchase of minority interest and past acquisitions 1 .0 0 .0
Capitalized in-house services and other intangible assets 4 .6 4 .5
Office buildings and property 0 .1 0 .5
Other property and equipment 0 .6 2 .1
SUM 24 .4 30 .6
Cash flow from financing amounted to EUR -16 .4 million in the first quarter 2015 (previous year: EUR -6 .4 million) and relates to the net cash outflow from repayment of loans .
Statement of financial positionSince the statement of financial position from 31 December 2014, total assets increased by EUR 59 .9 million to EUR 796 .5 million as at 31 March 2015 . The largest changes to individual asset classes are a EUR 30 .0 million increase in intangible assets and a EUR 21 .4 million increase in trade receivables . The increase in intangible assets comes from new acquisitions and the increase in trade receivables is seasonal for the first quarter . For all other assets there are only minor changes during the first quarter of 2015 .
Group equity was EUR 194 .7 million as at 31 March 2015, up from 177 .8 million as at 31 December 2014 . The increase in equity comes after consolidating EUR 21 .0 million in net profit for the period from 01 January 2015 to 31 March 2015 less EUR 4 .1 million from the equity effect from changes in currency exchange rates and change in interest rates (actuarial gains and losses from pensi-ons) . The equity ratio is at 24 .4 percent as at 31 March 2015 .
The biggest changes to liabilities are decreases in long and short term debt of EUR 15 .7 million and a EUR 48 .5 million increase in current non-financial liabilities mostly related to seasonal pre-payments of software maintenance contracts balanced under other liabilities .
Reasearch & DevelopmentUnder IAS 38, development work on internally generated software must be capitalized if certain criteria are fulfilled . This generated EUR 2 .3 million additional operating profit for the Group during the first quarter of 2015 (previous year EUR 2 .5 million), less amor-tization and write-downs of EUR 0 .5 million during the same period (previous year EUR 0 .6 million) . Most of the capitalized software development expenses are accounted for by two projects, G3 .HIS (new HIS system development) and G3 .AIS (new AIS software generation) . Upon completion, the software will be amortized based on its useful life .
7

REPORT ON EXPECTED DEVELOPMENTSIn summary, CompuGroup Medical reaffirms the outlook presented in the 2014 Annual Report published 31 March 2015 . In additi-on, revenue from acquisitions made subsequent to this guidance (Compufit, Zoergverband and Stock Informatik) is expected to be approximately EUR 4 million in 2015 with no significant EBITDA contribution net of transaction and integration expenses .
Total Group revenue is in 2015 expected to be in the range of EUR 549 million to EUR 559 million, corresponding to a growth rate of 7-9 percent . Acquisitions and divestitures completed to date are expected to give a growth contribution of EUR 22 million and organic growth is expected to be 3-4 percent .
Revenue in the HPS I segment is expected to be in the range of EUR 415 million to EUR 421 million, corresponding to a growth rate of 11-12 percent . Acquisitions completed to date are expected to give a growth contribution of approximately EUR 27 million and organic growth is expected to be 3-5 percent . AIS revenue is expected to be in the range of EUR 324 million to EUR 329 million in 2015 . Acquisitions in AIS completed to date are expected to give a growth contribution of approximately EUR 17 million and organic growth is expected to be 3-5 percent . PCS revenue is expected to be in the range of EUR 91 million to EUR 92 million . Acquisitions in PCS completed to date are expected to give a growth contribution of approximately EUR 10 million and organic growth is expected to be 2-4 percent .
Revenue in the HPS II segment is expected to be in the range of EUR 73 million to EUR 75 million, corresponding to a contraction of 5-8 percent . The divestiture of the REWE/DMS product areas in Germany is expected to reduce revenue with approximately EUR 5 million in 2015 and the corresponding organic growth is expected to be around zero . The stagnant market for add-on projects for existing customers and new clients experienced during 2014 is expected to continue also in 2015 .
Revenue in the HCS segment is expected to be in the range of EUR 61 million to EUR 63 million in 2015 . This corresponds to 2-5 percent growth, all of which is organic growth . Revenue within Communication & Data is expected to be in the range of EUR 20 million to EUR 21 million, Workflow & Decision Support in the range of EUR 26 million to EUR 27 million and Internet Service Provider to be approximately EUR 15 million .
In terms of profitability, the investments and extra expenses carried during 2014 have created a more efficient cost base . Therefore, 2015 is expected to be a year of margin expansion relative to 2015 with operating margin (EBITDA margin) expected to be in the range of 21-22 percent . The corresponding EBITDA is expected to be in the range of EUR 115 million to EUR 125 million .
Depreciation of fixed assets is on Group level expected to be approximately EUR 8 million in 2015 and amortization of intangible assets is expected to be approximately EUR 34 million, of which EUR 30 million will come from amortization of purchase price allo-cations related to past acquisitions . The corresponding Group earnings before interest and tax (EBIT) is in 2015 expected to be in the range of EUR 73 million to EUR 83 million .
In summary, CompuGroup Medical reaffirms the following guidance for 2015:
+ Group revenue is expected to be in the range of EUR 549 million to EUR 559 million . + Group operating income (EBITDA) is expected to be in the range of EUR 115 million to EUR 125 million .
The foregoing outlook is given as at May 2015 and does not include revenue and costs associated with potential and currently un-determined further acquisitions during 2015 . The outlook for 2015 represents management’s best estimate of the market conditions that will exist in 2015 and how the business segments of CompuGroup Medical will perform in this environment .
Management Report Continued
CompuGroup Medical AG Financial Report for the period 1 January - 31 March 20158

REPORT ON OPPORTUNITIES AND RISKSAs an internationally operating company, CompuGroup Medical is subject to variety of different risks . These risks mainly include strategic and macroeconomic risks as well as operating, legal and political risks . Furthermore, the group is faced with risks resulting from its project-business, risks related to key personnel and financial risks .
The group’s technological expertise and market knowledge makes it possible to assess risk and apply appropriate measures to actively manage the risk exposure . To guarantee a responsible risk handling, CompuGroup works with standardized, group-wide integrated risk management system so that risks can be identified and analyzed at an early stage . A detailed description of the main risks and the specific structure of the risk management system can be found in the CompuGroup Medical AG annual report of 2014 . It can be downloaded free of charge from the company’s homepage at www .cgm .com .
With the exception of the factors described under “Financial and Operational Review”, we see no changes compared to the risk and opportunities described in the group management report for the financial year 2014 . Risks that may impact the company as a going concern were not evident during the first quarter of 2015, neither in form of individual risks nor from the total risk position for CompuGroup Medical as a whole .
9

Interim Statement of Financial Position as at 31 March 2015
ASSETS
31 .03 .2015 31 .03 .2014 31 .12 .2014 EUR '000 EUR '000 EUR '000
Non-current assets Intangible assets 547,529 503,657 517,541Tangible assets 62,001 61,932 62,054Financial assets
Interests in affiliates (valued as equity) 854 642 854Other Investments 185 130 140
Trade receivables 8,068 8,959 8,332Other financial assets 2,966 1,195 2,789Derivative financial instruments 0 6,056 0Deferred taxes 2,657 2,709 2,442
624,259 585,280 594,152
Current assets Inventories 6,730 5,774 5,877Trade receivables 117,839 95,497 96,760Other financial assets 3,286 3,198 3,635Other non-financial assets 14,112 7,883 9,496Income tax claims 5,730 8,959 5,133Securities (recognized as profit of loss as fair value) 103 174 95Cash and cash equivalents 24,409 26,358 21,465
172,210 147,843 142,461Assets of disposal group classified as held for sale 0 0 0 796,468 733,123 736,613
CompuGroup Medical AG Financial Report for the period 1 January - 31 March 201510

SHAREHOLDER EQUITY AND LIABILITIES
31 .03 .2015 31 .03 .2014 31 .12 .2014 EUR '000 EUR '000 EUR '000
Shareholder Equity Subscribed capital 53,219 53,219 53,219Treasury shares -20,292 -20,292 -20,292Reserves 161,483 160,148 144,922
Capital and reserves allocated to the shareholder of the parent company
194,410 193,075 177,849
Minority interests 271 -4,245 -41 194,681 188,830 177,808
Long-term liabilities Pension provision 19,763 10,881 17,428Liabilities to banks 318,183 268,641 336,437Purchase price liabilities 4,099 2,584 3,539Other financial liabilities 7,109 1,452 7,600Other non-financial liabilities 3,261 2,786 3,898Derivative financial instruments 0 7,161 0Deferred taxes 54,154 48,972 49,212
406,570 342,477 418,114
Current liabilities Liabilities to banks 22,459 46,736 19,943Trade payables 26,368 19,394 25,439Income tax liabilities 13,957 13,891 10,449Provisions 30,903 24,977 30,834Purchase price liabilities 8,725 9,393 8,987Derivative financial instruments 3,670 0 4,763Other financial liabilities 10,389 6,122 10,072Other non-financial liabilities 78,747 81,303 30,204
195,218 201,816 140,691
Liabilities associated directly with non-current assets qualified as held for sale
0 0 0
796,468 733,123 736,613
11

Interim Income Statementfor the reporting period of 1 January - 31 March 2015
01 .01-31 .03 01 .01-31 .03 01 .01-31 .12EUR '000 2015 2014 2014
Continuing operations
Sales revenue 132,337 122,067 515,104
Capitalized in-house services 2,269 2,547 9,202
Other Income 496 333 12,721
Expenses for goods and services purchased -23,671 -22,896 -99,232
Personnel costs -62,349 -60,632 -247,811
Other expense -20,580 -19,453 -93,304
Earnings before interest, taxes depr . and amortization (EBITDA) 28,502 21,966 96,680
Depreciation of property, plants and tangible assets -1,893 -1,941 -7,809
Earnings before interest, taxes and amortization (EBITA) 26,609 20,025 88,871
Amortization of intangible assets -8,577 -7,989 -34,972
Earnings before interest and taxes (EBIT) 18,032 12,036 53,899
Results from associates recognised at equity -6 -7 19
Financial income 14,803 509 12,981
Financial expense -3,880 -5,544 -22,444
Earnings before taxes (EBT) 28,948 6,994 44,455
Income taxes for the period -7,993 -2,269 -20,339
Consolidated net income for the period from continuing operations 20,955 4,725 24,116
Discontinued operations
Profit for the period from discontinued operations 0 -140 -20
Consolidated net income for the period 20,955 4,585 24,096
of which: allocated to parent company 20,904 4,727 26,337
of which: allocated to minority interests 51 -142 -2,241
Earnings per share
undiluted (EUR) 0 .42 0 .10 0 .53
diluted (EUR) 0 .42 0 .10 0 .53
Additional information:
Cash net income (EUR)* 29,010 11,986 55,795
Cash net income per share (EUR) 0 .58 0 .24 1 .12
* Definition Cash Net Income: net income before minority interests plus amortization on intangible assets exept amortization on in-house capitalized software .
CompuGroup Medical AG Financial Report for the period 1 January - 31 March 201512

Interim Statement of Comprehensive Income for the reporting period of 1 January - 31 March 2015
01 .01-31 .03 01 .01-31 .03 01 .01-31 .12EUR '000 2015 2014 2014
Consolidated net income for the period 20,955 4,585 24,096
Other results
Items that will not be reclassified to profit or loss at a future point in time
Actuarial gains and losses on defined benefit plans -1,867 -40 -3,969
Deferred taxes on Actuarial gains and losses on defined benefit plans 552 5 1,082
Items that will be reclassified to profit or loss at a future point in time when specific conditions are met
Cash flow hedges
of which: in equity 0 690 -1,176
of which: income 0 0 9,028
Deferred taxes on cash flow hedges 0 -207 -2,356
Currency conversion differences -2,798 -869 -11,447
Total comprehensive imcome for the period 16,841 4,164 15,258
of which: allocated to parent company 16,790 4,306 17,499
of which: allocated to minority interests 51 -142 -2,241
13

Interim Cash Flow Statement as at 31 March 2015
01 .01-31 .03 01 .01-31 .03 01 .01-31 .122015 2014 2014
EUR '000 EUR '000 EUR '000
Group net income 20,955 4,585 24,096
Amortization of intangible assets, plant and equipment 10,470 9,930 42,781
Earnings on sales of fixed assets -38 0 -8,500
Change in provisions (including income tax liabilities) 3,327 -31 -1,661
Change in deferred taxes -1,186 -1,025 -2,141
Other non-cash earnings/expenditures -13,377 806 -6,765
20,151 14,265 47,810
Change in inventories -811 -1,361 -685
Change in trade receivables -18,455 -12,991 -7,054
Change in income tax receivables -204 -539 2,121
Change in other receivables -4,375 1,666 -2,379
Change in trade accounts payables -1,090 -4,299 -3,070
Change in other liabilities 48,094 43,446 -4,803
Cash flow from operating activities 43,310 40,187 31,940
Cash flow on disposals of intangible assets 2 18 132
Cash outflow for capital expenditure in intangible assets -4,625 -4,563 -16,844
Cash inflow on disposals of sales of property, plant and equipment 144 58 523
Cash outflow for capital expenditure in property, plant and equipment -756 -2,608 -8,081
Cash flow for the aquisition of subsidiaries -18,147 -23,551 -40,649
Cash outflow for the aquisition of subsidiaries from prior periods -986 0 -1,352
Cash inflow from disposal of subsidiaries 0 0 9,000
Cash flow from investing activities -24,368 -30,646 -57,271
Dividends paid 0 0 -17,403
Purchase of minority interests -36 0 -280
Cash inflow from assumption of loans 10,577 47,493 343,249
Cash outflow from the repayment of loans -26,936 -53,877 -302,447
Cash flow from financing activities -16,395 -6,384 23,119
Cash and cash equivalents at the beginning of the period 21,465 23,339 23,453
Change in cash and cash equivalents 2,547 3,157 -2,212
Changes in cash due to exchange rates 397 -138 224
Cash and cash equivalents at the end of the period 24,409 26,358 21,465
Interest paid 3,409 3,806 19,070
Interest received 95 137 732
Income tax paid 5,935 3,294 23,463
Income tax received 10 0 0
CompuGroup Medical AG Financial Report for the period 1 January - 31 March 201514

Interim Changes in Consolidated Equity as at 31 March 2015
Accumulated other comprehensive income
Attributable to owners of
Share Treasury Other Other Cashflow CompuGroup Non-controlling TotalEUR ‘000 capital shares reserves Hedges conversion Medical AG interest equity
Balance as at 01 .01 .2014 53,219 -20,292 168,792 -5,457 -7,493 188,769 -4,102 184,667
Group net income 0 0 26,337 0 0 26,337 -2,241 24,096
Other results
Cashflow Hedges 0 0 0 1,335 0 1,335 0 1,335
Cashflow Hedges (closing) 0 0 0 4,161 0 4,161 0 4,161
Actuarial gains and losses 0 0 -2,877 0 0 -2,877 0 -2,877
Currency conversion differences 0 0 0 0 -11,447 -11,447 0 -11,447
Total result of period 0 0 23,450 5,496 -11,447 17,499 -2,241 15,258
Transactions with shareholders
Capital contributiion 0 0 0 0 0 0 0 0
Dividend distribution 0 0 -17,403 0 0 -17,403 0 -17,403
Stock options programm 0 0 0 0 0 0 0 0
Repurchase of treasury shares 0 0 0 0 0 0 0 0
Non-controlling interes from acquisitions 0 0 0 0 0 0 0 0
Additional purchase of shares from non-controlling intrests after control
0 0 -11,127 0 0 -11,127 6,430 -4,697
0 0 -28,530 0 0 -28,530 6,430 -22,100
Changes in the scope of consolidation 0 0 190 -39 -40 111 -128 -17
Balance as at 01 .01 .2015 53,219 -20,292 163,902 0 -18,980 177,848 -41 177,808
Group net income 0 0 20,904 0 0 20,904 51 20,955
Other results 0
Cashflow Heges 0 0 0 0 0 0 0 0
Actuarial gains and losses 0 0 -1,315 0 0 -1,315 0 -1,315
Currency conversion differences 0 0 0 0 -2,798 -2,798 31 -2,766
Total result of period 0 0 19,588 0 -2,798 16,790 83 16,873
Transactions with shareholders
Capital contributiion 0 0 0 0 0 0 0 0
Dividend distribution 0 0 0 0 0 0 0 0
Stock options programm 0 0 0 0 0 0 0 0
Non-controlling interrests from acquisitions 0 0 0 0 0 0 0 0
Additional purchase of shares from non-controlling interests after control
0 0 -229 0 0 -229 229 0
Repurchase of treasury shares 0 0 0 0 0 0 0 0
Issue of treasury shares 0 0 0 0 0 0 0 0
0 0 -229 0 0 -229 229 0
Changes in the scope of consolidation 0 0 0 0 0 0 0 0
Balance as at 31 .03 .2015 53,219 -20,292 183,261 0 -21,778 194,410 271 194,681
15

Explanatory notes
GENERAL ACCOUNTING PRINCIPLES FOR THE INTERIM FINANCIAL REPORT General Accounting Principles The accompanying condensed IFRS-Interim Financial Statements for the period ended 31 March 2015 is a Consolidated Financial Statement . Unless otherwise specified, all amounts are provided in thousands of euros (EUR thousands) or millions of Euros (EUR millions) . Rounding differences of +/- one unit (EUR thousands, percent, etc .) may arise as a result of calculations .
The first quarter consolidated financial statements as of 31 March 2015 have been prepared, like the Consolidated Annual Financial Statements for the year 2014, in accordance with the International Financial Reporting Standards (IFRS) as adopted by the EU . This Consolidated Interim Financial Statements prepared in accordance with IAS 34 is condensed compared with the scope applied of the Consolidated Financial Statements for the full year . Apart from the exceptions detailed hereinafter for new or revised standards, the accounting policies in the interim Financial Statements are consistent with those used in the Consolidated Financial Statements for the year ended 31 December 2014 . Relevant information can be found in the Consolidated Financial Statements as of 31 Decem-ber 2014 . This Consolidated Interim Financial Statements and the Interim Management Report were not reviewed by any auditor .
The overview below gives information about the relevant foreign exchange rates for the condensed consolidated interim IFRS-financial statements:
Average ratesFixed rates January - March
1 € equals to 31 .03 .2015 31 .12 .2014 2015 2014
Danish Crowns (DKK) 7 .47 7 .46 7 .45 7 .46
Canadian Dollar (CAD) 1 .37 1 .54 1 .40 1 .54
Malaysian Ringgit (MYR) 3 .99 4 .54 4 .08 4 .54
Norwegian Crowns (NOK) 8 .70 8 .29 8 .73 8 .29
Polish Zloty (PLN) 4 .09 4 .20 4 .19 4 .20
Swedish Crowns (SEK) 9 .29 8 .87 9 .38 8 .87
Franc Switzerland (CHF) 1 .05 1 .22 1 .07 1 .22
South African Rand (ZAR) 13 .13 14 .86 13 .23 14 .86
Czech Crowns (CZK) 27 .53 27 .40 27 .62 27 .40
New Lira Turkey (TRY) 2 .81 3 .06 2 .77 3 .06
US Dollar (USD) 1 .08 1 .38 1 .13 1 .38
Unless otherwise stated, all figures refer to the first three months of 2015 and 2014 respectively . The business development showed no signs of significant cyclical fluctuations . The business volume normally tends to be higher in the second half of the year and in particular in the fourth quarter of the financial year (1 October – 31 December) .
When preparing the Consolidated Interim Financial Statements management makes estimates and assumptions in the process of applying the accounting policies that may influence the amounts of assets, liabilities and contingent liabilities as well as expense and income . Although these assumptions and estimates were made to the best knowledge of the Management Board, actual results may differ from these estimates .
The main assumptions being used for preparing the Consolidated Interim Financial Statements are identical to those used for the preparation of the Consolidated Financial Statements as at year end 31 December 2014 . In addition, assumptions have been made in the determination of the personnel expenses and provisions for post-employment benefits .
CompuGroup Medical AG Financial Report for the period 1 January - 31 March 201516

Standards, interpretations and changes to published standards to be applied in 2015CompuGroup Medical has applied all accounting pronouncements adopted by the EU and required to be applied as from January 1, 2015 . Various requirements have entered into force since January 1, 2015, as part of the annual improvements to IFRS 2013 . These included amendments to IFRS 1, IFRS 3, IFRS 13, and IAS 40 and did not materially affect the net assets, financial position, and results of operations of the CompuGroup Medical . IFRIC 21 has also been applicable since January 1, 2015 . IFRIC 21 governs the accounting for levies imposed by governments that are not covered by “IAS 12 Income Taxes .” In particular, the interpretation cla-rifies the circumstances in which a liability for a levy is to be recognized in the financial statements . This interpretation did not have any material effects on the net assets, financial position, and results of operations of the CompuGroup Medical .
In all other respects, the same accounting policies and consolidation principles were generally applied to the preparation of con-solidated interim financial statements and the presentation of the prior-year comparative figures as to the consolidated financial statements for 2014 . A detailed description of these accounting policies is given in the notes to the 2014 consolidated financial statements .
Amendments, standards and interpretation published by the IASB but not yet adopted into European legislationThe IASB and the IFRIC have adopted several additional standards and interpretations in 2015 and the previous years which were not yet compulsorily applicable in the financial year 2015 beginning on the 1 January . The application of these IFRS and IFRIC is depended on the adoption by the EU (“endorsement”)
Standard Content
IAS 16 and IAS 38, amendment Clarification of Acceptable Methods of Depreciation and Amortization
IAS 16 and IAS 41, amendment Agriculture: Bearer Plants
IAS 27, amendment Equity method in Separate Financial Statements
IFRS 9 Financial Instruments
IFRS 10 and IAS 28, amendment Sale or Contribution of Assets between an Investor and its Associate or Joint Venture
IFRS 11, amendment Accounting for Acquisitions of Interests in Joint Operations
IFRS 14 Regulatory Deferral Accounts
IFRS 15 Revenue from Contracts with Customers
Various standards Improvements to the International Financial Reporting Standards (Improvements Project 2012 - 2014)
The possibility of an early application for particular standards is given . CompuGroup Medical does not make use of the possibility of an early application of these standards . Currently CompuGroup Medical evaluates the consequences which will arise from the first time adoption of these standards . However it is expected that IFRS 15 will have significant changes to the (interim-) consolidated financial statements due to the first time application . From the first time application of the other standards it is expected that there will be no significant changes to the (interim-) consolidated financial statements of CompuGroup Medical .
SELECTED EXPLANATORY NOTES Consolidation group The Consolidated Interim Financial Statements as of 31 March 2015 include the Financial Statements of CompuGroup Medical AG and all companies controlled by CompuGroup Medical AG (subsidiaries) . Consolidation begins from the date control is obtained and ends when control ceases to exist . Consolidated companies include those companies included in Financial Statements as of year-end 2014 and the newly acquired, disposed or founded subsidiaries as described in section “Company acquisitions, disposals and foundations” in the selected explanatory notes below .
Changes in the business and the economic circumstances In comparison to financial year 2014 there have been no significant changes to the business and the economic circumstances Com-puGroup Medical AG is exposed to with the exception of the factors described in the Interim Management Report .
17

Explanatory Notes Continued
Company acquisitions, disposals and foundations
EUR ‘000
Total 2015
Medical EDI Services (PTY) LTD
BS Concept Realization B .V .
Compufit BVBA
Other acquisitions
Purchase date 07 .01 .2015 26 .03 .2015 23 .03 .2015 -Voting rights acquired in % 100% 100% 100% -Acquired assets and liabilities assumed recognized at acquisition date
Non-current assets 21,113 14,684 932 4,450 1,047Software 3,659 2,624 306 729 0Customer relationships 15,808 11,211 593 3,084 920Brands 873 625 33 98 117Order backlog 0 0 0 0 0Property and buildings 243 0 0 243 0Other fixed assets and office equipment 484 183 0 291 10Other non-current financial assets 46 41 0 5 0Other non-current non-financial assets 0 0 0 0 0Deferred tax assets 0 0 0 0 0Current assets 2,013 611 8 1,117 277Inventories 29 0 0 1 28Trade receivables 1,096 454 5 580 57Other current financial assets 16 10 1 3 2Other current non-financial assets 76 28 0 31 17Other assets 2 0 0 0 2Cash and cash equivalents 794 119 2 502 171Non-current liabilities 5,792 4,086 233 1,355 118Pensions 0 0 0 0 0Liabilities to banks 25 0 0 25 0Other provisions 0 0 0 0 0Other financial liabilities 38 38 0 0 0Other non-financial liabilities 0 0 0 0 0Other liabilities 0 0 0 0 0Deferred tax 5,729 4,048 233 1,330 118Current liabilities 1,953 321 11 1,443 178Trade payables 231 76 2 71 82Contingent liabilities 0 0 0 0 0Liabilities to banks 16 0 0 16 0Other provisions 179 0 0 106 73Other liabilities 0 0 0 0 0Other financial liabilities 54 40 0 0 14Other non-financial liabilities 1,473 205 9 1,250 9Net assets acquired 15,381 10,888 696 2,769 1,028Purchase price paid in cash 18,941 12,141 700 5,000 1,100Liabilities assumed 613 0 125 0 488 of which contingent consideration 524 0 125 0 399Issued equity instruments 0 0 0 0 0Total consideration transferred 19,554 12,141 825 5,000 1,588Non-controlling interests 0 0 0 0 0Goodwill 4,172 1,253 129 2,231 559Acquired cash and cash equivalents 794 119 2 502 171Purchase price paid in cash 18,941 12,141 700 5,000 1,100Prepayments on acquisitions 0 0 0 0 0Payments for acquisitions after date of acquisition 986 0 0 0 986Cash outflow for acquisitions (net) -19,133 -12,022 -698 -4,498 -1,915Effects of the acquisition on Group result Sales revenue following date of acquisition 2,022 1,708 0 0 314Result following date of acquisition 317 431 0 0 -114Sales revenue in 2014 (hypothetical date of acquisition 1 January 2014)
2,641 1,708 50 569 314
Result 2014 (hypothetical date of acquisition 1 January 2014) 375 431 20 38 -114Costs attributable to the acquisition 142 82 20 40 0
CompuGroup Medical AG Financial Report for the period 1 January - 31 March 201518

Acquisition of Medical EDI Services (PTY) LTD, South AfricaIn January 2015 CompuGroup Medical South Africa (PTY) LTD, a 100% subsidiary of CompuGroup Medical AG (CGM), acquired 100 % of the shares of Medical EDI Services (PTY) LTD based in Margate, South Africa .
MedEDI develops software which aids general practitioners in administration and invoicing as well as the operation of online services for insurance billing . Medical EDI services employs about 70 employees at its locations in Johannesburg, Margate and Cape Town . The company has approximately 2,700 practices as customers and is a leading provider in the area of billing services . The solutions support all administrative processes in a practice’s daily routine and sends patient invoices to the relevant insurances in real-time .The total sales revenue of the Medical EDI Services was in 2014 approximately EUR 5 .4 million with an EBITDA of approximately EUR 1 .9 million .
The consolidation of Medical EDI Services began 7 January 2015 .
From this acquisition, CGM expects to be able to significantly expand its ambulatory information business and the billing services with insurances in South Africa by offering innovative software products as well as services . Synergies are expected through the gaining of know-how and through cost efficiency opportunities . The preliminary goodwill of EUR 1,253 thousand results from the synergies within the Group as a result of the inclusion of Medical EDI Services into CGM . It is expected that the recognized goodwill will not be deductible for tax purposes .
The preliminary fair value of the acquired intangible assets excluding goodwill amounts to EUR 14,460 thousand .
The initial consolidation of the acquisition of Medical EDI Services as at 7 January 2015 is carried out in preliminary form . The ana-lysis of the acquired order backlog as well as the valuation of the acquired customer relationships, software and brands is not yet completed due to some not yet fully received or evaluated information .
Acquisition of BS Concept Realization B.V., NetherlandsIn March 2015 CompuGroup Medical Holding Cooperatief, a 100% subsidiary of CompuGroup Medical AG (CGM), acquired 100 % of the shares of BS Concept Realization B .V . based in Hilversum, Netherlands .
With this acquisition, CompuGroup Medical enters the new upcoming market of software services for homecare . BS Concept Realization, with its software product “Zorgverband”, is the Dutch market leader in communication products between healthcare professionals and patients in homecare together with their family members . Recent legislation in The Netherlands confirms the ten-dency towards patients staying at home for a longer period while increasing the participation of patients/clients and their families in the care at home . The Zorgverband system supports both professional and non-professional caregivers, thus providing for more efficiencies in health care .The total sales revenue of BS Concept Realization was in 2014 approximately EUR 2 .0 million with an EBITDA of approximately EUR -0 .1 million .
The consolidation of BS Concept Realization began 26 March 2015 .
Besides entering the new upcoming market of software services for homecare, CGM expects from this acquisition, to be able to significantly expand its reach through the existing and upcoming customer base in the Dutch Zorgverband in the Netherlands .
The preliminary goodwill of EUR 129 thousand results from the synergies within the Group as a result of the inclusion of BS Concept Realization into CGM . It is expected that the recognized goodwill will not be deductible for tax purposes .
The preliminary fair value of the acquired intangible assets excluding goodwill amounts to EUR 932 thousand .
The initial consolidation of the acquisition of BS Concept Realization B .V . as at 26 March 2015 is carried out in preliminary form . The analysis of the acquired order backlog as well as the valuation of the acquired customer relationships, software and brands is not yet completed due to some not yet fully received or evaluated information .
Acquisition of Compufit BVBA, BelgiumIn March 2015 CompuGroup Belgium Bvba, a 100% subsidiary of CompuGroup Medical AG (CGM), acquired 100 % of the shares of Compufit Bvba, based in Oostende, Belgium . The newly acquired company is market leader in software for physiotherapists as well as rehabilitation clinics . With this acquisition, CGM will now serve 50% of the physiotherapists as well as 30% of the rehabilitation clinics in Belgium .
Compufit develops software solutions for physiotherapists and rehabilitation clinics in Belgium and is, with its 6 .000 customers, num-ber one in these markets in Belgium . Out of 141 Belgians hospitals, which offer rehabilitation, 44 use Compufit’s software product .
19

Explanatory Notes Continued
Additionally, it sells hardware and other products .
The consolidation of Compufit BVBA began 23 March 2015 .
The total sales revenue of Compufit was in 2014 approximately EUR 2 .0 million with an EBITDA of approximately EUR 0 .2 million .
CGM expects by combining the strength of CGM Belgium and Compufit BVBA to raise synergies and enable a better service envi-ronment for the combined customer base
The preliminary goodwill of EUR 2,231 thousand results from the synergies within the Group as a result of the inclusion of Compufit into CGM . It is expected that the recognized goodwill will not be deductible for tax purposes .
The preliminary fair value of the acquired intangible assets excluding goodwill amounts to EUR 3,911 thousand .
The initial consolidation of the acquisition of BS Compufit as at 23 March 2015 is carried out in preliminary form . The analysis of the acquired order backlog as well as the valuation of the acquired customer relationships, software and brands is not yet completed due to some not yet fully received or evaluated information .
Farma3tec S .r .l . / Mondofarma S .r .l, Italy, Labelsoft B .V ., NetherlandsFor the group of companies Farma3tec S .r .l . / Mondofarma S .r .l, Italy, acquired in 2014 and for Labelsoft B .V ., Netherlands, acqui-red in 2014, in the reporting period no adjustments arose on the fair value of the acquired intangible assets recognized within the company acquisitions .
Acquisitions and disposals of items of Tangible assets In the first three months of the financial year 2015, CompuGroup Medical AG acquired tangible assets such as office buildings and office equipment for a total amount of EUR 0 .7 million .
Related-party transactions The related-party transactions are as follows:
Sale of goods Purchase of goods Receivables Liabilities
EUR ‘000 31 .03 .2015 31 .03 .2014 31 .03 .2015 31 .03 .2014 31 .03 .2015 31 .03 .2014 31 .03 .2015 31 .03 .2014
Related Persons 16 14 7 35 16 16 0 0
Related companies 1,042 878 2,569 1,040 2,414 964 1,063 201
Associated companies 6 12 3 8 32 24 0 8
Total 1,064 904 2,579 1,083 2,462 1,004 1,064 209
Compliance with payment obligations and financial covenants On the 23 September 2014 CGM entered into a new syndicated loan facility for a total sum of EUR 400 .0 million . The syndicated loan facility consists of a “term loan facility” (also referred to in the following as “TLF”) for EUR 225 .0 million and a “multi-currency revolving loan facility” (also referred to in the following as “RLF”) for EUR 175 .0 million . The syndicated loan facility has a duration of five years . The TLF must be repaid pro rata in equal instalments of EUR 15 .0 million on 31 January and 31 July in each year, com-mencing on 31 July 2015, with a final payment of the balance of any outstanding term facility loans to be repaid on the termination date . The RLF must be repaid at the end of each interest period and can be taken out again immediately thereafter . The interest period can be chosen by CGM AG at its discretion . The interest rate is based upon the 3month-EURIBOR rate for the interest period chosen plus a margin derived from the relationship between the consolidated net borrowings and the adjusted consolidated EBIT-DA (Leverage) . The margin is 2 .0 percent for the first six months .
As of 31 March 2015 EUR 225 .0 million of the TLF and EUR 80 .0 million of the RLF were utilized . Loan origination fees totaling EUR 3 .5 million were incurred related to these facilities . These fees will be charged as a financial expense over the term of the loan ag-reement . For this syndicated loan facility no hedge has been concluded . The grant of the loan is linked to the compliance of certain financial covenants .
The loan agreement includes joint and several guarantees for payment by a number of CGM’s subsidiaries (contingent liability in case of non-payment of CompuGroup Medical AG) . In the first three months of the financial year 2015 CompuGroup Medical is compliant with all financial covenants entered in all of its loan agreements .
CompuGroup Medical AG Financial Report for the period 1 January - 31 March 201520

Other financial obligations and finance commitments As at the 31 March 2015 the Group had open obligations from non-cancelable operating leases, maturing as follows
EUR ‘000 31 .03 .2015 31 .03 .2014
Within 1 year 12,414 11,195
Between 2 and 5 years 24,382 21,838
Longer than 5 years 6,250 6,686
Total 43,046 39,719
Payments from operating lease agreements include rent for the Group’s office equipment and particularly for office buildings (wit-hout purchase option) . Lease agreements are concluded for an average term of three years . The rents are fixed for three to seven years . Operating leasing relationships are recognized pro rata in the income statement .
Other financial commitments did not change significantly during the first three months of the financial year 2015 compared to 31 December 2014 .
Financial instruments The Group has various financial assets such as trade receivables and cash and cash equivalents, which result directly from operations . In the first nine months of the financial year 2014 the same accounting policies and valuation methods that were applied in the Fi-nancial Statements as of year-end 2014 have been applied to the company’s financial instruments .
The following table presents carrying amounts and valuation of the Group’s financial instruments grouped by categories according to IAS 39 .
IAS 39 valuation
IAS 17 valuation
Categories of financial instruments in accordance with IAS 39
Category according to IAS 39
Book value
as at 31 .03 .2015
Acquisiton
costs (continued)
Fair Value
through profit and loss
Fair value
regonized in equity
Acquisiton
costs continued
Fair Value
as at 31 .03 .2015
Financial assets
Cash and bank balances LaR 24,409 24,409 0 0 0 24,409
Trade receivables LaR 84,347 84,347 0 0 0 84,347
Receivables from construction contracts (PoC) LaR 28,872 28,872 0 0 0 26,187
Other receivables LaR 5,044 5,044 0 0 0 5,044
Finance lease receivables - 13,897 0 0 0 13,897 15,592
Other financial assets AfS 194 194 0 0 0 194
Securities FVtPL 103 0 103 0 0 103
Stock options held for trading FVtPL 0 0 0 0 0 0
Total financial assets 156,866 142,866 103 0 13,897 155,877
Financial liabilities
Liabilities to banks oL 340,642 340,642 0 0 0 339,227
Purchase price liabilities oL 12,824 12,824 0 0 0 12,824
Trade payables oL 26,368 26,368 0 0 0 26,368
Other financial liabilities oL 16,274 16,274 0 0 0 16,274
Financial lease obligations - 1,223 0 0 0 1,223 1,300
Interest rate swap FVtPL 3,670 0 3,670 0 0 3,670
Total financial liabilities 401,002 396,109 3,670 0 1,223 399,664
Total per category
Assets held for trade AfS 194 194 0 0 0 194
Liabilities to banks and receivables LaR 142,672 142,672 0 0 0 139,987
Financial assets at fair value assets FVtPL 103 0 103 0 0 103
Other financial liabilities oL 396,109 396,109 0 0 0 394,694
Liabilities at fair value through profit and loss FVtPL 3,670 0 3,670 0 0 3,670
21

Explanatory Notes Continued
Fair value measurementThe fair value is not always available as a market value, which often necessitates a determination based on various measurement parameters . Depending on the availability of observable parameters and the relevance of these parameters for determining the fair value as a whole, the fair value is assigned to Level 1, 2 or 3 . Assignment to these levels is effected under consideration of the following factors:
+ Level 1 parameters: Here, the market value of assets and liabilities is calculated based on quoted, unadjusted prices like those that arise for similar or identical assets and liabilities in active markets .
+ Level 2 parameters: Here, the market value of assets and liabilities is calculated on the basis of parameters for which either directly or indirectly quoted prices are also available to an active market .
+ Level 3 parameters: Here, the market value of assets and liabilities is calculated on the basis of parameters for which there are no observable market data .
Fair value of financial assets and liabilities that are regularly measured at fair value according to the valuation hierarchies:
Assessed valuation hierarchies at fair value - financial instruments EUR ‘000
31 .03 .2015
Level 1
Level 2
Level 3
Financial assets at fair value through profit and loss 103 103 0 0
thereof securities 103 103 0 0
thereof stock options held for trading 0 0 0 0
Financial assets at fair value wihtout through equity 0 0 0 0
Total 103 103 0 0
Liabilities at fair value through profit and loss 3,670 0 3,670 0
thereof interest rate swaps 0 0 3,670 0
Liabilities at fair value through equity 0 0 0 0
Total 3,670 0 3,670 0
1) Securities (Level 1): The fair value of securities in the amount of EUR 103 thousand (previous year: EUR 95 thousand) is based on quoted market prices in an active market at the balance sheet date . Significant unobservable input parameters are not available which is why there is no ratio of unobservable input parameters to the fair value of the securities .
2) Interest rate swaps (Level 2): Cash flow hedges (2015: EUR 3,670 thousand; previous year: EUR 7,161 thousand) represent the negative market values of interest rate hedges (interest rate swaps), measured at fair value based on the mark-to-market me-thod . The fair value is the present value of future cash flows based on observable yield curves . Derivative financial instruments are used to hedge against the effect of interest rate fluctuations .
The nominal value of interest rate swap amounted to EUR 250 .0 million on 31 March 2015 and thus remained unchanged from last year . On 31 March 2015, the fixed interest rates ranged from 1 .83 percent to 2 .07 percent (unchanged from previous year), the variable interest rate was the 3-month EURIBOR .
CompuGroup Medical AG Financial Report for the period 1 January - 31 March 201522

Fair Value of financial assets and liabilities that are not regularly measured at fair value according to the valuation hierarchies:
EUR ‘000 31 .03 .2015 Level 1 Level 2 Level 3
Fair value of financial assets valuated at (continued) acquisition costs
Trade receivables 84,347 0 84,347 0
Receivables from construction contracts (PoC) 26,187 0 26,187 0
Other receivables 5,044 0 1,638 3,406
Finance lease receivables 15,592 0 15,592 0
Other financial assets 194 0 0 194
Total 131,364 0 127,764 3,600
Fair value of financial liabilities valuated at (continued) acquisition costs
Liabilities to banks 339,227 0 0 339,227
Purchase price liabilities 12,824 0 0 12,824
Trade payables 26,368 0 26,368 0
Other financial liabilities 16,274 0 10,423 5,851
Financial lease obligations 1,300 0 1,300 0
Total 395,994 0 38,091 357,903
Post balance sheet events Acquisition of Stock Informatik GmbH & Co KG, GermanyIn May, CompuGroup Medical Deutschland AG, a 100 percent owned subsidiary of CGM AG, acquired the company „Stock Informa-tik GmbH & Co KG“ headquartered in Fröndenberg/Ruhr . Stock Informatik is the market leader for software services in occupational medicine, preventative medicine and occupational safety in Germany . The comprehensive software suite „ISIS“ supports companies in the prevention and active care regarding the health of their employees and is used in numerous institutions ranging from clinics and businesses to major corporations . As a European specialist, Stock Informatik also offers its solutions in Switzerland and Austria . The total turnover of Stock Informatik was in 2014 approx . EUR 3 .0 million with an EBITDA of EUR 0 .9 million .
23

Segment reporting In accordance with IFRS 8 „Operating Segments“ the activities of CompuGroup Medical AG are divided into operating segments for segment reporting purposes . A classification based on the individual products or services is applied for controlling purposes and for the allocation of resources . Six operating segments result from this classification . These six operating segments are aggregated into the three reportable segments HPS I (Health Provider Services I), HPS II (Health Provider Services II) and HCS (Health Connectivity Services) .
The board of directors as Chief Operating Decision Maker evaluates the performance of the three reportable segments based on the reporting system and takes decisions on the allocation of resources . For the evaluation of the performance of the operating segments the board of directors uses „Earnings before interest, tax, depreciation and amortization“(EBITDA) as a key performance indicator, which represents the result of the individual segment .
Segment I: Segment II: Segment III:
Health Provider Services I Health Provider Services II Health Connectivity Services All other Total Consolidation CompuGroup
(HPS I) (HPS II) (HCS) Segments Segments adjustments Medical Group
2015 2014 2014 2015 2014 2014 2015 2014 2014 2015 2014 2014 2015 2014 2014 2015 2014 2014 2015 2014 2014
EUR ́ 000 Jan-Mar Jan-Mar Jan-Dec Jan-Mar Jan-Mar Jan-Dec Jan-Mar Jan-Mar Jan-Dec Jan-Mar Jan-Mar Jan-Dec Jan-Mar Jan-Mar Jan-Dec Jan-Mar Jan-Mar Jan-Dec Jan-Mar Jan-Mar Jan-Dec
Sales to third parties 100,466 90,168 375,335 17,099 17,829 79,784 14,754 13,991 60,069 17 78 -83 132,337 122,067 515,104 0 0 0 132,337 122,067 515,104
Sales between segments 1,395 1,620 6,459 2,249 2,784 10,843 1,610 1,436 5,885 719 76 3,022 5,972 5,916 26,209 -5,972 -5,916 -26,209 0 0 0
SEGMENT SALES 101,861 91,788 381,794 19,348 20,613 90,627 16,364 15,427 65,954 736 154 2,939 138,309 127,983 541,313 -5,972 -5,916 -26,209 132,337 122,067 515,104
thereof recurring sales 75,341 67,428 273,938 9,847 8,417 40,243 4,685 4,472 17,891 3 3 12 89,875 80,320 332,083 0 0 0 89,875 80,320 332,083
Capitalized inhouse services 448 890 1,728 426 0 1,903 185 202 735 1,211 1,454 4,836 2,269 2,547 9,202 0 0 0 2,269 2,547 9,202
Other income 330 152 4,459 303 312 7,322 162 359 1,049 860 669 5,500 1,655 1,492 18,330 -1,159 -1,159 -5,609 496 333 12,721
Expenses for goods and services purchased -18,987 -17,862 -81,192 -4,140 -4,020 -17,390 -4,238 -2,616 -16,597 -8 -1,855 -110 -27,373 -26,353 -115,290 3,702 3,457 16,058 -23,671 -22,896 -99,232
Personnel costs -37,465 -33,768 -145,442 -11,855 -13,319 -52,676 -6,093 -7,644 -25,689 -2,432 -1,850 -9,221 -57,845 -56,581 -233,028 -4,504 -4,051 -14,784 -62,349 -60,632 -247,811
Other expense -17,080 -15,805 -64,969 -2,367 -2,765 -12,915 -3,102 -3,170 -14,479 -2,808 -955 -14,604 -25,357 -22,695 -106,967 4,778 3,242 13,663 -20,580 -19,453 -93,304
EBITDA 29,106 25,395 96,378 1,715 821 16,871 3,278 2,558 10,973 -2,442 -2,383 -10,661 31,657 26,393 113,561 -3,155 -4,427 -16,881 28,502 21,966 96,680
in % of sales 29 .0% 28 .2% 25 .7% 10 .0% 4 .6% 21 .1% 22 .2% 18 .3% 18 .3% 23 .9% 21 .6% 22 .0% 21 .5% 18 .0% 18 .8%
Depreciation of property, plants and tangible assets -1,893 -1,941 -7,809
Amortization of intangible assets -8,577 -7,989 -34,972
Impairment for financial assets 0 0 0
EBIT 18,032 12,036 53,899
Results from associates recognised at equity -6 -7 19
Financial income 14,803 509 12,981
Financial expense -3,880 -5,544 -22,444
EBT 28,948 6,994 44,455
Taxes on income for the period -7,993 -2,269 -20,339
Profit for the period from discontinued operations 0 -140 -20
Consolidated net income for the period 20,955 4,585 24,096
in % of sales 15 .8% 3 .8% 4 .7%
CASH NET INCOME* 29,010 11,986 55,795
* Cash net income: Cash net income before minority interests plus amortization on intangible assets except amortization on in-house capitalized software .
Explanatory Notes Continued
CompuGroup Medical AG Financial Report for the period 1 January - 31 March 201524

Segment I: Segment II: Segment III:
Health Provider Services I Health Provider Services II Health Connectivity Services All other Total Consolidation CompuGroup
(HPS I) (HPS II) (HCS) Segments Segments adjustments Medical Group
2015 2014 2014 2015 2014 2014 2015 2014 2014 2015 2014 2014 2015 2014 2014 2015 2014 2014 2015 2014 2014
EUR ́ 000 Jan-Mar Jan-Mar Jan-Dec Jan-Mar Jan-Mar Jan-Dec Jan-Mar Jan-Mar Jan-Dec Jan-Mar Jan-Mar Jan-Dec Jan-Mar Jan-Mar Jan-Dec Jan-Mar Jan-Mar Jan-Dec Jan-Mar Jan-Mar Jan-Dec
Sales to third parties 100,466 90,168 375,335 17,099 17,829 79,784 14,754 13,991 60,069 17 78 -83 132,337 122,067 515,104 0 0 0 132,337 122,067 515,104
Sales between segments 1,395 1,620 6,459 2,249 2,784 10,843 1,610 1,436 5,885 719 76 3,022 5,972 5,916 26,209 -5,972 -5,916 -26,209 0 0 0
SEGMENT SALES 101,861 91,788 381,794 19,348 20,613 90,627 16,364 15,427 65,954 736 154 2,939 138,309 127,983 541,313 -5,972 -5,916 -26,209 132,337 122,067 515,104
thereof recurring sales 75,341 67,428 273,938 9,847 8,417 40,243 4,685 4,472 17,891 3 3 12 89,875 80,320 332,083 0 0 0 89,875 80,320 332,083
Capitalized inhouse services 448 890 1,728 426 0 1,903 185 202 735 1,211 1,454 4,836 2,269 2,547 9,202 0 0 0 2,269 2,547 9,202
Other income 330 152 4,459 303 312 7,322 162 359 1,049 860 669 5,500 1,655 1,492 18,330 -1,159 -1,159 -5,609 496 333 12,721
Expenses for goods and services purchased -18,987 -17,862 -81,192 -4,140 -4,020 -17,390 -4,238 -2,616 -16,597 -8 -1,855 -110 -27,373 -26,353 -115,290 3,702 3,457 16,058 -23,671 -22,896 -99,232
Personnel costs -37,465 -33,768 -145,442 -11,855 -13,319 -52,676 -6,093 -7,644 -25,689 -2,432 -1,850 -9,221 -57,845 -56,581 -233,028 -4,504 -4,051 -14,784 -62,349 -60,632 -247,811
Other expense -17,080 -15,805 -64,969 -2,367 -2,765 -12,915 -3,102 -3,170 -14,479 -2,808 -955 -14,604 -25,357 -22,695 -106,967 4,778 3,242 13,663 -20,580 -19,453 -93,304
EBITDA 29,106 25,395 96,378 1,715 821 16,871 3,278 2,558 10,973 -2,442 -2,383 -10,661 31,657 26,393 113,561 -3,155 -4,427 -16,881 28,502 21,966 96,680
in % of sales 29 .0% 28 .2% 25 .7% 10 .0% 4 .6% 21 .1% 22 .2% 18 .3% 18 .3% 23 .9% 21 .6% 22 .0% 21 .5% 18 .0% 18 .8%
Depreciation of property, plants and tangible assets -1,893 -1,941 -7,809
Amortization of intangible assets -8,577 -7,989 -34,972
Impairment for financial assets 0 0 0
EBIT 18,032 12,036 53,899
Results from associates recognised at equity -6 -7 19
Financial income 14,803 509 12,981
Financial expense -3,880 -5,544 -22,444
EBT 28,948 6,994 44,455
Taxes on income for the period -7,993 -2,269 -20,339
Profit for the period from discontinued operations 0 -140 -20
Consolidated net income for the period 20,955 4,585 24,096
in % of sales 15 .8% 3 .8% 4 .7%
CASH NET INCOME* 29,010 11,986 55,795
* Cash net income: Cash net income before minority interests plus amortization on intangible assets except amortization on in-house capitalized software .
25

Additional Information
FINANCIAL CALENDAR 2015
Date Event
07 May 2015 Interim Report Q1 2015
20 May 2015 Annual General Shareholder Meeting, Koblenz
06 August 2015 Interim Report Q2 2015
09 October 2015 Analyst Conference
05 November 2015 Interim Report Q3 2015
SHARE INFORMATIONThe CompuGroup share finished the first quarter with a closing price of EUR 26 .93 . The average closing share price increased by 29 percent from EUR 19 .24 (Q4/2014) to EUR 24 .82 (Q1/2015) .
The highest quoted price during the quarter was EUR 28 .80 on 25 February 2015 and the lowest price EUR 19 .79 on 05 January 2015 .
The trading volume of CompuGroup shares was 2 .4 million shares during the first quarter, up 90 percent compared to the previous quarter . On average, the daily trading volume was approximately 38,000 shares (daily average in 2014: approximately 25,000) .
By the end of March 2015, a total of eight analyst companies were covering the CompuGroup Medical share on a regular basis . Six analysts rated the shares a “buy” and two analysts as “hold” or ”neutral” .
CONTACT CompuGroup Medical AGInvestor RelationsMaria Trost 2156070 Koblenz
Telephone: +49 (261) 8000-6200Fax: +49 (261) 8000-3200
E-Mail: [email protected]
CompuGroup Medical AG Financial Report for the period 1 January - 31 March 201526

To the best of our knowledge, and in accordance with applicable accounting principles for interim financial reporting, the consolida-ted interim financial statements give a true and fair view of the net assets, financial position and results of operations of the Group, and the Group interim management report includes a fair review of the development and performance of the business and the po-sition of the Group, together with a description of the principal opportunities and risks associated with the expected development of the Group over the remainder of the financial year .
Koblenz, 7 May 2015
CompuGroup Medical AktiengesellschaftThe Management Board
Frank Gotthardt Frank Brecher Uwe Eibich Christian B . Teig
Management Responsibility Statement
27

CompuGroup Medical AG Maria Trost 21 56070 Koblenz Germany