compressive strength gain and porosity ......compressive strength gain and porosity reduction at...
TRANSCRIPT

COMPRESSIVE STRENGTH GAIN AND POROSITYREDUCTION AT DIFFERENT DAYS FOR OPC AND
PCC CEMENT
MD. LATIFUR RAHMAN SIDDIQUE
MASHUKA JOARDER
REYAD MORSHED SHIHAB
DEPARTMENT OF CIVIL ENGINEERING
AHSANULLAH UNIVERSITY OF SCIENCE AND TECHNOLOGY
DECEMBER 2015
COMPRESSIVE STRENGTH GAIN AND POROSITYREDUCTION AT DIFFERENT DAYS FOR OPC AND
PCC CEMENT
A Thesis/Project
Submitted by
Md. Latifur Rahman Siddique Student No. 11. 02. 03. 073
Mashuka Joardar Student No. 11. 02. 03. 076
Reyad Morshed Shihab Student No. 11. 02. 03. 079
In partial fulfillment of the requirements for the degree of
Bachelor of Science in Civil Engineering
Under the supervision of
Dr. Enamur Rahim Latifee
Assistant Professor
Department of Civil Engineering
AHSANULLAH UNIVERSITY OF SCIENCE AND TECHNOLOGY
DECEMBER 2015

ii
DEDICATION
TO OURPARENTS, FAMILY AND TEACHERS

iii
DECLARATION
The work performed in this thesis for the achievement of Degree of Bachelor ofScience in Civil Engineering is, Compressive Strength Gain and Porosity Reduction atDifferent Days for OPC and PCC Cement under the friendly supervision ofDr. Enamur Rahim Latifee.
Signature of Supervisor
________________________Dr. Enamur Rahim Latifee
Signature of Authors
_________________________
Md. Latifur Rahman Siddique
_________________________
Mashuka Joarder
_________________________
Reyad Morshed Shihab

iv
ACKNOWLEDGEMENT
We wish to express our sincere gratitude to our project/thesis supervisor Dr. EnamurRahim Latifee, Assistant Professor, Department of Civil Engineering, AhsanullahUniversity of Science and Technology for his invaluable suggestions, direction andsupervision. His encouragement and active support was a great inspiration forcarrying out the project/thesis work.
We would like to acknowledge Dr. Md. Mahmudur Rahman, Professor & Head,Department of Civil Engineering, Ahsanullah University of Science and Technologyfor his guidance and for giving us the opportunity to fulfill this project/thesis work.
We wish to thank to Oasis Holdings Limited and Holcim Cement Bangladesh Ltd. forsupplying us the construction materials for completing this project/thesis worksuccessfully.
In addition, we would like to thank all other officials of the department for theirtimely co-operation.
v
ABSTRACT
The service life and longevity of a concrete structure strongly leans on its materialtransport properties, such as permeability, and diffusivity which depends the microstructural characteristics of concrete. There are many properties of concrete that areallied to its durability such as absorption, strength and workability, human activitiesand also forces from loading that occupy a structure. It normally refers to the durationor life span of the concrete itself.Porosity is important property that ascertains the durability of concrete and mortar.Porosity represents the amount of voids inside the concrete, which is dimensionlessquantity, usually expressed as a percentage value. The aim of this study is to ascertainthe effect of porosity and strength effect on mortars. The samples are tested for mortarporosity at 4 days, 7 days, 10 days, 14 days, 21 days and 28 days.Concrete durability is directly related to porosity and compressive strength ofconcrete is also related to porosity. This research focuses on the strength variation ofOrdinary Portland Cement (OPC) and Portland Composite Cement (PCC) at differentdays as well as the porosity variation with days. The aim of this study is to ascertainthe effect of porosity and its corresponding compressive strength of mortars with OPCand PCC.The curing days for samples were 4, 7, 10, 14, 21 and 28 days for porosity test. Thecuring days of cement mortar sample were 3, 14, 28, 42 and 56 days for bothcompressive strength test and porosity test. For the cross-check of the result anothercasting was done for both compressive strength and porosity of 3, 7, 14, 21 and 28days. The same trend of result has been documented as before. Another casting wasdone with low w/c ratio of 0.3 to observe the porous condition of mortar.. The OPCand PCC cement was used for in this experiment are CEM-I 52.5N Portland cementand CEM-II 42.5 N Portland-composite cement types respectively. This researchrevealed that OPC cement gains early age higher compressive strength than PCCwhere as PCC cement gains higher compressive strength at later age. Also, thedifferent days-data it has been found that the strength of OPC and PCC cement, inOven Dry (OD) condition is higher than the Saturated Surface Dry (SSD) condition.Another finding is that with the increase of the age of cube sample the porositydecreases significantly and the OPC and PCC had different trends.

vi
TABLE OF CONTENTS
DECLARATION iiiACKNOWLEDGEMENTS ivABSTRACT vTABLE OF CONTENTS viLIST OF FIGURES ixLIST OF TABLES xLIST OF ABBREVIATIONS xi
Chapter 1 INTRODUCTION 1
1.1. Concrete22
1.2 The Forms of Concrete 31.3 Cement1.4 Pozzolanic Cement1.5 Chemical Activation1.6 Differences in cement types, how they tested, produced andidentified1.7 Standards1.8 Nomenclature differences1.9 Relative cost1.10 Physical and chemical performances required1.11 Supplementary cementing materials1.11.1 Fly ash1.11.2 Slag Cement1.11.3 Silica fume1.11.4 Aggregates1.11.5 Grading1.12 Shape and size matter
4555
6678899991010
Chapter 2 REVIEW OF LITERATURE 11
2.1 Portland Cement 122.2 Durability 132.3 Pozzolonic materials 132.3.1 Fly ash (F.A.) 132.3.2 Silica fume (S.F.) 142.3.3 Blast furnace slag 142.4 Abrasion and skid resistance of an aggregate 142.5 Concrete Strength 142.6 Variation of Concrete strength 152.7 Concrete porosity activation2.7.1 Factors affecting porosity
1617
vii
2.7.2 Chemical determination2.7.3 Degree of hydration2.7.4 Schematic of the rate of hydration
171819
2.7.5 Diffusion process 20-222.7.6 Air content 232.8 Measurements of air content in concrete 232.8.1 Pressure Method2.8.2 Volumetric Method
2424
2.8.3 Gravimetric Method2.8.4 Chace air indicator2.8.5 Air-Void system2.9 Consolidation2.9.1 External board vibrator2.9.2 External rotary vibrator2.10 Admixture of concrete2.10.1 Effectiveness of admixture2.11 Functions2.11.1 Water reducing admixtures2.11.2 Retarding admixtures2.11.3 Accelerating admixtures2.11.4 Super plasticizer2.11.5 Corrosion-inhibiting admixtures2.12 Effect on permeability2.13 Effect on shrinkage2.14 Effect on workability
252526
26-2728282929303030303131313132
Chapter 3 METHODOLOGY33
3.1 Materials collections and properties 343.1.1 Cement 343.1.2 Sand 353.1.3 Water 363.2 Physical properties determination of material 363.2.1 Sieve analysis of fine aggregate 363.2.2 Specific Capacity and absorption capacity of fine aggregate 37-40
3.3 Material Mix proportion and mortar sample3.4 Compressive strength test3.5 Preparation of cube specimen3.6 Equipments and machine
404041
42-44

viii
Chapter 4 EXPERIMENTAL WORK
4.1 Materials4.1.1 Graded standard sand4.2 Temperature and humidity4.3 Test Specimen4.4 Preparation of specimen molds4.5 Mix Design4.6 Sieve Analysis4.7 Procedure4.7.1 Composition of mortars4.7.2 Preparation of mortars4.7.3 Determination of Flow4.7.4 Molding test specimen4.7.5 Storage of test specimen4.7.6 Determination of compressive strength4.7.7 Porosity test
45
4646464647474849495050
50-535455
Chapter 5 RESULTS AND DISCUSSION 56
5.1 Compressive strength and porosity analysis
5.1.1 Porosity (Case-1: PCC Cement Mortar and porosity determinationby keeping the samples on air)5.1.2 Compressive strength ( Case-1 : Compressive strength determinedfor OPC and PCC cement mortar for Oven dry and Saturated surfacedry condition )5.1.3 Porosity ( Case-2: OPC and PCC Cement Mortar and porositydetermination by keeping the samples on air )5.1.4 Compressive Strength ( Case-2: Compressive strength determinedfor OPC and PCC cement mortar for Saturated surface dry condition )5.1.5 Porosity (Case-3 : OPC and PCC Cement Mortar and porositydetermination by keeping the samples into water )5.1.6 Porosity ( Case-4: OPC and PCC cement mortar and porositydetermined by 5 hour boiling)
57
57-60
61-64
64
65
66-67
68-69
Chapter 6 CONCLUSIONS AND RECOMMENDATIONS 70
6.1 Conclusions 716.2 Recommendations 71

ix
LIST OF FIGURES
REFERENCES 72-73
APPENDIX A : Experimental Images 74
Figure no. Description PageFig. 1.1 Effect of fly ash content and age on strength development of 4concreteFig. 1.2 Schematic illustration of free Ca(OH)2 content in Portland and 4pozzolana cement.Fig. 2.1 Schematic of the rate of hydration or heat evolution as a function 19of time.Fig. 2.2 Results of a realistic digital model of cement hydration. 21Fig. 2.3 Typical development of the degree of hydration and compressive 22strength of a Type I Port land cement over time.Fig. 2.4 CaCl2 increases drying shrinkage of concrete, although the 32moisture content is decreasedFig. 4.1 Order of Tamping in Molding of Test Specimens 49Fig. 5.1 Porosity Reduction of Cement Mortar with Days for PCC 58Cement (sample-1)Fig. 5.2 Porosity Reduction of Cement Mortar with Days for PCC 58Cement (sample-2)Fig. 5.3 Porosity Reduction of Cement Mortar with Days for PCC 59Cement (sample-3)Fig. 5.4 Porosity Reduction of Cement Mortar with Days for PCC 59Cement (sample-4)Fig. 5.5 Porosity Reduction of Cement Mortar with Days for PCC 60Cement (sample-5)Fig. 5.6 Porosity Reduction of Cement Mortar with Days for PCC 60Cement (sample-6)Fig. 5.7 Strength at different days in OD and SSD condition for OPC 61cementFig. 5.8 Strength at different days in OD and SSD condition for CPC 62cementFig. 5.9 Strength at different days in OD condition for OPC and PCC 63cementFig. 5.10 Strength at different days in SSD condition for OPC and PCC 63cementFig. 5.11 Porosity at different days for OPC PCC cement Mortar 64

x
LIST OF TABLES
Table no. Description Page
Table 3.1 Chemical composition for CEM I (OPC Cement) 34Table 3.2 Physical properties for CEM I (PCC Cement) 34Table 3.3 Chemical composition for CEM II/B 35Table 3.4 Physical properties for CEM II/B 35Table 3.5 Permissible Variations of Specimen Molds 42Table 4.1 Sieve Analysis 48Table 4.2 Precision 52Table 5.1 Data for Porosity test 57Table 5.2 Data Table 60Table 5.3 Strength at different days of Cement mortar for 65
OPC and PCC cementTable 5.4 Compressive strength and corresponding Percent of 66
Porosity for different days of OPC and PCC cement
Fig. 5.12 Strength at Different days in SSD condition for OPC & PCC 65CementFig. 5.13 Porosity variation with corresponding compressive strength 66for PCC Cement MortarFig. 5.14 Porosity variation with corresponding compressive strength 67for OPC Cement MortarFig. 5.15 Porosity Variation between OPC and PCC cement for normal 68sample porosity and 5 hour boiled sample.Fig. 5.16 Porosity variation between normal sample and 5 hour boiled 69sample for OPC cement.Fig. 5.17 Porosity variation between normal sample and 5 hour boiled 68sample for PCC

xi
ABBREVIATIONS
PCC = Portland Composite Cement
OPC = Ordinary Portland Cement
SSD = Saturated-surface-dry
OD = Oven dry
WSSD = Weight of Materials in SSD condition
WOD = Weight of Materials in OD condition
WWater = Weight of Materials submerging into water.

1
Chapter One
INTRODUCTION
2
1.1. Concrete :
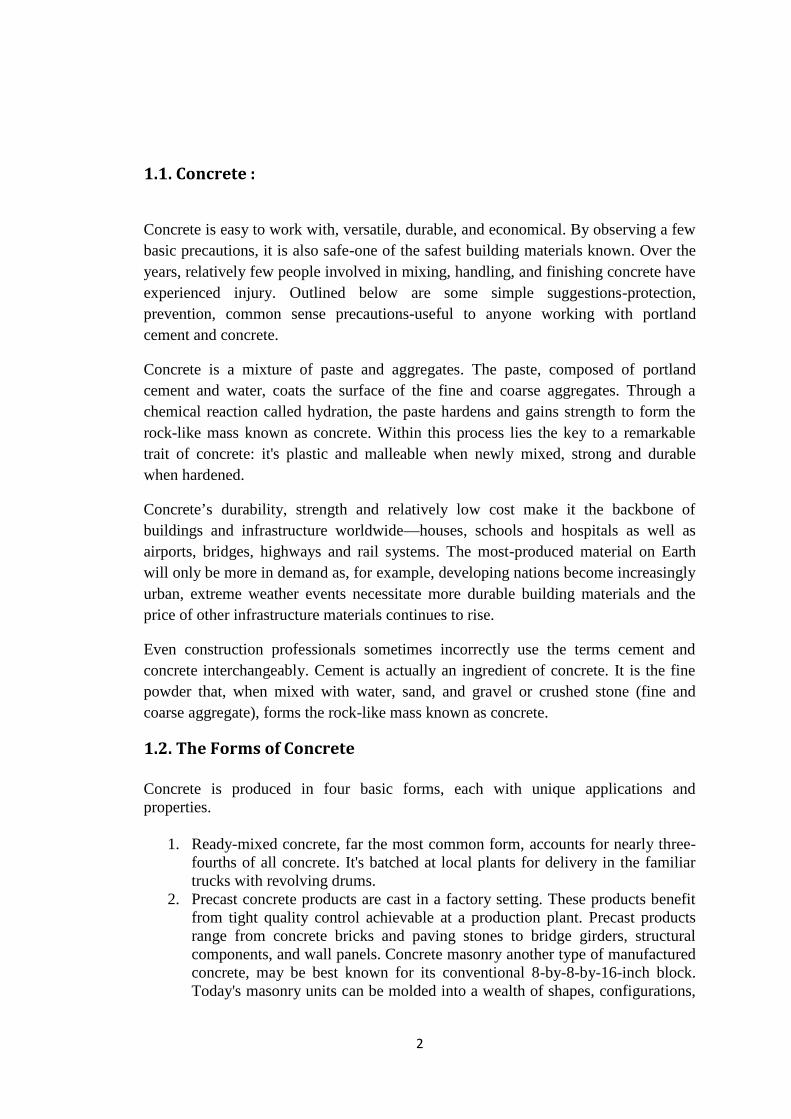
Concrete is easy to work with, versatile, durable, and economical. By observing a fewbasic precautions, it is also safe-one of the safest building materials known. Over theyears, relatively few people involved in mixing, handling, and finishing concrete haveexperienced injury. Outlined below are some simple suggestions-protection,prevention, common sense precautions-useful to anyone working with portlandcement and concrete.
Concrete is a mixture of paste and aggregates. The paste, composed of portlandcement and water, coats the surface of the fine and coarse aggregates. Through achemical reaction called hydration, the paste hardens and gains strength to form therock-like mass known as concrete. Within this process lies the key to a remarkabletrait of concrete: it's plastic and malleable when newly mixed, strong and durablewhen hardened.
Concrete’s durability, strength and relatively low cost make it the backbone ofbuildings and infrastructure worldwide—houses, schools and hospitals as well asairports, bridges, highways and rail systems. The most-produced material on Earthwill only be more in demand as, for example, developing nations become increasinglyurban, extreme weather events necessitate more durable building materials and theprice of other infrastructure materials continues to rise.
Even construction professionals sometimes incorrectly use the terms cement andconcrete interchangeably. Cement is actually an ingredient of concrete. It is the finepowder that, when mixed with water, sand, and gravel or crushed stone (fine andcoarse aggregate), forms the rock-like mass known as concrete.
1.2. The Forms of Concrete
Concrete is produced in four basic forms, each with unique applications andproperties.
1. Ready-mixed concrete, far the most common form, accounts for nearly three-fourths of all concrete. It's batched at local plants for delivery in the familiartrucks with revolving drums.
2. Precast concrete products are cast in a factory setting. These products benefitfrom tight quality control achievable at a production plant. Precast productsrange from concrete bricks and paving stones to bridge girders, structuralcomponents, and wall panels. Concrete masonry another type of manufacturedconcrete, may be best known for its conventional 8-by-8-by-16-inch block.Today's masonry units can be molded into a wealth of shapes, configurations,

3
colors, and textures to serve an infinite spectrum of building applications andarchitectural needs.
3. Cement-based materials represent products that defy the label of "concrete,"yet share many of its qualities. Conventional materials in this category includemortar, grout, and terrazzo. soil-cement and roller-compacted concrete —"cousins" of concrete—are used for pavements and dams. Other products inthis category include flowable fill and cement-treated bases.
4. A new generation of advanced products incorporates fibers and specialaggregate to create roofing tiles, shake shingles, lap siding, and countertops
1.3. Cement :
Cement is the most widely used construction material throughout the world. Thisleads to an enormous production of cement to meet the increasing demand for housingand infrastructure. Cement production is however harmful on the environment due tocarbon dioxide emission. Reducing cement production while maintaining sustainabledevelopment has been an important issue in the development of constructionmaterials. Replacing Portland cement with percentages of pozzolana has beenreported as a good alternative.
Each year, the concrete industry produces about 12 billion tonnes of concrete and usesabout 2.86 billion tonnes of Portland cement worldwide (Global Cement Report,2010). Indeed, with the manufacture of one tonne of cement, approximately 0.8 tonneof CO2 are released into the atmosphere. About 50% of the CO2 produced duringcement manufacture is due to fossil fuel consumption and the rest due to thecalcination of the limestone (Claus and Guimaraes, 2007). The cement industryaccounts for 5 – 8% of global CO2 emission. This makes the cement industry thesecond largest producer of this greenhouse gas (Scrivener and Kirk, 2007). Also theSO3 and NOx released as a result of Portland cement manufacture can cause seriousenvironmental impact such as greenhouse effect and acid rain (Dongxu et al, 2000).
It is obvious that minimization of production of Portland cement clinker would greatlyhelp to reduce the CO2 emission produced by the cement industry. One wise solutionis to promote the usage of pozzolanic materials in mortar and concrete works therebyreducing the world‘s demand for Portland cement which eventually reduces theemission of CO2 into the atmosphere.
1.4. Pozzolanic CementPozzolanic materials when used in mortar and concrete works improve durabilitywhich is the ability of concrete to resist weathering action, chemical attack andabrasion. Pozzolanic materials also bring in other technical advantages such as lowheat of hydration and high ultimate strength. The higher strength of concrete with
4
pozzolanas at later ages is as a result of the pozzolanic reactions increasing theamount of calcium silicate hydrates (C-S-H) while diminishing Ca(OH)2 (Helmuth,1987)
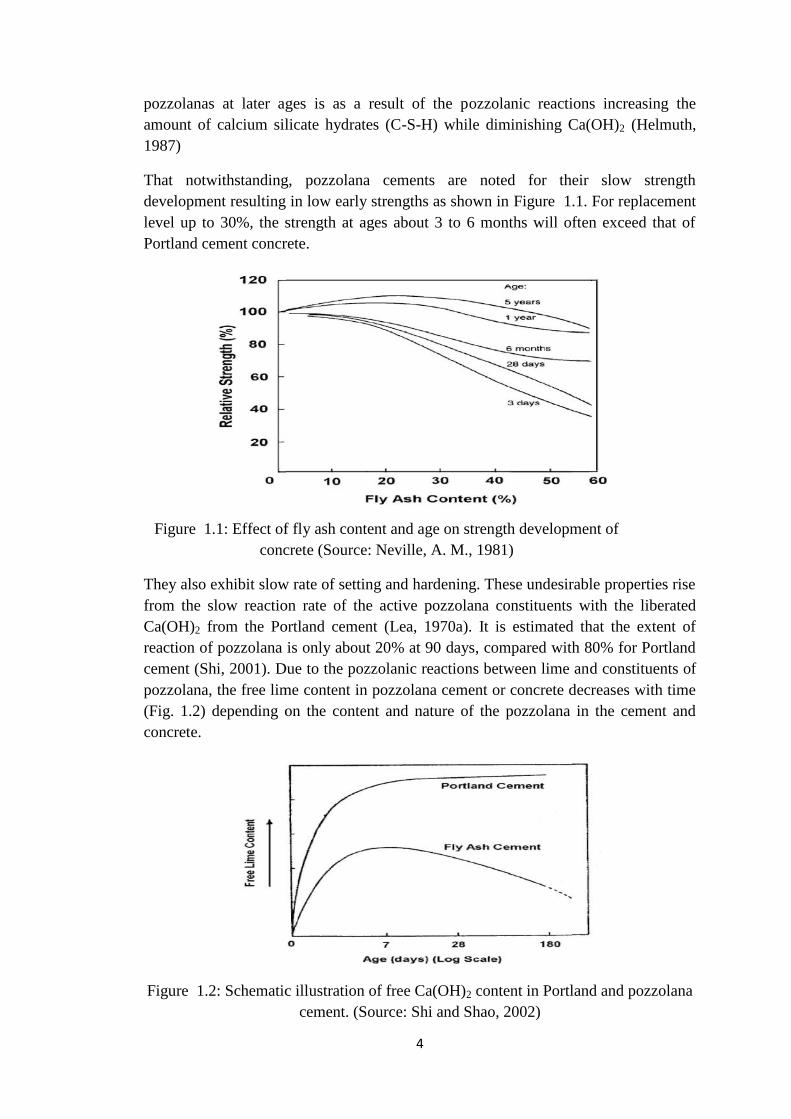
That notwithstanding, pozzolana cements are noted for their slow strengthdevelopment resulting in low early strengths as shown in Figure 1.1. For replacementlevel up to 30%, the strength at ages about 3 to 6 months will often exceed that ofPortland cement concrete.
Figure 1.1: Effect of fly ash content and age on strength development ofconcrete (Source: Neville, A. M., 1981)
They also exhibit slow rate of setting and hardening. These undesirable properties risefrom the slow reaction rate of the active pozzolana constituents with the liberatedCa(OH)2 from the Portland cement (Lea, 1970a). It is estimated that the extent ofreaction of pozzolana is only about 20% at 90 days, compared with 80% for Portlandcement (Shi, 2001). Due to the pozzolanic reactions between lime and constituents ofpozzolana, the free lime content in pozzolana cement or concrete decreases with time(Fig. 1.2) depending on the content and nature of the pozzolana in the cement andconcrete.
Figure 1.2: Schematic illustration of free Ca(OH)2 content in Portland and pozzolanacement. (Source: Shi and Shao, 2002)
4
pozzolanas at later ages is as a result of the pozzolanic reactions increasing theamount of calcium silicate hydrates (C-S-H) while diminishing Ca(OH)2 (Helmuth,1987)
That notwithstanding, pozzolana cements are noted for their slow strengthdevelopment resulting in low early strengths as shown in Figure 1.1. For replacementlevel up to 30%, the strength at ages about 3 to 6 months will often exceed that ofPortland cement concrete.
Figure 1.1: Effect of fly ash content and age on strength development ofconcrete (Source: Neville, A. M., 1981)
They also exhibit slow rate of setting and hardening. These undesirable properties risefrom the slow reaction rate of the active pozzolana constituents with the liberatedCa(OH)2 from the Portland cement (Lea, 1970a). It is estimated that the extent ofreaction of pozzolana is only about 20% at 90 days, compared with 80% for Portlandcement (Shi, 2001). Due to the pozzolanic reactions between lime and constituents ofpozzolana, the free lime content in pozzolana cement or concrete decreases with time(Fig. 1.2) depending on the content and nature of the pozzolana in the cement andconcrete.
Figure 1.2: Schematic illustration of free Ca(OH)2 content in Portland and pozzolanacement. (Source: Shi and Shao, 2002)

5
Early strength is a critical measure in concrete industry since it determines the speedof construction. Therefore, low early strength development is an obstacle inpromoting pozzolana usage as Portland cement replacement. In order to overcomeslow early strength development and high setting times in pozzolanic materials,techniques such as thermal activation, mechanical activation and chemical activationhave been proposed in literature.
Mechanical activation (prolonged grinding) can increase the reactivity of pozzolana tosome extent. Grinding, however, is an energy intensive process and needscomplicated facilities. Spherical pozzolana particles are broken during grinding,which will result in higher water demand for a given workability and thus somewhatoffset the improvements in reactivity due to grinding (Shi and Shao, 2002). Also,elevated temperature curing increases the strength development rate, but decreases theultimate strength of concrete (Shi and Shao, 2002) and could be very expensive.
A comparison based on strength-cost relationship indicates that the addition ofchemical activators into concrete and mortar mixtures is the most simple, efficient andinexpensive technique for enhancing reactivity of pozzolana cement (Shi and Day,2001).
1.5. Chemical activation :
This study seeks to investigate how the setting time and early strength of pozzolanacements can be improved by the application of chemical activators such as CaCl2,Na2SO4, and AlCl3. In chemical activation, the pozzolana cement is treated with achemical compound solution before the mortar or concrete is prepared. The chemicalcompound, as a separate ingredient, can also be dissolved in the water to be used toprepare the mortar or concrete.
Construction documents often specify a cement type based on the requiredperformance of the concrete or the placement conditions. Certain cementmanufacturing plants only produce certain types of portland cement.
1.6. What are the differences in these cement types and how are theytested, produced, and identified in practice?
In the most general sense, portland cement is produced by heating sources of lime,iron, silica, and alumina to clinkering temperature (2,500 to 2,800 degrees Fahrenheit)in a rotating kiln, then grinding the clinker to a fine powder. The heating that occursin the kiln transforms the raw materials into new chemical compounds. Therefore, thechemical composition of the cement is defined by the mass percentages andcomposition of the raw sources of lime, iron, silica, and alumina as well as thetemperature and duration of heating. It is this variation in raw materials source and theplant-specific characteristics, as well as the finishing processes (i.e. grinding andpossible blending with gypsum, limestone, or supplementary cementing materials),that define the cement produced.

6
1.7. Standards
To ensure a level of consistency between cement-producing plants, certain chemicaland physical limits are placed on cements. These chemical limits are defined by avariety of standards and specifications. For instance, portland cements and blendedhydraulic cements for concrete in the U.S. conform to the American Society forTesting and Materials (ASTM) C150 (Standard Specification for Portland Cement),C595 (Standard Specification for Blended Hydraulic Cement) or C1157 (PerformanceSpecification for Hydraulic Cements).
Some state agencies refer to very similar specifications: AASHTO M 85 for portlandcement and M 240 for blended cements. These specifications refer to standard testmethods to assure that the testing is performed in the same manner. For example,ASTM C109 (Standard Test Method for Compressive Strength for Hydraulic CementMortars using 2-inch Cube Specimens), describes in detail how to fabricate and testmortar cubes for compressive strength testing in a standardized fashion.
1.8. Nomenclature Differences
In the US, three separate standards may apply depending on the category of cement.For portland cement types, ASTM C150 describes:
Cement Type DescriptionType I NormalType II Moderate Sulfate ResistanceType II (MH) Moderate Heat of Hydration (and Moderate SulfateResistance)Type III High Early StrengthType IV Low Heat HydrationType V High Sulfate Resistance
For blended hydraulic cements – specified by ASTM C595 – the followingnomenclature is used:
Cement Type DescriptionType IL Portland-Limestone CementType IS Portland-Slag CementType IP Portland-Pozzonlan CementType IT Ternary Blended Cement
In addition, some blended cements have special performance properties verified byadditional testing. These are designated by letters in parentheses following the cementtype. For example Type IP(MS) is a portland-pozzolan cement with moderate sulfateresistance properties. Other special properties are designated by (HS), for high sulfateresistance; (A), for air-entraining cements; (MH) for moderate heat of hydration; and(LH) for low heat of hydration. Refer to ASTM C595 for more detail.
However, with an interest in the industry for performance-based specifications, ASTM C1157describes cements by their performance attributes:

7
Cement Type DescriptionType GU General UseType HE High Early-StrengthType MS Moderate Sulfate ResistanceType HS High Sulfate ResistanceType MH Moderate Heat of HydrationType LH Low Heat of Hydration
Note: For a thorough review of US cement types and their characteristics see PCA’sDesign and Control of Concrete Mixtures, EB001 or Effect of Cement Characteristicson Concrete Properties, EB226.
1.9. Relative Cost
There is an inherent desire by most people to own decent and affordable houses. Onaverage, the cost of building materials for a housing structure comprises about 50percent of the total cost of the building (Jones and Dhir, 2000). For lower incomeshelters this percentage could rise to as much as 80 percent depending on the countrywhere the construction occurs (Laban and Benedetti, 2002; Jones and Dhir, 2000).The high cost is normally attributed to the high prices of cement. A majority of thecitizens in developing countries, especially where the Government do not have anestablished housing and shelter system, cannot afford the cement, which is a majorbuilding binder for housing and construction in general (Muthengia, 2008). This haslead to the mushrooming of slums such as Kibera in Nairobi-Kenya. There is anincreasing demand for decent housing as the shanty houses poses various healthchallenges (Ghebreyesus et al., 2000).
The cost of construction materials is increasing day by day because of high demand,scarcity of raw materials and high price of energy. Portland cement is the mostcommon type of cement used in construction. It is an expensive binder due to the highcost of production associated with the high energy requirements of its manufacturingprocess (Neville, 1995). From the standpoint of energy saving and environmentalconservation, the use of alternative constituents in construction materials is now aglobal concern.
Other relatively low cost materials with cementitious properties are natural pozzolanasuch as volcanic tuff, clay and waste products from industrial plants such as slag, flyash and silica fume. They can be used as a partial replacement for Portland cement tomake blended cements. In addition, to reduce the cost of binder, there are potentialtechnological benefits from the use of pozzolanic materials as those blended withPortland cement in concrete applications. These include decreased permeability ofaggressive ions and increased ultimate strength and durability of concrete. Thesebenefits have lead to an increased demand for pozzolanic materials for use in makingpozzolanic cements..

8
1.10. Physical and Chemical Performance Requirements
Chemical tests verify the content and composition of cement,while physical testingdemonstrates physical criteria.
In C150/M 85 and C595/M 240, both chemical and physical properties are limited. InC1157, the limits are almost entirely physical requirements.
Chemical testing includes oxide analyses (SiO2, CaO, Al2O3, Fe2O3, etc.) to allow thecement Case composition to be calculated. Type II cements are limited in C150/M 85to a maximum of 8 percent by mass of tricalcium aluminate (a cement Case, oftenabbreviated C3A), which impacts a cement’s sulfate resistance. Certain oxides are alsothemselves limited by specifications: For example, the magnesia (MgO) contentwhich is limited to 6 percent maximum by weight for portland cements, because it canimpact soundness at higher levels.
Typical physical requirements for cements are: air content, fineness, expansion,strength, heat of hydration, and setting time. Most of these physical tests are carriedout using mortar or paste created from the cement. This testing confirms that a cementhas the ability to perform well in concrete; however, the performance of concrete inthe field is determined by all of the concrete ingredients, their quantity, as well as theenvironment, and the handling and placing procedures used.
Although the process for cement manufacture is relatively similar across NorthAmerica and much of the globe, the reference to cement specifications can bedifferent depending on the jurisdiction. In addition, test methods can vary as well, sothat compressive strength requirements (for example) in Europe don’t ‘translate’directly to those in North America. When ordering concrete for construction projects,work with a local concrete producer to verify that cement meeting the requirementsfor the project environment and application is used, and one that meets the appropriatecement specification.
1.11. Supplementary Cementing Materials:

9
Supplementary cementing materials (SCMs) contribute to the properties of hardenedconcrete through hydraulic or pozzolanic activity. Typical examples are fly ashes,slag cement (ground, granulated blast-furnace slag), and silica fume. These can beused individually with portland or blended cement or in different combinations.Supplementary cementing materials are often added to concrete to make concretemixtures more economical, reduce permeability, increase strength, or influence otherconcrete properties.
1.11.1 Fly ash
The most commonly used pozzolan in concrete, is a by-product of thermal powergenerating stations. Commercially available fly ash is a finely divided residue thatresults from the combustion of pulverized coal and is carried from the combustionchamber of the furnace by exhaust gases.
1.11.2 Slag Cement
Formerly referred to as ground, granulated blast-furnace slag, is a glassy, granularmaterial formed when molten, iron blast-furnace slag is rapidly chilled - typically bywater sprays or immersion in water - and subsequently ground to cement fineness.Slag cement is hydraulic and can be added to cement as an SCM.
1.11.3 Silica fume
Also called condensed silica fume or microsilica, is a finely divided residue resultingfrom the production of elemental silicon or ferro-silicon alloys that is carried from thefurnace by the exhaust gases. Silica fume, with or without fly ash or slag, is oftenused to make high-strength concrete.
1.11.4 Aggregates :
Aggregates are inert granular materials such as sand, gravel, or crushed stone that,along with water and portland cement, are an essential ingredient in concrete.For a good concrete mix, aggregates need to be clean, hard, strong particles free ofabsorbed chemicals or coatings of clay and other fine materials that could cause thedeterioration of concrete. Aggregates, which account for 60 to 75 percent of the totalvolume of concrete, are divided into two distinct categories--fine and coarse. Fineaggregates generally consist of natural sand or crushed stone with most particlespassing through a 3/8-inch sieve. Coarse aggregates are any particles greater than 0.19inch, but generally range between 3/8 and 1.5 inches in diameter. Gravels constitutethe majority of coarse aggregate used in concrete with crushed stone making up mostof the remainder.
Natural gravel and sand are usually dug or dredged from a pit, river, lake, or seabed.Crushed aggregate is produced by crushing quarry rock, boulders, cobbles, or large-size gravel. Recycled concrete is a viable source of aggregate and has beensatisfactorily used in granular subbases, soil-cement, and in new concrete.

10
After harvesting, aggregate is processed: crushed, screened, and washed to obtainproper cleanliness and gradation. If necessary, a benefaction process such as jiggingor heavy media separation can be used to upgrade the quality. Once processed, theaggregates are handled and stored to minimize segregation and degradation andprevent contamination.
Aggregates strongly influence concrete's freshly mixed and hardened properties,mixture proportions, and economy. Consequently, selection of aggregates is animportant process. Although some variation in aggregate properties is expected,characteristics that are considered include:
grading durability particle shape and surface texture abrasion and skid resistance unit weights and voids absorption and surface moisture
1.11.5 Grading
It refers to the determination of the particle-size distribution for aggregate. Gradinglimits and maximum aggregate size are specified because these properties affect theamount of aggregate used as well as cement and water requirements, workability,pumpability, and durability of concrete. In general, if the water-cement ratio is chosencorrectly, a wide range in grading can be used without a major effect on strength.When gap-graded aggregate are specified, certain particle sizes of aggregate areomitted from the size continuum. Gap-graded aggregate are used to obtain uniformtextures in exposed aggregate concrete. Close control of mix proportions is necessaryto avoid segregation.
1.12 Shape and Size Matter
Particle shape and surface texture influence the properties of freshly mixed concretemore than the properties of hardened concrete. Rough-textured, angular, andelongated particles require more water to produce workable concrete than smooth,rounded compact aggregate. Consequently, the cement content must also be increasedto maintain the water-cement ratio. Generally, flat and elongated particles are avoidedor are limited to about 15 percent by weight of the total aggregate. Unit-weightmeasures the volume that graded aggregate and the voids between them will occupyin concrete.

11
Chapter 2
LITERATURE REVIEW

12
2.1 Portland Cement
Cement is defined as a powdered material that chemically reacts with water andtherefore attains the property of setting and hardening (Neville, 1996). This propertymakes the cement hydraulic. Portland cement is made by heating raw materials withan appropriate chemistry, usually mixture of limestone and clay, to a temperaturebetween 1400oC and 1600oC, where the two materials interact chemically to formthe calcium silicates. Partial fusion occurs, and nodules of clinker are produced. Theclinker is mixed with a few percent of calcium sulphate and finely ground, to makethe cement.
Limestone + Clay Clinker + 2%gypsum Portlandcement
Some modern cement specifications, EN 197-1, also permit adding up to 5%limestone in the course of clinker grinding. The calcium sulphate, which is commonlydescribed as gypsum, controls the rate of set and influences the rate of strengthdevelopment. The clinker chemically has a composition of CaO, SiO2, Al2O3, andFe2O3, all constituting about 80% of Portland cement. The other significant minoroxides are MgO, SO3, K2O and Na2O (Lea, 1970). Cement clinker particles aremultiCase solids. Each Case has a specific reaction with water to produce a range ofhydration products.
Alite (C3S) is the most important constituent of all normal Portland cement clinkersand it constituents 50-70% of the total composition of the clinker. It is tricalciumsilicate (Ca3SiO5) modified in composition and crystal structure by ionic substitutions.It reacts relatively quickly with water, and is the most important of the constituentCases for strength development up to 28 days. Belite (C2S) constitutes 15-30% ofnormal Portland cement clinkers. It is dicalcium silicate (Ca2SiO4) and normallypresents wholly or largely as β polymorph. It reacts slowly with water, thuscontributing later-age strength beyond 28 days (Taylor, 1997).
Aluminate constitutes 5-10% of most normal Portland cement clinkers. It is tricalciumaluminate (3CaO.Al2O3), substantially modified in composition and sometimes also instructure by ionic substitutions. It reacts rapidly with water, and can cause undesirablyrapid setting unless a set-controlling agent, such as gypsum, is added (Taylor, 1997).Ferrite makes up 5-15% of normal Portland cement clinkers. It is tetracalciumaluminoferrite (Ca2AlFeO5), substantially modified in composition by variation inAl/Fe ratio and ionic substitutions. The rate at which it reacts with water appears to besomewhat variable, perhaps due to differences in composition or other characteristics,but in general is high initially and low or very low at 28 days (Taylor, 1997). Table2.3 shows the compositions of Cases in Portland cement clinker.

13
2.2 Durability
It is the capacity of concrete to resist deterioration caused by environment, humanactivities and also forces from loading that occupy a structure. It normally refers tothe duration or life span of the concrete itself. The service life and durability of aconcrete structure strongly depend on its material transport properties, such aspermeability, sorptivity, and diffusivity which are controlled by the microstructuralcharacteristics of concrete [1]. There are many properties of concrete that is related toits durability such as absorption, strength and workability. It is known that theporosity is the critical components of the microstructure of hydrated cement paste thatinfluence durability.
Porosity is the volume of voids that occupy a concrete. In order to achieve highstrength, low permeability, and durable concrete, it is therefore necessary to reducethe porosity of cement paste [2]. Mortar are basically consists of cement, sand, waterand additional material, known as an admixture added to modify certain of itsproperties. It is well known that the incorporation of pozzolanic materials as partialreplacement of cement refines the porosity of the paste. Mortars with pozzolanreplacement are known as modified cement mortar. Various types of pozzolanicmaterials have been used in the construction industry to produce mortar or concrete toreduce the use of OPC for a long time [3].
2.3 Pozzolanic materials :
They are consist of either natural (Trass, zeolite, metakaolinite, burned clay) orartificial (silica fume, fly ash, blast furnace slag) types [4]. The use of additionalcementitious materials due to economic, technical and environmental considerationshas become common practice in modern concrete construction industry [5, 6].
The use of pozzolanic materials as a replacement addition to cement in production isuseful for a number of purposes. This is reduces concrete production cost and alsoreduce high energy consumption as the production of OPC usually needs lots ofenergy [7]. One of factors that related to the strength of concrete is fundamentally afunction of the volume of voids in it. Usually, the higher amount of voids in theconcrete, the less strength it will exhibit. In addition, the curing condition also mayaffect the strength of the mortar or concrete. “Strictly speaking, strength of concrete isinfluenced by the volume of all voids in concrete: entrapped air, capillary pores, gelpores, and entrained air, if present [8]”.
Much of the researches have been conducted on the durability and strength ofconcrete madewith mineral admixtures [9-12].
2.3.1 Fly ash (FA)
It is waste materials from the thermal power plant. Fly ash is known to be a goodpozzolanic material for use in concrete [3]. According to ASTM C618-85 [13], thereare two basic types of FA: Class F (low-calcium FA) and Class C (high-calcium FA).
14
Its physical and chemical properties depend exclusively on the quality of coal usedand on technological conditions of burning. FA is added to Portland cement (PC) ordirectly to mortars or concretes [14].
2.3.2 Silica fume (SF)
It is a by-product resulting from the reduction of high-purity quartz with coal inelectric arc furnaces [15]. It has been observed that the presence of such particles canreduce the positive effect of the SF on the microstructure and mechanical propertiesof the mortars [16, 17]. The use of SF decreases the permeability, thereby increasingthe resistance of concrete against corrosion [18, 19], improving its strength anddurability [20, 21]. The advantages of SF caused SF being the most well-knownadditive material for high strength concrete in recent years.
2.3.3 Blast furnace slag
It is a nonmetallic coproduct produced in the process. It consists primarily of silicates,aluminosilicates, and calcium-alumina-silicates. The molten slag, which absorbsmuch of the sulfur from the charge, comprises about 20 percent by mass of ironproduction.
The void content between particles affects the amount of cement paste required forthe mix. Angular aggregates increase the void content. Larger sizes of well-gradedaggregate and improved grading decrease the void content. Absorption and surfacemoisture of aggregate are measured when selecting aggregate because the internalstructure of aggregate is made up of solid material and voids that may or may notcontain water. The amount of water in the concrete mixture must be adjusted toinclude the moisture conditions of the aggregate.
2.4 Abrasion and skid resistance of an aggregate
They are essential when the aggregate is to be used in concrete constantly subject toabrasion as in heavy-duty floors or pavements. Different minerals in the aggregatewear and polish at different rates. Harder aggregate can be selected in highly abrasiveconditions to minimize wear.
Cement is the major industrial commodity That is commercially manufactured in over120 countries Mixed with aggregates and water Cement forms the ubiquitousconcrete which is used in constructions.
2.5 Concrete Strength
Strength is usually the basis for acceptance or rejection of the concrete in thestructure. The specifications or code designate the strength (nearly alwayscompressive) required of the concrete in the several parts of the structure. In thosecases in which strength specimens fail to reach the required value, further testing of

15
the concrete in place is usually specified. This may involve drilling cores from thestructure or testing with certain nondestructive instruments that measure the hardnessof the concrete. Strength is necessary when computing a proposed mix for concrete,as the contemplated mix proportions are based on the expected strength-makingproperties of the constituent.
The methods and technology for producing high strength concrete are not basicallydifferent from those required for concrete of normal grade except that the emphasis onquality control is perhaps greater with High strength concrete. High strength concretecan be produced with all of the cements and cement replacements normally availablein Singapore, including Portland cement, sulfate-resisting Portland cement, andcombinations with pulverised fuel ash and ground granulated blast furnace, silicafume slag. High early strength cements should preferably be avoided as a rapid rise inhydration temperature may cause problems of (internal) cracks or micro-cracks due tothe higher cementitious material content. The porosity (i.e. the volumetric proportionof voids) of concrete has been used extensively for the prediction of the properties ofconcrete.
2.6 Variation of concrete strength
The strength activity index with portland cement is not to be considered a measure ofthe compressive strength of concrete containing the fly ash or natural pozzolan. Themass of fly ash or natural pozzolan specified for the test to determine the strengthactivity index with portland cement is not considered to be the proportionrecommended for the concrete to be used in the work. The optimum amount of fly ashor natural pozzolan for any specific project is determined by the required properties ofthe concrete and other constituents of the concrete and is to be established by testing.Strength activity index with portland cement is a measure of reactivity with a givencement and is subject to variation depending on the source of both the fly ash ornatural pozzolan and the cement.
Thus the use of high volume fly ash in concrete has recently gained popularity as aresource-efficient, durable, cost-effective, sustainable option for ordinary portlandcement (OPC) concrete applications
So It is not possible to design a concrete mix of high strength with cement of lowstrength. The variation in strength of cement is due largely to the lack of uniformity inthe raw materials used in its manufacture, not only between different source ofsupply, but also with in a quarry. Further, differences in details of the process ofmanufacture and above all, the variation in the ash content of coal used to fire thekilin, contribute to the variation in the properties of commercial cements . Portlandcomposite cement is a hydraulic binder. It is produced by grinding clinker and acertain amount of gypsum, fly ash, slag and limestone.
Due to variation of cement strength, the concrete made from these cement will alsohave variable strength. For a correct approach in the Concrete Mix Design, if thefacilities at site are available, with the given set of materials, requirements and site
16
conditions own W/C ratio v/s compressive strength of concrete curve should bedeveloped at site itself.
It is often observed that cement bags marked as OPC Grade may really be containingcement of much higher grade. PPC cement as per IS Code is only of 33 Grade. Whereas on bags it is marked as 43 MPa or 53 MPa. Site cement samples should be testedfor its actual strength and other properties. There are instances where higher gradecement is being used even for low strength concrete, as mortar or even for plastering.This can lead to unnecessary cracking of concrete/surfaces.
In low grade OPC, the gain in strength will continue beyond 28th day. Due to earlystrength gain of higher grade of OPC the concrete strength do not increase muchbeyond 28th day. The heat of hydration of higher grade OPC being higher, thechances of micro-cracking of concrete is much greater. Thus during initial settingperiod of concrete, the higher head of hydration can lead to damaging micro-crackingwith in the concrete which may not be visible at surface. The situation can be worsewhen we tend to increase the quantity of the cement in concrete with a belief that suchincrease are better for both strength and durability of concrete.
Concrete durability-related properties are known to be negatively affected due toexpansions that result from factors such as freezing and thawing actions, alkali-aggregate reactions, sulfate attack, corrosion of the reinforcement, etc. Suchexpansions depend, to a large extent, upon ingress of water, gases, and aggressivechemicals into the concrete; which, in turn, depend upon permeability (which dependupon porosity). Therefore, permeability of concrete can be used as a measure ofconcrete durability. Porous concrete used in place of conventional concrete decreasesthe total amount of runoff leaving a site, promotes infiltration of runoff into theground, reduces the amount of pollutants carried to a storm drain or waterway, andaids with reducing peak runoff velocity and volume. porosity affects can be related toconcrete durability.
2.7 Concrete Porosity Activation
Porous concrete is used in place of conventional concrete decreases the total amountof runoff leaving a site, promotes infiltration of runoff into the ground, reduces theamount of pollutants carried to a storm drain or waterway, and aids with reducingpeak runoff velocity and volume.
Developing land for residential, commercial and industrial use carries the detrimentaleffect of vastly increasing the amount of impervious surface area as land is paved tocreate roads and parking lots. During a storm, runoff flows over imperviouspavement, picking up pollutants such as dirt, grease and oil, and transports thesecontaminants to streams and storm sewer systems.
In response to this issue, designers developed porous paving systems that allowrunoff to pass through the pavement into a stone reservoir, before infiltrating the soilbelow to recharge the groundwater supply. With proper installation and maintenance,porous paving allows for infiltration of up to 80% of annual runoff volume.

17
Additionally, studies indicate that porous concrete systems can remove up to 65% ofundissolved nutrients from runoff and up to 95% of sediment in runoff.
The design for application of porous concrete consists of at least three layers: a two tofour-inch layer of porous concrete, a one to two- inch filter layer of half-inch crushedaggregate, a 12- inch minimum reservoir layer of one to three-inch aggregate, and anoptional layer of filter fabric. Porous concrete consists of a mix including Portlandcement, uniform open-graded coarse aggregate, and water. The void space of porousconcrete ranges between 15% and 22%, compared to a three to five percent voidspace in conventional concrete. The concrete itself provides for some pretreatment ofrunoff. The crushed aggregate filter layer aids with removing some pollutants. Runoffis stored in the reservoir bed, a highly permeable layer of open-graded clean-washedaggregate with at least 40% void space. The filtered runoff then percolates through theuncompacted soil base into the groundwater supply.
Porous concrete is placed using forms, then leveled with a screed. No finishing isrequired, and jointing is optional. Take care not to overwork the surface.
Porous concrete is applicable to many light-duty uses, including overflow parkingareas, residential street parking lanes, parking pads in parking lots, sidewalks, golfcart and bike paths, and emergency access lanes. With proper maintenance, includingregular vacuuming of the surface to prevent clogging by sediment, porous concretecan have a minimum service life of 20 years.
2.7.1 Factors affecting porosity
Water to cementitious materials ratio : The w/cm, water to cementitious materialsratio, (here the cementitious materials include pozzolans such as fly ash and silicafume in addition to the hydraulic cements–portland cement and ground slag) is anexceedingly important parameter of the quality of the HCC. It is the main control ofthe compressive strength, abrasion resistance, and permeability. The w/cm can beestimated by petrographic means, or the cement content can be determined bychemical analysis and compared with the cement content specified. The petrographermay be requested to estimate the w/cm whenever concrete does not meet thecompressive strength specifications. Whether requested or not, an estimate of thisratio should be a regularly scheduled portion of any general examination of the HCC.This chapter is primarily focused on the examination of hand specimens or polishedsurfaces.
2.7.2 Chemical Determination
If the compressive strength of the concrete is low, the chloride ion permeability ishigh, the microstructure of the paste appears to be sugary, an aggregate with a knownhigh water demand was used, or more quantitative data are required, a chemicallydetermined cement content of the hardened concrete may be indicated. The cost ofthis analysis and the arrangements with the chemist or testing laboratory are usuallythe responsibility of the client. The methods used over the years for this chemicaldetermination are discussed by Hime (1978) and in ASTM C 1084. Other methods arediscussed by Clemeña (1972) and Pistilli (1976). If the amount of water used isknown (rare in field concrete), the w/cm can be calculated from this determination.

18
The proper chemical determination of the cement content requires the use of a methodappropriate for the type of aggregate present. A chemical determination of the cementcontent gives a result that is an average of the cement content of the specimen andprovides no information on the extreme conditions that may exist in local zones in thespecimen and whose extent and continuity may be critical to the strength anddurability of the subject concrete. The selection of the particular portion of a specimenfor analysis will affect the results. The chemical method cannot distinguish betweencement that has been tied up in only partially hydrated rims and balls and cement thathas dispersed and hydrated and thus contributes to the strength of the HCC. If theportion selected has a large proportion of knots of cement or cement rims onaggregates or both, the results will indicate sufficient cement content. If the portionselected is a light-colored portion containing excess air voids, less than a normalamount of unhydrated cement, and paste with a sugary texture, the resultswill indicatea low cement content. The petrographer must use good judgment in selecting theportion of the specimen for chemical analysis to ensure that it is as representative aspossible. There may be no representative portion of the specimen that is of sufficientsize for chemical analysis. In such cases, the petrographer might inform the clientabout the data already obtained and recommend procuring additional specimens.
The result of the cement analysis is reported (usually to the client) in kilograms percubic meter (kg/m3). If the reported amount of cement is significantly less than theamount of cement intended to have been used in the mixture, then the w/cm is highand either the volume of the concrete increased (usually because of excess water) orless than the prescribed amount of cement was used. Because the analysis is notperformed on specimens of HCC suspected of having a normal or low w/cm, we havenever had to report a case where the cement content indicated that a significant excessof cement was added or that a significant amount of water was omitted.
2.7.3 Degree of hydration :
The hydration of cement can be thought of as a two-step process. In the first step,called dissolution, the Figure 2.1 cement dissolves, releasing ions into the mixwater. The mix water is thus no longer pure H2O, but an aqueous solution containinga variety of ionic species, called the pore solution. The gypsum and the cementminerals C3S and C3A are all highly soluble, meaning that they dissolve quickly.Therefore the concentrations of ionic species in the pore solution increase rapidly assoon as the cement and water are combined. Eventually the concentrations increase tothe point that the pore solution is supersaturated, meaning that it is energeticallyfavorable for some of the ions to combine into new solid Cases rather than remaindissolved. This second step of the hydration process is called precipitation. A keypoint, of course, is that these new precipitated solid Cases, called hydration products,are different from the starting cement minerals. Precipitation relieves thesupersaturation of the pore solution and allows dissolution of the cement minerals tocontinue. Thus cement hydration is a continuous process by which the cementminerals are replaced by new hydration products, with the pore solution acting as anecessary transition zone between the two solid states. The reactions between portlandcement and water have been studied for more than a hundred years, and the fact thathydration proceeds by a dissolution-precipitation process was first elaborated by thefamous chemist Le Chatelier [1].

19
There are two reasons that the hydration products are different from the cementminerals. One reason is that there is a new reactant in the system: water. Not onlydoes the water facilitate the hydration process by dissolving the cement minerals, butit also contributes ions, in the form of hydroxyl groups (OH-), to the hydrationproducts. The second reason is the tendency for all processes to approachthermodynamic equilibrium. This dictates that the solid Cases that precipitate out ofthe pore solution are the ones that are the most stable under the current conditions.The stability of a Case is defined by a parameter called the free energy, which can beroughly defined as the amount of chemical and thermal energy contained in the Case.The lower the free energy, the more stable the Case. the cement minerals are formedat temperatures exceeding 1400?C, because they have the lowest free energy underthose extreme conditions. At the much lower temperatures present during cementhydration, the cement minerals are actually quite unstable, meaning that there aremany other solid Cases that will form preferentially in their place once they dissolve.In fact, the whole point behind the high-temperature cement manufacturing process isto create solid Cases that will readily dissolve in water, allowing new Cases to form.When one Case is converted into another Case with a lower free energy, there isusually a release of excess energy in the form of heat. Such a reaction is termedexothermic, and the exothermic heat associated with cement hydration has alreadybeen defined as the heat of hydration.
2.7.4 Schematic of the rate of hydration or heat evolution as a function of time
Shows a graph of the rate of cement hydration over time, with the hydration processdivided into four somewhat arbitrary stages. Information about the rate of a reaction iscalled kinetics.. Here we will use the general behavior shown in Figure to discuss thevarious processes that occur during hydration.
2.1 Figure : Schematic of the rate of hydration or heat evolution as a function oftime.

20
As noted above, some of the cement minerals and constituents are very soluble, andthus when cement and water are first combined there is a short period of fast reactionand heat output as the cement dissolves, lasting for less than one minute (Stage 1).Stage 1 is brief because of the rapid formation of an amorphous layer of hydrationproduct around the cement particles, which separates them from the pore solution andprevents further rapid dissolution. This is followed by the induction period, duringwhich almost no reaction occurs (Stage 2). The precise nature of the induction period,and in particular the reason for its end, is not fully known, or perhaps it should bestated that it is not fully agreed upon, as there are strongly held but differing opinionsamong cement chemists.During Stage 3, the rapid reaction period, the rate of reaction increases rapidly,reaching a maximum at a time that is usually less than 24 hours after initial mixing,and then decreases rapidly again to less than half of its maximum value. This behavioris due almost entirely to the hydration of the C3S, and the rate of hydration iscontrolled by the rate at which the hydration products nucleate and grow. Both themaximum reaction rate and the time at which it occurs depend strongly on thetemperature and on the average particle size of the cement. This reaction period issometimes divided into two stages (before and after the maximum rate) but as therate-controlling mechanism is the same throughout (nucleation and growth) it ispreferable to treat this as single stage.At the end of Stage 3 about 30% of the initial cement has hydrated, and the paste hasundergone both initial and final set. Stage 3 is characterized by a continuous andrelatively rapid deposition of hydration products (primarily C-S-H gel and CH) intothe capillary porosity, which is the space originally occupied by the mix water. Thiscauses a large decrease in the total pore volume and a concurrent increase in strength.The microstructure of the paste at this point consists of unreacted cores of the cementparticles surrounded by a continuous layer of hydration product, which has a very fineinternal porosity filled with pore solution, and larger pores called capillary pores.
In order for further hydration to take place, the dissolved ions from the cementmust diffuse outward and precipitate into the capillary pores, or water must diffuseinward to reach the unreacted cement cores.
2.7.5 Diffusion Process
These diffusion processes become slower and slower as the layer of hydration productaround the cement particles becomes thicker and thicker. This final period (Stage 4) iscalled the diffusion-limited reaction period.
Figure 2-2 shows the microstructure of a cement paste at it hydrates, as simulatedby a realistic digital image based model [ ]. The yellow Case is the main hydrationproduct, C-S-H gel. At the end of Stage 3, the yellow rims if hydration product havebecome interconnected, causing final set and giving paste some minimal strength. By28 days the image is dominated by C-S-H gel and the porosity has noticeablydecreased. The final amount of porosity will depends strongly on the initial w/c of thepaste.

21
Figure 2.2 : Results of a realistic digital model of cement hydration. Cases are colorcoded: Black=water (pores), Red = C3S, Blue = C2S, Yellow = C-S-H gel. a) Cement
particles dispersed in water just after mixing. (Stage 1). b) 30% hydration, ~ 1 day(end of Stage 3). c) 70% hydration, ~ 28 days (Stage 4). (Images courtesy of NIST).
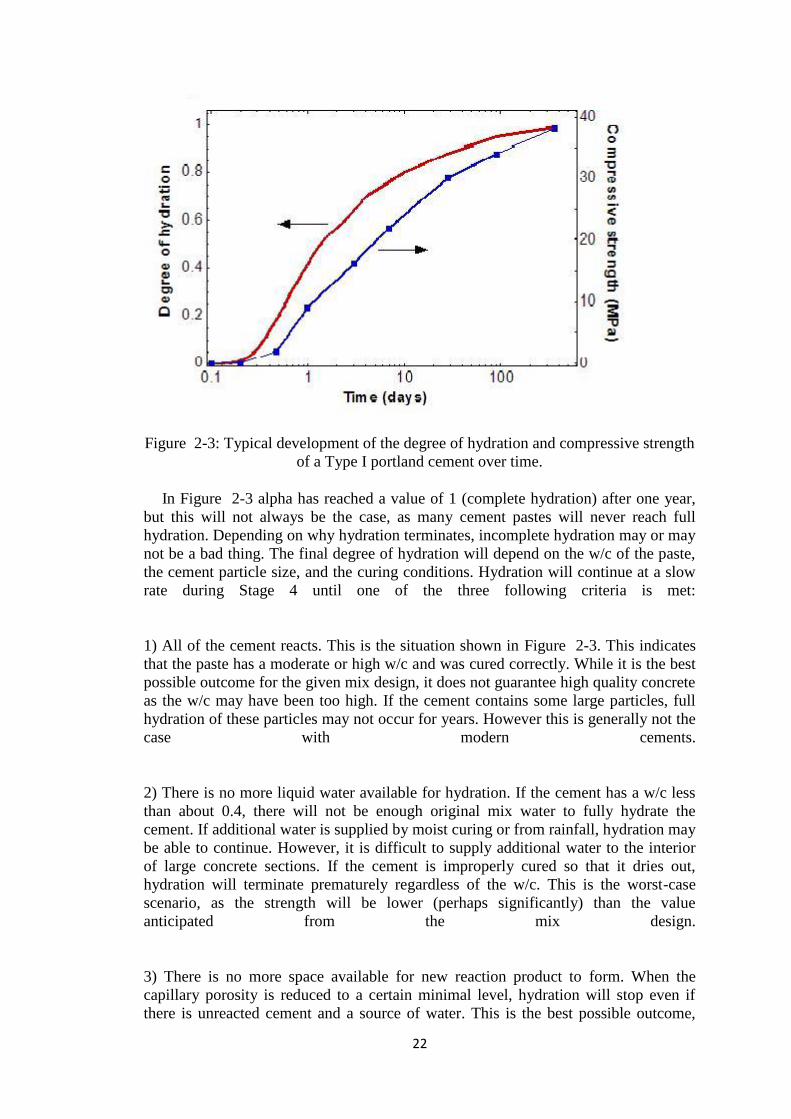
The overall progress of the hydration reactions is described by the degree ofhydration, , which is simply the fraction of the cement that has reacted. Completehydration of all the cement gives = 1. The degree of hydration can be measured in afew different ways, including x-ray measurements to determine how much of theminerals remain and loss on ignition measurements to determine how much boundwater the paste contains. Another common method is to sum the amount of heat givenoff by the paste (as measured by thermal calorimetry) and divide this value by thetotal amount of heat given off for complete hydration. The latter value will depend onthe mineral composition of the cement. Another parameter that can be used to monitorthe progress of hydration is the compressive strength. This is not a precise measure,since the strength depends on many factors other than the progress of the chemicalreactions, but it is very practical since the development of strength is the primaryreason for using cement and concrete in the first place. Figure 2-3 shows the degreeof hydration ( ), and the strength of a Type I OPC paste plotted as a function of timeon the same graph. Note that the time is plotted on a log scale.
From Figure 2-3 it can be seen that the degree of hydration and the strength tracktogether, particularly at later times. This is because the strength of cement pastedepends primarily on the amount of capillary porosity, and the amount of capillaryporosity decreases in proportion to the amount of hydration that has taken place. Thisdecrease occurs because the C-S-H gel Case (including its internal gel pores) occupiessignificantly more volume than the cement minerals it forms from.
22
Figure 2-3: Typical development of the degree of hydration and compressive strengthof a Type I portland cement over time.
In Figure 2-3 alpha has reached a value of 1 (complete hydration) after one year,but this will not always be the case, as many cement pastes will never reach fullhydration. Depending on why hydration terminates, incomplete hydration may or maynot be a bad thing. The final degree of hydration will depend on the w/c of the paste,the cement particle size, and the curing conditions. Hydration will continue at a slowrate during Stage 4 until one of the three following criteria is met:
1) All of the cement reacts. This is the situation shown in Figure 2-3. This indicatesthat the paste has a moderate or high w/c and was cured correctly. While it is the bestpossible outcome for the given mix design, it does not guarantee high quality concreteas the w/c may have been too high. If the cement contains some large particles, fullhydration of these particles may not occur for years. However this is generally not thecase with modern cements.
2) There is no more liquid water available for hydration. If the cement has a w/c lessthan about 0.4, there will not be enough original mix water to fully hydrate thecement. If additional water is supplied by moist curing or from rainfall, hydration maybe able to continue. However, it is difficult to supply additional water to the interiorof large concrete sections. If the cement is improperly cured so that it dries out,hydration will terminate prematurely regardless of the w/c. This is the worst-casescenario, as the strength will be lower (perhaps significantly) than the valueanticipated from the mix design.
3) There is no more space available for new reaction product to form. When thecapillary porosity is reduced to a certain minimal level, hydration will stop even ifthere is unreacted cement and a source of water. This is the best possible outcome,

23
and it is only possible if the w/c is less than about 0.4. Not only will the cement pasteor concrete have a high strength, but it will also have a low permeability and thus bedurable
2.7.6 Air content. :
Air-entrained concrete is typically specified in areas of the country where frost-relateddamage can occur. The measurement of air content in fresh concrete of normaldensity is typically performed using the pressure method (ASTM C 231). Anotheruseful test is ASTM C 173. However, the pressure method is frequently preferredbecause it is relatively fast.
You should begin the test within 15 minutes after obtaining the composite sample.Start by filling the 0.25 ft3 base of the air-content test device in three equal layers, androd each layer 25 times. After rodding, strike the outside of the base with a mallet 12to 15 times to close any air voids. After completing the three equal layers, strike offthe bowl flush at the top to completely fill the 0.25 ft3 volume. At this point, it can beweighed as part of the calculation to determine the fresh concrete unit weight.
Next, latch the top of the air-content test device over the base and fill the air gapbetween the top of the struck-off concrete and the underside of the top of air meterwith water. The meter top is then pressurized with the built-in hand pump until zeroedout (or as calibrated). After a stabilization period, release the pressure in the top andread the air-void content on the dial on the top of the meter. Subtract the aggregatecorrection factor from the dial reading and report the final value.
2.8 Measurement of Air Content in Concrete
Michelle L. Wilson, Portland Cement Association
AASHTOT152 AASHTO T 196 AASHTO T 121
AASHTO T199
(ASTMC231) (ASTM C173) (ASTM C138)
24
Several techniques are available for measuring the air content of fresh concrete. Thisarticle describes five techniques for use with fresh concrete and one technique for usewith hardened concrete. The reader is referred to the appropriate AASHTO or ASTMstandard for full details of each procedure. Failure to maintain and calibrateequipment and to properly follow test procedures are primary causes of problems inthe measurement of air content. Samples should always be obtained in accordancewith AASHTO T 141 (ASTM C172) Standard Method of Test for Sampling FreshlyMixed Concrete.
2.8.1 Pressure Method—AASHTO T 152 (ASTM C231)
AASHTO T 152, Standard Method of Test for Air Content of Freshly Mixed
Concrete by the Pressure Method is based on Boyle’s law, which states that thevolume occupied by air is proportional to the applied pressure. Two types of meters
designated A and B are covered by the standard. The Type A meter is rarely used.
With the Type B meter shown in the photograph, a separate air chamber is connected
through a valve to the test bowl that is filled with concrete. With the valve closed, the
separate chamber is pressurized to a predetermined operating pressure. When the
valve is opened, the air expands into the test chamber, and the pressure drops in
proportion to the air contained within the concrete sample. The pressure gauge is read
in units of air content. Sources of error in the pressure method include incomplete
sample consolidation; over vibration; error in the pressure gauge which may result in
incorrect application of pressure or in gauge malfunction; calibration tests; sampling
methods; aggregate correction factor; and leaks in the needle valve, petcocks, or a
poor fit when the mating surfaces are not clean.
The pressure meter should not be used for concrete made with lightweight aggregates.In these instances, the volumetric method should be used.
2.8.2 Volumetric Method—AASHTO T 196 (ASTM C173)
AASHTO T 196, Standard Method of Test for Air Content of Freshly MixedConcrete by the Volumetric Method relies on displacement of air with water in a
vessel of pre‐calibrated volume. To perform the test, the concrete is consolidated
into the bowl, the apparatus filled with water, and a measured quantity of 70%isopropyl alcohol is added to dispel the foam generated during agitation. Next, themeter is inverted and agitated to free the concrete from the base and to displace airfrom the concrete into the water. The meter is then “rolled and rocked” until all theair has been dispelled from the concrete and the water level is stable. The air contentof the concrete is read directly from the sight tube.
Major sources of error in the volumetric air test are failure to dispel all the air fromthe concrete during the agitation process, and difficulty in reading the liquid level inthe sight tube. Other sources of error include possible variations in percentage of
25
alcohol, use of alcohols other than isopropyl, and failure to allow sufficient time forstability of the reading.
2.8.3 Gravimetric Method—AASHTO T 121 (ASTM C138)
AASHTO T 121, Standard Method of Test for Density (Unit Weight), Yield, and AirContent [Gravimetric] of Concrete determines air content of fresh concrete bycomparing measured density or batch volume to calculated density or volume. Thedensity (unit weight) is determined by weighing a known volume of fresh concrete.The air content is computed using two independent equations given in AASHTO T121. A significant discrepancy in the results from the two equations is an alert tocheck test equipment, procedures, sampling, mix ingredients, and proportions.
The test is sensitive to consolidation and strike‐off of the concrete in the
container; accurate weighing; and the need for precise batch weights, moisturecontents, and densities of all constituent materials.
2.8.4 Chace Air Indicator—AASHTO T 199
AASHTO T 199, Standard Method of Test for Air Content of Freshly MixedConcrete by the Chace Indicator is identical in concept to the volumetric air meter,
but the air collected in this hand‐held device has been liberated from a small fraction
of mortar. The sample size is so small that this is a semi‐quantitative test at best, and
should not be a substitute for the more accurate pressure, volumetric, and gravimetricmethods. It should not be used for determining the compliance of air content with thespecifications.
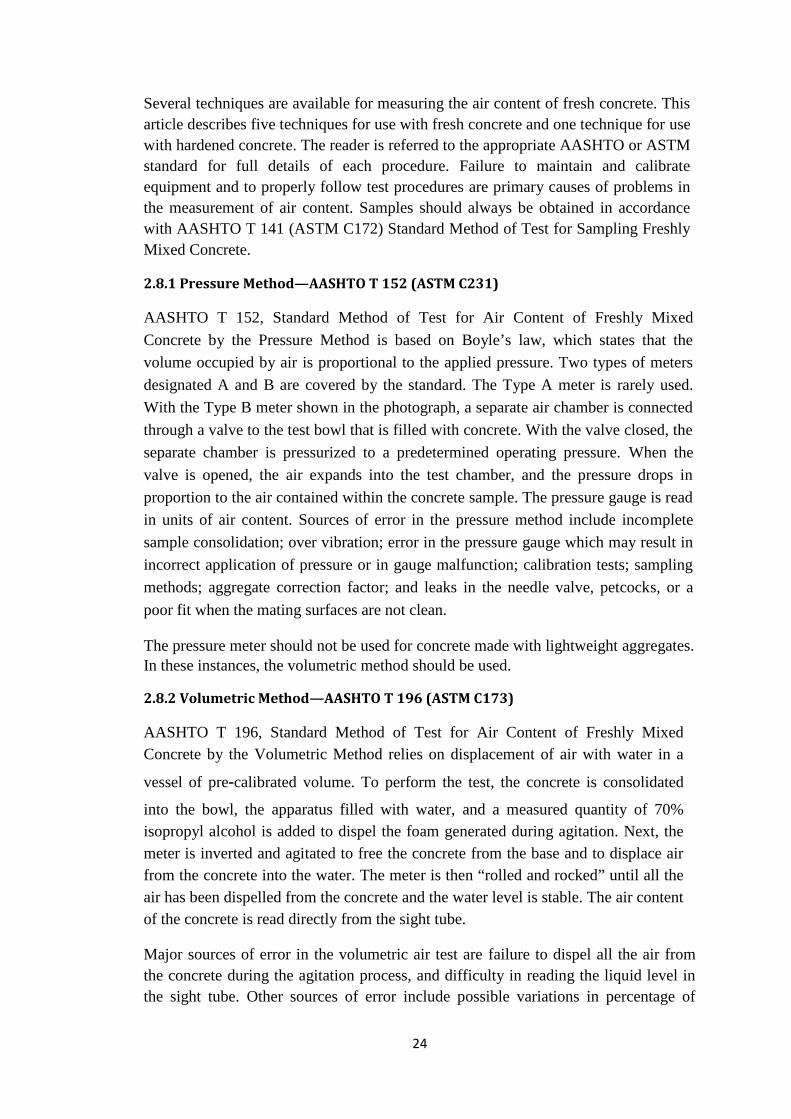
Air Void Analyzer
The air void analyzer (AVA) determines the volume and
size distributions of air voids; thus an estimation of the
spacing factor, specific surface, and total amount of
entrained air can be made. Air bubbles from a sample of
fresh concrete rise through a viscous liquid, enter a
column of water above it, then rise through the water and
collect under a submerged buoyancy recorder. The
viscous liquid retains the original bubble sizes. Large
bubbles rise faster than small ones. The change in
buoyancy is recorded as a function of time and can be
related to the number of bubbles of different sizes

26
2.8.5 AirVoid System—ASTM C457
ASTM C457, Standard Test Method for Microscopical Determination of Parameters
of the Air‐ Void System in Hardened Concrete describes procedures for
microscopical determination of the air content of hardened concrete and of the
specific surface, void frequency, spacing factor, and paste‐air ratio of the air‐void
system in the hardened concrete. Differences between the air content measured onfresh and hardened concrete from the same batch are generally not more than ± 2percentage points.
2.9 Consolidation.
Good concrete consolidation is essential. Lack of consolidation can cause voids, rockpockets, honeycombing, and poor bonding with the rebar. In extreme cases, improperconsolidation can affect the structural integrity of the walls. On the other hand,excessive vibration can create bulged walls and blowouts.
How much vibration does an ICF wall need, and what is the best way to do it? Goodconsolidation is a combination of different factors, and vibration is only one of them.Suitable mix design and correct placement technique are critical, but are not discussedin this article.
Vibration and ICFs is an area that generates significant controversy. ICF-relateddiscussion forums reveal a broad range of opinions and method. In finding aneffective solution for you, the principles below should provide general guidelines.
Modern Forms Are StrongMuch of the confusion over how to vibrate ICFs comes from outdated information.Today's ICFs can withstand internal vibration, and nearly all manufacturers stronglyencourage it. But that hasn't always been the case. As recently as the late 1990's, someICF designs did not have the strength to handle adequate vibration.
ontractors were advised to use orbital sanders, reciprocating saws with the bladeremoved, or even to "bang on the blocks with a short length of 2x4."Unfortunately,these methods do not provide sufficient consolidation. Even more regrettably, thesesub-par methods are still being used by some contractors.
Review an up-to-date installation manual or talk to the technical director at yourpreferred ICF company to get their latest recommendations about consolidationtechniques. If these sources reveal that the form will not withstand internal vibration,consider switching to a more modern ICF design. Jobs with inadequate consolidationnot only damage your reputation, but that of the entire industry.
27
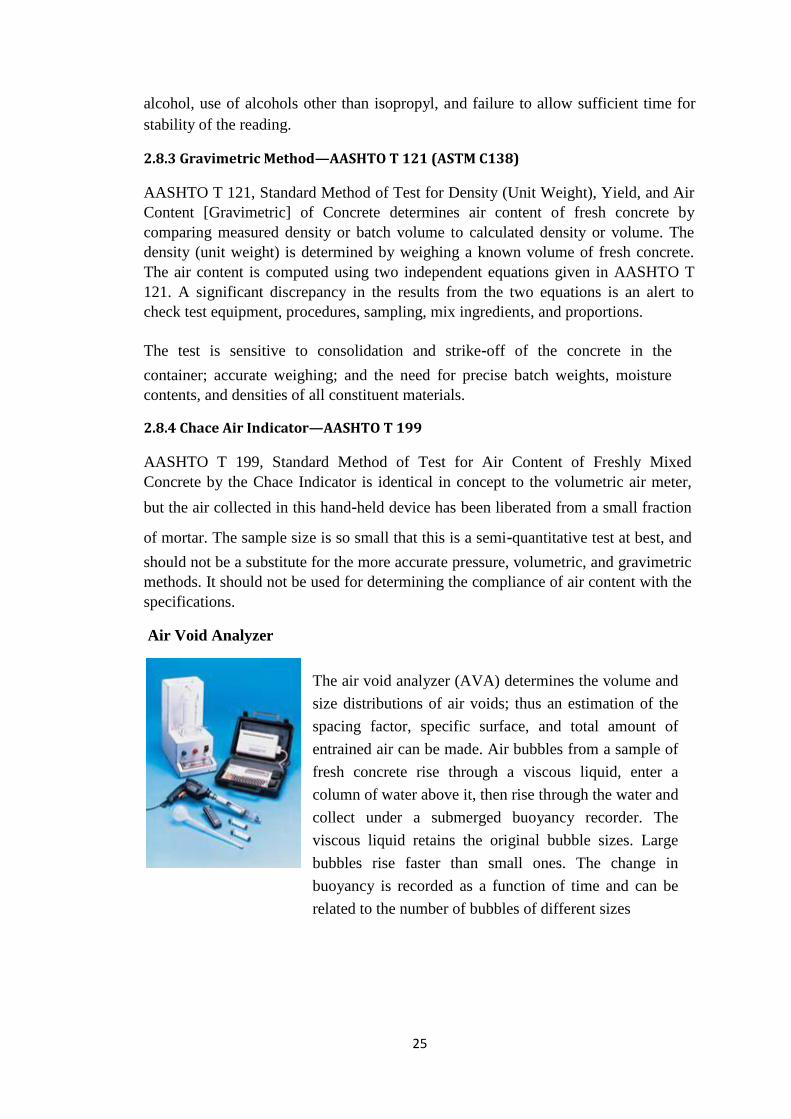
The Portland Cement Association (PCA) conducted an in-depth study of concreteconsolidation and ICFs. They tested flat panels with 4- and 6-inch cores, as well as ascreen grid and waffle grid ICFs. Panels with corners and lintels were also tested. Testsections were filled with low- (3"), medium- (6") and high-slump (8"-10") concreteand vibrated with wood blocks, saws, sanders, and internal vibrators. They also filledtest panels with a self-consolidating concrete (SCC).
In every case, walls filled with low-slump mixes had poor consolidation, regardless ofthe technique used. "External mechanical vibration using a hammer, reciprocatingsaw, or orbital sander did not significantly improve the consolidation of concrete inICF walls…"
On the medium slump panels, external vibration scored slightly better, but not nearlyas well as those that used an internal vibrator. High-slump concrete and SCC achievedadequate consolidation with minimal vibration.
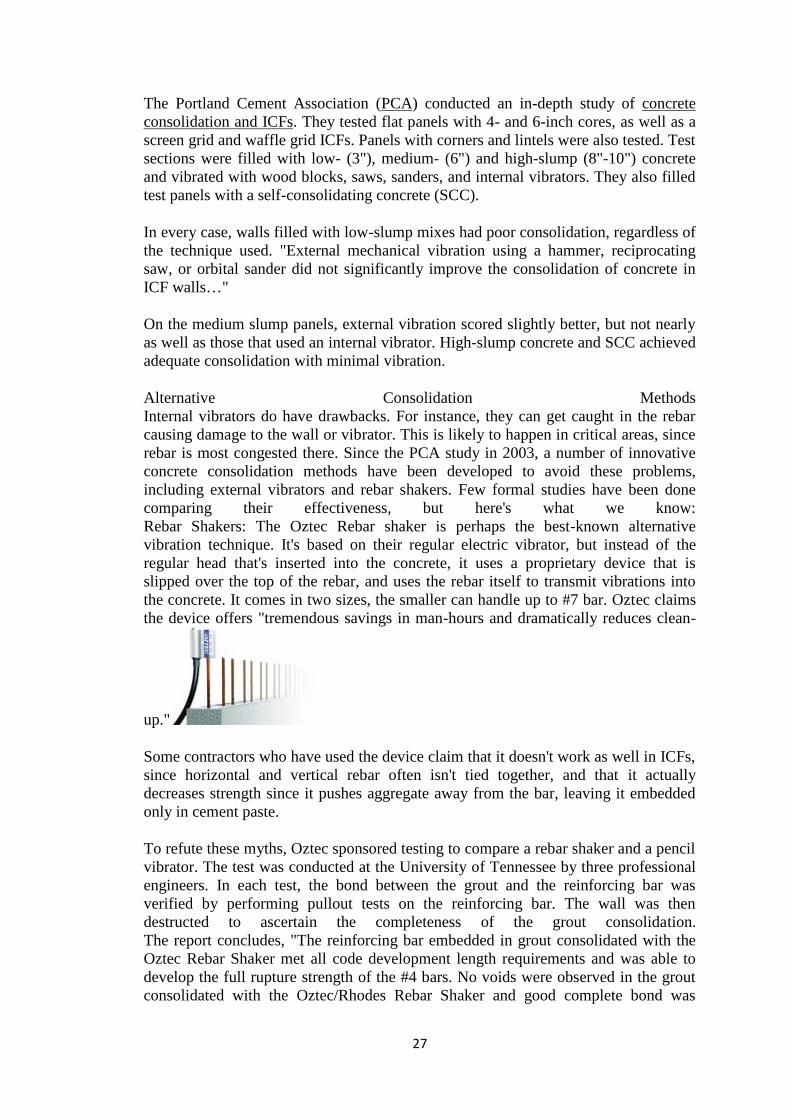
Alternative Consolidation MethodsInternal vibrators do have drawbacks. For instance, they can get caught in the rebarcausing damage to the wall or vibrator. This is likely to happen in critical areas, sincerebar is most congested there. Since the PCA study in 2003, a number of innovativeconcrete consolidation methods have been developed to avoid these problems,including external vibrators and rebar shakers. Few formal studies have been donecomparing their effectiveness, but here's what we know:Rebar Shakers: The Oztec Rebar shaker is perhaps the best-known alternativevibration technique. It's based on their regular electric vibrator, but instead of theregular head that's inserted into the concrete, it uses a proprietary device that isslipped over the top of the rebar, and uses the rebar itself to transmit vibrations intothe concrete. It comes in two sizes, the smaller can handle up to #7 bar. Oztec claimsthe device offers "tremendous savings in man-hours and dramatically reduces clean-
up."
Some contractors who have used the device claim that it doesn't work as well in ICFs,since horizontal and vertical rebar often isn't tied together, and that it actuallydecreases strength since it pushes aggregate away from the bar, leaving it embeddedonly in cement paste.
To refute these myths, Oztec sponsored testing to compare a rebar shaker and a pencilvibrator. The test was conducted at the University of Tennessee by three professionalengineers. In each test, the bond between the grout and the reinforcing bar wasverified by performing pullout tests on the reinforcing bar. The wall was thendestructed to ascertain the completeness of the grout consolidation.The report concludes, "The reinforcing bar embedded in grout consolidated with theOztec Rebar Shaker met all code development length requirements and was able todevelop the full rupture strength of the #4 bars. No voids were observed in the groutconsolidated with the Oztec/Rhodes Rebar Shaker and good complete bond was

28
observed with the reinforcing bar. We recommend that the Oztec Rebar Shaker befully recognized as an acceptable alternative to the conventional pencil vibrator."
A copy of the complete report can be viewed in the online version of this article.Because the zone of influence is limited with rebar shakers, Oztec recommends usinga regular pencil head vibrator for jobs with rebar spacing of more than 12" on center.
2.9.1 External Board Vibrators:
These first appeared on the scene about three yearsago, made by Brecon and marketed by HoustonVibrator. They work to vibrate the concrete from theoutside of the formwork, and consist of a flataluminum panel connected to a 115-volt electricmotor. The size of the panel can be adjusted to fit theoperator's needs, but usually measures 12"x36".Likethe internal vibrators, the operator starts at thebottom of the wall and works his way upward to the top of the wall.
Advantages include less mess, practically no clean-up, and no loss of time dealingwith rebar issues. Disadvantages include the fact that the entire height of the wallneeds to be accessible, and the device can become heavy and cumbersome—although
no more than internal vibrators can be.
2.9.2 External Rotary Vibrators: These small,handheld vibrators are usually powered by cordlessdrills. Two of the most popular brands are the ArkieWall Banger and Lite-Form Technologies'Wallbrator. Both are about six inches in diameterand weigh less than three pounds. They can accesshard-to-reach areas better than most other options.Either product works better than sanders, saws, and2x4s, but questions remain about whether theyactually improve rebar encapsulation. The author is
unaware of any formal testing revealing their effectiveness.
29
An ICF structure is only as strong as the concrete core within the walls. As durabilityand energy efficiency become more important than ever, so does properconsolidation. Ian Geisler, a Texas-based ICF builder says, "We all need to learn howto properly consolidate concrete, as one bad project affects all of us. Also, more andmore commercial projects are coming on line. With more commercial work comesmore specs for steel and they bring out more inspectors. There's no excuse not to dothe job right."
2.10 Admixture of Concrete
Chemical admixtures are the ingredients in concrete other than portland cement,water, and aggregate that are added to the mix immediately before or during mixing.Producers use admixtures primarily to reduce the cost of concrete construction; tomodify the properties of hardened concrete; to ensure the quality of concrete duringmixing, transporting, placing, and curing; and to overcome certain emergenciesduring concrete operations.
Successful use of admixtures depends on the use of appropriate methods of batchingand concreting. Most admixtures are supplied in ready-to-use liquid form and areadded to the concrete at the plant or at the jobsite. Certain admixtures, such aspigments, expansive agents, and pumping aids are used only in extremely smallamounts and are usually batched by hand from premeasured containers.
2.10.1 Effectiveness of Admixture
The effectiveness of an admixture depends on several factors including: type andamount of cement, water content, mixing time, slump, and temperatures of theconcrete and air. Sometimes, effects similar to those achieved through the addition ofadmixtures can be achieved by altering the concrete mixture-reducing the water-

30
cement ratio, adding additional cement, using a different type of cement, or changingthe aggregate and aggregate gradation.
2.11 Five Functions
Admixtures are classed according to function. There are five distinct classes ofchemical admixtures: air-entraining, water-reducing, retarding, accelerating, andplasticizers (superplasticizers). All other varieties of admixtures fall into the specialtycategory whose functions include corrosion inhibition, shrinkage reduction, alkali-silica reactivity reduction, workability enhancement, bonding, damp proofing, andcoloring. Air-entraining admixtures, which are used to purposely place microscopicair bubbles into the concrete, are discussed more fully in Air-Entrained Concrete.
2.11.1 Water-reducing admixtures
Usually reduce the required water content for a concrete mixture by about 5 to 10percent. Consequently, concrete containing a water-reducing admixture needs lesswater to reach a required slump than untreated concrete. The treated concrete canhave a lower water-cement ratio. This usually indicates that a higher strength concretecan be produced without increasing the amount of cement. Recent advancements inadmixture technology have led to the development of mid-range water reducers.These admixtures reduce water content by at least 8 percent and tend to be morestable over a wider range of temperatures. Mid-range water reducers provide moreconsistent setting times than standard water reducers.
2.11.2 Retarding admixtures
Which slow the setting rate of concrete, are used to counteract the accelerating effectof hot weather on concrete setting. High temperatures often cause an increased rate ofhardening which makes placing and finishing difficult. Retarders keep concreteworkable during placement and delay the initial set of concrete. Most retarders alsofunction as water reducers and may entrain some air in concrete.
2.11.3 Accelerating admixtures
Increase the rate of early strength development, reduce the time required for propercuring and protection, and speed up the start of finishing operations. Acceleratingadmixtures are especially useful for modifying the properties of concrete in cold
weather.

31
2.11.4 Superplasticizers,
It isknown as plasticizers or high-range water reducers (HRWR), reduce water contentby 12 to 30 percent and can be added to concrete with a low-to-normal slump andwater-cement ratio to make high-slump flowing concrete. Flowing concrete is ahighly fluid but workable concrete that can be placed with little or no vibration orcompaction. The effect of superplasticizers lasts only 30 to 60 minutes, depending onthe brand and dosage rate, and is followed by a rapid loss in workability. As a resultof the slump loss, superplasticizers are usually added to concrete at the jobsite.
2.11.5 Corrosion-inhibiting admixtures
It is fall into the specialty admixture category and are used to slow corrosion ofreinforcing steel in concrete. Corrosion inhibitors can be used as a defensive strategyfor concrete structures, such as marine facilities, highway bridges, and parkinggarages, that will be exposed to high concentrations of chloride. Other specialtyadmixtures include shrinkage-reducing admixtures and alkali-silica reactivityinhibitors. The shrinkage reducers are used to control drying shrinkage and minimizecracking, while ASR inhibitors control durability problems associated with alkali-silica reactivity.
2.12 Effect on permeability
The permeability and porosity of concrete containing calcium chloride in relation to aplain concrete depends on two conflicting variables:
1.The degree of hydration of the concrete, which in the case of the calcium chloride-containing concrete will initially be considerably increased, and the larger volume ofhydration products will lead to a reduced permeability.
2. The adverse effect that calcium chloride has on the capillary porosity distribution.At later ages (after perhaps 1 year) the degree of hydration in both calcium chloride-containing concrete and a plain concrete will be similar and, under thesecircumstances, the concrete will be more porous and allow easier access to aggressivegases and liquids

32
2.13 Effect on shrinkage
The drying shrinkage of concrete containing calcium chloride is increased incomparison to plain concrete, even though the amount of moisture lost is less (Rixomand Mailvaganam, 1999). This is illustrated in Fig. 2.3 and it is thought that thereduced moisture loss will be due to the more advanced state of hydration in thespecimens containing calcium chloride. The increased shrinkage must, therefore, be acharacteristic of the type of cement hydration products formed. Under saturatedconditions, such as total water immersion, the amount of expansion of the concrete isreduced when calcium chloride is present. There are only limited data available on theeffect of other accelerating admixtures, although one comparative study by Bruere et.al (1971) suggests that calcium formate and triethanolamine also increase the dryingshrinkage of concrete into which they are incorporated.
Figure 2.4: CaCl2 increases drying shrinkage of concrete, although the moisturecontent is decreased. (Source: Rixom and Mailvaganam, 1999)
2.14 Effect on workability
It is generally observed that addition of CaC12 increases slightly the workability andreduces the water required to produce a given slump of concrete. In combination withan air-entraining agent, CaCl2 may sometimes improve further the workability. Asmall increase in air content and average size of air voids may also result(Ramachandran, 1995).

33
Chapter-3
METHODOLOGY
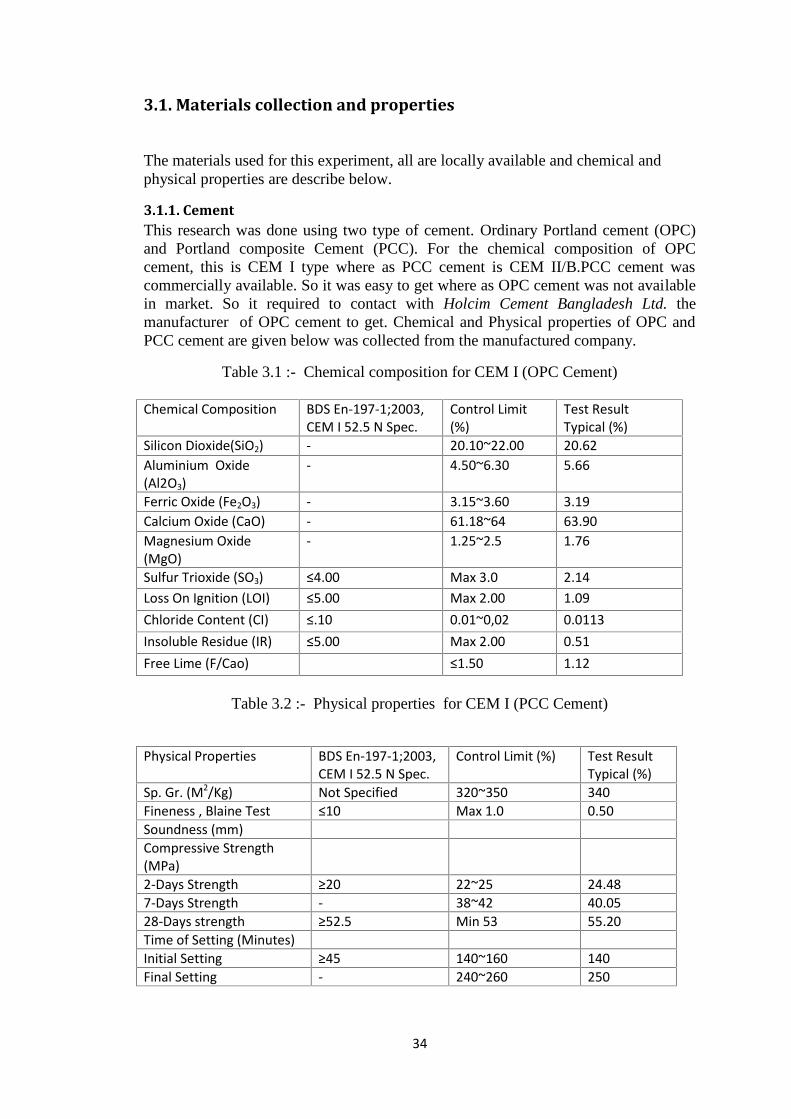
34
3.1. Materials collection and properties
The materials used for this experiment, all are locally available and chemical andphysical properties are describe below.
3.1.1. CementThis research was done using two type of cement. Ordinary Portland cement (OPC)and Portland composite Cement (PCC). For the chemical composition of OPCcement, this is CEM I type where as PCC cement is CEM II/B.PCC cement wascommercially available. So it was easy to get where as OPC cement was not availablein market. So it required to contact with Holcim Cement Bangladesh Ltd. themanufacturer of OPC cement to get. Chemical and Physical properties of OPC andPCC cement are given below was collected from the manufactured company.
Table 3.1 :- Chemical composition for CEM I (OPC Cement)
Chemical Composition BDS En-197-1;2003,CEM I 52.5 N Spec.
Control Limit(%)
Test ResultTypical (%)
Silicon Dioxide(SiO2) - 20.10~22.00 20.62Aluminium Oxide(Al2O3)
- 4.50~6.30 5.66
Ferric Oxide (Fe2O3) - 3.15~3.60 3.19Calcium Oxide (CaO) - 61.18~64 63.90Magnesium Oxide(MgO)
- 1.25~2.5 1.76
Sulfur Trioxide (SO3) ≤4.00 Max 3.0 2.14Loss On Ignition (LOI) ≤5.00 Max 2.00 1.09Chloride Content (CI) ≤.10 0.01~0,02 0.0113Insoluble Residue (IR) ≤5.00 Max 2.00 0.51Free Lime (F/Cao) ≤1.50 1.12
Table 3.2 :- Physical properties for CEM I (PCC Cement)
Physical Properties BDS En-197-1;2003,CEM I 52.5 N Spec.
Control Limit (%) Test ResultTypical (%)
Sp. Gr. (M2/Kg) Not Specified 320~350 340Fineness , Blaine Test ≤10 Max 1.0 0.50Soundness (mm)Compressive Strength(MPa)2-Days Strength ≥20 22~25 24.487-Days Strength - 38~42 40.0528-Days strength ≥52.5 Min 53 55.20Time of Setting (Minutes)Initial Setting ≥45 140~160 140Final Setting - 240~260 250

35
Table 3.3:- Chemical composition for CEM II/B
Chemical Composition BDS EN-197-1,CEMII/B-M(V-S-L)42.5N
Control Limit(%) Test ResultTypical%
Silicon Dioxide(SiO2) - 29.00~33.00 30.63Aluminium Oxide(Al2O3) - 8.00~11.00 10.84Ferric Oxide (Fe2O3) - 3.30~3.90 3.59Calcium Oxide (CaO) - 47.0~50.00 49.30Magnesium Oxide (MgO) 1.5~2.50 1.58Sulfur Trioxide (SO3) ≤3.5% 1.80~2.40 2.01Loss On Ignition (LOI) - 1.20~2.50 1.90Chloride Content (CI) ≤0.10% 0.01~0.04 0.0149Free Lime (F/Cao) ≤1.20 0.90
Table 3.4 :- Physical properties for CEM II/B
Physical Properties BDS En-197-1;2003,CEM II 52.5 N Spec.
Control Limit (%) Test ResultTypical (%)
Sp. Gr. (M2/Kg) Not Specified 370~400 393Fineness , Blaine Test ≤10 Max 1.0 0.50Soundness (mm)Compressive Strength(MPa)2-Days Strength ≥10 16~20 18.027-Days Strength - 28~32 31.6528-Days strength ≥42.5 & ≤62.5 Min 45 47.85Time of Setting (Minutes)Initial Setting ≥60 180~210 190Final Setting - 270~300 290
3.1.2.Sand
The problem was faced to collect sand and cement. Sand was also available but as forresearch purpose the quantity was very small so it was not way to get ascommercially. So amount of sand was collected from construction side with the helpof social relationship.Sand was used that can pass through #4 sieve. The properties of sand is below:For this research we use sand that belongs the FM=2.60.Bulk Specific Gravity (Oven Dry Basis) Sd= 2.35Bulk Specific Gravity (SSD Basis) Ss= 2.38Apparent Specific Gravity Sa=2.42Absorption Capacity =1.2%

36
3.1.3 WaterWater was used for this experiment is tap water. Temperature was maintained around250C.
3.2. Physical properties Determination of Materials:
Some Physical properties of sand were determined like Specific Gravity, AbsorptionCapacity and FM. The test was done according to code ASTM C128 and C136respectively.
3.2.1. Sieve Analysis of Fine Aggregate.
The term sieve analysis is given to the simple operation of diving a sample ofaggregate into fraction each consisting of particles between specific limits.Theanalysis is conducted to determine the grading of materials proposed for use asaggregates or being used as aggregates.
The term fineness modulas (F.M) is a ready index of fineness of the material.It is anempirical factor obtained by adding the cumulative percentages of aggregates retainedon each of the standard sieves and dividing this sum arbitrarily by 100.
No. 100, No. 50, No. 30, No. 16, No. 8, No. 4, 3/8 in, ¾ in, 1.5 in are the ASTMstandard sieves.
This test method conforms to the ASTM standard requirements of specification C136.
Apparatus:
Balance(sensitive to within 0.1% of the weight of the sample), Sieve(ASTM
Standard),Mechanical sieve shaker.
Sampling:
Thoroughly mix the sample and reduce it to an amount, so that the sample for testshall be approximately of the weight desired when dry.
Fine Aggregate-
The test sample of fine aggregate (F.A) shall weight, after drying, approximately thefollowing amount:
Aggregate with at least 85% passing a No.4 sieve 500g
and more than 5% retained on a No. 8 sieve.
Aggregate units at least 95% passing No.8 sieve 100g

37
Procedure For FA:
1. Dry the sample to constant weight at a temperature of 110+5C2. Nest the sieve in order of decreasing size of opening from top to bottom and
place the sample on the top sieve.3. Agitate the sieve by hand and by mechanical apparatus for a sufficient period,
say 15 minutes.4. Limit the quantity of material on a given sieve so that all particles have the
opportunity to reach sieve openings a number of times during the sievingoperation. For sieves with openings smaller than 4.75 mm (No. 4), the weightretained on any sieve at the completion shall not exceed 6 kg/m2 (4 g/in2) ofsieving surface. For sieves with openings 4.75 mm (No.4) and larger, theweight in kg/m2 of sieving surface shall not exceed the product of 2.5*(sieveopening in mm). In no case shall the weight be so great as to cause permanentdeformation of the sieve cloth.
5. Continue sieving for a sufficient period and in such manner that, aftercompletion, not more than 1 weight % of the residue on any individual sievewill pass that sieve during 1 minute of continuous hand sieving.
6. Determine the weight of each size increment by weighting on a scale orbalance to the nearest 0.1% of the total original dry sample weight. The totalweight of the material after sieving should check closely with original weightof sample placed on the sieves. If the amount differ by more than 0.3% basedon the original dry sample weight,the results should not be used for acceptancepurpose.
Calculation:
1. Calculate percentages passing, total percentage retainedor percentages invarious size fractions to the nearest 0.1% on the basis of the total weight of theinitial dry sample.
Calculate the fineness modulus, when required, by adding the total percentages ofmaterial in the sample that is coarser than each of the following sieves (cumulativepercentages retained), and dividing the sum by 100:150-um (no. 100), 300-um(no.50), 600-um (no .30), 1.18-mm (no.16),2.36-mm(no.8), 4.75-mm (no. 4), 9.5-mm(3/8-in),37.5-mm(1.5 in),and larger, increasing in the ratio of 2 to 1.
3.2.2 Specific Gravity and Absorption Capacity of Fine Aggregate.
Aggregate generally contain pore, both permeable and impermeable, for whichspecific gravity has to be carefully defined. With this specific gravity of eachconstituent known, its weight can be converted into solid volume and hence atheoretical yield of concrete per unit volume can be calculated. Specific gravity ofaggregate is also required in calculating the compacting factor in connection with theworkability measurements. This test method covers the determination of bulkapparent specific gravity,23/23◦C ( 73.4/73.4◦F) and absorption of fine aggregate.
38
Bulk specific gravity is defined as the ratio of the weight of the aggregate (oven-dryor saturated surface dry) to the weight of water occupying a volume equal to that ofthe solid including the permeable pores. This is used for 1.calculation of the volumeoccupied by the aggregate in various mixtures containing aggregate on an absolutevolume basis 2.the computation of voids in aggregate, and 3.the determination ofmoisture in aggregate.
Apparent specific gravity is the ratio of the weight of the aggregate dried in oven at100 to 110◦C (212 to 230◦F) for 24 hrs.to the weight of water occupying a volumeequal to that of the solid excluding the permeable pores.This pertains to the relativedensity of the solid material making up the constituent particles not including the porespace within the particles that is accessible to water.
Absorption values are used to calculate the change in the weight of an aggregate dueto water absorbed in the pore spaces within the constituent particles, compared to thedry condition. For an aggregate that has been in contact with water and that has beenin contact with water and that has free moisture on the particle surfaces, thepercentages of free moisture can be determined by deducing the absorption from thetotal moisture content.
This test method conforms to the ASTM standard requirements of specification C128.
Apparatus:
a) Balance-Sensitive to 0.1g or less.b) Pycnometer-A flask or other suitable container of 1000 ml capacity. The
volume of the container filled to mark shall be at least 50% greater than thespace required to accommodate test sample of fine aggregate.
c) Mold-A metal mold in the form of a frustum of a cone with dimensions asfollows:40±3 mm inside diameter at the top90±3 mm inside diameter at the bottom75±3 mm in height0.8 mm minimum thickness of metal
d) Tamper- A metal tamper weighting 350±15 g and having a flat circulartamping face 25±3 mm in diameter.
Preparation of Test Specimen:
a) Obtain approximately 1 kg sample of fine aggregate.
b) Dry it in a suitable pan or vessel to constant weight at a temperature of110±5◦C(230±9◦F). Allow it to cool to comfortable handling temperature, cover withwater, either by immersion or by the addition of at least 6% moisture to the fineaggregate, and permit to stand for 24±4 hr.
c) Cone test for surface moisture-Place a portion of the partially dried fine aggregateloosely in the mold by filing it to overflowing and heaping additional material above
39
the top of the mold by holding it with the cupped fingers of the hand holding themold. Lightly tamp the fine aggregate into the mold with 25 light drops of the tamper.Each drop should start about 5 mm (o.2 in) above the top surface of the fineaggregate. Permit the tamper to fall freely under gravitational attraction on each dropand distribute the drops over the surface. remove loose sand from the base and lift themold vertically. If surface moisture is still present, the fine aggregate will retain themold shape. Continue drying with constant stirring and test at frequent intervals untilthe cone of the sand slumps upon the removal of mold. When the fine aggregateslumps slightly it indicates that it has reached a surface-dry condition.
If the first trial of the surface moisture test indicates that moisture is not present on thesurface , it has been dried past the saturated surface-dry condition. In this casethoroughly mix a few millilitres of water with the fine aggregate and permit thespecimen to stand in a covered container for 30 minutes. Then resume the process ofdrying and testing at frequent interval for the onset of the surface-dry condition.
Procedure:
a) Partially fill the pycnometer with water. Immediately introduce into the pycnometer500±10 gm of saturated surface-dry fine aggregate prepared and fill with additionalwater to approximately 90% of capacity. Roll, invert and agitate the pycnometer toeliminate all air bubbles. Adjust its temperature to 23±1.7◦C(73.4±3◦F), if necessaryby immersion in circulating water, and bring the water level in the pycnometer to itscalibrated capacity. Determine the total weight of the pycnometer, specimen, andwater.
b)Remove the fine aggregate from the pycnometer, dry to constant weight at atemperature of 110±5◦C(230±9◦F), cool in air at room temperature for 1±1/2 hr, andweigh.
c)Determine the weight of the pycnometer filled to its calibration capacity with waterat 23±1.7◦C(73.4±3◦F)
For determination of the Sp. Gr., We used the Equation below:
Bulk Sp. Gr. (OD Basis) Sd = A/(B + S − C)……………………(1)
Bulk Sp. Gr. (SSD Basis) SS = S/(B + S − C)……………………(2)
Apparent Sp. Gr. Sa = A/(B + A − C)…………………………(3)

40
Where, A=Weight of Oven dry Specimen in air, (gm)
B=Weight of pycnometer filled with, (gm)
S=Weight of the saturated surface-dry specimen, (gm) and
d C=Weight of pycnometer with specimen and water to calibration mark,(gm)
For Determination of Absorption Capacity of sand We used the equation below:
Absorption % = (S − A)/A x100………………………… (4)
Or
Absorption % = (Sa − Ss)/(Sa(Ss − 1)) x100………………(5)
Specific Gravity results to the nearest 0.01 and to the nearest 0.1%
For Determination of FM (Fineness Modulus) we used equations below:
FM=(Sum of the Cumulative % of all Standard sieve )/(weight of the total sample retained)3.3. Material mix proportion and mortar Sample
Materials were mixed in standard proportion according to Code ASTM C109.
W/C (Water: Cement) Ratio was 0.485. And Cement: Sand = 1:2.75.Materials weremixed using electrical mixing machine.2-in. or [50-mm] cube specimen was used forthis experiment. Total volume of this specimen is 8 in3. Cement mortar specimen ofboth OPC and PCC cement was casted for compressive strength and porosity test.ASTM C109 was followed for the preparation sample for compressive strength test.
3.4. Compressive strength test
Compressive strength test of cement mortar of OPC and PCC was done for differentdays curing. Specimens were kept in mold for 24 hours and demolded specimens werekept under lime water for curing. Cement mortar sample were crushed at 3, 14, 28, 42and 56 days after demolding. Mortar samples were crushed on OD and SSDcondition.
The compressive strength of concrete is one of the most important and usefulproperties of concrete. In most structure applications concrete is employed primarily
41
to resist compressive stresses. Nevertheless, strength usually gives an overall pictureof the quality of concrete because it is directly related to the structure of the hardencement paste. Values obtained will depend on the size and shape of the specimen,batching, mixing procedures, the methods of sampling, molding and fabrication andthe age, temperature, and moisture conditions during curing.
The results of this test method may be used as a basis for quality control of concreteproportioning, mixing and placing operations; determination of compliance withspecifications; control for evaluating effectiveness of admixtures and similar uses.
The test method conforms to the ASTM standard requirements of specification C39for cylinder and BS1881 for cube.
Apparatus:
Testing Machine: The testing machine shall be of a type having sufficient capacityand capable of providing the rates of loading as required.
a) Design-The machine must be power operated and must apply the load continuouslyrather than intermittently and without shock.
b) Accuracy-The percentage of error for the loads within the proposed range of use ofthe testing machine shall not exceed ±1.0% of the indicated load.
1.The testing machine shall be equipped with two steel bearing blocks with hardenedfaces, one of which is a spherical seated block that will bear on the upper surface ofthe specimen, and the other a solid block on which the specimen shall rest. Bearingfaces of the blocks shall have a minimum dimension at least 3% greater than thediameter of the specimen to be tested. When the diameter of the bearing face of thespherically seated block exceeds the diameter of the specimen by more than ½ in (13mm), concentric circles not more than 1/32 in (0.8 mm)deep and not more than 3/64in (1.2 mm) wide shall be inscribe to facilitate proper centering.
2. Bottom bearing blocks shall conform to the following requirements:
The bottom bearing block is specified for the purpose of providing a readilymachinable surface for maintenance of the specified surface conditions. The top andbottom surfaces tothe shall be parallel to each other. The block may be fastened to theplaten of the testing machine. Its least horizontal dimension shall be at least 3%greater than the diameter of the specimen to be tested.
3.5. Preparation Of Cube specimens
Cube Moulds - 'The mould shall be ot metal, preferably steel or cast iron, and stoutenough to prevent distortion. It shall be constructed in such a manner as to facilitatethe removal of the moulded specimen without damage, and shall be so .machined that,when it is assembled ready for use, the dimensions and internal faces shall be accuratewithin the following limits: 'The height of the mould and the distance betweenopposite faces shall be the specified size + 0·2 mm. The angle between adjacent 6 IS:516 - 1959 internal faces and between internal faces and top and bottom planes of themould shall be 90° +0-5°. The interior faces of the mould shall be plane surfaces with
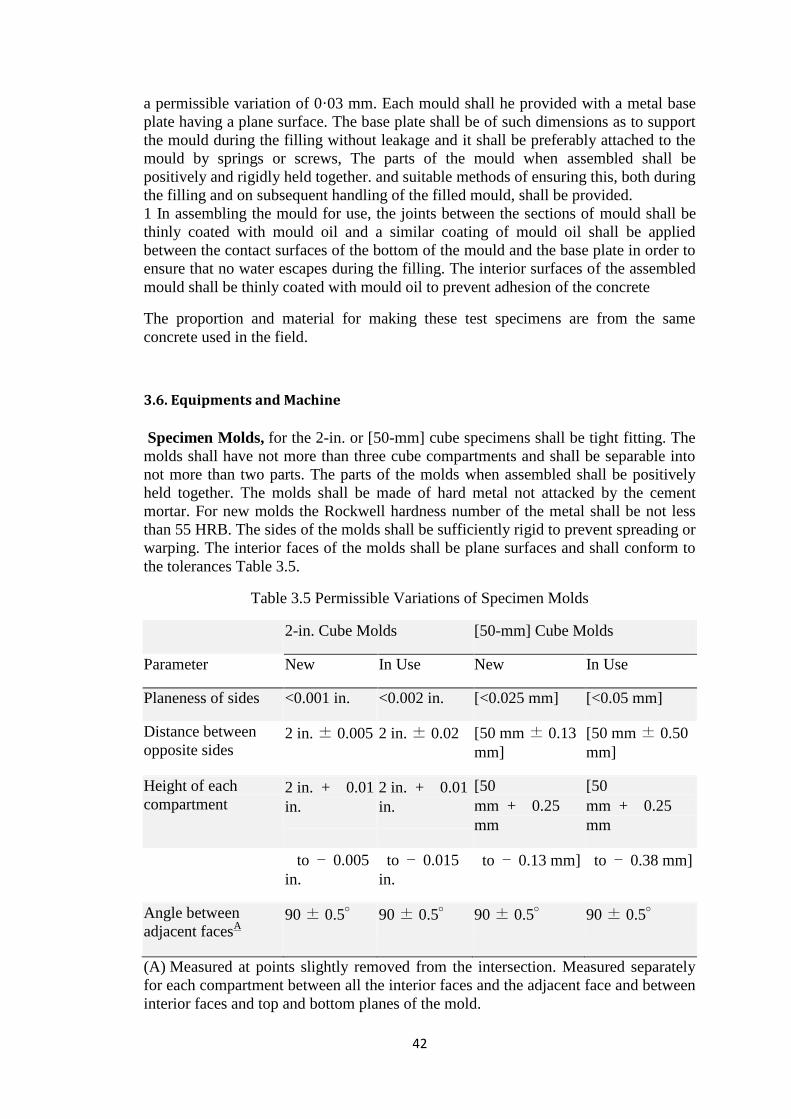
42
a permissible variation of 0·03 mm. Each mould shall he provided with a metal baseplate having a plane surface. The base plate shall be of such dimensions as to supportthe mould during the filling without leakage and it shall be preferably attached to themould by springs or screws, The parts of the mould when assembled shall bepositively and rigidly held together. and suitable methods of ensuring this, both duringthe filling and on subsequent handling of the filled mould, shall be provided.1 In assembling the mould for use, the joints between the sections of mould shall bethinly coated with mould oil and a similar coating of mould oil shall be appliedbetween the contact surfaces of the bottom of the mould and the base plate in order toensure that no water escapes during the filling. The interior surfaces of the assembledmould shall be thinly coated with mould oil to prevent adhesion of the concrete
The proportion and material for making these test specimens are from the sameconcrete used in the field.
3.6. Equipments and Machine
Specimen Molds, for the 2-in. or [50-mm] cube specimens shall be tight fitting. Themolds shall have not more than three cube compartments and shall be separable intonot more than two parts. The parts of the molds when assembled shall be positivelyheld together. The molds shall be made of hard metal not attacked by the cementmortar. For new molds the Rockwell hardness number of the metal shall be not lessthan 55 HRB. The sides of the molds shall be sufficiently rigid to prevent spreading orwarping. The interior faces of the molds shall be plane surfaces and shall conform tothe tolerances Table 3.5.
Table 3.5 Permissible Variations of Specimen Molds
2-in. Cube Molds [50-mm] Cube Molds
Parameter New In Use New In Use
Planeness of sides <0.001 in. <0.002 in. [<0.025 mm] [<0.05 mm]
Distance betweenopposite sides
2 in.± 0.005 2 in.± 0.02 [50 mm± 0.13mm]
[50 mm± 0.50mm]
Height of eachcompartment
2 in. + 0.01in.
2 in. + 0.01in.
[50mm + 0.25mm
[50mm + 0.25mm
to − 0.005in.
to − 0.015in.
to − 0.13 mm] to − 0.38 mm]
Angle betweenadjacent facesA
90± 0.5° 90± 0.5° 90± 0.5° 90± 0.5°
(A) Measured at points slightly removed from the intersection. Measured separatelyfor each compartment between all the interior faces and the adjacent face and betweeninterior faces and top and bottom planes of the mold.

43
Cube molds shall be checked for conformance to the design and dimensionalrequirements of this test method at least every 21/2 years.
Mixer, Bowl and Paddle, an electrically driven mechanical mixer of the typeequipped with paddle and mixing bowl, as specified in Practice C305.
Flow Table and Flow Mold, conforming to the requirements ofSpecification C230/C230M.
Tamper, a nonabsorptive, nonabrasive, nonbrittle material such as a rubbercompound having a Shore A durometer hardness of 80 ± 10 or seasoned oak woodrendered nonabsorptive by immersion for 15 min in paraffin at approximately 392 °For [200 °C], shall have a cross section of about 1/2 by 1 in. or [13 by 25 mm] and aconvenient length of about 5 to 6 in. or [120 to 150 mm]. The tamping face shall beflat and at right angles to the length of the tamper.
Tampers shall be checked for conformance to the design and dimensionalrequirements of this test method at least every 21/2 years.
Trowel, having a steel blade 4 to 6 in. [100 to 150 mm] in length, with straight edges.
Moist Cabinet or Room, conforming to the requirements of Specification C511.
Testing Machine, either the hydraulic or the screw type, with sufficient openingbetween the upper bearing surface and the lower bearing surface of the machine topermit the use of verifying apparatus. The load applied to the test specimen shall beindicated with an accuracy of ±1.0 %. If the load applied by the compression machineis registered on a dial, the dial shall be provided with a graduated scale that can beread to at least the nearest 0.1 % of the full scale load (Note 2). The dial shall bereadable within 1 % of the indicated load at any given load level within the loadingrange. In no case shall the loading range of a dial be considered to include loadsbelow the value that is 100 times the smallest change of load that can be read on thescale. The scale shall be provided with a graduation line equal to zero and sonumbered. The dial pointer shall be of sufficient length to reach the graduation marks;the width of the end of the pointer shall not exceed the clear distance between thesmallest graduations. Each dial shall be equipped with a zero adjustment that is easilyaccessible from the outside of the dial case, and with a suitable device that at all timesuntil reset, will indicate to within 1 % accuracy the maximum load applied to thespecimen.
If the testing machine load is indicated in digital form, the numerical display must belarge enough to be easily read. The numerical increment must be equal to or less than0.10 % of the full scale load of a given loading range. In no case shall the verifiedloading range include loads less than the minimum numerical increment multiplied by100. The accuracy of the indicated load must be within 1.0 % for any value displayedwithin the verified loading range. Provision must be made for adjusting to indicatetrue zero at zero load. There shall be provided a maximum load indicator that at alltimes until reset will indicate within 1 % system accuracy the maximum load appliedto the specimen.
Compression machines shall be verified in accordance with Practices E4 at leastannually to determine if indicated loads, with and without the maximum loadindicator (when so equipped), are accurate to ±1.0 %.

44
NOTE 2: As close as can be read is considered 1/50 in. or [0.5 mm] along the arcdescribed by the end of the pointer. Also, one half of the scale interval is about asclose as can reasonably be read when the spacing on the load indicating mechanism isbetween 1/25 in. or [1 mm] and 1/16 in. or [1.6 mm]. When the spacing isbetween 1/16 in. or [1.6 mm] and 1/8 in. or [3.2 mm], one third of the scale interval canbe read with reasonable certainty. When the spacing is 1/8 in. or [3.2 mm] or more,one fourth of the scale interval can be read with reasonable certainty.
The upper bearing assembly shall be a spherically seated, hardened metal block firmlyattached at the center of the upper head of the machine. The center of the sphere shallcoincide with the surface of the bearing face within a tolerance of ±5 % of the radiusof the sphere. Unless otherwise specified by the manufacturer, the spherical portion ofthe bearing block and the seat that holds this portion shall be cleaned and lubricatedwith a petroleum type oil such as motor oil at least every six months. The block shallbe closely held in its spherical seat, but shall be free to tilt in any direction. Ahardened metal bearing block shall be used beneath the specimen to minimize wear ofthe lower platen of the machine. To facilitate accurate centering of the test specimenin the compression machine, one of the two surfaces of the bearing blocks shall have adiameter or diagonal of between 2.83 in. [70.7 mm] (See Note 3) and 2.9 in. [73.7mm]. When the upper block bearing surface meets this requirement, the lower blockbearing surface shall be greater than 2.83 in. [70.7 mm]. When the lower blockbearing surface meets this requirement, the diameter or diagonal of upper blockbearing surface shall be between 2.83 and 31/8 in. [70.7 and 79.4 mm]. When thelower block is the only block with a diameter or diagonal between 2.83 and 2.9 in.[70.7 and 73.7 mm], the lower block shall be used to center the test specimen. In thatcase, the lower block shall be centered with respect to the upper bearing block andheld in position by suitable means. The bearing block surfaces intended for contactwith the specimen shall have a Rockwell harness number not less than 60 HRC. Thesesurfaces shall not depart from plane surfaces by more than 0.0005 in. [0.013 mm]when the blocks are new and shall be maintained within a permissible variation of0.001 in. or [0.025 mm].
Compression machine bearing blocks shall be checked for planeness in accordancewith this test method at least annually using a straightedge and feeler stock and shallbe refinished if found to be out of tolerance.
NOTE 3: The diagonal of a 2 in. [50 mm] cube is 2.83 in. [70.7 mm].

45
Chapter- 4
EXPERIMENTAL WORK

46
4.1 Materials
4.1.1 Graded Standard Sand:
The sand (Note 4) used for making test specimens shall be natural silica sandconforming to the requirements for graded standard sand in Specification C778.
NOTE 4: Segregation of Graded Sand—The graded standard sand should be handledin such a manner as to prevent segregation, since variations in the grading of the sandcause variations in the consistency of the mortar. In emptying bins or sacks, careshould be exercised to prevent the formation of mounds of sand or craters in the sand,down the slopes of which the coarser particles will roll. Bins should be of sufficientsize to permit these precautions. Devices for drawing the sand from bins by gravityshould not be used.
4.2 Temperature and Humidity
Temperature—The temperature of the air in the vicinity of the mixing slab, the drymaterials, molds, base plates, and mixing bowl, shall be maintained between 73.5 ±5.5 °F or [23.0 ± 3.0 °C]. The temperature of the mixing water, moist closet or moistroom, and water in the storage tank shall be set at 73.5 ± 3.5 °F or [23 ± 2 °C].
Humidity—The relative humidity of the laboratory shall be not less than 50 %. Themoist closet or moist room shall conform to the requirements of SpecificationC511.
4.3 Test Specimens
Make two or three specimens from a batch of mortar for each period of test or testage.
4.4 Preparation of Specimen Molds
Apply a thin coating of release agent to the interior faces of the mold and non-absorptive base plates. Apply oils and greases using an impregnated cloth or othersuitable means. Wipe the mold faces and the base plate with a cloth as necessary toremove any excess release agent and to achieve a thin, even coating on the interiorsurfaces. When using an aerosol lubricant, spray the release agent directly onto themold faces and base plate from a distance of 6 to 8 in. or [150 to 200 mm] to achievecomplete coverage. After spraying, wipe the surface with a cloth as necessary toremove any excess aerosol lubricant. The residue coating should be just sufficient toallow a distinct finger print to remain following light finger pressure (Note 5).
Seal the surfaces where the halves of the mold join by applying a coating of light cupgrease such as petrolatum. The amount should be sufficient to extrude slightly whenthe two halves are tightened together. Remove any excess grease with a cloth.
Seal molds to their base plates with a watertight sealant. Use microcrystalline wax ora mixture of three parts paraffin wax to five parts rosin by mass. Paraffin wax ispermitted as a sealant with molds that clamp to the base plate. Liquefy the wax byheating it to a temperature of between 230 and 248 °F or [110 and 120 °C]. Effect a

47
watertight seal by applying the liquefied sealant at the outside contact lines betweenthe mold and its base plate (Note 6).
Optionally, a watertight sealant of petroleum jelly is permitted for clamped molds.Apply a small amount of petroleum jelly to the entire surface of the face of the moldthat will be contacting the base plate. Clamp the mold to the base plate and wipe anyexcess sealant from the interior of the mold and base plate.
NOTE 5: Because aerosol lubricants evaporate, molds should be checked for asufficient coating of lubricant immediately prior to use. If an extended period of timehas elapsed since treatment, retreatment may be necessary.
NOTE 6: Watertight Molds—The mixture of paraffin wax and rosin specified forsealing the joints between molds and base plates may be found difficult to removewhen molds are being cleaned. Use of straight paraffin wax is permissible if awatertight joint is secured, but due to the low strength of paraffin wax it should beused only when the mold is not held to the base plate by the paraffin wax alone. Whensecuring clamped molds with paraffin wax, an improved seal can be obtained byslightly warming the mold and base plate prior to applying the wax. Molds so treatedshould be allowed to return to room temperature before use.
4.5 Mix Design
As this research aim to keep similarity with the practical works, mix design used bythe site engineer was collected by and calculated that has been demonstrated below.Mix Design:-
Cement: Fine Aggregate: Coarse Aggregate = 1 : 1.25 : 2.5Water Cement Ratio (W/C) = 0.4Field Measurement:-
In practical measurement they prefer to take measurement on volume basis.They use big bowl (Known as Korai in site ) to take materials.We used a measuring box ( Known as fery in site) of volume= ( 1*1*1.25)cft
= 1.25 cft2.5 Korai Materials were required to fill the 1.25 cft fery.Weight of Fery = 12.2 kg1 bag cement is 50 kg and it’s volume is 1.25 cftThey use 6 korai stone chips and 3.5 korai sand for 50kg cement.
Coarse aggregate (Stone Chips)
Weight of 1.25cft stone chips + box = 72 kgWeight of 1.25cft stone chips = (72-12.2)kg
=59.8kgWeight of Stone chips per Korai = (59.8/2.5)kg = 23.92 kgMaterial volume per korai = (1.25/2.5)cft
= .5 cft

48
[As they use 6 Korai stone chips for 50 kg cement]So,Volume of 6 korai stone chips = (.5*6) cft = 3 cftWeight of 6 korai stone chips = [(59.8*3)/1.25 ]= 143.52 kg
Fine Aggregate (Sand)
Weight of 1.25 sand + box =65.4 kgWeight of 1.25 sand = (65.4-12.2) kg = 53.2 kgWeight of sand per Korai = (53.2/2.5) = 21.28 kgMaterial volume per Korai = (1.25/2.5) = .5cft[ As they use 3.5 korai sand for 50kg cement]So,Volume of 3.5 Korai sand = (.5* 3.5) = 1.75 cftWeight of 3.5 Korai Sand = [(53.2*1.75)/1.25]kg = 74.48 kg
Actual ratio used in field
Materials Proportion by Volume: - C: FA: CA = 1 : 1.4 : 2.4
Materials Proportion by Weight: - C: FA: CA= 1 : 1.49 : 2.87
1 : 1.5 : 3 (rounded)
4.6 Sieve Analysis
Table 4.1 : Sieve analysis
FM= 2.61
Sieve Opening (mm) Sieve Wight (gm) Total Weight(gm) Materialretained (gm) %Materialretained Cumulative%retained %Finer4.75 561.5 561.5 0 0 0 1002.36 529 564.5 35.5 2.4 2.4 97.61.18 495 715.5 220.5 14.7 17.1 82.90.6 483 1052.5 569.5 38 55.1 44.90.3 447.5 955.5 508 33.9 89 110.15 412 531 119 7.9 96.9 3.1Pan 364 410 46 3.1 100 0Total= 1498.5

49
Figure : Gradation Curve
4.7 PROCEDURE
4.7.1 Composition of Mortars:
The proportions of materials for the standard mortar shall be one part of cement to2.75 parts of graded standard sand by weight. Use a water-cement ratio of 0.485 forall portland cements and 0.460 for all air-entraining portland cements. The amount ofmixing water for other than portland and air-entraining portland cements shall be suchas to produce a flow of 110 ± 5 as determined in accordance with 10.3 and shall beexpressed as weight percent of cement.
The quantities of materials to be mixed at one time in the batch of mortar for makingsix, nine, and twelve test specimens shall be as follows:
Number of Specimens 6 9 12
Cement, g 500 740 1060
Sand, g 13752035 2915
Water, mL
Portland (0.485) 242 359 514
Air-entraining portland (0.460) 230 340 488
0
20
40
60
80
100
120
0.1 1 10
% F
iner
Sieve Opening (mm)
Gradation Curve

50
Other (to flow of 110± 5) ... ... ...
4.7.2 Preparation of Mortar:
Mechanically mix in accordance with the procedure given in Practice C305.
4.7.3 Determination of Flow:
Determine flow in accordance with procedure given in Test Method C1437.
For portland and air-entraining portland cements, merely record the flow.
In the case of cements other than portland or air-entraining portland cements, maketrial mortars with varying percentages of water until the specified flow is obtained.Make each trial with fresh mortar.
Immediately following completion of the flow test, return the mortar from the flowtable to the mixing bowl. Quickly scrape the bowl sides and transfer into the batch themortar that may have collected on the side of the bowl and then remix the entire batch15 s at medium speed. Upon completion of mixing, the mixing paddle shall be shakento remove excess mortar into the mixing bowl.
When a duplicate batch is to be made immediately for additional specimens, the flowtest may be omitted and the mortar allowed to stand in the mixing bowl 90 s withoutcovering. During the last 15 s of this interval, quickly scrape the bowl sides andtransfer into the batch the mortar that may have collected on the side of the bowl.Then remix for 15 s at medium speed.
4.7.4. Molding Test Specimens:
Complete the consolidation of the mortar in the molds either by hand tamping or by aqualified alternative method. Alternative methods include but are not limited to theuse of a vibrating table or mechanical devices.
Hand Tamping—Start molding the specimens within a total elapsed time of not morethan 2 min and 30 s after completion of the original mixing of the mortar batch. Placea layer of mortar about 1 in. or [25 mm] (approximately one half of the depth of themold) in all of the cube compartments. Tamp the mortar in each cube compartment 32times in about 10 s in 4 rounds, each round to be at right angles to the other andconsisting of eight adjoining strokes over the surface of the specimen, as illustratedin Fig. 1. The tamping pressure shall be just sufficient to ensure uniform filling of themolds. The 4 rounds of tamping (32 strokes) of the mortar shall be completed in onecube before going to the next. When the tamping of the first layer in all of the cubecompartments is completed, fill the compartments with the remaining mortar and thentamp as specified for the first layer. During tamping of the second layer, bring in themortar forced out onto the tops of the molds after each round of tamping by means ofthe gloved fingers and the tamper upon completion of each round and before startingthe next round of tamping. On completion of the tamping, the tops of all cubes shouldextend slightly above the tops of the molds. Bring in the mortar that has been forced

51
out onto the tops of the molds with a trowel and smooth off the cubes by drawing theflat side of the trowel (with the leading edge slightly raised) once across the top ofeach cube at right angles to the length of the mold. Then, for the purpose of levelingthe mortar and making the mortar that protrudes above the top of the mold of moreuniform thickness, draw the flat side of the trowel (with the leading edge slightlyraised) lightly once along the length of the mold. Cut off the mortar to a plane surfaceflush with the top of the mold by drawing the straight edge of the trowel (held nearlyperpendicular to the mold) with a sawing motion over the length of the mold.
Figure 4.1:- Order of Tamping in Molding of Test Specimens
Alternative Methods—Any consolidation method may be used that meets thequalification requirements of this section. The consolidation method consists of aspecific procedure, equipment and consolidation device, as selected and used in aconsistent manner by a specific laboratory. The mortar batch size of the method maybe modified to accommodate the apparatus, provided the proportions maintain thesame ratios as given in 10.1.2.
Separate qualifications are required for the following classifications: Class A, Non-air entrained cements—for use in concrete, such as sold underSpecifications C150, C595, and C1157. Class B, Air-entrained cements—for use in concrete, such as sold underSpecifications C150, C595, and C1157. Class C, Masonry, Mortar and Stucco Cements—such as sold underSpecifications C91, C1328, and C1329.
An alternative method may only be used to test the cement types as given in above,for which it has been qualified.
It can also be used for Strength Activity Index determinations for fly ash and slag,such as sold under Specifications C618 and C989, provided the alternative methodhas qualified for both Class A and Class C cements.
Qualification Procedure—Contact CCRL to purchase cement samples that have beenused in the Proficiency Sample Program (PSP). Four samples (5 Kg each) of the classto be qualified will be required to complete a single qualification (See Note 7).
In one day, prepare replicate 6-cube or 9-cube batches using one of the cements andcast a minimum of 36 cubes. Complete one round of tests on each cement on differentdays. Store and test all specimens as prescribed in the sections below. Test all cubes atthe age of 7-days.

52
Tabulate the compressive strength data and complete the mathematical analyses asinstructed in Annex A1.
Requalification of the Alternate Compaction Method:
Requalification of the method shall be required if any of the following occur:
(1) Evidence that the method may not be providing data in accordance with therequirements of Table 4.2
Table 4.2 :- Precision
Test Age,days
Coefficient ofVariation, 1s %A
Acceptable Range of TestResults,d2s %A
Portland Cements
Constant water-cement ratio:
Single laboratory 1 3.1 8.7
3 3.9 10.9
7 3.9 10.9
28 3.8 10.6
Average ... 3.7 10.4
Multiplelaboratories
1 7.3 20.4
3 6.8 19.0
7 6.6 18.5
28 6.5 18.2
Average ... 6.6 18.5
Blended Cements
Constant flowmortar:
Single laboratory 3 4.0 11.3
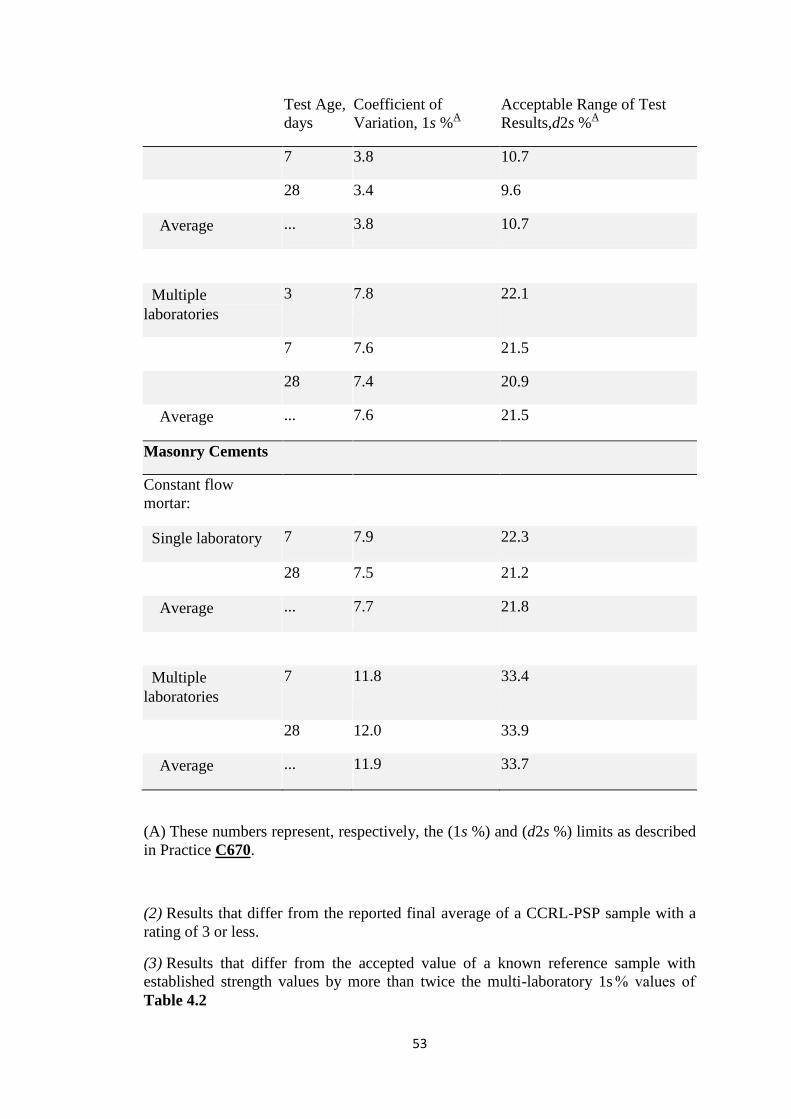
53
Test Age,days
Coefficient ofVariation, 1s %A
Acceptable Range of TestResults,d2s %A
7 3.8 10.7
28 3.4 9.6
Average ... 3.8 10.7
Multiplelaboratories
3 7.8 22.1
7 7.6 21.5
28 7.4 20.9
Average ... 7.6 21.5
Masonry Cements
Constant flowmortar:
Single laboratory 7 7.9 22.3
28 7.5 21.2
Average ... 7.7 21.8
Multiplelaboratories
7 11.8 33.4
28 12.0 33.9
Average ... 11.9 33.7
(A) These numbers represent, respectively, the (1s %) and (d2s %) limits as describedin Practice C670.
(2) Results that differ from the reported final average of a CCRL-PSP sample with arating of 3 or less.
(3) Results that differ from the accepted value of a known reference sample withestablished strength values by more than twice the multi-laboratory 1s % values ofTable 4.2

54
Before starting the requalification procedure, evaluate all aspects of cube fabricationand testing process to determine if the offending result is due to some systematic erroror just an occasional random event.
If the compaction equipment is replaced, significantly modified, repaired, or has beenrecalibrated, requalify the equipment in accordance with above.
NOTE 7: It is recommended that a large homogenous sample of cement be preparedat the time of qualification for use as a secondary standard and for method evaluation.Frequent testing of this sample will give early warning of any changes in theperformance of the apparatus.
4.7.5 Storage of Test Specimens
Immediately upon completion of molding, place the test specimens in the moist closetor moist room. Keep all test specimens, immediately after molding, in the molds onthe base plates in the moist closet or moist room from 20 to 72 h with their uppersurfaces exposed to the moist air but protected from dripping water. If the specimensare removed from the molds before 24 h, keep them on the shelves of the moist closetor moist room until they are 24-h old, and then immerse the specimens, except thosefor the 24-h test, in saturated lime water in storage tanks constructed of noncorrodingmaterials. Keep the storage water clean by changing as required.
4.7.6 Determination of Compressive Strength:
Test the specimens immediately after their removal from the moist closet in the caseof 24-h specimens, and from storage water in the case of all other specimens. All testspecimens for a given test age shall be broken within the permissible toleranceprescribed as follows:
Test Age Permissible Tolerance
24 h ±1/2 h
3 days ±1 h
7 days ±3 h
28 days ±12 h
If more than one specimen at a time is removed from the moist closet for the 24-htests, keep these specimens covered with a damp cloth until time of testing. If morethan one specimen at a time is removed from the storage water for testing, keep thesespecimens in water at a temperature of 73.5 ± 3.5 °F or [23 ± 2 °C] and of sufficientdepth to completely immerse each specimen until time of testing. Wipe eachspecimen to a surface-dry condition, and remove any loose sand grains or

55
incrustations from the faces that will be in contact with the bearing blocks of thetesting machine. Check these faces by applying a straightedge (Note 8). If there isappreciable curvature, grind the face or faces to plane surfaces or discard thespecimen. A periodic check of the cross-sectional area of the specimens should bemade.
NOTE 8: Specimen Faces—Results much lower than the true strength will be obtainedby loading faces of the cube specimen that are not truly plane surfaces. Therefore, it isessential that specimen molds be kept scrupulously clean, as otherwise, largeirregularities in the surfaces will occur. Instruments for cleaning molds should alwaysbe softer than the metal in the molds to prevent wear. In case grinding specimen facesis necessary, it can be accomplished best by rubbing the specimen on a sheet of fineemery paper or cloth glued to a plane surface, using only a moderate pressure. Suchgrinding is tedious for more than a few thousandths of an inch (hundredths of amillimetre); where more than this is found necessary, it is recommended that thespecimen be discarded.
Apply the load to specimen faces that were in contact with the true plane surfaces ofthe mold. Carefully place the specimen in the testing machine below the center of theupper bearing block. Prior to the testing of each cube, it shall be ascertained that thespherically seated block is free to tilt. Use no cushioning or bedding materials. Bringthe spherically seated block into uniform contact with the surface of the specimen.Apply the load rate at a relative rate of movement between the upper and lowerplatens corresponding to a loading on the specimen with the range of 200 to 400 lbs/s[900 to 1800 N/s]. Obtain this designated rate of movement of the platen during thefirst half of the anticipated maximum load and make no adjustment in the rate ofmovement of the platen in the latter half of the loading especially while the cube isyielding before failure.
NOTE 9: It is advisable to apply only a very light coating of a good quality, lightmineral oil to the spherical seat of the upper platen.
4.7.7 Porosity test
When fresh mortar is transferred from a trowel onto bricks or blocks, the rheology ofthe mortar changes immediately as water is drawn out by suction. The objective of theproject was investigate how this affects the mortar microstructure and, in particular,whether the initial air content of mortar in the plastic state, based on measurementsfrom a pressure device (eg: BS EN 1015-7:1999), can be related to the porosity ofhardened mortar using petrographic methods.
Porosity of cement mortar cube was tested for both OPC and CPC cement. Porositywas determine using following Equation
Porosity (%) = (Wssd −Wod)/(Wssd −Wwater)………(6)
Where, Wssd= weight of sample in SSD condition
Wod= Weight of sample in OD condition
Wwater = Weight of sample in water

56
Chapter - 5
RESULTS AND DISCUSSION
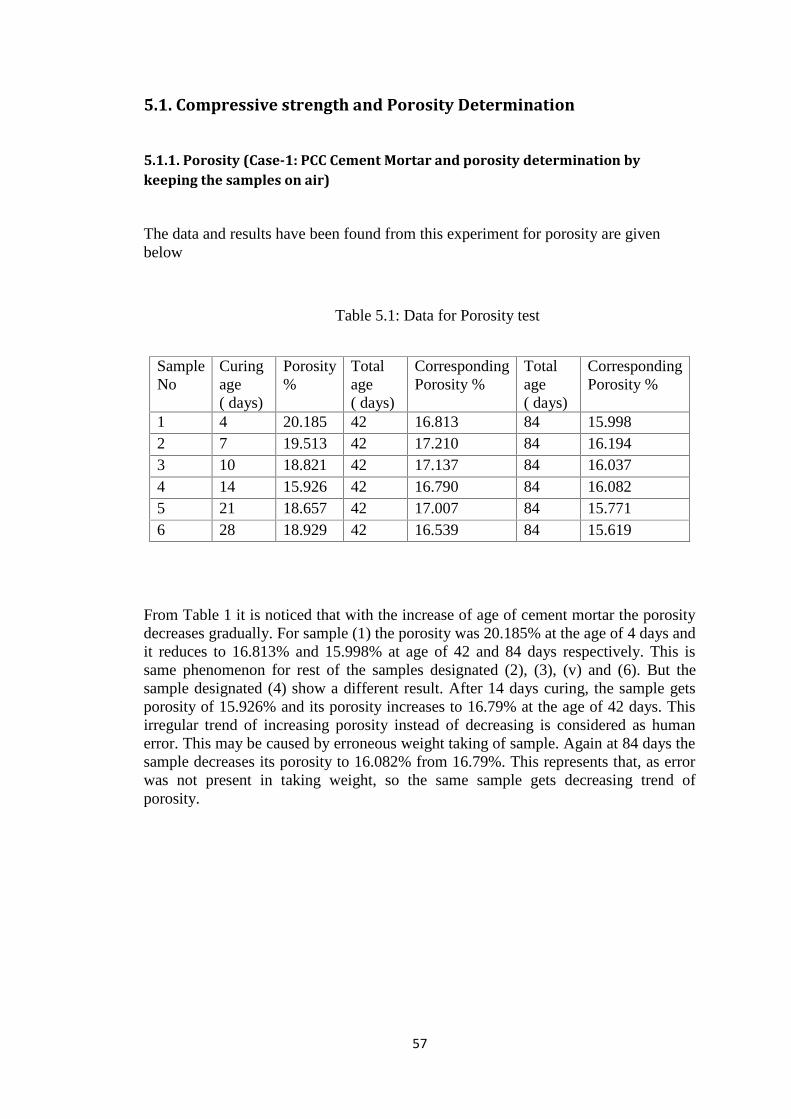
57
5.1. Compressive strength and Porosity Determination
5.1.1. Porosity (Case-1: PCC Cement Mortar and porosity determination bykeeping the samples on air)
The data and results have been found from this experiment for porosity are givenbelow
Table 5.1: Data for Porosity test
SampleNo
Curingage( days)
Porosity%
Totalage( days)
CorrespondingPorosity %
Totalage( days)
CorrespondingPorosity %
1 4 20.185 42 16.813 84 15.9982 7 19.513 42 17.210 84 16.1943 10 18.821 42 17.137 84 16.0374 14 15.926 42 16.790 84 16.0825 21 18.657 42 17.007 84 15.7716 28 18.929 42 16.539 84 15.619
From Table 1 it is noticed that with the increase of age of cement mortar the porositydecreases gradually. For sample (1) the porosity was 20.185% at the age of 4 days andit reduces to 16.813% and 15.998% at age of 42 and 84 days respectively. This issame phenomenon for rest of the samples designated (2), (3), (v) and (6). But thesample designated (4) show a different result. After 14 days curing, the sample getsporosity of 15.926% and its porosity increases to 16.79% at the age of 42 days. Thisirregular trend of increasing porosity instead of decreasing is considered as humanerror. This may be caused by erroneous weight taking of sample. Again at 84 days thesample decreases its porosity to 16.082% from 16.79%. This represents that, as errorwas not present in taking weight, so the same sample gets decreasing trend ofporosity.

58
The graphical presentations are given below:
Figure 5.1:- Porosity Reduction of Cement Mortar with Days for PCC Cement(sample-1)
Figure 5.2 : - Porosity Reduction of Cement Mortar with Days for PCC Cement (sample-2)
15.0016.0017.0018.0019.0020.0021.0022.0023.0024.0025.00
0 20 40 60 80 100
Poro
sity
%
Time (Days)
Reduction of Porosity of cement mortar with days forPCC cement, curing was 4 days
Porosity %
15.0015.5016.0016.5017.0017.5018.0018.5019.0019.5020.00
0 20 40 60 80 100
Poro
sity
%
Time (Days)
Reduction of Porosity of cement mortar with days forPCC cement, curing was 7 days
Porosity %
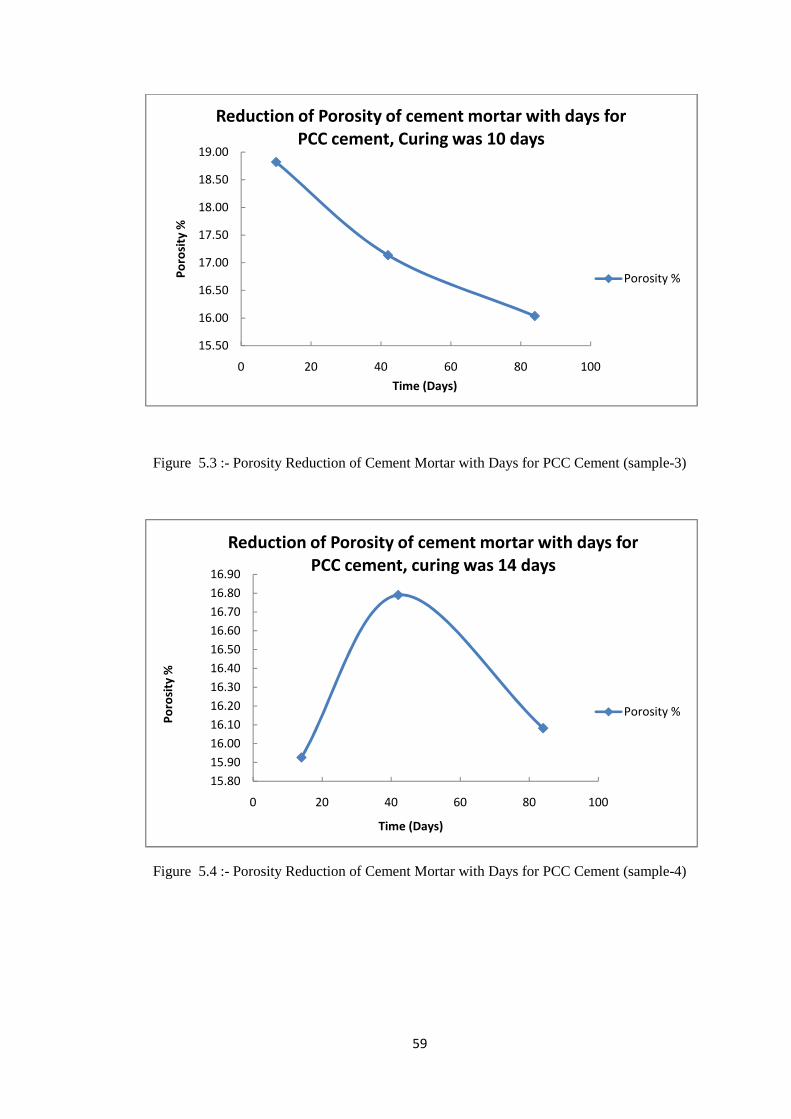
59
Figure 5.3 :- Porosity Reduction of Cement Mortar with Days for PCC Cement (sample-3)
Figure 5.4 :- Porosity Reduction of Cement Mortar with Days for PCC Cement (sample-4)
15.50
16.00
16.50
17.00
17.50
18.00
18.50
19.00
0 20 40 60 80 100
Poro
sity
%
Time (Days)
Reduction of Porosity of cement mortar with days forPCC cement, Curing was 10 days
Porosity %
15.8015.9016.0016.1016.2016.3016.4016.5016.6016.7016.8016.90
0 20 40 60 80 100
Poro
sity
%
Time (Days)
Reduction of Porosity of cement mortar with days forPCC cement, curing was 14 days
Porosity %
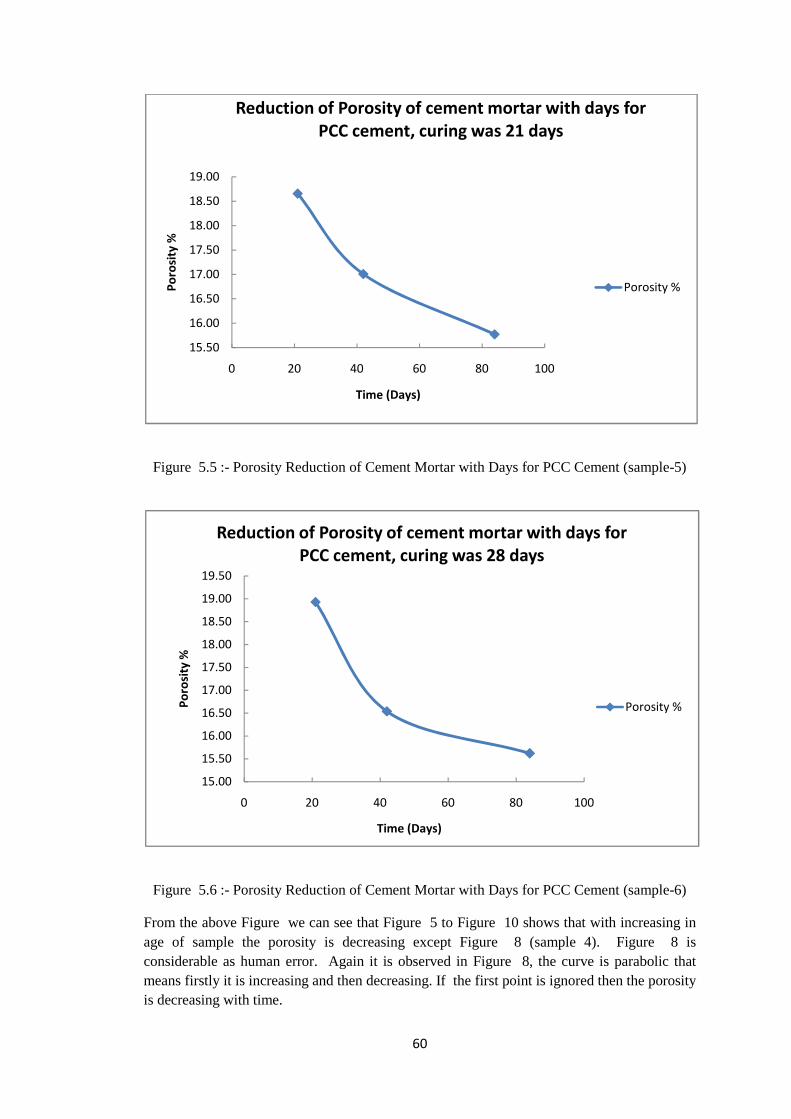
60
Figure 5.5 :- Porosity Reduction of Cement Mortar with Days for PCC Cement (sample-5)
Figure 5.6 :- Porosity Reduction of Cement Mortar with Days for PCC Cement (sample-6)
From the above Figure we can see that Figure 5 to Figure 10 shows that with increasing inage of sample the porosity is decreasing except Figure 8 (sample 4). Figure 8 isconsiderable as human error. Again it is observed in Figure 8, the curve is parabolic thatmeans firstly it is increasing and then decreasing. If the first point is ignored then the porosityis decreasing with time.
15.50
16.00
16.50
17.00
17.50
18.00
18.50
19.00
0 20 40 60 80 100
Poro
sity
%
Time (Days)
Reduction of Porosity of cement mortar with days forPCC cement, curing was 21 days
Porosity %
15.00
15.50
16.00
16.50
17.00
17.50
18.00
18.50
19.00
19.50
0 20 40 60 80 100
Poro
sity
%
Time (Days)
Reduction of Porosity of cement mortar with days forPCC cement, curing was 28 days
Porosity %

61
5.1.2 Compressive strength (Case -1 : Compressive strength determined for OPCand PCC cement mortar for Oven dry and Saturated surface dry condition )
Below the Table show the experimental data that have been obtained. These data has beenplotted on graph and the findings are below.
Table 5.2 : Data Table
Cement type Time (days) Strength psi (OD) Strength psi (SSD)OPC 3 5110.6 4619.7
14 6821.8 5445.228 6573.9 5551.842 7935.4 5821.156 8654.3 6280.5
PCC 3 4347.5 2787.814 6078.6 3772.328 7372.2 5842.842 7074.2 7304.456 8180.1 6987.7
From the Figure 5.7 it is seen that the curve for compressive strength of cementmortar of OPC cement in OD condition is uprising. But it is noticeable that thecompressive strength at age of 28 days has deflected from its continuous trend. Thiserror value is because of human error. This human error may be caused byinhomogeneous tamping, disturbed in curing and other to happen. But it has hardlypossibility to get change in w/c ratio.So ignoring the human error is showing theincreasing trend of compressive strength of OPC cement with increased age. Thecompressive strength for SSD condition of OPC cement shows a regular increasingcurve.
Figure 5.7: Strength at different days in OD and SSD condition for OPC cement
0
1000
2000
3000
4000
5000
6000
7000
8000
9000
10000
0 10 20 30 40 50 60
Stre
ngth
(psi)
Time (days)
Strength at different days in OD and SSD condition for OPCcement
Strength psi (OD)
Strength psi (SSD)

62
It is also found that the compressive strength curve for OD condition is above thecurve for SSD condition. This means that the compressive strength for a particularsample, the strength in OD condition has a higher value than strength in SSDcondition. Figure 5.8 represents the curves for the PCC cement mortar in OD and SSDcondition are uprising. But here also exist deflected data in OD condition at the age of42 days and in SSD condition at the age of 56 days. These data are considered ashuman error. In practical sense, ignoring the human error is not a big deal as therequired compressive strength of cement mortar is gained by 28 days according thespecification of cement as used.
Figure 5.8: Strength at different days in OD and SSD condition for PCC cement
Figure 5.9 and Figure 5.10 representing comparative compressive strength in ODand SSD condition respectively for OPC and PCC cement mortar for different days.This research reveals that OPC cement gives earlier aged high strength than PCCcement. Figure 5.9 shows that at the age of 3 days for OD condition, strength for OPCcement is 5111psi where PCC cement gains 4348 psi. But at 56 days the strength forboth OPC and PCC cement is approximately same.
0
1000
2000
3000
4000
5000
6000
7000
8000
9000
0 10 20 30 40 50 60
Stre
ngth
(psi)
Time (days)
Strength at different days in OD and SSD condition for PCC cement
Strength psi (OD)
Strength psi (SSD)

63
Figure 5.9 : Strength at different days in OD condition for OPC and PCC cement
Figure 5.10: Strength at different days in SSD condition for OPC and PCC cement
5111
6822 6574
79358654
4348
6079
7372 70748180
3 14 28 42 56
Time (Days)
Strength at Different Days in OD condition for OPC and PCC cement
Strength psi (OPC) Strength psi (PCC)
46205445 5552 5821
6280
2788
3772
5843
7304 6988
3 14 28 42 56
Time (Days)
Strength at Different Days in SSD condition for OPC and PCCcement
Strength psi (OPC) Strength psi (PCC)
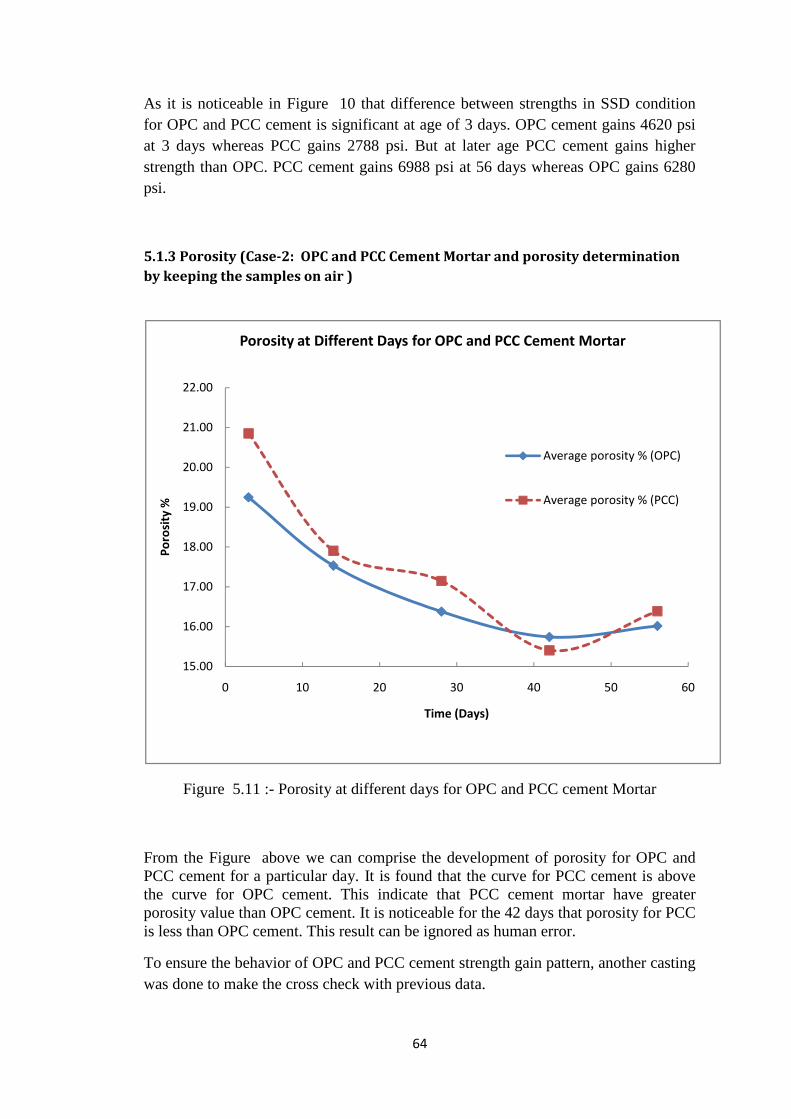
64
As it is noticeable in Figure 10 that difference between strengths in SSD conditionfor OPC and PCC cement is significant at age of 3 days. OPC cement gains 4620 psiat 3 days whereas PCC gains 2788 psi. But at later age PCC cement gains higherstrength than OPC. PCC cement gains 6988 psi at 56 days whereas OPC gains 6280psi.
5.1.3 Porosity (Case-2: OPC and PCC Cement Mortar and porosity determinationby keeping the samples on air )
Figure 5.11 :- Porosity at different days for OPC and PCC cement Mortar
From the Figure above we can comprise the development of porosity for OPC andPCC cement for a particular day. It is found that the curve for PCC cement is abovethe curve for OPC cement. This indicate that PCC cement mortar have greaterporosity value than OPC cement. It is noticeable for the 42 days that porosity for PCCis less than OPC cement. This result can be ignored as human error.
To ensure the behavior of OPC and PCC cement strength gain pattern, another castingwas done to make the cross check with previous data.
15.00
16.00
17.00
18.00
19.00
20.00
21.00
22.00
0 10 20 30 40 50 60
Poro
sity
%
Time (Days)
Porosity at Different Days for OPC and PCC Cement Mortar
Average porosity % (OPC)
Average porosity % (PCC)

65
5.1.4 Compressive Strength (Case-2: Compressive strength determined for OPCand PCC cement mortar for Saturated surface dry condition )
Table 5.3 :- Strength at different days of Cement mortar for OPC and PCC cement
Time (Days) Strength For PCC Cement (psi) Strength For OPC Cement (psi)
3 3394.14 3469.6514 5161.16 4722.2221 5855.12 4998.4628 6014.40 4896.51
The table above shows the data has acquired from the experiment. These data hasbeen plotted on graph shown below. It is demonstrated that two curves and theirrespective trend line has been shown. Both for OPC and PCC cement the compressivestrengths of Cement Mortar are increasing trend. These two curves are showing verydistinctive manner. From chart, the trend ling for PCC cement started from a lowerpoint of tread line for OPC cement. Starting point of tread line means the earlier ageof cement Mortar. So these trend lines represent that for earlier age the cement mortar,
Figure 5.12 :- Strength at Different days in SSD condition for OPC & PCC Cement
R² = 0.918
R² = 0.786
3000
3500
4000
4500
5000
5500
6000
6500
0 5 10 15 20 25 30
Stre
ngth
(psi)
Time (Days)
Strength at Different days in SSD condition for OPC & PCC CementStrengthFor PCCCement(psi)
StrengthFor OPCCement(psi)
Linear(StrengthFor PCCCement(psi) )Linear(StrengthFor OPCCement(psi) )

66
OPC cement gives higher strength than PCC cement. After a certain age cementmortar for both cements gets same strength for a certain age according the trend linein Figure . After that crossing point the trend line for OPC cement is below the trendline of PCC cement. And their distance increases with the increase of age of cementmortar. This presenting that the later age strength of cement mortar for PCC cement ishigher than OPC cement.
5.1.5 Porosity (Case-3 : OPC and PCC Cement Mortar and porosity determinationby keeping the samples into water)
Table 5.4 : - Compressive strength and corresponding Percent of Porosity for differentdays of OPC and PCC cement.
Time(Days)
Strength ForPCC Cement
(psi)
CorrespondingPorosity for PCCCement Mortar
(%)
Strength ForOPC Cement
(psi)
CorrespondingPorosity for OPCCement Mortar
(%)
3 3394.14 18.22 3469.65 18.4514 5161.16 16.73 4722.22 17.3921 5855.12 17.24 4998.46 16.4228 6014.40 16.23 4896.51 16.67
For the higher value of compressive strength percent of porosity reduces. Graphicalpresentation has been shown in below.
Figure 5.13 :- Porosity variation with corresponding compressive strength for PCCCement Mortar
R² = 0.732
3000
3500
4000
4500
5000
5500
6000
6500
7000
15.00 15.50 16.00 16.50 17.00 17.50 18.00 18.50 19.00
Stre
ngth
(psi)
Porosity %
Porosity variation with corresponding copressive strength for PCCCement Corresponding
Porosity forPCC CementMortarStrength ForPCC Cement(psi)
Linear(Strength ForPCC Cement(psi) )
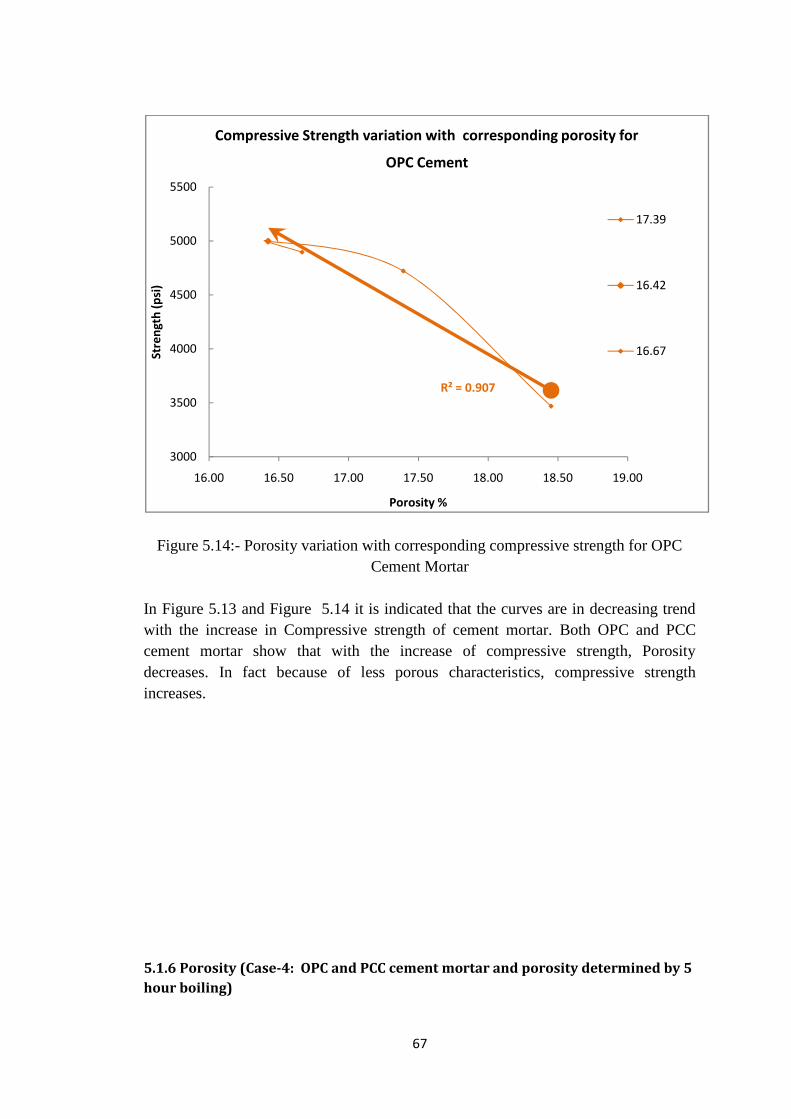
67
Figure 5.14:- Porosity variation with corresponding compressive strength for OPCCement Mortar
In Figure 5.13 and Figure 5.14 it is indicated that the curves are in decreasing trendwith the increase in Compressive strength of cement mortar. Both OPC and PCCcement mortar show that with the increase of compressive strength, Porositydecreases. In fact because of less porous characteristics, compressive strengthincreases.
5.1.6 Porosity (Case-4: OPC and PCC cement mortar and porosity determined by 5hour boiling)
R² = 0.907
3000
3500
4000
4500
5000
5500
16.00 16.50 17.00 17.50 18.00 18.50 19.00
Stre
ngth
(psi)
Porosity %
Compressive Strength variation with corresponding porosity for
OPC Cement
17.39
16.42
16.67
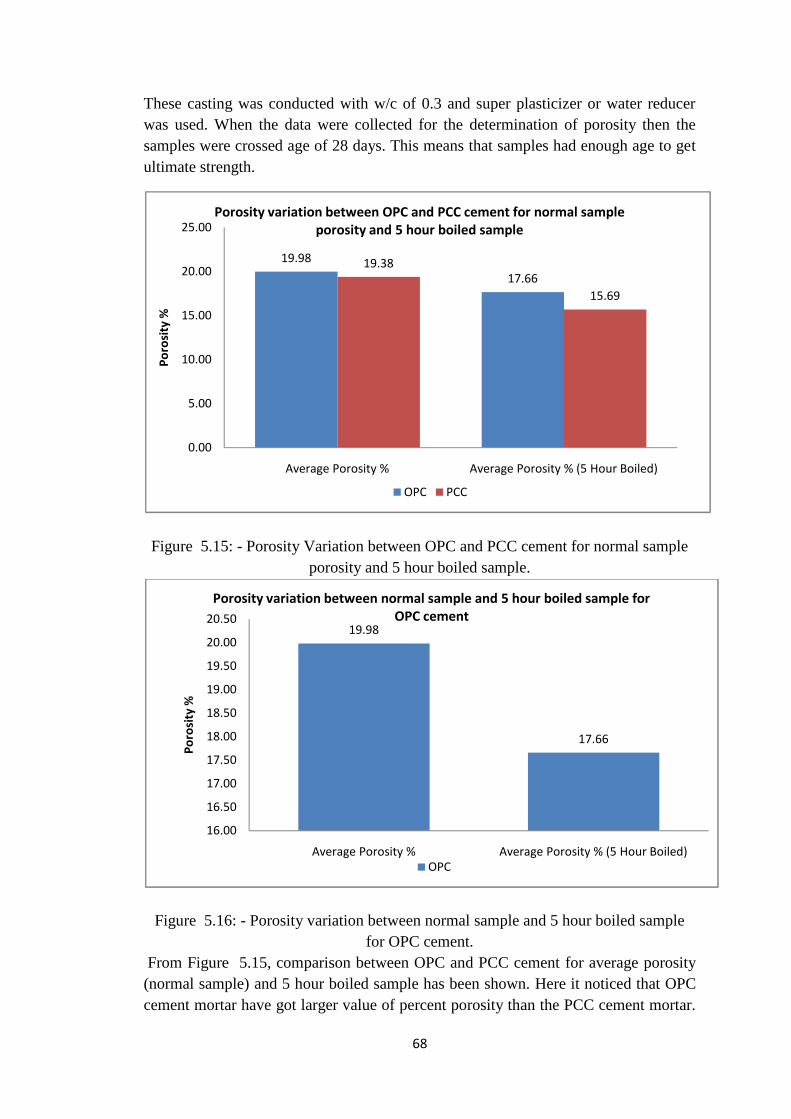
68
These casting was conducted with w/c of 0.3 and super plasticizer or water reducerwas used. When the data were collected for the determination of porosity then thesamples were crossed age of 28 days. This means that samples had enough age to getultimate strength.
Figure 5.15: - Porosity Variation between OPC and PCC cement for normal sampleporosity and 5 hour boiled sample.
Figure 5.16: - Porosity variation between normal sample and 5 hour boiled samplefor OPC cement.
From Figure 5.15, comparison between OPC and PCC cement for average porosity(normal sample) and 5 hour boiled sample has been shown. Here it noticed that OPCcement mortar have got larger value of percent porosity than the PCC cement mortar.
19.9817.66
19.38
15.69
0.00
5.00
10.00
15.00
20.00
25.00
Average Porosity % Average Porosity % (5 Hour Boiled)
Poro
sity
%
Porosity variation between OPC and PCC cement for normal sampleporosity and 5 hour boiled sample
OPC PCC
19.98
17.66
16.00
16.50
17.00
17.50
18.00
18.50
19.00
19.50
20.00
20.50
Average Porosity % Average Porosity % (5 Hour Boiled)
Poro
sity
%
Porosity variation between normal sample and 5 hour boiled sample forOPC cement
OPC

69
Same phenomenon has been observed for average porosity of normal sample as wellas for 5 hour boiled sample.
Finding has been documented in this researches that boiling water have influence inreduction of Porosity. Reduction in porosity causes increase in compressive strength.From Figure 5.16, it is demonstrated for OPC cement, average porosity for normalsample has a higher value than 5 hour boiled sample. 5 hour boiled sample with lowerpercent porosity represents the higher value of compressive strength.
Figure 5.17: - Porosity variation between normal sample and 5 hour boiled sample forPCC cement.
Same phenomenon has been shown in Figure 5.17 as like as Figure 5.16. Here 5hour boiled samples belong percent porosity which is less than porosity of normalsample for PCC cement mortar.
19.38
15.69
10.00
11.00
12.00
13.00
14.00
15.00
16.00
17.00
18.00
19.00
20.00
Average Porosity % Average Porosity % (5 Hour Boiled)
Poro
sity
%
Porosity variation between normal sample and 5 hour boiled sample forPCC cement
PCC

70
Chapter-6
CONCLUSION AND RECOMMENDATION

71
6.1 Conclusion
Micro structure characteristics of concrete control the service life and longevity ofconcrete structure. Materials transport properties like permeability and diffusivity arecontrolled by micro structure characteristics of concrete. Absorption, workability,porosity, type occupancy and surrounding environment have a good influence onconcrete structure.The main objectives of this research was to determine the relation between OPC andPCC cement strength and their corresponding porosity as well as temperature effecton cement mortar. To keep pace with the practical field work, materials were fromconstruction site. Researchers also tried to keep the same environment as like as workfield.This research was completed in several Cases. One finding was cross-checked byfurther experiments. For porosity 4 Cases were maintained and for compressivestrength 2 cases were done. Case-1 was done with PCC cement and only porositychange was determined with increasing age. And results show that with the increaseof cement mortar age porosity decreases gradually. After a certain age, porosityreduction rate decrease. Porosity Case-2 was to use for the cross-check of Case -1 aswell as porosity change trend difference for OPC and PCC cement. Case -2 shows thesame type of results like Case-1 regarding porosity reduction. PCC cement Mortarrepresents higher percent porosity than OPC cement mortar. Porosity Case-1 andCase-2 both samples were kept in air after their first level porosity determination. ForPorosity Case-3, same procedure was maintained expect that sample were kept intowater after first level porosity determination. Porosity Case-3 determines the porosityreduction when the cement mortar is into water. Porosity Case-4 have differentcondition as it’s w/c ratio is 0.3 and it’s porosity determined in normal condition aswell as after boiling the samples 5 hours in 100◦C temperature. Results shows those 5hours boiling samples have less porosity than normal condition. So this maydocumented that temperature have reduction influence on cement mortar.For the compressive strength 2 Cases or steps were followed. Case-1 and Case-2 weresame in procedure. Case-2 was done to cross- check to Case-1. Additional was todetermine OD condition compressive strength of for Case-1. Case-1 shows thatcompressive strength for OD condition is higher than SSD condition. Another findingis that compressive strength for OPC cement is higher in earlier age than PCC cement.On the other hand compressive strength for PCC cement is higher than OPC cementin later age. This way of strength gains for OPC and PCC cement is same for both ODand SSD condition.
6.2 Recommendation Collection of materials was difficult to collect as small amount. So University
authority should provide help regarding this issue. Because of holidays, sometimes it was difficult to take data reading from lab.
So data taking date should have to fix such way to avoid holidays. Working time on lab is limited. So authority should plan to increase the
working time.

72
References[1] Mehta, P. K. and Monteiro, P. J. M. Concrete: microstructure, properties, andmaterials, 3rded. 2006, New York: McGraw-Hill, 659 p.[2] Martys, N.S. Survey of concrete transport properties and their measurement,NISTIR 5592,US Department of Commerce, 1996, p. 1–40.[3] Drazan, J. and Zelic, J. The effect of fly ash on cement hydratıon in aqueoussuspensions,Ceramics−Silikaty, 2006, 50(2): 98-105.[4] Yilmaz, B. Olgun, A. Studies on cement and mortar containing low-calcium flyash,limestone, and dolomitic limestone, Cement Concrete Compos. 2008, 30: 194-201.[5] Worrell, E., Martin, N. and Price, L. Potentials for energy efficiency improvementin the UScement industry, Energy, 2000, 25(12): 1189-1214.[6] Fu, X., Wang, Z., Tao, W., Yang, C., Hou, W., Dong, Y. and Wu, X. Studies onblendedcement with a large amount of fly ash, Cement Concrete Res, 2002, 32(79): 1153-1159.[7] Ahmaruzzaman, A. M. Review on the utilization of fly ash, Progress in Energy andCombustion Science, 2009, pp. 1-37. (in press).[8] Neville, A. M. Properties of Concrete, 4th and Final ed., 1996, Harlow, England:Longman.[9] Ganjian, E and Pouya H.S. The effect of Persian Gulf tidal zone exposure ondurability ofmixes containing silica fume and blast furnace slag, Constr. Build Mater, 2009, 23:644-652.[10] Subasi, S. The Effects of Using Fly Ash on High Strength Lightweight ConcreteProducedwith Expanded Clay Aggregate, Scientific Research and Essays, 2009, 4(4): 275-288.[11] Yildiz, S., Balaydin, I. and Ulucan, Z. The Effect of Rice Husk Ash on ConcreteStrength (inTurkish), Sci. Eng. J. Fırat Univ., 2007, 19(1): 85-91.[12] Kaid, N., Cyr, M., Julien, S. and Khel, H. Durability of concrete containing anaturalpozzolan by a performance-based approach, Constr. Build Mater, 2009, 23: 3457-3467.[13] ASTM C 618-8. Standard specifications for fly ash and raw or calcined naturalpozzolan foruse as mineral admixture in Portland cement concrete, ASTM. Philadelphia, 1985,USA.[14] Aruntas, H.Y. The potential of fly ash usage in construction sector, J. Fac. Eng.Arch. GaziUniv., 2006, 21(1): 193-203. (in Turkish).[15] Neville, A.M. Properties of concrete, Pearson Education limited, 2006, England.[16] Mazloom, M., Ramezanianpour, A. A. and Brooks, J. J. Effect of silica fume onmechanicalproperties of high-strength concrete, Cement Concrete Compos, 2004, 26: 347-357.
73
[17] Sanchez, F. and Ince, C. Microstructure and macroscopic properties of hybridcarbonnano.ber/silica fume cement composites, Compos Sci. Technol, 2009, 69: 1310-1318.[18] Jo, B.W., Kim, C. H., Tae, G. and Park, J. B. Characteristics of cement mortarwith nano-SiO2 particles, Constr. Build Mater, 2007, 21: 1351-1355.[19] Qing, Y., Zenan, Z., Deyu, K. and Rongshen, C. Influence of nano-SiO2 additiononproperties of hardened cement paste as compared with silica fume, Constr. BuildMater,2007, 21: 539-545.[20] Song, H. W., Pack, S.W., Nam, S. H., Jong, J. C. and Saraswathy, V. Estimationof thepermeability of silica fume cement concrete, Constr. Build Mater, 2010, 24: 315-321.Norsuzailina Mohamed Sutan et al. Concrete Research Letters Vol. 2 (4) – December2011 335[21] Yildiz, K. The performance of silica fume admixtured concrete under the effectof ammoniumsulfate (in Turkish), E-J. New World Sci. Acad Technol. Appl. Sci., 2008, 3(2): 1-9.

74
Appendix : A

75
Figure A1 :- collection and weight of materials
Figure A2 :- Mold Preparation for Casting
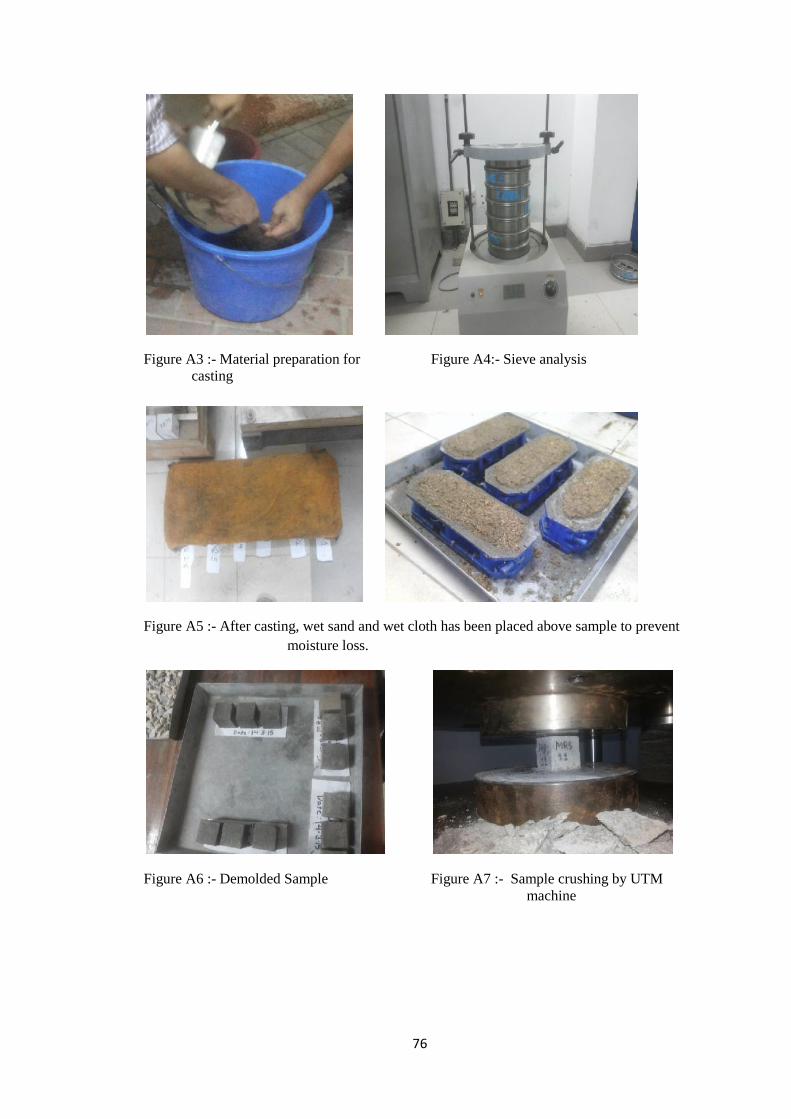
76
Figure A3 :- Material preparation for Figure A4:- Sieve analysiscasting
Figure A5 :- After casting, wet sand and wet cloth has been placed above sample to preventmoisture loss.
Figure A6 :- Demolded Sample Figure A7 :- Sample crushing by UTMmachine
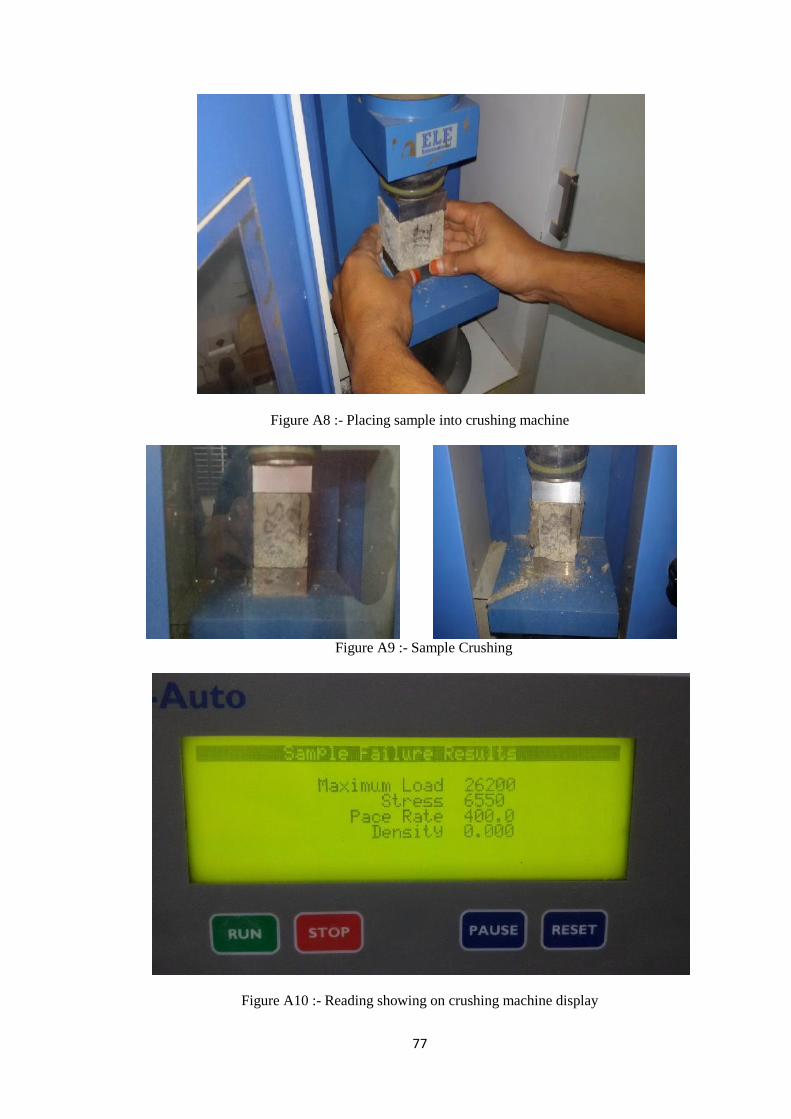
77
Figure A8 :- Placing sample into crushing machine
Figure A9 :- Sample Crushing
Figure A10 :- Reading showing on crushing machine display
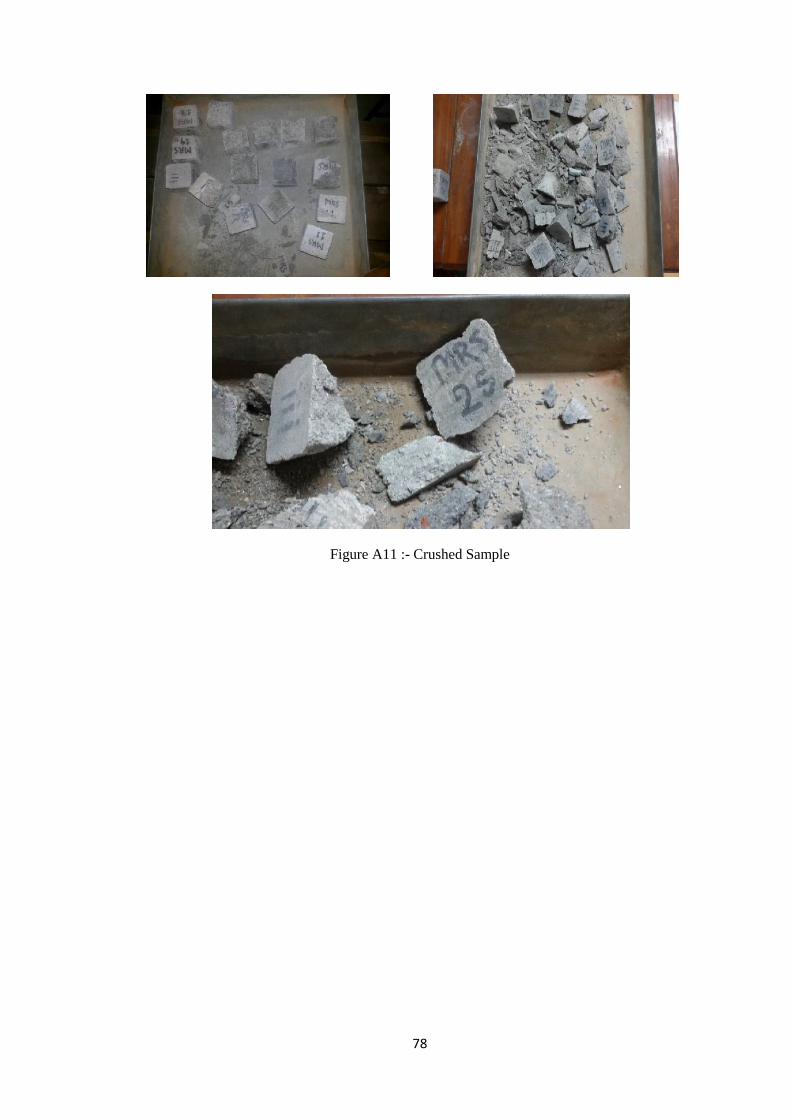
78
Figure A11 :- Crushed Sample