compression response of a sandwich fuselage keel panel with
TRANSCRIPT

NASA Technical Memorandum 110302
Compression Response of a Sandwich Fuselage Keel Panel With and Without Damage
David M. McGowan and Damodar R. AmburLangley Research Center, Hampton, Virginia
February 1997
National Aeronautics andSpace AdministrationLangley Research CenterHampton, Virginia 23681-0001
1
COMPRESSION RESPONSE OF A SANDWICH FUSELAGE KEEL PANEL WITH ANDWITHOUT DAMAGE
David M. McGowan and Damodar R. AmburNASA Langley Research Center
Hampton, VA
ABSTRACT
Results are presented from an experimental and analytical study of a sandwich fuselage keel panel
with and without damage. The fuselage keel panel is constructed of graphite-epoxy skins bonded to a
honeycomb core, and is representative of a highly loaded fuselage keel structure. The face sheets of the
panel contain several terminated or dropped plies along the length of the panel. The results presented
provide a better understanding of the load distribution in damaged and undamaged thick-face-sheet
composite sandwich structure with dropped plies and of the failure mechanisms of such structure in the
presence of low-speed impact damage and discrete-source damage. The impact-damage condition studied
corresponds to barely visible impact damage (BVID), and the discrete-source damage condition studied is a
notch machined through both face sheets. Results are presented from an impact-damage screening study
conducted on another panel of the same design to determine the impact energy necessary to inflict BVID on
the panel. Results are presented from compression tests of the panel in three conditions: undamaged; BVID
in two locations; and BVID in two locations and a notch through both face sheets. Surface strains in the
face sheets of the undamaged panel and the notched panel obtained experimentally are compared with finite
element analysis results. The experimental and analytical results suggest that for the damage conditions
studied, discrete-source damage influences the structural performance more than BVID.
INTRODUCTION
One of the primary goals of the Advanced Composites Technology (ACT) program is to develop the
enabling technology that will allow composite materials to be used in the primary wing and fuselage
structures of the next generation advanced subsonic transport aircraft. Under the ACT program, the Boeing
Commercial Aircraft Group (BCAG) has been working to develop cost-effective and structurally efficient
composite fuselage structure.1 The focus of this work has been on the fuselage section just aft of the main
landing gear wheel well of a modern wide-body transport which is designated as Section 46 on a Boeing
2
aircraft. This fuselage section is 33 feet long and 20 feet in diameter, and contains crown, side and keel
quadrant sections (see Fig. 1).2 As shown in Fig. 1, the current fuselage design concept utilizes skin-
stringer construction in the crown quadrant section and sandwich construction in the side and keel quadrant
sections.
Sandwich structure is being used in the design of the side and keel quadrant sections because it has the
potential for high structural efficiency and low-cost manufacturing and has been used extensively in
stiffness-critical aircraft secondary structures. The application of sandwich structures in aircraft has been
restricted in the past due to undesirable moisture absorption and moisture retention characteristics, and due
to an insufficient understanding of low-speed impact-damage mechanisms and the effect of such damage, as
well as penetration damage, on the structural performance of sandwich structures. Now that sandwich
concepts are being considered for application to aircraft primary structures, understanding the effects of
low-speed impact damage and penetration damage on sandwich structures has become important. A joint
NASA/Boeing study of the technology issues associated with using composite-face-sheet sandwich
structure in subsonic transport fuselage side and keel panels is being conducted as part of the ACT program.
This study consists of manufacturing, testing and analyzing full-scale keel- and side-quadrant-section
sandwich panels.
The present paper presents the results of an experimental and analytical study of the compression
response of a sandwich fuselage keel panel with and without damage. The test panel is representative of the
structure that would be used in the keel quadrant section of the highly loaded forward end of Section 46.
The objectives of the study are to understand the load distribution in the thick composite face sheets of the
sandwich panel with and without impact damage, and to determine panel failure mechanisms in the presence
of both impact damage and penetrating discrete-source damage. The impact-damage condition simulated in
the experimental study corresponds to barely visible impact damage (BVID). The impact-energy levels
necessary to inflict BVID on the panel are determined through an impact-damage screening test that was
performed using another panel of the same design. The simulated discrete-source damage corresponds to
penetration damage through both face sheets. The penetration damage is simulated by a notch machined
through both face sheets. The analytical study consists of finite element analyses of the undamaged panel
and the notched panel. Test results for surface strains are compared with finite element analysis results for
the undamaged panel and the notched panel. Face-sheet surface strains that illustrate load redistribution
around the impact-damage and notch sites are also presented. Finally, the present paper describes the panel
failure characteristics in the presence of BVID and discrete-source damage.
3
TEST PANEL DESCRIPTION
The forward keel panel test article is representative of the structure that would be used in the keel
quadrant section of the highly loaded forward end of Section 46. As discussed in reference 2, the current
keel-quadrant-section design utilizes a solid 152-ply laminate at the highly compression-loaded forward end.
As the compression loads are reduced towards the lightly loaded aft end of the keel quadrant section, the
structure transitions to a sandwich construction with 12-ply face sheets at that end. To accommodate the
change in the thickness of the face sheets required to attain this transition, it is necessary that a certain
number of plies be terminated or dropped in the face sheets along the length of the keel quadrant section.
The test panel is representative of this type of structure in that it has thick face sheets (≥ 36-ply laminates)
and contains several dropped plies along the panel length.
The test panel was machined from a larger manufacturing demonstration panel that was fabricated to
gain manufacturing scale-up experience with tow-placed composite structures with dropped plies.1 This
manufacturing demonstration panel, designated FK1, was designed and fabricated by the Boeing
Commercial Airplane Group under NASA contract NAS1-18889 as part of the ACT program. The face
sheets are fabricated from Hercules, Inc. AS4/8552 graphite-epoxy pre-impregnated tow material using a
tow placement manufacturing process. The honeycomb core is Hexcel, Corp. fiberglass Heat Resistant
Phenolic (HRP) core material with a 3/16-in. cell size and a density of 12 lb/ft3. The core is co-bonded to
the two face sheets using a film adhesive. The panel has an outer mold line (OML) radius of curvature of
122 inches, and a constant thickness of 1.53 inches as shown in Fig. 2. The width of the test panel varies
from 10 inches to 14 inches, and the length of the panel is 66 inches as shown in Fig. 3. The design goal
for this panel is to maintain a nearly uniform laminate axial stiffness while dropping a total of 14 plies along
the length of the panel. To achieve this goal, a total of 14 plies with 0o, 90o and ±45o orientations are
terminated or dropped and the width of the panel is gradually increased to compensate for the reduced face-
sheet thickness as the plies are dropped. The locations of the dropped plies are shown in Fig. 3 by the
dashed lines. The laminate at the 10-inch-wide end contains 50 plies as shown in Fig. 3, and this end of the
panel is referred to herein as the thick end. The laminate at the 14-inch-wide end contains 36 plies, and this
end of the panel is referred to herein as the thin end. The numbers shown in parentheses in Fig. 3 are the
numbers of plies with 0o, ±45o and 90o orientations, respectively. Following this notation convention, the
laminate at the thick end of the panel contains 18 0o plies, 24 ±45o plies and 8 90o plies, and the laminate at
the thin end of the panel contains 12 0o plies, 18 ±45o plies and 6 90o plies. The details of the face-sheet
laminates at each end of the panel are given in Table I, and the nominal elastic properties of the AS4/8552
pre-impregnated tow material are given in Table II. The outer thickness of the panel is maintained at a
constant thickness of 1.53 inches by tapering the thickness of the core to match the inner surfaces of the face

4
sheets. The design limit load (DLL) for this panel is 135 kips, and the design ultimate load (DUL) is 202
kips.
The loaded ends of the panel were potted in 1.5 inches of an epoxy resin material to prevent an end-
brooming failure. The potted ends were machined flat and parallel to each other to assure that a uniform
load is applied to the panel. For the final two tests, the OML surface of the panel was painted white so that
a shadow moiré interferometry technique could be used to monitor the out-of-plane displacements and to
observe any local response at the damage sites. The locations of the three damage sites that are described
subsequently are also indicated in Fig. 2. Two 100 ft-lb impact-energy impact sites are located near the top
and bottom of the panel in the figure, and a notch is machined along the specimen width through both face
sheets at the mid-length of the panel.
APPARATUS AND TEST CONDITIONS
Three tests were conducted on the test panel. For the first test, the undamaged panel was loaded to
approximately 52% of its design limit load (70 kips). For simplicity, this test is referred to herein as the
undamaged-panel test. For the second test, barely visible impact damage (BVID) was inflicted at two
locations, and the panel was loaded to 130% of its design limit load (175 kips). This test is referred to
herein as the impacted-panel test. The impact energy used to impact the panel for this test was determined
from impact-damage screening tests performed on a remnant machined from the large manufacturing
demonstration panel. The details of these screening tests are described in the following section, and the
details of the impact damage inflicted in the test panel are described in the results section. Following the
impacted-panel test, a 2.0-in.-long by 0.19-in.-wide notch was machined through both face sheets at the
mid-length of the panel. The panel was then loaded to failure which occurred at 202 kips (the panel DUL).
This test is referred to herein as the notched-panel test. The three tests are summarized in Table III.
For all tests, the potted ends of the panel were loaded in uniaxial compression in a hydraulic test
machine. The test setup for the undamaged test is shown in Fig. 4(a). A 300-kip capacity machine was
used for this test, and, as indicated in the figure, the unloaded edges of the panel were unsupported. The
buckling load for the panel in this condition was estimated to be 170 kips. The test setup for the impacted-
panel and notched-panel tests is shown in Fig. 4(b). A 1,200-kip capacity machine was used for this test,
and, as indicated in the figure, the unloaded edges of the panel were simply supported with 2.4-in.-diameter
steel tubes located 0.5 in. from the edges of the 10-in.-wide end of the panel. The edge supports were used
for this test for two reasons. First, it was anticipated that the panel would be subjected to loads that exceed

5
the wide-column buckling load of the panel and, as a result, the panel would buckle into a general instability
mode. Second, to establish the relative criticality of each of the damage sites, it was necessary to inhibit
any global bending that would occur if the panel were tested in an unsupported condition. Surface strains
were measured using electrical resistance strain gages. Direct-current displacement transducers (DCDT’s)
were used to measure out-of-plane displacements of the face sheets as well as the stroke of the test machine
loading platen. The global locations of the strain gages are shown in Fig. 5. The locations of the strain
gages located near the impact sites and the notch are given in Fig. 6(a) and 6(b), respectively. The locations
of the DCDT’s are given in Fig. 7(a) for the undamaged test and in Fig. 7(b) for the impacted-panel and
notched-panel tests. The axial load applied to the panel was measured using the test machine load cell. The
strain gage, DCDT, and load data were recorded using a high-data-rate data acquisition system. Data were
taken at one second intervals during both loading and unloading of the test panel for all tests except for the
final test to failure. Only the loading data were recorded for the test to failure.
For the impacted-panel and notched-panel tests, a shadow moiré interferometry technique was used to
monitor out-of-plane displacements of the face sheets and to monitor damage growth around the damage
sites (see Fig. 4(b)). A 6-in.-wide by 60-in.-long area in the center of the panel was monitored on the
convex surface of the panel. The moiré fringe patterns were recorded using still photography and video
photography. The response of the concave surface of the panel was also recorded using video
photography.
IMPACT DAMAGE SCREENING TESTS
The impact-damage conditions simulated in the experimental study correspond to barely visible impact
damage (BVID) which usually results from a low-speed impact event. The damaged site typically exhibits
very little surface damage, and it is very likely that it could be overlooked during a routine visual inspection
of an in-service aircraft. Therefore, the performance of the damaged structure must not be significantly
degraded by the presence of BVID. The chance that BVID will occur for the fuselage of a civil transport
aircraft at some time during the lifetime of the vehicle is high. It is therefore important that the effect of this
type of damage on the structural response of the fuselage structure be well understood. Results of studies
of the effect of low-speed impact damage on the response of composite-face-sheet sandwich structure is
given in references 3-7. The goal of the present impact-damage screening tests is to determine the impact-
energy level that is necessary to inflict BVID on the test panel. This type of damage is usually characterized
as having a residual dent depth of 0.05 to 0.10 inches at the impact site. A residual dent depth of 0.05

6
inches was chosen for the present study, and BVID was considered to have occurred when the residual
depth of the dent at the impact site was greater than or equal to 0.05 inches.
A remnant machined from the original manufacturing demonstration panel is used as the test specimen
for these screening tests. The remnant is 26-inches long, and it contains both the 50-ply and 36-ply
laminates that are utilized in the test panel. The specimen was impacted using a dropped-weight impact
apparatus8 with either a 10-lb or 11-lb mass and a 1-inch-diameter hemispherical tup. Impact energies from
5 ft-lbs to 100 ft-lbs were used to impact the specimen. A schematic of the test setup for these tests is show
in Fig. 8. As shown in the figure, the supports used consist of curved wooden supports and steel I-beams
mounted to a rigid table. The remnant was clamped to the supports to prevent excessive rebound of the
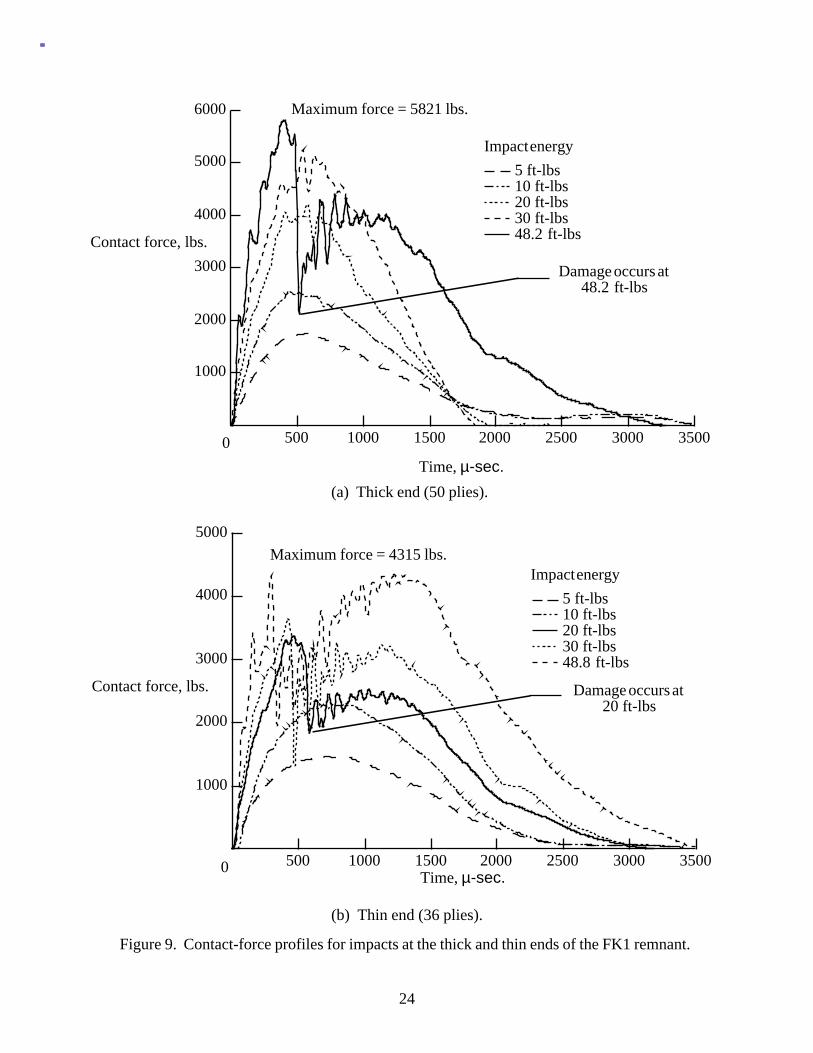
panel after impact. Contact force profiles were measured during impact for impact energies up to 48.8 ft-
lbs. Other measurements taken include the residual dent depth and the area of the damaged site. The area
measurements are made using an ultrasonic C-scan inspection technique
Contact-force profiles for impact energies up to 48.2 ft-lbs are shown in Fig. 9(a) for the thick (50-ply)
end of the remnant. The measured contact force in pounds is plotted in this figure as a function of time in
micro-seconds for several impact-energy levels ranging from 5 ft-lbs to 48.2 ft-lbs. Damage initiation is
indicated in the figure when the contact-force magnitude at a particular impact-energy level is reduced
significantly. Damage first occurred at an impact energy of 48.2 ft-lbs as indicated by the solid line in Fig.
9(a). The maximum value of the contact force for this impact energy is 5,820 lbs. Contact-force profiles
for impact energies up to 48.8 ft-lbs are shown in Fig. 9(b) for the thin (36-ply) end of the remnant.
Although the shapes of the profiles are similar to those for the thick end, the first indication of damage
occurred at an impact energy of 20 ft-lbs for the thin end. Furthermore, the maximum value of the contact
force for the thin end is 4,500 lbs. These results are consistent with those presented in references 3-7 where
delaminations are shown to occur in sandwich structures at impact-energy levels that are much lower than
the impact-energy levels for damage initiation in monolithic laminates.
Measured values of the residual dent depth at the impact sites are plotted as a function of the impact-
energy level in Fig. 10 for the thick and thin ends of the remnant. The measured values are represented by
the open symbols, and cubic splines fit through these data points are represented by curves. The horizontal
line at 0.05 inches represents the dent depth value at which BVID is considered to have occurred. The cubic
splines fit through the measured data are intended to assist the reader in visualizing the general trends of the
data and are not intended to predict accurately the trends between the data points. As shown in Fig. 10, a
dent depth value of 0.05 inches is only obtained at the thin end of the panel for impact-energy levels below
100 ft-lbs of impact energy. The dent depth at the thick end is only 0.038 inches for an impact-energy level

7
of 100 ft-lbs. Although this is a very small dent, the damaged area resulting from this impact is significant.
Ultrasonic C-scan images of this impact site and the 48.2 ft-lb impact site are shown in Fig. 11. As
indicated in Fig. 11, the projected damage area for the 100 ft-lb impact energy is 2.789 in2. Measured
values of the damage area at the impact sites are plotted as a function of the impact-energy level in Fig. 12
for the thick and thin ends of the remnant. This figure is similar to Fig. 10 in that the measured values are
represented by the open symbols, and cubic splines fit through these data points are represented by curves.
As shown in Fig. 12, a considerable amount of damage occurs for impact energies well below 100 ft-lbs.
The damage area increases as the impact-energy level is increased from 30 ft-lbs up to 100 ft-lbs. At the
thin end, significant damage first occurs at 20 ft-lbs of impact energy. However, the damage area
increases as the impact-energy level is increased from 20 ft-lbs to 80 ft-lbs, and it approaches a constant
value for impact-energy levels greater than 80 ft-lbs. The impact-energy levels at which damage initiation is
indicated in Fig. 9 is higher than the impact-energy levels for the formation of damage in the specimen.
Visual inspection of the thin-end impact sites impacted at these higher impact energies showed a significant
increase in surface damage. Typical shear failures across the outer ±45o plies were evident at impact
energies of 90 and 100 ft-lbs. These results indicate that penetration into the laminate at the thin end was
beginning to occur at impact-energy levels greater than 90 ft-lbs.
Based on the results of these screening tests, an impact-energy level of 100 ft-lbs was chosen as the
impact energy to impact each end of the test panel. This value was selected for the impact of the thick end
because it was the maximum value to be used in the screening tests, and a dent depth of 0.05 inches could
not be obtained for this value. Conversely, this value was selected for the impact of the thin end to insure
that the a dent depth of 0.050 inches was obtained. The results of these impact-damage screening tests also
indicate that dent depth may not be a reliable means of assessing the strength degradation of a honeycomb
sandwich structure. It was shown that significant internal damage can occur with very small dents and for
impact energies that are lower than 100 ft-lbs. This type of damage has the potential of severely affecting
the residual strength of the structure. To identify a more suitable criterion, compression-after-impact
residual-strength studies should be performed on specimens that have been impacted by a wide range of
impact energies. The impact energies used should be large enough to ensure that significant internal damage
to the structure has occurred. Such a study will provide a better understanding of the effect of low-speed
impact damage on thick-face-sheet honeycomb sandwich structures.

8
ANALYTICAL MODEL
The sandwich panel was analyzed using the DIAL finite element code.9 The panel was modeled as a
combination of several sandwich plates each having different face-sheet stacking sequences and sandwich
core thicknesses. The dropped plies and variations in core thicknesses in the test panel were therefore
accounted for. An eight-node modified thick-shell element was used for modeling the plate. These
elements are shear deformable and account for the large shear deformations associated with sandwich
construction. The finite element model of the undamaged panel is shown in Fig. 13. This model has a total
of 400 elements and a total of 6,358 active degrees of freedom. Load is applied to the model by specifying
a uniform end shortening, δ, at the thin end of the panel. The potted ends of the panel are not modeled;
thus, the total length of the model is 63 inches. The effect of the potting is simulated by clamping the top
and bottom edges of the model. The side edges of the model are free, and the wide-column buckling load is
predicted to be 170 kips. The finite element model of the notched panel is shown in Fig. 14. This model
has a total of 416 elements and a total of 6,507 active degrees of freedom. As shown in the figure,
additional elements are used in the region of the notch to improve the mesh refinement in that region.
Simple support boundary conditions are specified along the line of nodes specified in Fig. 14 to represent
the edge supports used in the impacted- and notched-panel tests.
RESULTS AND DISCUSSION
Experimental results are presented for all three tests, and analytical results are presented for the
undamaged- and notched-panel tests. Experimental and analytical global surface strain results are presented
and compared for the undamaged panel. Experimental surface strain results around the two impact sites are
presented for the impacted-panel test. Experimental and analytical surface strain results around the thin-end
impact site and the notch are compared. Finally, the failure mode of the panel is described.
Undamaged-Panel Test
The test of the undamaged panel was performed to study the strain distribution in the face sheets of the
test panel and to confirm that the design goal of maintaining a relatively uniform laminate stiffness along the
length of the panel was met. Experimental surface strains in the face sheets of the test panel are shown in
Fig. 15. This figure presents the applied load as a function of an averaged axial surface strain for locations

9
at the thick end, mid-length and thin end of the panel. These locations are marked A, B and C, respectively,
in the figure. The strain values presented are an average of the strains across the width on both face sheets.
As is evident in Fig. 15, the strains are relatively uniform along the length of the panel. The largest
difference between the strains at any two locations is approximately 10 percent. Analytical surface strain
contours for the undamaged panel are presented in Fig. 16. The results in this figure are presented for an
applied load of 70 kips. As shown in Fig. 16, the analysis predicts a relatively uniform strain distribution
as well. The largest difference between the strains at any two locations is approximately 15 percent. The
averaged strain values (for a load of 70 kips) given in Fig. 15 at locations A, B and C are shown in Fig. 16
as well. The correlation between the analytical and experimental results is good, with a maximum difference
between the two results of approximately 15 percent. The results of this test indicate that the design goal of
maintaining a relatively uniform axial stiffness along the length of the panel was met.
Impacted-Panel Test
Following the test of the undamaged panel, the test panel was impacted at two locations and the panel
was loaded to 130 percent of its design limit load (175 kips). This load level was sufficient to provide well-
defined strain distributions around the impact sites, and was low enough to prevent premature failure of the
panel. As previously discussed, an impact-energy level of 100 ft-lbs was used at each impact site in an
effort to inflict barely visible impact damage to the panel. The locations of the impact sites and the resulting
dent depth and diameters of the damage areas are shown in Fig. 17. The impact at the thick end was 10.0
inches from the narrow end of the panel, and the impact at the thin end was 10.5 inches from the wide end
of the panel. The support conditions used for these impact events matched those used for the impact-
damage screening tests. Although the dent depth at the thick end is 0.013 inches, which is smaller than that
obtained in the impact-damage screening tests, the dent depth at the thin end of the test panel is identical to
the 0.060 inches obtained in the screening tests. The extent of the damage was mapped using a pulse-echo
ultrasonic testing device. This device identifies the approximate boundaries of the damage site, and the
damage-site diameters are presented in Fig. 17. As shown in the figure, the diameter of the damage site at
the thick end is 2.3 inches, and the diameter at the thin end is 2.7 inches.
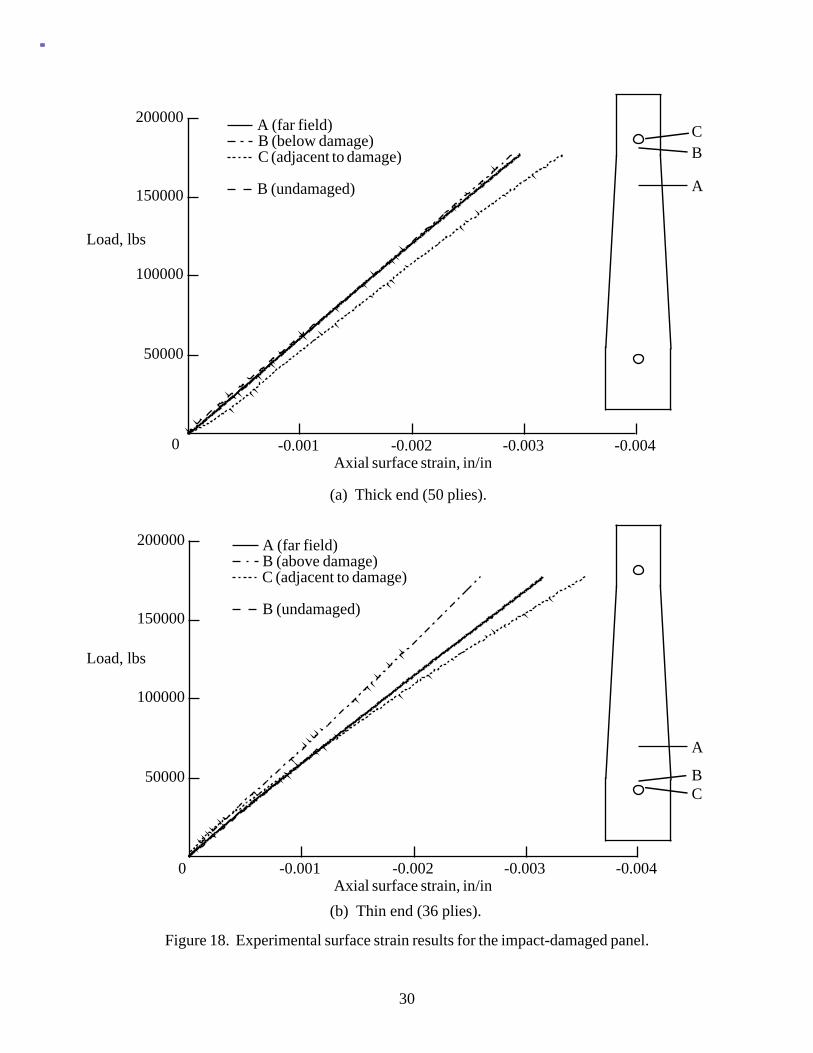
Experimental surface strain results for the impact-damaged panel that show strain distributions around
the impact sites at the thick and thin ends of the panel are given in Fig. 18(a) and 18(b), respectively. These
figures present load as a function of strain at three locations around each of the impact sites. Location A is
far away from the damage and is considered to be a far field location. Location B is very near to the damage
and is located on the axial centerline of the panel. Locations A and B are towards the middle of the panel in

10
each case to avoid any influence from the potted ends. Location C is adjacent to the damage sites and is
located on the horizontal centerline of each site. The strain data recorded for location B during the test of the
undamaged panel are also presented in each figure. The data in Fig. 18(a) indicate that the thick-end impact
damage does not significantly affect the response of the panel in that region since the data for locations A
and B are very similar. Furthermore, the data at location B for the undamaged-panel test are nearly identical
to the data for the impacted-panel test at that location. At location C, the strain is approximately 17 percent
greater than the strain at location A. These results suggest that damage at this site introduces a mild local
stress concentration, but does not affect the stress state slightly removed from the damage site. The data in
Fig. 18(b) indicate that the thin-end impact damage does have an appreciable affect on the response of the
panel in that region. The strains at location A are approximately 19 percent greater than the strains at
location B. This difference in strains directly represents the effect of the impact damage on the response of
the panel since the data from location B for the undamaged-panel test is very nearly the same as those for
location A for the impact-damaged panel test. The strains at location A are approximately 16 percent lower
than those at location C. The results presented in these figures confirm the intuitive notion that the larger
damage site at the thin end of the panel affects the response more than the damage at the thick end.
Notched-Panel Test
Following the test of the impacted panel, a notch was machined through both face sheets at the mid-
length of the panel, and the panel was loaded to failure. Failure occurred at an applied load of 202 kips (the
design ultimate load for this panel). The notch machined in the panel simulates penetrating discrete-source
damage. The details of the notch are shown in Fig. 17. As shown in the figure, the notch is 2-in. long and
0.19-in. wide. The ratio of the width of the panel, w, to the length of the notch, d, is approximately 6.
Experimental surface strain results for the notched panel that show the strain distributions around the
impact site at the thin end of the panel are given in Fig. 19(a). The trends in the data are very similar to
those shown in Fig. 18(b). The strain level decreases as the damage site is approached from the far field
location (from location A to B) and it increases adjacent to the damage (from location A to C). This result
suggests that the notch has no influence on the load distribution at this impact site. The change in slope of
the three curves in Fig. 19(a) correspond to a local failure that occurred near the notch tip. Experimental
surface strain results for the notched panel showing the strain distributions around the notch are given in
Fig. 19(b). The results in this figure indicate that the notch site is the most critical of the three damage sites.
The compressive strain level increases by more than a factor of two when the damage site is approached
from the far field location (from location A to B). More importantly, there is an increase in the strain level
11
of 350 percent over the far-field value at the notch tip (location C). The strain level at this point reaches a
maximum of approximately 12,500 µ-in/in before local failures in the face sheets occurred at approximately
185 kips of applied load. Evidence of these local failures is indicated by the decrease in the strain level at
location C for loads greater than 185 kips. This decrease in strain occurs as the load redistributes around the
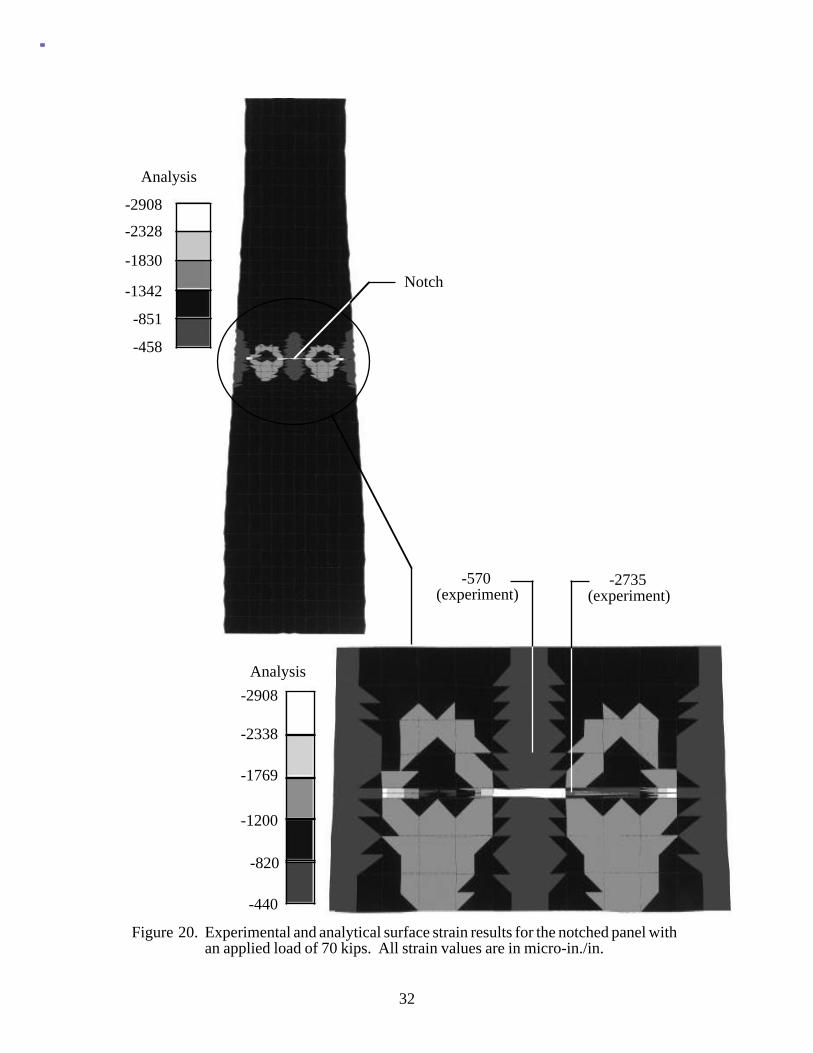
local failure sites at the notch tip. Analytical surface strain contours for the notched panel are presented in
Fig. 20. The results in this figure are presented for an applied load of 70 kips. As shown in Fig. 20, the
analysis predicts a relatively uniform strain distribution in the areas of the panel that are not near the notch
location. There are, however, very high strain gradients predicted near the notch. An enlarged view of the
notch location that shows these gradients is also given in Fig. 20. Experimental strain values at locations
above and adjacent to the notch are also given in this figure. Although the predicted strain above the notch
is close to the experimental value, the predicted strain at the notch tip is higher than the experimental value.
This difference can be attributed to the coarseness of the finite element mesh at this high stress gradient
region.
Failure occurred across the width of the panel at 202 kips which is the design ultimate load of the panel.
The failure mode of the panel is shown in Fig. 21. The failure mode is a compression failure of both face
sheets at the notch location. Photographs showing front and back views of the failure are shown in Fig. 21.
A post-test ultrasonic inspection of the two impact sites indicated that the area of the impact damage did not
grow during the final two tests.
CONCLUDING REMARKS
Results from an experimental and analytical study of a sandwich fuselage keel panel with and without
damage are presented. The panel is representative of a highly loaded fuselage keel structure. The graphite-
epoxy face sheets of the panel contain several terminated or dropped plies along the length of the panel. The
ends of the panel are referred to as thick or thin to reflect the thickness of the laminate at each end. The
objectives of the present study are to understand the load distribution in damaged and undamaged thick-face-
sheet sandwich structure with dropped plies and to study the failure mechanisms of such a structure in the
presence of impact damage and discrete-source damage. The impact-damage conditions simulated in the test
panel correspond to barely visible impact damage (BVID), and the discrete-source damage studied is
simulated by a notch machined through both face sheets. Compression tests of the panel in three conditions
were conducted. The conditions are undamaged, BVID in two locations, and BVID in two locations and a
notch through both face sheets. The load distribution in the face sheets of the panel is studied using

12
experimental and finite element analysis results. The relative severity of the different types of damage
inflicted on the panel is studied using experimental and analytical results as well.
The impact energy necessary to inflict BVID on the test panel was established from an impact-damage
screening study conducted on another panel of the same design. Results from the impact-damage screening
tests indicate that significant internal damage occurs at relatively low impact-energy levels and that the
corresponding residual dent depths at the impact sites are very small, making them nonvisible. However,
significant internal damage occurs at the impact locations which can significantly reduce the residual strength
of the panel. These results suggest that dent depth may not be a reliable means of assessing the strength
degradation of a honeycomb sandwich structure. To identify a more suitable criterion, compression-after-
impact residual-strength studies should be performed on specimens that have been impacted with a wide
range of impact-energy levels. The impact energies used should be large enough to ensure that significant
internal damage to the structure has occurred. Such a study would provide a greater understanding of the
effect of low-speed impact damage on thick-face-sheet honeycomb sandwich structure.
The design goal for the panel was to maintain a nearly uniform laminate axial stiffness while terminating
or dropping a total of 14 plies along the length of the panel. The experimental and analytical results for the
test of the undamaged panel indicate that this goal was met. The maximum difference between the
experimental surface-strain values at locations near the thick end, mid-length and thin end of the panel was
ten percent. The analysis of the test panel predicted the maximum difference in surface-strain values to be
fifteen percent.
Experimental results from the test of the impacted panel show that the impact damage at the thin end of
the panel is more critical than that at the thick end. The diameter of the impact-damage site at the thin end is
larger than that at the thick end. Experimental surface strain results that show the local strain distribution
around each impact-damage site indicate that the strain gradients around the site at the thin end of the panel
were larger than those around the site at the thick end of the panel.
Experimental and analytical results for the test of the notched panel identify the notch site as being the
most critical damage site. Surface strains that were 350 percent larger than far field strains occurred at the
notch tip. The compression strains at a location near the notch location increase by over a factor of two
compared to the far field value. The notch tip was also the site of a local failure that occurred prior to failure
of the panel. A panel failure occurred across the width of the panel at a load equal to 100 percent of the
design ultimate load for the panel. The mode of failure was a compression failure of both face sheets at the

13
notch location. Post-test ultrasonic inspection of the two impact sites indicated that the area of the impact
damage did not grow during either of the final two tests.
REFERENCES
1. Smith, P. J.; Ilcewicz, L. B.; and Olson, J. T.: Advanced Technology Composite Fuselage.
Proceedings of the Fifth NASA/DOD/ARPA Advanced Composites Technology Conference, NASA CP-
3294, 1995, pp. 1-31.
2. Avery, W. B.; Flynn, B. W.; Hanson, C. T.; Scholz, D. B.; Murphy, D. P.; Carberry, D. J.; Dopker,
B.; Williams, A. M.; and Ilcewicz, L. B.: Design and Structural Development of a Composite Fuselage
Keel Panel. Proceedings of the Fifth NASA/DOD/ARPA Advanced Composites Technology Conference,
NASA CP-3294, 1995, pp. 463-496.
3. Ambur, D. R.; and Cruz, J. R.: Low-Speed Impact Response Characteristics of Composite Sandwich
Plates. AIAA Paper 95-1460, April 1995.
4. Bernard, M. L.; and Lagace, P. A.: Impact Resistance of Composite Sandwich Plates. Journal of
Reinforced Plastics and Composites, Vol. 8, September 1989, pp. 432-445.
5. Tsang, P. H. W.; and Dugundji, J.: Damage Resistance of Graphite-Epoxy Sandwich Panels Under
Low Speed Impacts. Journal of the American Helicopter Society, Vol. 37, No. 1, January 1992, pp. 75-
81.
6. Koller, M. G.: Elastic Impact of Spheres on Sandwich Plates. Journal of Applied Mathematics and
Physics, Vol. 37, March 1986, pp. 256-269.
7. Lee, L. J.; Huang, K. Y.; and Fann, Y. J.: Dynamic Responses of Composite Sandwich Plates
Impacted by a Rigid Ball. Journal of Composite Materials, Vol. 27, No. 13, 1993, pp. 1238-1256.
8. Ambur, D. R.; Prasad, C. B.; and Waters, W. A.: An Internally Damped, Self-Arresting Dropped
Weight Apparatus for Studying the Low-Speed Impact Response of Composite Structures. Journal of
Experimental Mechanics, Vol. 33, No. 1, March 1995, pp. 64-69.

14
9. Anonymous: DIAL Finite Element Structural Analysis System, Version L3D3. Lockheed Missiles and
Space Company, August, 1991.
15
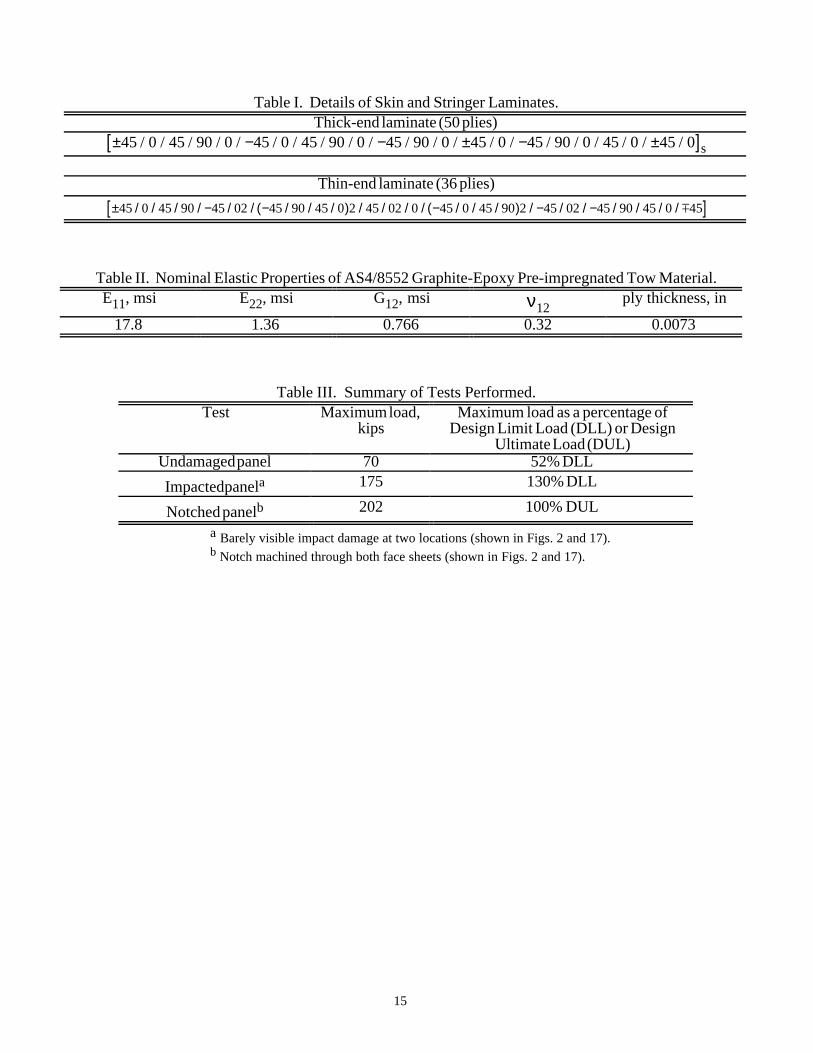
Table I. Details of Skin and Stringer Laminates.Thick-end laminate (50 plies)
±45 / 0 / 45 / 90 / 0 /−45 / 0 / 45 / 90 / 0 /−45 / 90 / 0 /±45 / 0 /−45 / 90 / 0 / 45 / 0 /±45 /0[ ]s
Thin-end laminate (36 plies)
±45/ 0 / 45/ 90 / −45/ 02 / (−45/ 90 / 45/ 0)2 / 45/ 02 / 0 / (−45/ 0 / 45/ 90)2 / −45/ 02 / −45/ 90 / 45/ 0 / m45[ ]
Table II. Nominal Elastic Properties of AS4/8552 Graphite-Epoxy Pre-impregnated Tow Material.E11, msi E22, msi G12, msi ν12
ply thickness, in
17.8 1.36 0.766 0.32 0.0073
Table III. Summary of Tests Performed.Test Maximum load,
kipsMaximum load as a percentage of
Design Limit Load (DLL) or DesignUltimate Load (DUL)
Undamaged panel 70 52% DLL
Impacted panela 175 130% DLL
Notched panelb 202 100% DUL
a Barely visible impact damage at two locations (shown in Figs. 2 and 17).b Notch machined through both face sheets (shown in Figs. 2 and 17).
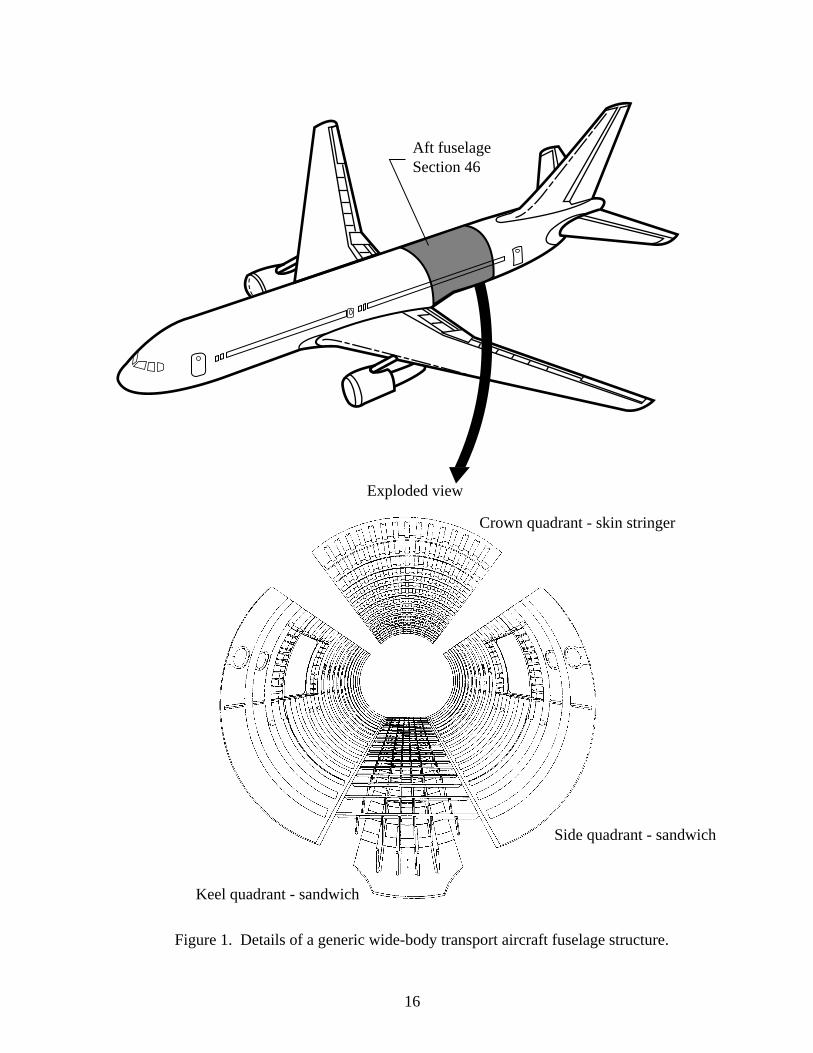
Aft fuselage Section 46
Exploded view
Side quadrant - sandwich
Crown quadrant - skin stringer
Keel quadrant - sandwich
Figure 1. Details of a generic wide-body transport aircraft fuselage structure.
16
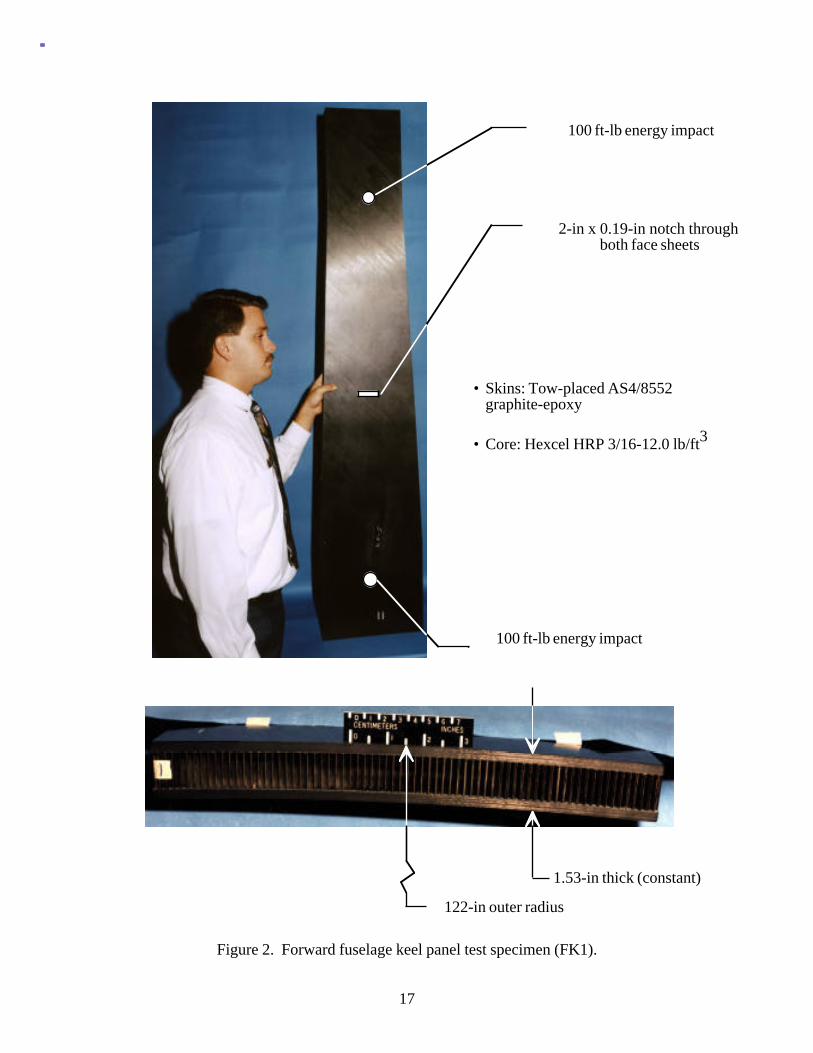
122-in outer radius
1.53-in thick (constant)
Figure 2. Forward fuselage keel panel test specimen (FK1).
100 ft-lb energy impact
100 ft-lb energy impact
2-in x 0.19-in notch through both face sheets
• Skins: Tow-placed AS4/8552 graphite-epoxy
• Core: Hexcel HRP 3/16-12.0 lb/ft3
17

50 plies (18/24/8) 0.365-in-thickface sheets (thick end)
36 plies (12/18/6) 0.263-in-thickface sheets (thin end)
Figure 3. Geometry of the test specimen. Dimensions are in inches.
• Core is tapered to maintain constant panel thickness
10.0
12.0
19.5
24.0
28.5
30.7
33.0
35.2
37.5
42.0
54.0
66.0
Pliesdropped
-45, -45
0, 0
-45, +45900, 090+45, +45
0, 0
14.0
• Total thickness of panel is aconstant 1.53 in.
18

(a) Undamaged panel.
Potted ends
Free edges
Figure 4. Test setup for the undamaged- and damaged-panel tests.
(b) Damaged panel.
Edgesupports
Moirégrid
19

Figure 5. Global strain gage locations for test panel.
Gages indicated by the bold linesare on the concave surface only.
All other gages are back-to-backpairs.
20

.5 .5
.5
.25
.10
.5 .5
.5
.5
.25
.125
(a) Strain gage locations around impact sites.
(b) Strain gage locations around notch site.
Figure 6. Strain gage locations around the impact-damaged and notched sites. Dimensions are in inches.
Gages on convex surface only.
All gages are back-to-back pairs.
Approximate boundary of damagefrom pulse-echo ultrasonic inspection.
21

Figure 7. Locations of DCDT's for all three tests. Dimensions are in inches.
(a) Undamaged-panel test.
16.5
33.0
49.5
(b) Impacted-panel and notched-panel tests.
10.0
32.5
55.5
δ
Two DCDT's measure cross-head stroke, δ
• indicates location of out-of-plane DCDT's
22
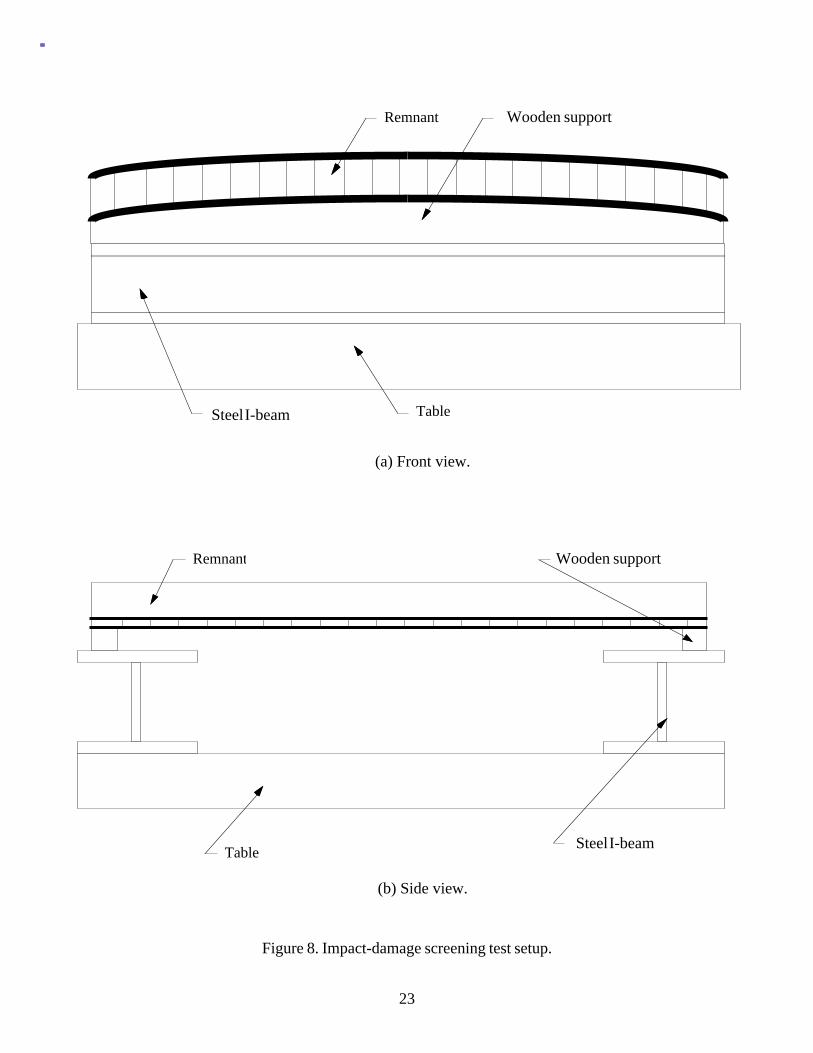
Remnant Wooden Support
Steel I-Beam Table
Remnant Wooden Support
Steel I-BeamTable
Front View
Side view
Figure 8. Impact-damage screening test setup.
(a) Front view.
(b) Side view.
Steel I-beam
Wooden support
Steel I-beam
Wooden support
23
5000
4000
3000
2000
1000
350030002500200015001000500Time, µ-sec.
5 ft-lbs 10 ft-lbs 20 ft-lbs 30 ft-lbs 48.8 ft-lbs
6000
5000
4000
3000
2000
1000
350030002500200015001000500
Time, µ-sec.
5 ft-lbs 10 ft-lbs 20 ft-lbs 30 ft-lbs 48.2 ft-lbs
Maximum force = 5821 lbs.
0
Impact energy
Damage occurs at48.2 ft-lbs
Maximum force = 4315 lbs.Impact energy
Damage occurs at20 ft-lbs
0
Contact force, lbs.
Contact force, lbs.
Figure 9. Contact-force profiles for impacts at the thick and thin ends of the FK1 remnant.
(a) Thick end (50 plies).
(b) Thin end (36 plies).
24

Dent depth, in.
0.08
0.06
0.04
0.02
10080604020Impact energy, ft-lbs.
Thick End (50 plies) Thin End (36 plies)
BVID dent depth
Figure 10. Residual dent depth values measured at the impact sites on the FK1 remnant.
100 ft-lbs 48.2 ft-lbs
Area = 2.783 in2 Area = 0.816 in2
Figure 11. Ultrasonic C-scan images of impact damage at the thick end of the FK1 remnant.
0
25

3.0
2.5
2.0
1.5
1.0
0.5
10080604020
Impact energy, ft-lbs
Thick end (50 plies) Thin end (36 plies)
Damage area, in2
0
Figure 12. Area of impact damage sites as measured by ultrasonic C-scan inspections of the FK1 remnant.
1301 nodes, 400 modified thick-shellelements
6358 active degrees of freedom
• Uniform end shortening, δ• Top and bottom edges clamped• Side edges free
63
10
14
δy
x
Figure 13. Analytical model of undamaged panel. Dimensions are in inches.
26

1364 nodes, 416 modifiedthick-shell elements
6507 active degrees offreedom
• Uniform end shortening, δ• Top and bottom edges
clamped
63
10
14
Notch detail
δ
Simply supportedalong these lines
y
x
31.5
Figure 14. Analytical model of panel with a notch through both face sheets. Dimensions are in inches.
27

-0.0015-0.001-0.0005Averaged axial surface strain, in/in
80000
60000
40000
20000
A (top of panel) - experiment B (middle of panel) - experiment C (bottom of panel) - experiment
Load, lbs
A
B
C
Figure 15. Experimental surface strain results for the undamaged panel.
-1463-1406
-1313-1276-1239
Analysis -1127 (experiment)
-1086 (experiment)
-1185 (experiment)
-1370
Figure 16.Experimental and analytical surface strain results for the undamaged panel with an applied load of 70 kips. All strain values are in micro-in./in.
0
28

9.5
2.3
9.0
2.7
Dent depth = 0.0135
Dent depth = 0.060
3333
10
2.3-in. diameter
0.013-in. dent depth
2.7-in. diameter
10.5
0.060-in. dent depth
notch machined throughboth facesheets (w/d = 6)
Detail of notch
Impact conditions
• 11-lb dropped-weight impactor• 1-in-diameter hemispherical tup• 100 ft-lb energy impacts at each end
0.19
2.0
Figure 17. Details of impact-damage sites and machined notch.
29
-0.004-0.003-0.002-0.001Axial surface strain, in/in
200000
150000
100000
50000
A (far field) B (above damage) C (adjacent to damage)
B (undamaged)
-0.004-0.003-0.002-0.001Axial surface strain, in/in
200000
150000
100000
50000
A (far field) B (below damage) C (adjacent to damage)
B (undamaged)
Load, lbs
(a) Thick end (50 plies).
0
A
BC
Load, lbs
(b) Thin end (36 plies).
0
BC
A
Figure 18. Experimental surface strain results for the impact-damaged panel.
30

-0.006-0.005-0.004-0.003-0.002-0.001Axial surface strain, in/in
250000
200000
150000
100000
50000
A (far field) B (above damage) C (adjacent to damage)
B (undamaged)
Load, lbs
(a) Thin end (36 plies).
0
BC
A
Figure 19. Experimental surface strain results for the notched panel.
-0.014-0.012-0.010-0.008-0.006-0.004-0.002Axial surface strain, in/in
250000
200000
150000
100000
50000
A (far field) B (above damage) C (adjacent to damage)
B (undamaged)
Load, lbs
(b) Notch location.
0
BC
A
31
-570(experiment)
-2735(experiment)
-2908
-458
-1342
-1830
-2328
Analysis
-851
Analysis
-2908
-440
-1769
-2338
-820
-1200
Notch
Figure 20.Experimental and analytical surface strain results for the notched panel with an applied load of 70 kips. All strain values are in micro-in./in.
32

Front view of failure
Back view of failure
Failed specimen
Figure 21. Failure mode for the notched panel, failure load = 202 kips.
33