compression clothing and muscle metabolism during recovery from high intensity exercise
TRANSCRIPT

Squeezing the Muscle: Compression Clothing and MuscleMetabolism during Recovery from High IntensityExerciseBilly Sperlich1,2*, Dennis-Peter Born1, Kimmo Kaskinoro3,4, Kari K. Kalliokoski3, Marko S. Laaksonen5
1 Department of Sport Science, University of Wuppertal, Wuppertal, Germany, 2 Department of Sport Science, University AF Munich, Munich, Germany, 3 Turku PET
Centre, University of Turku, Turku, Finland, 4 Anesthesiology and Intensive Care, University of Turku, Turku, Finland, 5 Swedish Winter Sports Research Centre, Department
of Health Sciences, Mid Sweden University, Ostersund, Sweden
Abstract
The purpose of this experiment was to investigate skeletal muscle blood flow and glucose uptake in m. biceps (BF) and m.quadriceps femoris (QF) 1) during recovery from high intensity cycle exercise, and 2) while wearing a compression shortapplying ,37 mmHg to the thigh muscles. Blood flow and glucose uptake were measured in the compressed and non-compressed leg of 6 healthy men by using positron emission tomography. At baseline blood flow in QF (P = 0.79) and BF(P = 0.90) did not differ between the compressed and the non-compressed leg. During recovery muscle blood flow washigher compared to baseline in both compressed (P,0.01) and non-compressed QF (P,0.001) but not in compressed(P = 0.41) and non-compressed BF (P = 0.05; effect size = 2.74). During recovery blood flow was lower in compressed QF(P,0.01) but not in BF (P = 0.26) compared to the non-compressed muscles. During baseline and recovery no differences inblood flow were detected between the superficial and deep parts of QF in both, compressed (baseline P = 0.79; recoveryP = 0.68) and non-compressed leg (baseline P = 0.64; recovery P = 0.06). During recovery glucose uptake was higher in QFcompared to BF in both conditions (P,0.01) with no difference between the compressed and non-compressed thigh.Glucose uptake was higher in the deep compared to the superficial parts of QF (compression leg P = 0.02). These resultsdemonstrate that wearing compression shorts with ,37 mmHg of external pressure reduces blood flow both in the deepand superficial regions of muscle tissue during recovery from high intensity exercise but does not affect glucose uptake inBF and QF.
Citation: Sperlich B, Born D-P, Kaskinoro K, Kalliokoski KK, Laaksonen MS (2013) Squeezing the Muscle: Compression Clothing and Muscle Metabolism duringRecovery from High Intensity Exercise. PLoS ONE 8(4): e60923. doi:10.1371/journal.pone.0060923
Editor: Michael Muller, Wageningen University, The Netherlands
Received October 31, 2012; Accepted March 4, 2013; Published April 17, 2013
Copyright: � 2013 Sperlich et al. This is an open-access article distributed under the terms of the Creative Commons Attribution License, which permitsunrestricted use, distribution, and reproduction in any medium, provided the original author and source are credited.
Funding: The study was in part financed by Sigvaris, Winterhur, Switzerland. The funders had no role in study design, data collection and analysis, decision topublish, or preparation of the manuscript. No additional external funding was received for this study.
Competing Interests: BS and DPB had travel costs to Turku, Finland, paid by SIGVARIS for data acquisition. BS has received consultancy fee by SIGVARIS onother previous projects other than the present one. This does not alter the authors’ adherence to all the PLOS ONE policies on sharing data and materials. None ofthe other authors have any ownership of stocks, employment or board membership at SIGVARIS AG or other companies with competing interests with relation todata presented here, neither financial, professional, nor personal.
* E-mail: [email protected]
Introduction
Skeletal muscle blood flow incorporates a key role in aerobic
muscle metabolism matching the delivery of oxygen and energy
substrates for energetic demands, as well as the transportation of
waste products and heat from the muscle tissue. The response of
skeletal muscle blood flow and metabolism at the onset of and during
exercise are well documented. In general, muscle blood flow
increases rapidly with an exercise-depended plateau after approx-
imately 30 s of exercise [1,2]. Muscle blood flow is heterogeneously
distributed [3] in a manner that it is higher in the deeper compared
to the superficial parts of the m. quadriceps femoris [4].
Another point is that blood glucose concentration plays an
important role in restoring muscle glycogen during recovery from
exercise [5]. Unfortunately, little is known about the crucial role of
blood flow and its association to glucose uptake, during recovery
from high intensity exercise [6] and so far no study investigated
this matter in connection with the application of compression
clothing.
In the past two decades, various forms of compression clothing
have been applied by elite and recreational athletes due to
accumulating evidence regarding the possible performance [7,8]
and recovery [9–11] enhancing properties. Early research showed
that the application of 15 mmHg external pressure while lying in
supine position reduces the cross-sectional area of the venous
systems (from 2.65 cm2 to 0.53 cm2) thereby elevating mean linear
blood flow velocity (from 0.5 cm/s to 2.5 cm/s) [12] and thus
reducing contact time and thrombogenesis [13]. The application
of compression seems to enhance muscle blood flow [14] and has
been associated with enhanced clearance of metabolites, such as
blood lactate [15,16]. However, it also has been suggested that
reduced levels of blood lactate are attributable to a greater
retention of the molecule within the muscle [15,16]. In this context
two recent literature reviews summarized the effects of compres-
sion on metabolite clearance to be controversial [17,18]. In this
regard, especially clothing with a high level of compression
(.30 mmHg) has not been investigated regarding its effects on
blood flow and glucose uptake during recovery.
PLOS ONE | www.plosone.org 1 April 2013 | Volume 8 | Issue 4 | e60923

Positron emission tomography (PET) provides a unique tool to
investigate metabolism in the entire muscle tissue noninvasively
in vivo [19]. The PET method is based on the use of short-lived
positron emitting radioisotopes and thus, allows quantitative
measurements of tracer concentrations in the muscle tissue
providing important information on muscle metabolism. There-
fore, the PET method will reveal regional differences within the
muscle when wearing compression clothing.
Therefore the primary aims of this experiment were to 1) study
skeletal muscle blood flow and glucose uptake during recovery
from high intensity exercise, and 2) investigate whether compres-
sion clothing enhances skeletal muscle blood flow and glucose
uptake.
Methods
Subjects and Ethics StatementSix healthy males volunteered for this study. Their age,
anthropometric characteristics and peak oxygen uptake values
are summarized in Table 1. All participants were informed about
the purpose, nature and potential risks of the study, and gave their
written informed consent prior the study. All subjects were
instructed to be adequately hydrated and to refrain from
consuming alcohol, caffeine and exercise for 24 h, and food for
3 h before the test. All procedures were approved by the Ethical
Committee of the Hospital District of South-Western Finland and
conducted in accordance with the Declaration of Helsinki.
Study DesignThe present study consisted of baseline measurements, 10-min
warm-up, high intensity cycling to exhaustion, 1-min of recovery
followed by cycling at 75% of peak oxygen uptake and post-
exercise measurements. Figure 1 illustrates the study design with
all time points of measurements.
The baseline measurements included the assessment of anthro-
pometric characteristics, blood sampling in supine position with
basic hemogram as final check of the subjects’ hematological
health, the fitting and measurement of the compression-shorts, and
PET-scanning for muscle blood flow. The high intensity exercise
protocol consisted of 10 min cycling at 100 W (warm-up) which
was immediately followed by a ramp test to exhaustion (+25 W/
min) in order to measure the peak power output and peak oxygen
uptake. After 1 min of passive recovery the subjects continued to
cycle at 75% of peak oxygen uptake. The 10-min warm-up,
followed by the high intensity exercise protocol together with the
passive 1-min recovery and cycling at 75% of peak oxygen uptake
altogether lasted 30 min Venous blood was sampled after the
warm-up, 1 min after the termination of the ramp test, and at the
end of the 30-min exercise protocol (at 30 min). Post-exercise
measurements included blood sampling as well as PET-scanning
for muscle blood flow and glucose uptake.
Measurement of Muscle Blood Flow and Glucose UptakeBefore any measurements two catheters were inserted, one into
an antecubital vein for saline infusion and injection of tracer, and
another into the opposite radial artery for blood sampling.
Thereafter, the subjects were fastened to the PET scanner [20]
and the scanning area (thigh) was carefully marked on the skin in
order to secure the same scanning position each time. After the
transmission scan for photon attenuation correction an intrave-
nous injection of 15O-H2O (772655 MBq) was given immediately
followed by a dynamic PET scanning (6 min) for measuring
muscle blood flow. Immediately after the exercise protocol, the
subject was positioned to the same position in the PET scanner
and muscle blood flow was measured 10 min after the cessation of
exercise in similar manner as explained above. Muscle glucose
uptake was measured only during recovery using 18F-FDG (2-
[(18)F]fluoro-2-deoxy-D-glucose) tracer (185613 MBq) which was
given 20 min after the cessation of exercise and followed by a PET
scan for 25 min. The positron-emitting tracers, 15O-H2O and 18F-
FDG, were produced as previously described [21,22].
An ECAT EXACT HR+ scanner (Siemens/CTI, Knoxville,
TN) was used for emission scanning. The scanning area was over
both thighs thus including most part of thigh muscles. All PET
data were collected and processed as previously described [20,23–
25]. Blood flow was calculated using an autoradiographic method
as mentioned earlier [20,25]. Muscle glucose uptake was analysed
using the fitting method by Patlak [26].
Regions of InterestRegions of interest (ROIs) surrounding the extensors of the
femoral muscles (m. quadriceps femoris, QF) and posterial part of
the thigh muscles (m. biceps femoris, BF) were drawn into 20
subsequent cross-sectional planes in both thighs as previously
described [3]. Additionally two ROIs were drawn in QF muscle
and are defined as superficial (the superficial half of QF) and as
deep (the deeper half of QF).
Other Measurements and CalculationDuring the high intensity exercise protocol all subjects were
equipped with an portable breath-by-breath analyzer (Cortex
Metamax 3B, Leipzig, Germany) using standard algorithms with
dynamic account for the time delay between the gas consumption
and volume signal. The system was calibrated prior to each test
using calibration gas (15.8% O2, 5% CO2 in N; Praxair,
Germany), targeting the range of anticipated fractional gas
concentration, and a precision 3l syringe (Cortex, Leipzig,
Germany). The participants breathed through a Hans-Rudolph
mask and a turbine flow meter during all testing. A heart rate belt
(Polar S31, 1 Hz) was linked to the portable breath-by-breath
system and time aligned with the respiratory data.
Compression ClothingDuring baseline and recovery from high intensity exercise all
subjects wore compression shorts extending from above the hip to
above the knee (Sigvaris, Winterhur, Switzerland; 94% Polyamide
and 6% Lycra), while the cycling exercise was performed without
any compression. The garments were custom-made and fitted to
previously measured thigh girth. At baseline one of the trouser-legs
(left or right) was cut distally from the participants’ knee up to
femoral bone neck in order to induce zero pressure on the thigh
Table 1. Study subject characteristics.
IDBody mass[kg]
Stature[cm]
Age[years] VO2peak [ml/min/kg]
1 80 191 22 55
2 68 180 20 64
3 72 174 24 47
4 72 180 21 52
5 74 190 21 56
6 68 176 26 51
Mean6SD 7264 18167 2262 5466
doi:10.1371/journal.pone.0060923.t001
Muscle Metabolism and Compression Clothing
PLOS ONE | www.plosone.org 2 April 2013 | Volume 8 | Issue 4 | e60923

(non-compression). On the other leg (compression) the mean
pressure on four sites of the thigh at its maximum girth was aimed
to be 35 mmHg. The level of compression applied to each
individual was pre-checked before each test five times, according
to international recommendations [27]. For this a pneumatic
sensor (SIGaTH, Ganzoni, St. Gallen, Switzerland) was used to
receive the in-vivo pressure dimensions as described previously
[28]. Compression was applied to one of each subjects’ legs. The
application of compression and non-compression to either the left
or right leg was randomly chosen. The cycling exercise was
performed without any compression.
Statistical AnalysesAll data were calculated with conventional procedures and
presented as mean values and standard deviation (SD). All data
were checked for normality as well, with no necessity for further
transformation. ANOVA for repeated measurements was per-
formed to test the significance of differences between the clothing
conditions (i.e., with or without compression) and the point of
measurement (i.e. baseline or recovery). After detection of global
significance a Fisher post hoc procedure was employed. An alpha
level of P,0.05 was considered to be statistically significant. Effect
sizes from the various outcome measures were calculated using
Cohen’s d for the detection of the practical application and
meaningfulness of the findings. According to standard practice
thresholds, for small, medium and large were defined as 0.20, 0.50
and 0.80, respectively [29]. All analyses were carried out with the
Statistica software package for WindowsH (version 7.1, StatSoft
Inc., Tulsa, OK, U.S.A).
Results
The mean pressure at the compression over the thigh muscle
was 36.764.1 mmHg. The regional pressure values are illustrated
in Table 2.
The mean peak power output for all subjects during the ramp
test was 350622 W with a corresponding peak oxygen uptake of
39136434 ml/min (54.165.7 ml/kg/min). This high intensity
effort resulted in peak levels of plasma lactate of 11.262.0 mmol/
l.
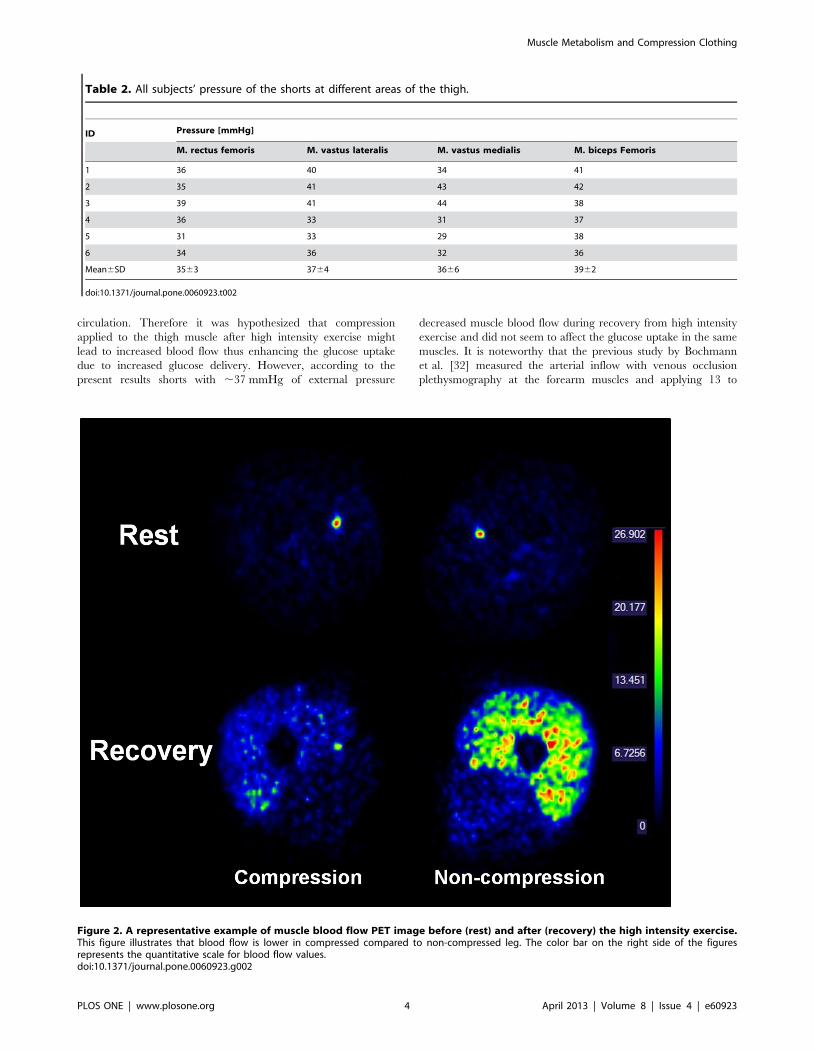
A representative example of muscle blood flow PET image before
(rest) and after (recovery) the high intensity exercise is illustrated in
Figure 2. At baseline blood flow in QF was unchanged with
compression compared to the non-compressed leg (P = 0.79; effect
size = 0.49) (Figure 3). No differences were detected between
compression and non-compression in BF (P = 0.90; effect
size = 0.50). During recovery muscle blood flow was higher
compared to baseline in both compressed (P = 0.002; effect
size = 3.16) and non-compressed QF (P,0.001; effect size = 3.94)
but not in compressed (P = 0.41; effect size = 2.15) and non-
compressed BF (P = 0.05; effect size = 2.74). In addition, during
recovery blood flow was lower in compressed QF (P,0.001; effect
size = 1.55) but not in BF (P = 0.26; effect size = 1.19) when
compared to same muscles in the non-compressed leg (Figure 3).
During baseline and recovery no differences in blood flow were
detected between the superficial and deep parts of QF in both,
compressed (baseline P = 0.79; recovery P = 0.68) and non-com-
pressed leg (baseline P = 0.64; recovery P = 0.06).
During recovery muscle glucose uptake was higher in QF
compared to BF in both conditions (compressed leg P,0.01, effect
size = 2.85 and non-compressed leg P,0.01, effect size = 4.19)
(Figure 4). However, in both QF (P = 0.88, effect size = 0.09) and
BF (P = 0.70, effect size = 0.49) no difference was observed in
glucose uptake between the compressed and non-compressed
thigh. Glucose uptake was higher in the deep compared to the
superficial parts of QF in both conditions (Table 3) (compression
leg P = 0.02, effect size = 0.33; non-compression leg P = 0.02, effect
size = 0.78).
Discussion
The present results show that skeletal muscle blood flow is
higher during the acute phase of recovery from high intensity
exercise (,15 min post exercise) when compared to baseline levels
in m. quadriceps femoris but not in m. biceps femoris. When
applying ,37 mmHg external compression to the thigh muscle,
blood flow during recovery is decreased but glucose uptake seems
to be unchanged.
Earlier investigations have shown that compression garments
appear to enhance blood flow in the venous system [30,31] and
increase arterial inflow [32], resulting in improved peripheral
Figure 1. Study design. A schematic illustration with all time points of measurements.doi:10.1371/journal.pone.0060923.g001
Muscle Metabolism and Compression Clothing
PLOS ONE | www.plosone.org 3 April 2013 | Volume 8 | Issue 4 | e60923
circulation. Therefore it was hypothesized that compression
applied to the thigh muscle after high intensity exercise might
lead to increased blood flow thus enhancing the glucose uptake
due to increased glucose delivery. However, according to the
present results shorts with ,37 mmHg of external pressure
decreased muscle blood flow during recovery from high intensity
exercise and did not seem to affect the glucose uptake in the same
muscles. It is noteworthy that the previous study by Bochmann
et al. [32] measured the arterial inflow with venous occlusion
plethysmography at the forearm muscles and applying 13 to
Table 2. All subjects’ pressure of the shorts at different areas of the thigh.
ID Pressure [mmHg]
M. rectus femoris M. vastus lateralis M. vastus medialis M. biceps Femoris
1 36 40 34 41
2 35 41 43 42
3 39 41 44 38
4 36 33 31 37
5 31 33 29 38
6 34 36 32 36
Mean6SD 3563 3764 3666 3962
doi:10.1371/journal.pone.0060923.t002
Figure 2. A representative example of muscle blood flow PET image before (rest) and after (recovery) the high intensity exercise.This figure illustrates that blood flow is lower in compressed compared to non-compressed leg. The color bar on the right side of the figuresrepresents the quantitative scale for blood flow values.doi:10.1371/journal.pone.0060923.g002
Muscle Metabolism and Compression Clothing
PLOS ONE | www.plosone.org 4 April 2013 | Volume 8 | Issue 4 | e60923

23 mmHg of compression. Therefore the conflicting data when
compared to our results may result from the different test
procedures, the lower level of compression and the different
muscles involved.
While lying horizontal the application of 15 mmHg on an
inactive muscle diminishes the cross-sectional area of the venous
systems by 80% (from 2.65 cm2 to 0.53 cm2) and improves mean
linear blood flow velocity 5-fold [12]. The reduction in the cross
sectional area due to external pressure is proposed to compress
superficial limb tissues, thereby compressing underlying veins, and
by this reduce pooling [17]. Accordingly, the applied compression
is assumed to reduce the transmural pressure in local arterioles
[33] thereby leading to vasodilatation by myogenic regulation [34]
and increases in blood flow in underlying tissue [32]. Although it is
obvious that the cross sectional area of the thigh was reduced
during compression (not determined, but please see Figure 2), our
data obtained during the acute phase of recovery from high
intensity exercise do not support the hypothesis that the
compression shorts of ,37 mmHg improves blood flow during
recovery from high-intensity exercise.
In exercise science, there exists no common consent on the level
and type of compression to enhance performance and recovery
[17,18]. In the medical field however, several classes of compres-
sion hosiery are recommended ranging from moderate (Class I:
18–21 mmHg), medium (Class II: 23–32 mmHg), strong (Class
III: 34–46 mmHg) to very strong (Class IV: .49 mmHg) [35]. In
the present study we applied a pressure of ,37 mmHg to the
muscle’s belly which would be equivalent to a class III pressure.
Based on the findings of a recent review the mean pressure in
recovery related exercise studies ranged from 10–30 mmHg
[11,36–38]. Thus, the pressure applied in the present study is
higher compared to other recovery studies. Based on the present
data the external compression of the thigh muscle at this pressure
seems to lead to a mechanical hindrance in muscle blood flow.
This is supported by earlier investigations which have shown that
during static muscle contractions (.10% of maximal voluntary
contraction force) blood flow is impaired and thereby affects
muscle oxygen delivery [39]. In addition, we observed that muscle
blood flow was also decreased in the deeper parts of QF muscle.
Thus, compressions garments applying an external pressure level
of ,37 mmHg affects the muscle blood flow not only in superficial
but also in the deeper parts of the muscle tissue.
Previous research describes several mechanisms on the function
of compression textiles for recovery purposes. Muscle swelling
[40,41] may arise after high-intensity exercise due to structural
damage to the muscles’ contractile elements accompanied with
inflammatory response [40] and elevated tissue osmotic pressure
[42] finally resulting in edema [42]. The application of compres-
sion is thus supposed to reduce exercise-induced edema by
stimulating lymphatic outflow and transporting fluid from the
Figure 3. Skeletal muscle blood flow. M. quadriceps femoris(above) and m. biceps femoris (below) without (non-compression) andwith compression (compression) during baseline and recovery fromhigh intensity exercise (*indicates statistical significant differencesP,0.05).doi:10.1371/journal.pone.0060923.g003
Figure 4. Glucose uptake. M. quadriceps femoris (above) and m.biceps femoris (below) without and with compression during recoveryfrom high intensity exercise.doi:10.1371/journal.pone.0060923.g004
Muscle Metabolism and Compression Clothing
PLOS ONE | www.plosone.org 5 April 2013 | Volume 8 | Issue 4 | e60923

muscles’ interstitium back into the circulation [42,43]. However
the present findings do not support this, since decreased blood flow
in the muscle tissue was observed in the compressed QF muscle
during recovery from high intensity exercise. One potential
explanation for the mixed findings is that the exposure to
compression may not have been long enough, since some studies
evidence changes in muscle damage markers [9,10,38,42,44] and
further performance indicators such as strength and power
measures 24 and 48 h after high intensity exercise [10,11,37].
One of the most novel aspects of the present study is that, under
the applied conditions, muscle glucose uptake remains unchanged
despite reduced blood flow during the recovery from high intensity
exercise. Glucose uptake is a complex process and depends mainly
on the GLUT-4 glucose transporter concentration [45] and the
glucose phosphorylation level in the muscle cell [46] but also on
the glucose delivery to the working muscles [1,46]. In this context
it has been shown that plasma glucose concentration is highest
,40 min after exercise at 65% peak O2 consumption [47] and
that glucose uptake in QF is higher at 75% VO2peak compared to
cycling at 30% and 55% of VO2peak [48]. During exercise
hyperemia increases muscle capillary blood flow significantly
[46,49], and thereby leads to a higher glucose delivery to the
working muscle. This hemodynamic effect favors the uptake of
glucose. However, the present data indicates that glucose delivery
was decreased during recovery from high intensity exercise when
wearing compression shorts due to reduced muscle blood flow.
Accordingly, while the absolute amount of glucose extracted
remains unchanged, the extraction of glucose from blood must be
increased relative to its delivery. Indeed, it has been shown that the
level of glucose extraction during low intensity exercise is rather
low (,15–20%) [50] specifying a relatively large reserve to
increase glucose uptake without any increase in delivery.
Therefore, unchanged glucose uptake due to compression
indicates that the glucose uptake is not affected by the use of
compression clothing during recovery from high intensity exercise.
However, glucose uptake was higher in the deeper parts of the QF
muscle. This finding is well in line with other findings [51] showing
during dynamic knee-extension exercise that glucose uptake was
higher in m. vastus intermedius and m. vastus medialis compared
to m. vastus lateralis and m. rectus femoris.
From a methodological point of view the number of subjects in
the present study was relative small but in the range of studies in
this area [48,52]. Therefore, more subjects would have given more
statistical power for the data interpretation. However, the results
especially for blood flow (Figure 3) and glucose uptake (Figure 4)
were nearly identical in all subjects. In this case, from an ethical
point of view, we refrained from recruiting additional subjects.
Finally, in addition to the statistical analysis, we performed effect
size calculation which supported in interpreting our data.
In conclusion, there are two novel findings in the present study.
First, this study demonstrates that wearing compression shorts with
,37 mmHg of external pressure reduces blood flow both in the
deep as well as superficial regions of muscle tissue during the acute
recovery phase from high intensity exercise. Second, muscle
glucose uptake was unchanged and thus independent from blood
flow. We therefore conclude that wearing compression shorts with
,37 mmHg during recovery from high intensity exercise does not
elevate muscle blood flow and therefore does not lead to a greater
delivery of energy substrates or enhanced muscle glucose uptake
when compared to non-compression clothing.
Acknowledgments
The authors would like to thank the Turku PET Centre’s personnel for
their support during the study.
Author Contributions
Conceived and designed the experiments: BS DPB KK KKK MSL.
Performed the experiments: BS DPB KK KKK MSL. Analyzed the data:
BS DPB KK KKK MSL. Contributed reagents/materials/analysis tools:
BS DPB KK KKK MSL. Wrote the paper: BS DPB KK KKK MSL.
References
1. Radegran G (1997) Ultrasound Doppler estimates of femoral artery blood flow
during dynamic knee extensor exercise in humans. J Appl Physiol 83: 1383–
1388.
2. Radegran G, Saltin B (1998) Muscle blood flow at onset of dynamic exercise in
humans. Am J Physiol 274: H314–322.
3. Kalliokoski KK, Kemppainen J, Larmola K, Takala TO, Peltoniemi P, et al.
(2000) Muscle blood flow and flow heterogeneity during exercise studied with
positron emission tomography in humans. Eur J Appl Physiol 83: 395–401.
4. Laaksonen MS, Kivela R, Kyrolainen H, Sipila S, Selanne H, et al. (2006)
Effects of exhaustive stretch-shortening cycle exercise on muscle blood flow
during exercise. Acta Physiol (Oxf) 186: 261–270.
5. Viru A (1996) Postexercise recovery period: carbohydrate and protein
metabolism. Scand J Med Sci Sports 6: 2–14.
6. Choi D, Cole KJ, Goodpaster BH, Fink WJ, Costill DL (1994) Effect of passive
and active recovery on the resynthesis of muscle glycogen. Med Sci Sports Exerc
26: 992–996.
7. Doan BK, Kwon YH, Newton RU, Shim J, Popper EM, et al. (2003) Evaluation
of a lower-body compression garment. J Sports Sci 21: 601–610.
Table 3. Skeletal muscle blood flow and glucose uptake in superficial and deep parts of m. quadriceps femoris (n.d. = notdetermined).
Baseline Recovery
Compression Non-compression P d Compression Non-compression P d
Blood flow [mL/100 g/min]
Superficial 1.260.4 1.460.6 0.92 0.55 5.162.4 9.864.2 0.05 1.94
Deep 1.560.6 2.060.9 0.82 0.92 5.762.8 12.465.2 0.01 2.27
Glucose uptake [mmol/kg/min]
Superficial n.d. n.d. 55.3615.8 56.8615.6 0.96 0.14
Deep n.d. n.d. 70.4627.5 71.2622.9 0.93 0.04
doi:10.1371/journal.pone.0060923.t003
Muscle Metabolism and Compression Clothing
PLOS ONE | www.plosone.org 6 April 2013 | Volume 8 | Issue 4 | e60923

8. Bringard A, Perrey S, Belluye N (2006) Aerobic energy cost and sensation
responses during submaximal running exercise - positive effects of wearing
compression tights. Int J Sports Med 27: 373–378.
9. Gill ND, Beaven CM, Cook C (2006) Effectiveness of post-match recovery
strategies in rugby players. Br J Sports Med 40: 260–263.
10. Kraemer WJ, Flanagan SD, Comstock BA, Fragala MS, Earp JE, et al. (2010)
Effects of a whole body compression garment on markers of recovery after a
heavy resistance workout in men and women. J Strength Cond Res 24: 804–814.
11. Jakeman JR, Byrne C, Eston RG (2010) Lower limb compression garment
improves recovery from exercise-induced muscle damage in young, active
females. Eur J Appl Physiol 109: 1137–1144.
12. Litter J (1952) Thromboembolism; its prophylaxis and medical treatment; recent
advances. Medical Clinics of North America 36: 1309–1321.
13. Agu O, Hamilton G, Baker D (1999) Graduated compression stockings in the
prevention of venous thromboembolism. Br J Surg 86: 992–1004.
14. Dascombe BJ, Hoare TK, Sear JA, Reaburn PR, Scanlan AT (2011) The effects
of wearing undersized lower-body compression garments on endurance running
performance. Int J Sports Physiol Perform 6: 160–173.
15. Berry MJ, McMurray RG (1987) Effects of graduated compression stockings on
blood lactate following an exhaustive bout of exercise. Am J Phys Med 66: 121–
132.
16. Chatard JC, Atlaoui D, Farjanel J, Louisy F, Rastel D, et al. (2004) Elastic
stockings, performance and leg pain recovery in 63-year-old sportsmen.
Eur J Appl Physiol 93: 347–352.
17. MacRae BA, Cotter JD, Laing RM (2011) Compression garments and exercise:
garment considerations, physiology and performance. Sports Med 41: 815–843.
18. Born DP, Sperlich B, Holmberg HC (2012) Bringing Light into the Dark: Effects
of Compression Clothing on Performance and Recovery. Int J Sports Physiol
Perform: in Press.
19. Nuutila P, Kalliokoski K (2000) Use of positron emission tomography in the
assessment of skeletal muscle and tendon metabolism and perfusion. Scand J Med
Sci Sports 10: 346–350.
20. Laaksonen MS, Kalliokoski KK, Kyrolainen H, Kemppainen J, Teras M, et al.
(2003) Skeletal muscle blood flow and flow heterogeneity during dynamic and
isometric exercise in humans. American Journal of Physiology-Heart and
Circulatory Physiology 284: H979–H986.
21. Hamacher K, Coenen HH, Stocklin G (1986) Efficient stereospecific synthesis of
no-carrier-added 2-[18F]-fluoro-2-deoxy-D-glucose using aminopolyether sup-
ported nucleophilic substitution. J Nucl Med 27: 235–238.
22. Sipila H, Clark JC, Peltola O, Teras M (2001) An automatic [15O]H2O
production system for heart and brain studies. J Labelled Compd Rad 44: 1066–
1068.
23. Nuutila P, Raitakari M, Laine H, Kirvela O, Takala T, et al. (1996) Role of
blood flow in regulating insulin-stimulated glucose uptake in humans. Studies
using bradykinin, [15O]water, and [18F]fluoro-deoxy-glucose and positron
emission tomography. J Clin Invest 97: 1741–1747.
24. Alenius S, Ruotsalainen U (1997) Bayesian image reconstruction for emission
tomography based on median root prior. Eur J Nucl Med 24: 258–265.
25. Ruotsalainen U, Raitakari M, Nuutila P, Oikonen V, Sipila H, et al. (1997)
Quantitative blood flow measurement of skeletal muscle using oxygen-15-water
and PET. J Nucl Med 38: 314–319.
26. Patlak CS, Blasberg RG (1985) Graphical evaluation of blood-to-brain transfer
constants from multiple-time uptake data. Generalizations. J Cereb Blood Flow
Metab 5: 584–590.
27. Partsch H, Clark M, Bassez S, Benigni JP, Becker F, et al. (2006) Measurement
of lower leg compression in vivo: recommendations for the performance of
measurements of interface pressure and stiffness: consensus statement. Dermatol
Surg 32: 224–232; discussion 233.
28. Gaied I, Drapier S, Lun B (2006) Experimental assessment and analytical 2D
predictions of the stocking pressures induced on a model leg by Medical
Compressive Stockings. J Biomech 39: 3017–3025.
29. Cohen J (1988) Statistical power analysis for the behavioral sciences. Hillsdale,
NJ [u.a.]: Erlbaum. XXI, 567 S. p.
30. Ibegbuna V, Delis KT, Nicolaides AN, Aina O (2003) Effect of elastic
compression stockings on venous hemodynamics during walking. Journal ofVascular Surgery 37: 420–425.
31. Agu O, Baker D, Seifalian AM (2004) Effect of graduated compression stockings
on limb oxygenation and venous function during exercise in patients with venousinsufficiency. Vascular 12: 69–76.
32. Bochmann RP, Seibel W, Haase E, Hietschold V, Rodel H, et al. (2005)External compression increases forearm perfusion. J Appl Physiol 99: 2337–
2344.
33. Lundvall J, Lanne T (1989) Transmission of externally applied negative pressureto the underlying tissue. A study on the upper arm of man. Acta Physiol Scand
136: 403–409.34. Folkow B (1989) Myogenic mechanisms in the control of systemic resistance.
Introduction and historical background. J Hypertens Suppl 7: S1–4.35. Rabe E, Phlebology IUo (2009) Compression Guide: Rabe Med. Publ.
36. Duffield R, Cannon J, King M (2010) The effects of compression garments on
recovery of muscle performance following high-intensity sprint and plyometricexercise. J Sci Med Sport 13: 136–140.
37. Jakeman JR, Byrne C, Eston RG (2010) Efficacy of lower limb compression andcombined treatment of manual massage and lower limb compression on
symptoms of exercise-induced muscle damage in women. J Strength Cond Res
24: 3157–3165.38. Davies V, Thompson KG, Cooper SM (2009) The effects of compression
garments on recovery. J Strength Cond Res 23: 1786–1794.39. Sjogaard G, Savard G, Juel C (1988) Muscle blood flow during isometric activity
and its relation to muscle fatigue. Eur J Appl Physiol Occup Physiol 57: 327–335.
40. Armstrong RB (1984) Mechanisms of exercise-induced delayed onset muscular
soreness: a brief review. Med Sci Sports Exerc 16: 529–538.41. Friden J, Sfakianos PN, Hargens AR (1986) Muscle soreness and intramuscular
fluid pressure: comparison between eccentric and concentric load. J Appl Physiol61: 2175–2179.
42. Kraemer WJ, Bush JA, Wickham RB, Denegar CR, Gomez AL, et al. (2001)
Continuous Compression as an Effective Therapeutic Intervention in TreatingEccentric-Exercise-Induced Muscle Soreness. J Sport Rehabil 10: 11–23.
43. Burnand K, Clemenson G, Morland M, Jarrett PE, Browse NL (1980) Venouslipodermatosclerosis: treatment by fibrinolytic enhancement and elastic
compression. Br Med J 280: 7–11.44. Kraemer WJ, Bush JA, Wickham RB, Denegar CR, Gomez AL, et al. (2001)
Influence of compression therapy on symptoms following soft tissue injury from
maximal eccentric exercise. J Orthop Sports Phys Ther 31: 282–290.45. Green HJ, Bombardier E, Duhamel TA, Stewart RD, Tupling AR, et al. (2008)
Metabolic, enzymatic, and transporter responses in human muscle during threeconsecutive days of exercise and recovery. Am J Physiol Regul Integr Comp
Physiol 295: R1238–1250.
46. Wasserman DH, Kang L, Ayala JE, Fueger PT, Lee-Young RS (2011) Thephysiological regulation of glucose flux into muscle in vivo. J Exp Biol 214: 254–
262.47. Tarnopolsky MA, Bosman M, Macdonald JR, Vandeputte D, Martin J, et al.
(1997) Postexercise protein-carbohydrate and carbohydrate supplements in-crease muscle glycogen in men and women. J Appl Physiol 83: 1877–1883.
48. Fujimoto T, Kemppainen J, Kalliokoski KK, Nuutila P, Ito M, et al. (2003)
Skeletal muscle glucose uptake response to exercise in trained and untrainedmen. Med Sci Sports Exerc 35: 777–783.
49. Korthuis RJ (2011) Skeletal Muscle Circulation. San Rafael (CA).50. Laaksonen MS, Kemppainen J, Kyrolainen H, Knuuti J, Nuutila P, et al. (2013)
Regional differences in blood flow, glucose uptake and fatty acid uptake within
quadriceps femoris muscle during dynamic knee-extension exercise. Eur J ApplPhysiol 2013 Feb 17. [Epub ahead of print].
51. Kalliokoski KK, Boushel R, Langberg H, Scheede-Bergdahl C, Ryberg AK, etal. (2011) Differential glucose uptake in quadriceps and other leg muscles during
one-legged dynamic submaximal knee-extension exercise. Front Physiol 2: 75.
52. Laaksonen MS, Kalliokoski KK, Kyrolainen H, Kemppainen J, Teras M, et al.(2003) Skeletal muscle blood flow and flow heterogeneity during dynamic and
isometric exercise in humans. Am J Physiol Heart Circ Physiol 284: H979–986.
Muscle Metabolism and Compression Clothing
PLOS ONE | www.plosone.org 7 April 2013 | Volume 8 | Issue 4 | e60923