comprehensive study of human external exposure to ... · triphenyl phosphate (tphp) via dust...
TRANSCRIPT
Comprehensive Study of Human External Exposure toOrganophosphate Flame Retardants via Air, Dust, and Hand Wipes:The Importance of Sampling and Assessment StrategyFuchao Xu,*,† Georgios Giovanoulis,‡ Sofie van Waes,† Juan Antonio Padilla-Sanchez,§
Eleni Papadopoulou,§ Jorgen Magner,‡ Line Smastuen Haug,§ Hugo Neels,† and Adrian Covaci*,†
†Toxicological Centre, University of Antwerp, Universiteitsplein 1, 2610 Wilrijk, Belgium‡IVL Swedish Environmental Research Institute, SE-100 31 Stockholm, Sweden§Division of Environmental Medicine, Norwegian Institute of Public Health, Lovisenberggata 8, Oslo N-0403, Norway
*S Supporting Information
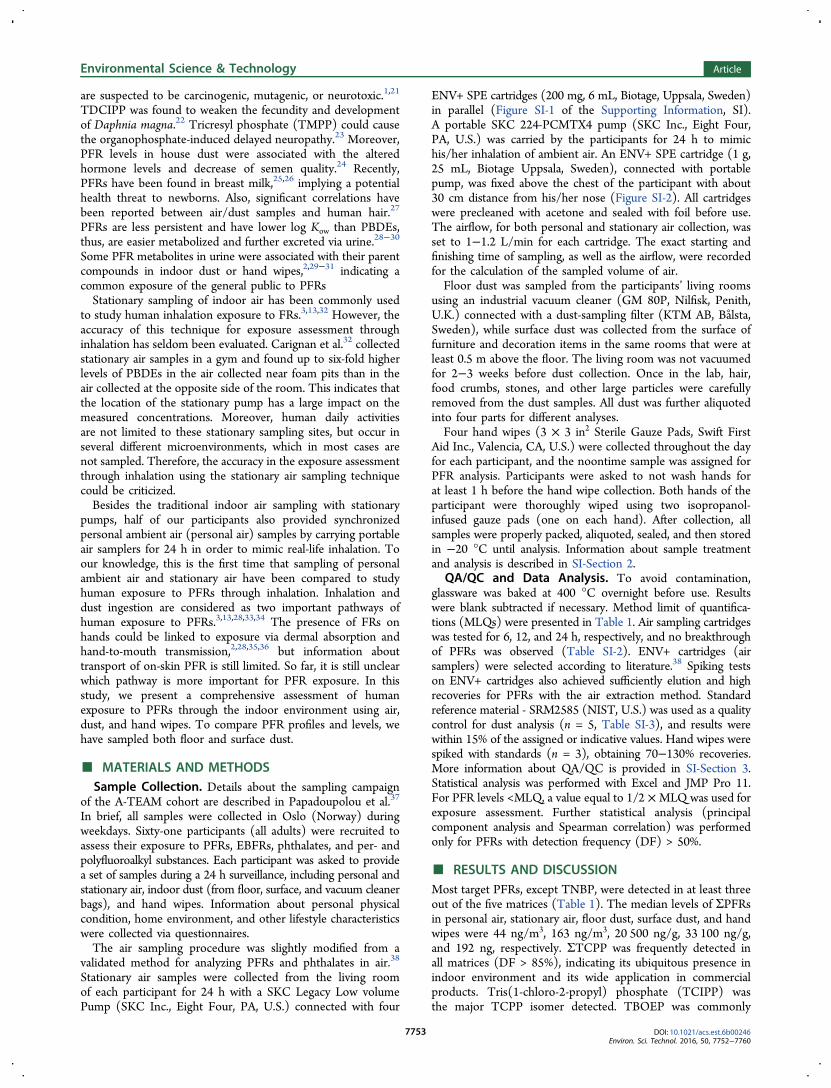
ABSTRACT: We compared the human exposure to organophosphate flame retardants(PFRs) via inhalation, dust ingestion, and dermal absorption using different sampling andassessment strategies. Air (indoor stationary air and personal ambient air), dust (floor dustand surface dust), and hand wipes were sampled from 61 participants and their houses.We found that stationary air contains higher levels of ΣPFRs (median = 163 ng/m3, IQR =161 ng/m3) than personal air (median = 44 ng/m3, IQR = 55 ng/m3), suggesting that thestationary air sample could generate a larger bias for inhalation exposure assessment.Tris(chloropropyl) phosphate isomers (ΣTCPP) accounted for over 80% of ΣPFRs inboth stationary and personal air. PFRs were frequently detected in both surface dust(ΣPFRs median = 33 100 ng/g, IQR = 62 300 ng/g) and floor dust (ΣPFRs median =20 500 ng/g, IQR = 30 300 ng/g). Tris(2-butoxylethyl) phosphate (TBOEP) accountedfor 40% and 60% of ΣPFRs in surface and floor dust, respectively, followed by ΣTCPP(30% and 20%, respectively). TBOEP (median = 46 ng, IQR = 69 ng) and ΣTCPP(median = 37 ng, IQR = 49 ng) were also frequently detected in hand wipe samples. Forthe first time, a comprehensive assessment of human exposure to PFRs via inhalation, dust ingestion, and dermal absorption wasconducted with individual personal data rather than reference factors of the general population. Inhalation seems to be the majorexposure pathway for ΣTCPP and tris(2-chloroethyl) phosphate (TCEP), while participants had higher exposure to TBOEP andtriphenyl phosphate (TPHP) via dust ingestion. Estimated exposure to ΣPFRs was the highest with stationary air inhalation(median =34 ng·kg bw−1·day−1, IQR = 38 ng·kg bw−1·day−1), followed by surface dust ingestion (median = 13 ng·kg bw−1·day−1,IQR = 28 ng·kg bw−1·day−1), floor dust ingestion and personal air inhalation. The median dermal exposure on hand wipes was0.32 ng·kg bw−1·day−1 (IQR = 0.58 ng·kg bw−1·day−1) for ΣTCPP. The selection of sampling and assessment strategies couldsignificantly affect the results of exposure assessment.
■ INTRODUCTION
Flame retardants (FRs) are commonly added to constructionmaterials and consumer products to fulfill fire safety criteria andregulations of different countries.1−3 Polybrominated diphenylethers (PBDEs) were well-known and widely used FRs. Due totheir persistency and toxicity, PBDEs are phased out gradually.2,4
Stockholm Convention has listed Penta-BDE and Octa-BDEcommercial mixtures in Annex A as substances of elimination,5,6
while the proposal of listing Deca-BDE is under review. Recently,many alternative FRs, including dechlorane plus (DP), emergingbrominated flame retardants (EBFRs), and organophosphateflame retardants (PFRs), are replacing the market-share ofPBDEs. PFRs are widely used as FRs in textiles, plastics, foams,lubricants, paints, and so forth.1 They accounted for about 11.5%of world consumption of FRs (200 000 tones, 800 million USDby value), while, in the EU, PFRs accounted for 20% of total FRconsumption in 2006.1,7 Some PFRs, like triphenyl phosphate(TPHP), are also used as plasticizers and in nail polish, while
tris(2-butoxyethyl) phosphate (TBOEP) has been used in floorwax.1,8 2-Ethylhexyl diphenyl phosphate could be found in PVC,rubber, photo films, paints, pigment dispersions, adhesives, textile,cable coatings, and food packaging.9 As FRs are usually used asadditives in commercial products, they can be emitted from thetreated products, contaminating indoor and outdoor environ-ment.10−12 PFRs have been reported in air, dust, water, sediment,and soil. In the indoor environment, the PFR contamination levelsare comparable, or even higher, to PBDEs.3,4,11−16 Recently, lowlevels of PFRs have also been found in food and biota samples,17−20
which raise serious concerns of PFR pollution in environment.Some PFRs, such as tris(2-chloroethyl) phosphate (TCEP),
tris (1,3-dichloro-2-propyl) phosphate (TDCIPP) and TPHP,
Received: January 16, 2016Revised: June 26, 2016Accepted: June 28, 2016Published: June 28, 2016
Article
pubs.acs.org/est
© 2016 American Chemical Society 7752 DOI: 10.1021/acs.est.6b00246Environ. Sci. Technol. 2016, 50, 7752−7760
are suspected to be carcinogenic, mutagenic, or neurotoxic.1,21
TDCIPP was found to weaken the fecundity and developmentof Daphnia magna.22 Tricresyl phosphate (TMPP) could causethe organophosphate-induced delayed neuropathy.23 Moreover,PFR levels in house dust were associated with the alteredhormone levels and decrease of semen quality.24 Recently,PFRs have been found in breast milk,25,26 implying a potentialhealth threat to newborns. Also, significant correlations havebeen reported between air/dust samples and human hair.27
PFRs are less persistent and have lower log Kow than PBDEs,thus, are easier metabolized and further excreted via urine.28−30
Some PFR metabolites in urine were associated with their parentcompounds in indoor dust or hand wipes,2,29−31 indicating acommon exposure of the general public to PFRsStationary sampling of indoor air has been commonly used
to study human inhalation exposure to FRs.3,13,32 However, theaccuracy of this technique for exposure assessment throughinhalation has seldom been evaluated. Carignan et al.32 collectedstationary air samples in a gym and found up to six-fold higherlevels of PBDEs in the air collected near foam pits than in theair collected at the opposite side of the room. This indicates thatthe location of the stationary pump has a large impact on themeasured concentrations. Moreover, human daily activitiesare not limited to these stationary sampling sites, but occur inseveral different microenvironments, which in most cases arenot sampled. Therefore, the accuracy in the exposure assessmentthrough inhalation using the stationary air sampling techniquecould be criticized.Besides the traditional indoor air sampling with stationary
pumps, half of our participants also provided synchronizedpersonal ambient air (personal air) samples by carrying portableair samplers for 24 h in order to mimic real-life inhalation. Toour knowledge, this is the first time that sampling of personalambient air and stationary air have been compared to studyhuman exposure to PFRs through inhalation. Inhalation anddust ingestion are considered as two important pathways ofhuman exposure to PFRs.3,13,28,33,34 The presence of FRs onhands could be linked to exposure via dermal absorption andhand-to-mouth transmission,2,28,35,36 but information abouttransport of on-skin PFR is still limited. So far, it is still unclearwhich pathway is more important for PFR exposure. In thisstudy, we present a comprehensive assessment of humanexposure to PFRs through the indoor environment using air,dust, and hand wipes. To compare PFR profiles and levels, wehave sampled both floor and surface dust.
■ MATERIALS AND METHODSSample Collection. Details about the sampling campaign
of the A-TEAM cohort are described in Papadoupolou et al.37
In brief, all samples were collected in Oslo (Norway) duringweekdays. Sixty-one participants (all adults) were recruited toassess their exposure to PFRs, EBFRs, phthalates, and per- andpolyfluoroalkyl substances. Each participant was asked to providea set of samples during a 24 h surveillance, including personal andstationary air, indoor dust (from floor, surface, and vacuum cleanerbags), and hand wipes. Information about personal physicalcondition, home environment, and other lifestyle characteristicswere collected via questionnaires.The air sampling procedure was slightly modified from a
validated method for analyzing PFRs and phthalates in air.38
Stationary air samples were collected from the living roomof each participant for 24 h with a SKC Legacy Low volumePump (SKC Inc., Eight Four, PA, U.S.) connected with four
ENV+ SPE cartridges (200 mg, 6 mL, Biotage, Uppsala, Sweden)in parallel (Figure SI-1 of the Supporting Information, SI).A portable SKC 224-PCMTX4 pump (SKC Inc., Eight Four,PA, U.S.) was carried by the participants for 24 h to mimichis/her inhalation of ambient air. An ENV+ SPE cartridge (1 g,25 mL, Biotage Uppsala, Sweden), connected with portablepump, was fixed above the chest of the participant with about30 cm distance from his/her nose (Figure SI-2). All cartridgeswere precleaned with acetone and sealed with foil before use.The airflow, for both personal and stationary air collection, wasset to 1−1.2 L/min for each cartridge. The exact starting andfinishing time of sampling, as well as the airflow, were recordedfor the calculation of the sampled volume of air.Floor dust was sampled from the participants’ living rooms
using an industrial vacuum cleaner (GM 80P, Nilfisk, Penith,U.K.) connected with a dust-sampling filter (KTM AB, Balsta,Sweden), while surface dust was collected from the surface offurniture and decoration items in the same rooms that were atleast 0.5 m above the floor. The living room was not vacuumedfor 2−3 weeks before dust collection. Once in the lab, hair,food crumbs, stones, and other large particles were carefullyremoved from the dust samples. All dust was further aliquotedinto four parts for different analyses.Four hand wipes (3 × 3 in2 Sterile Gauze Pads, Swift First
Aid Inc., Valencia, CA, U.S.) were collected throughout the dayfor each participant, and the noontime sample was assigned forPFR analysis. Participants were asked to not wash hands forat least 1 h before the hand wipe collection. Both hands of theparticipant were thoroughly wiped using two isopropanol-infused gauze pads (one on each hand). After collection, allsamples were properly packed, aliquoted, sealed, and then storedin −20 °C until analysis. Information about sample treatmentand analysis is described in SI-Section 2.
QA/QC and Data Analysis. To avoid contamination,glassware was baked at 400 °C overnight before use. Resultswere blank subtracted if necessary. Method limit of quantifica-tions (MLQs) were presented in Table 1. Air sampling cartridgeswas tested for 6, 12, and 24 h, respectively, and no breakthroughof PFRs was observed (Table SI-2). ENV+ cartridges (airsamplers) were selected according to literature.38 Spiking testson ENV+ cartridges also achieved sufficiently elution and highrecoveries for PFRs with the air extraction method. Standardreference material - SRM2585 (NIST, U.S.) was used as a qualitycontrol for dust analysis (n = 5, Table SI-3), and results werewithin 15% of the assigned or indicative values. Hand wipes werespiked with standards (n = 3), obtaining 70−130% recoveries.More information about QA/QC is provided in SI-Section 3.Statistical analysis was performed with Excel and JMP Pro 11.For PFR levels <MLQ, a value equal to 1/2 ×MLQ was used forexposure assessment. Further statistical analysis (principalcomponent analysis and Spearman correlation) was performedonly for PFRs with detection frequency (DF) > 50%.
■ RESULTS AND DISCUSSIONMost target PFRs, except TNBP, were detected in at least threeout of the five matrices (Table 1). The median levels of ΣPFRsin personal air, stationary air, floor dust, surface dust, and handwipes were 44 ng/m3, 163 ng/m3, 20 500 ng/g, 33 100 ng/g,and 192 ng, respectively. ΣTCPP was frequently detected inall matrices (DF > 85%), indicating its ubiquitous presence inindoor environment and its wide application in commercialproducts. Tris(1-chloro-2-propyl) phosphate (TCIPP) wasthe major TCPP isomer detected. TBOEP was commonly
Environmental Science & Technology Article
DOI: 10.1021/acs.est.6b00246Environ. Sci. Technol. 2016, 50, 7752−7760
7753
detected in high concentrations in dust and hand wipes, butnot in air.
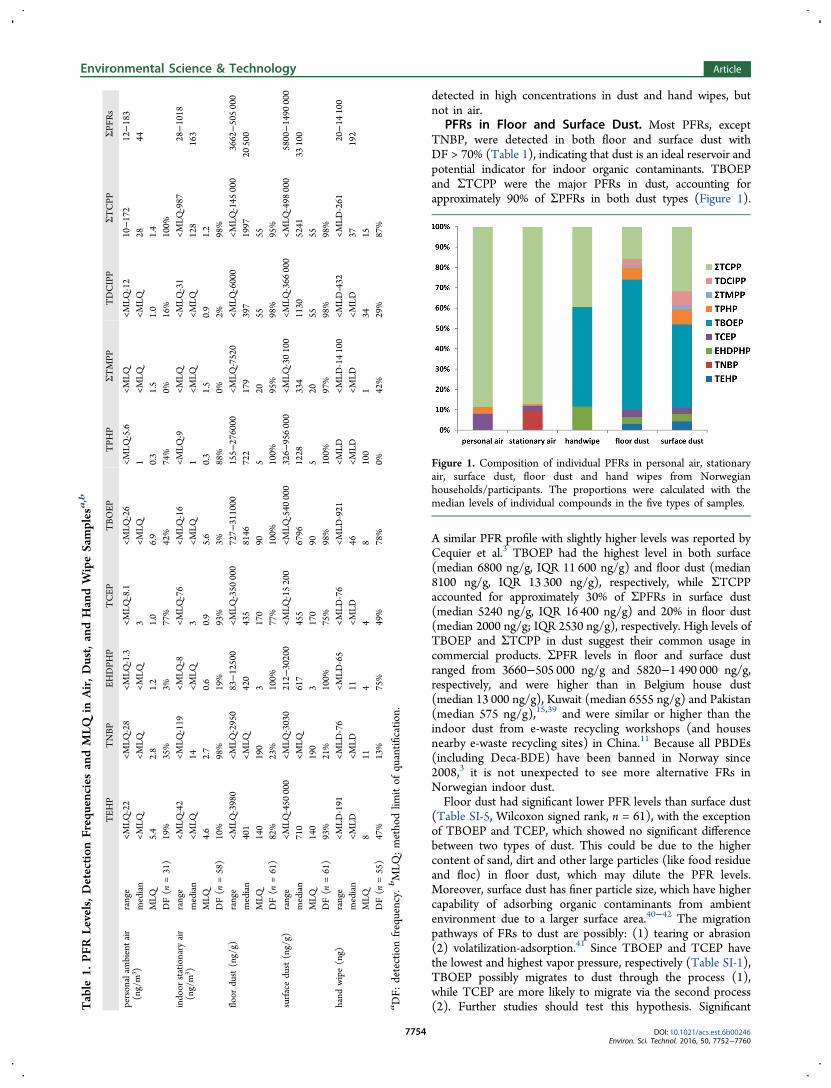
PFRs in Floor and Surface Dust. Most PFRs, exceptTNBP, were detected in both floor and surface dust withDF > 70% (Table 1), indicating that dust is an ideal reservoir andpotential indicator for indoor organic contaminants. TBOEPand ΣTCPP were the major PFRs in dust, accounting forapproximately 90% of ΣPFRs in both dust types (Figure 1).
A similar PFR profile with slightly higher levels was reported byCequier et al.3 TBOEP had the highest level in both surface(median 6800 ng/g, IQR 11 600 ng/g) and floor dust (median8100 ng/g, IQR 13 300 ng/g), respectively, while ΣTCPPaccounted for approximately 30% of ΣPFRs in surface dust(median 5240 ng/g, IQR 16 400 ng/g) and 20% in floor dust(median 2000 ng/g; IQR 2530 ng/g), respectively. High levels ofTBOEP and ΣTCPP in dust suggest their common usage incommercial products. ΣPFR levels in floor and surface dustranged from 3660−505 000 ng/g and 5820−1 490 000 ng/g,respectively, and were higher than in Belgium house dust(median 13 000 ng/g), Kuwait (median 6555 ng/g) and Pakistan(median 575 ng/g),15,39 and were similar or higher than theindoor dust from e-waste recycling workshops (and housesnearby e-waste recycling sites) in China.11 Because all PBDEs(including Deca-BDE) have been banned in Norway since2008,3 it is not unexpected to see more alternative FRs inNorwegian indoor dust.Floor dust had significant lower PFR levels than surface dust
(Table SI-5, Wilcoxon signed rank, n = 61), with the exceptionof TBOEP and TCEP, which showed no significant differencebetween two types of dust. This could be due to the highercontent of sand, dirt and other large particles (like food residueand floc) in floor dust, which may dilute the PFR levels.Moreover, surface dust has finer particle size, which have highercapability of adsorbing organic contaminants from ambientenvironment due to a larger surface area.40−42 The migrationpathways of FRs to dust are possibly: (1) tearing or abrasion(2) volatilization-adsorption.41 Since TBOEP and TCEP havethe lowest and highest vapor pressure, respectively (Table SI-1),TBOEP possibly migrates to dust through the process (1),while TCEP are more likely to migrate via the second process(2). Further studies should test this hypothesis. SignificantT
able
1.PFR
Levels,Detection
FrequenciesandMLQ
inAir,Dust,andHandWipeSamplesa,b
TEH
PTNBP
EHDPH
PTCEP
TBOEP
TPH
PΣT
MPP
TDCIPP
ΣTCPP
ΣPFR
s
personalam
bientair
(ng/m
3 )range
<MLQ
-22
<MLQ
-28
<MLQ
-1.3
<MLQ
-8.1
<MLQ
-26
<MLQ
-5.6
<MLQ
<MLQ
-12
10−172
12−183
median
<MLQ
<MLQ
<MLQ
3<M
LQ1
<MLQ
<MLQ
2844
MLQ
5.4
2.8
1.2
1.0
6.9
0.3
1.5
1.0
1.4
DF(n
=31)
19%
35%
3%77%
42%
74%
0%16%
100%
indoor
stationary
air
(ng/m
3 )range
<MLQ
-42
<MLQ
-119
<MLQ
-8<M
LQ-76
<MLQ
-16
<MLQ
-9<M
LQ<M
LQ-31
<MLQ
-987
28−1018
median
<MLQ
14<M
LQ3
<MLQ
1<M
LQ<M
LQ128
163
MLQ
4.6
2.7
0.6
0.9
5.6
0.3
1.5
0.9
1.2
DF(n
=58)
10%
98%
19%
93%
3%88%
0%2%
98%
floor
dust(ng/g)
range
<MLQ
-3980
<MLQ
-2950
83−12500
<MLQ
-350
000
727−
311000
155−
276000
<MLQ
-7520
<MLQ
-6000
<MLQ
-145
000
3662−505000
median
401
<MLQ
420
435
8146
722
179
397
1997
20500
MLQ
140
190
3170
905
2055
55DF(n
=61)
82%
23%
100%
77%
100%
100%
95%
98%
95%
surfacedust(ng/g)
range
<MLQ
-450
000
<MLQ
-3030
212−
30200
<MLQ
-15200
<MLQ
-540
000
326−
956000
<MLQ
-30100
<MLQ
-366
000
<MLQ
-498
000
5800−1490
000
median
710
<MLQ
617
455
6796
1228
334
1130
5241
33100
MLQ
140
190
3170
905
2055
55DF(n
=61)
93%
21%
100%
75%
98%
100%
97%
98%
98%
hand
wipe(ng)
range
<MLD
-191
<MLD
-76
<MLD
-65
<MLD
-76
<MLD
-921
<MLD
<MLD
-14100
<MLD
-432
<MLD
-261
20−14
100
median
<MLD
<MLD
11<M
LD46
<MLD
<MLD
<MLD
37192
MLQ
811
44
8100
134
15DF(n
=55)
47%
13%
75%
49%
78%
0%42%
29%
87%
aDF:
detectionfrequency.bMLQ
:methodlim
itof
quantifi
catio
n.
Figure 1. Composition of individual PFRs in personal air, stationaryair, surface dust, floor dust and hand wipes from Norwegianhouseholds/participants. The proportions were calculated with themedian levels of individual compounds in the five types of samples.
Environmental Science & Technology Article
DOI: 10.1021/acs.est.6b00246Environ. Sci. Technol. 2016, 50, 7752−7760
7754
underestimation would be seen for individual PFRs if theestimation of human exposure is based only on floor dust,especially for adults who are more likely to be exposed to surfacedust than floor dust.Significant differences were observed between the two types
of dust for TBOEP and ΣTCPP, but not for the other PFRs(Figure 1 and Table SI-5). Also Cequier et al.3 have reportedno differences in the ΣPFR levels between surface and floordust. Due to its dominance in stationary air, TCPP may havea higher absorption on finer particles that contributed to itsincreasing proportion in surface dust. As TCPP and TBOEPare the major components in the two types of dust, accountingfor over 70% of ΣPFR, selection of dust sampling would leadto different exposure profiles for these PFRs. We would suggestselecting different dusts for the exposure assessment of differentpopulations, e.g., floor dust for toddlers and surface dust foradults. For all frequently detected PFRs, positive and significantcorrelations were observed between floor and surface dust samplescollected from the same houses (Table 2), which suggests thatthe two types of dust refer to similar contamination sources.PFRs in Personal and Stationary Air. We compared
the stationary air sampling with the personal air sampling.Personal air was already used to assess the inhalation exposureto volatile PFASs of professional ski waxers.43 It was also usedto study the personal inhalation exposure to PBDEs andchlorinated PFRs.33,44 Personal pumps have constant flow,which might not completely mimic the variation of humanbreathing, but they lead to more accurate inhalation exposureassessment than the stationary sampling.Due to some sampling limitations (cartridge backpressure,
noise, four parallels cartridges per site, etc.), we had to uselower airflow (1.2 L/min air through each cartridge, 4.8 L/mintotal flow) for the stationary air sampling. Similar to personalair, no replicates were collected, since the portable pump onlyallowed a total flow of 1.2 L/min, and samples from only30 individuals were collected. Therefore, the MLQs for air sampleswere higher than that in Cequier et al.,3 who used a 12 L/minflow for stationary air sampling. Cequier et al.3 used PUF assampler, which gives lower backpressure than SPE cartridges,allowing higher sampling flows. However, the extraction of PUFsamplers was more time-consuming and laborious.Significantly higher PFR concentrations (Table 1 and
Table SI-5) were found in stationary air (median = 163 ng/m3,IQR = 161 ng/m3) than personal air (median = 44 ng/m3, IQR =55 ng/m3). ΣTCPP, TPHP, and TCEP were frequently detected
in both types of air samples (DF range: 74%−100%), whileΣTCPP was the predominant PFR (Figure 1). Median level ofΣTCPP in stationary air (median = 128 ng/m3, IQR = 175 ng/m3)was five folds higher than in personal air. TNBP and TCEPwere the second dominating PFRs in stationary air (median =14.1 ng/m3, IQR = 9.0 ng/m3) and personal air (median =2.6 ng/m3, IQR = 2.0 ng/m3), respectively. Slightly lower levelsof PFRs have been reported in household stationary air fromNorway (median levels of TCIPP, TCEP, and TPHP are 42, 5,and 0.3 ng/m3, respectively),3 while higher ΣPFR levels werefound in Swedish indoor air from offices (mean = 3700 ng/m3)and daycare centers (mean = 2000 ng/m3).13 ΣTMPP andEHDPHP had low DF, which may partly due to their lowervolatilities. No significant difference was found between personaland stationary air for TPHP in our study.Stationary and personal air samples from a participant were
collected simultaneously (24 h) during weekdays, so most ofour participants probably spent fewer hours in living rooms, butmore time at work and other environments (e.g., outdoor andbedroom). PFR levels and profiles in personal air might thus bedifferent from stationary air. Levels of TNBP, TCEP, and ΣTCPPwere higher in stationary air than in personal air. The otherPFRs had also higher DFs and maximum levels in stationary air(Table 1), except for TBOEP. Differences in the concentrationsof various pollutants and particulate matter between personalair and stationary air sampling have been reported for exposureassessments in several studies.45−47 Obviously, the use of station-ary air sampling may generate significant bias during exposureassessment as compared to personal air sampling. Usually, publicplaces, like offices and cinemas, have more strict fire safety codeand more intensive FR usage, which should lead to higher FRlevels in air. Allen et al.44 reported higher level of PBDEs inpersonal air than stationary air in at home, which is different fromwhat we observed for PFRs. As all participants worked in oldbuildings, a possible explanation would be that PFRs are notintensively applied in their working environmental comparing totheir homes. Since Norway was one of the first countries to phaseout PBDEs,3 more PFRs might have been applied in recentlypurchased products; homes usually have more new products.Such hypothesis will possibly be confirmed in a parallel study onEBFRs in dust, air, and hand wipes by a partner of the A-TEAMproject.Further statistical analysis was performed for three com-
pounds with DF > 50% and for participants who provide bothtypes of air samples. Principal components analysis (PCA)
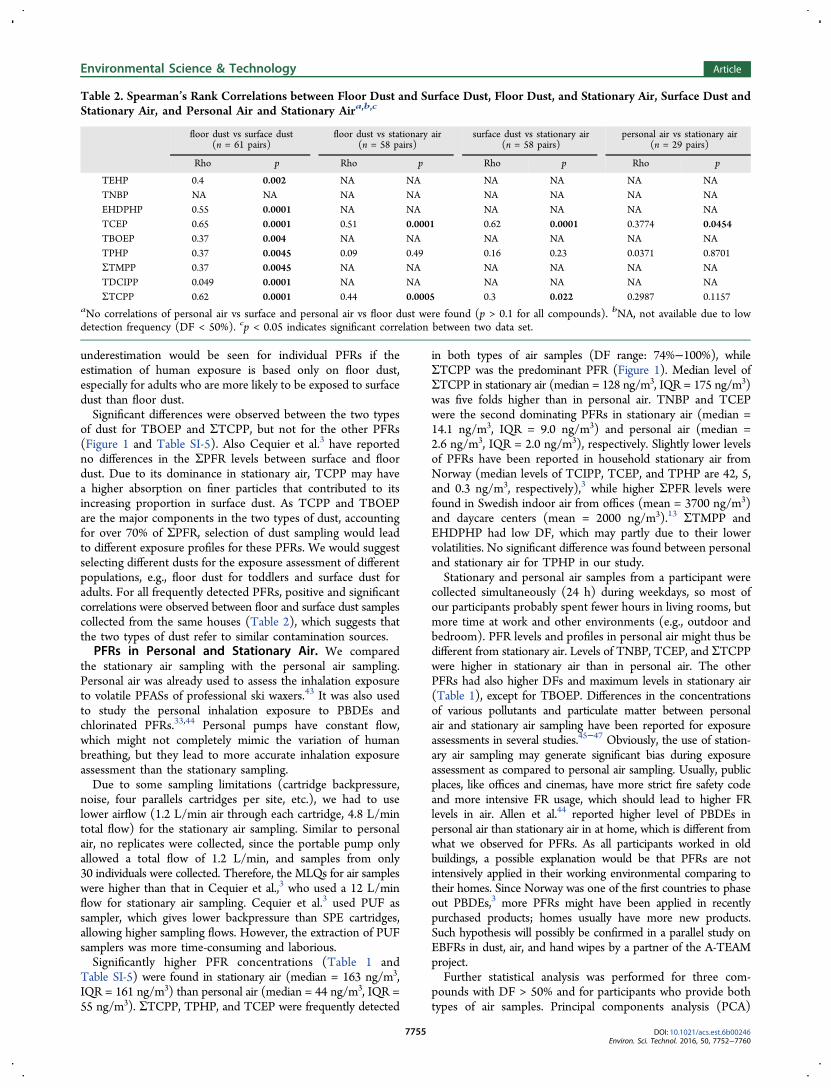
Table 2. Spearman’s Rank Correlations between Floor Dust and Surface Dust, Floor Dust, and Stationary Air, Surface Dust andStationary Air, and Personal Air and Stationary Aira,b,c
floor dust vs surface dust(n = 61 pairs)
floor dust vs stationary air(n = 58 pairs)
surface dust vs stationary air(n = 58 pairs)
personal air vs stationary air(n = 29 pairs)
Rho p Rho p Rho p Rho p
TEHP 0.4 0.002 NA NA NA NA NA NATNBP NA NA NA NA NA NA NA NAEHDPHP 0.55 0.0001 NA NA NA NA NA NATCEP 0.65 0.0001 0.51 0.0001 0.62 0.0001 0.3774 0.0454TBOEP 0.37 0.004 NA NA NA NA NA NATPHP 0.37 0.0045 0.09 0.49 0.16 0.23 0.0371 0.8701ΣTMPP 0.37 0.0045 NA NA NA NA NA NATDCIPP 0.049 0.0001 NA NA NA NA NA NAΣTCPP 0.62 0.0001 0.44 0.0005 0.3 0.022 0.2987 0.1157
aNo correlations of personal air vs surface and personal air vs floor dust were found (p > 0.1 for all compounds). bNA, not available due to lowdetection frequency (DF < 50%). cp < 0.05 indicates significant correlation between two data set.
Environmental Science & Technology Article
DOI: 10.1021/acs.est.6b00246Environ. Sci. Technol. 2016, 50, 7752−7760
7755
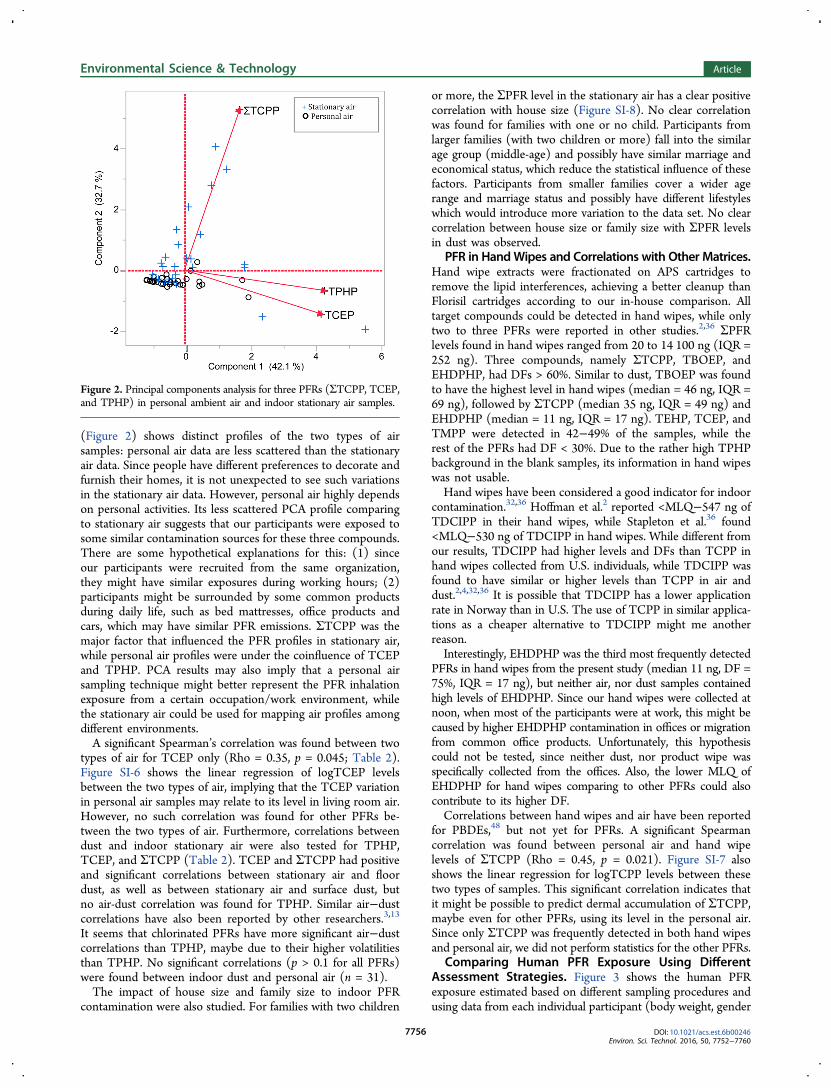
(Figure 2) shows distinct profiles of the two types of airsamples: personal air data are less scattered than the stationaryair data. Since people have different preferences to decorate andfurnish their homes, it is not unexpected to see such variationsin the stationary air data. However, personal air highly dependson personal activities. Its less scattered PCA profile comparingto stationary air suggests that our participants were exposed tosome similar contamination sources for these three compounds.There are some hypothetical explanations for this: (1) sinceour participants were recruited from the same organization,they might have similar exposures during working hours; (2)participants might be surrounded by some common productsduring daily life, such as bed mattresses, office products andcars, which may have similar PFR emissions. ΣTCPP was themajor factor that influenced the PFR profiles in stationary air,while personal air profiles were under the coinfluence of TCEPand TPHP. PCA results may also imply that a personal airsampling technique might better represent the PFR inhalationexposure from a certain occupation/work environment, whilethe stationary air could be used for mapping air profiles amongdifferent environments.A significant Spearman’s correlation was found between two
types of air for TCEP only (Rho = 0.35, p = 0.045; Table 2).Figure SI-6 shows the linear regression of logTCEP levelsbetween the two types of air, implying that the TCEP variationin personal air samples may relate to its level in living room air.However, no such correlation was found for other PFRs be-tween the two types of air. Furthermore, correlations betweendust and indoor stationary air were also tested for TPHP,TCEP, and ΣTCPP (Table 2). TCEP and ΣTCPP had positiveand significant correlations between stationary air and floordust, as well as between stationary air and surface dust, butno air-dust correlation was found for TPHP. Similar air−dustcorrelations have also been reported by other researchers.3,13
It seems that chlorinated PFRs have more significant air−dustcorrelations than TPHP, maybe due to their higher volatilitiesthan TPHP. No significant correlations (p > 0.1 for all PFRs)were found between indoor dust and personal air (n = 31).The impact of house size and family size to indoor PFR
contamination were also studied. For families with two children
or more, the ΣPFR level in the stationary air has a clear positivecorrelation with house size (Figure SI-8). No clear correlationwas found for families with one or no child. Participants fromlarger families (with two children or more) fall into the similarage group (middle-age) and possibly have similar marriage andeconomical status, which reduce the statistical influence of thesefactors. Participants from smaller families cover a wider agerange and marriage status and possibly have different lifestyleswhich would introduce more variation to the data set. No clearcorrelation between house size or family size with ΣPFR levelsin dust was observed.
PFR in HandWipes and Correlations with Other Matrices.Hand wipe extracts were fractionated on APS cartridges toremove the lipid interferences, achieving a better cleanup thanFlorisil cartridges according to our in-house comparison. Alltarget compounds could be detected in hand wipes, while onlytwo to three PFRs were reported in other studies.2,36 ΣPFRlevels found in hand wipes ranged from 20 to 14 100 ng (IQR =252 ng). Three compounds, namely ΣTCPP, TBOEP, andEHDPHP, had DFs > 60%. Similar to dust, TBOEP was foundto have the highest level in hand wipes (median = 46 ng, IQR =69 ng), followed by ΣTCPP (median 35 ng, IQR = 49 ng) andEHDPHP (median = 11 ng, IQR = 17 ng). TEHP, TCEP, andTMPP were detected in 42−49% of the samples, while therest of the PFRs had DF < 30%. Due to the rather high TPHPbackground in the blank samples, its information in hand wipeswas not usable.Hand wipes have been considered a good indicator for indoor
contamination.32,36 Hoffman et al.2 reported <MLQ−547 ng ofTDCIPP in their hand wipes, while Stapleton et al.36 found<MLQ−530 ng of TDCIPP in hand wipes. While different fromour results, TDCIPP had higher levels and DFs than TCPP inhand wipes collected from U.S. individuals, while TDCIPP wasfound to have similar or higher levels than TCPP in air anddust.2,4,32,36 It is possible that TDCIPP has a lower applicationrate in Norway than in U.S. The use of TCPP in similar applica-tions as a cheaper alternative to TDCIPP might me anotherreason.Interestingly, EHDPHP was the third most frequently detected
PFRs in hand wipes from the present study (median 11 ng, DF =75%, IQR = 17 ng), but neither air, nor dust samples containedhigh levels of EHDPHP. Since our hand wipes were collected atnoon, when most of the participants were at work, this might becaused by higher EHDPHP contamination in offices or migrationfrom common office products. Unfortunately, this hypothesiscould not be tested, since neither dust, nor product wipe wasspecifically collected from the offices. Also, the lower MLQ ofEHDPHP for hand wipes comparing to other PFRs could alsocontribute to its higher DF.Correlations between hand wipes and air have been reported
for PBDEs,48 but not yet for PFRs. A significant Spearmancorrelation was found between personal air and hand wipelevels of ΣTCPP (Rho = 0.45, p = 0.021). Figure SI-7 alsoshows the linear regression for logTCPP levels between thesetwo types of samples. This significant correlation indicates thatit might be possible to predict dermal accumulation of ΣTCPP,maybe even for other PFRs, using its level in the personal air.Since only ΣTCPP was frequently detected in both hand wipesand personal air, we did not perform statistics for the other PFRs.
Comparing Human PFR Exposure Using DifferentAssessment Strategies. Figure 3 shows the human PFRexposure estimated based on different sampling procedures andusing data from each individual participant (body weight, gender
Figure 2. Principal components analysis for three PFRs (ΣTCPP, TCEP,and TPHP) in personal ambient air and indoor stationary air samples.
Environmental Science & Technology Article
DOI: 10.1021/acs.est.6b00246Environ. Sci. Technol. 2016, 50, 7752−7760
7756
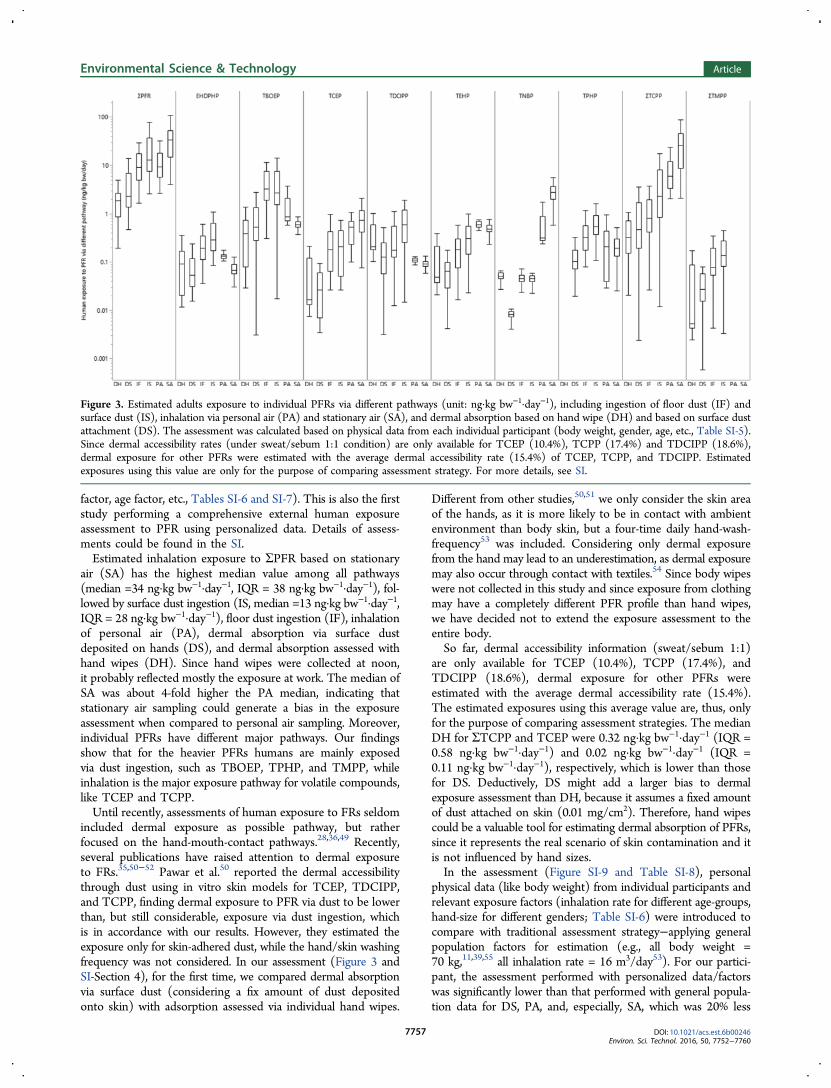
factor, age factor, etc., Tables SI-6 and SI-7). This is also the firststudy performing a comprehensive external human exposureassessment to PFR using personalized data. Details of assess-ments could be found in the SI.Estimated inhalation exposure to ΣPFR based on stationary
air (SA) has the highest median value among all pathways(median =34 ng·kg bw−1·day−1, IQR = 38 ng·kg bw−1·day−1), fol-lowed by surface dust ingestion (IS, median =13 ng·kg bw−1·day−1,IQR = 28 ng·kg bw−1·day−1), floor dust ingestion (IF), inhalationof personal air (PA), dermal absorption via surface dustdeposited on hands (DS), and dermal absorption assessed withhand wipes (DH). Since hand wipes were collected at noon,it probably reflected mostly the exposure at work. The median ofSA was about 4-fold higher the PA median, indicating thatstationary air sampling could generate a bias in the exposureassessment when compared to personal air sampling. Moreover,individual PFRs have different major pathways. Our findingsshow that for the heavier PFRs humans are mainly exposedvia dust ingestion, such as TBOEP, TPHP, and TMPP, whileinhalation is the major exposure pathway for volatile compounds,like TCEP and TCPP.Until recently, assessments of human exposure to FRs seldom
included dermal exposure as possible pathway, but ratherfocused on the hand-mouth-contact pathways.28,36,49 Recently,several publications have raised attention to dermal exposureto FRs.35,50−52 Pawar et al.50 reported the dermal accessibilitythrough dust using in vitro skin models for TCEP, TDCIPP,and TCPP, finding dermal exposure to PFR via dust to be lowerthan, but still considerable, exposure via dust ingestion, whichis in accordance with our results. However, they estimated theexposure only for skin-adhered dust, while the hand/skin washingfrequency was not considered. In our assessment (Figure 3 andSI-Section 4), for the first time, we compared dermal absorptionvia surface dust (considering a fix amount of dust depositedonto skin) with adsorption assessed via individual hand wipes.
Different from other studies,50,51 we only consider the skin areaof the hands, as it is more likely to be in contact with ambientenvironment than body skin, but a four-time daily hand-wash-frequency53 was included. Considering only dermal exposurefrom the hand may lead to an underestimation, as dermal exposuremay also occur through contact with textiles.54 Since body wipeswere not collected in this study and since exposure from clothingmay have a completely different PFR profile than hand wipes,we have decided not to extend the exposure assessment to theentire body.So far, dermal accessibility information (sweat/sebum 1:1)
are only available for TCEP (10.4%), TCPP (17.4%), andTDCIPP (18.6%), dermal exposure for other PFRs wereestimated with the average dermal accessibility rate (15.4%).The estimated exposures using this average value are, thus, onlyfor the purpose of comparing assessment strategies. The medianDH for ΣTCPP and TCEP were 0.32 ng·kg bw−1·day−1 (IQR =0.58 ng·kg bw−1·day−1) and 0.02 ng·kg bw−1·day−1 (IQR =0.11 ng·kg bw−1·day−1), respectively, which is lower than thosefor DS. Deductively, DS might add a larger bias to dermalexposure assessment than DH, because it assumes a fixed amountof dust attached on skin (0.01 mg/cm2). Therefore, hand wipescould be a valuable tool for estimating dermal absorption of PFRs,since it represents the real scenario of skin contamination and itis not influenced by hand sizes.In the assessment (Figure SI-9 and Table SI-8), personal
physical data (like body weight) from individual participants andrelevant exposure factors (inhalation rate for different age-groups,hand-size for different genders; Table SI-6) were introduced tocompare with traditional assessment strategy−applying generalpopulation factors for estimation (e.g., all body weight =70 kg,11,39,55 all inhalation rate = 16 m3/day53). For our partici-pant, the assessment performed with personalized data/factorswas significantly lower than that performed with general popula-tion data for DS, PA, and, especially, SA, which was 20% less
Figure 3. Estimated adults exposure to individual PFRs via different pathways (unit: ng·kg bw−1·day−1), including ingestion of floor dust (IF) andsurface dust (IS), inhalation via personal air (PA) and stationary air (SA), and dermal absorption based on hand wipe (DH) and based on surface dustattachment (DS). The assessment was calculated based on physical data from each individual participant (body weight, gender, age, etc., Table SI-5).Since dermal accessibility rates (under sweat/sebum 1:1 condition) are only available for TCEP (10.4%), TCPP (17.4%) and TDCIPP (18.6%),dermal exposure for other PFRs were estimated with the average dermal accessibility rate (15.4%) of TCEP, TCPP, and TDCIPP. Estimatedexposures using this value are only for the purpose of comparing assessment strategy. For more details, see SI.
Environmental Science & Technology Article
DOI: 10.1021/acs.est.6b00246Environ. Sci. Technol. 2016, 50, 7752−7760
7757
with personalized estimation. No significant differences wereobserved between the two strategies for IS, IF, and DH(Table SI-9). Apparently, the mean body weight for the partici-pants was close to 70 kg, so it would not have an impact in thestatistics. For IS, IF, and DH, no other personalized data wereapplied for assessment beside body weight, so their estimatedexposure would not be different from using general populationdata.In contrast, inhalation rates for individual genders and age
groups were applied for PA and SA in the personalized assess-ment, while hand-sizes for genders were introduced for DS.For specific participant groups or small populations, the use ofpersonal factors during assessment, which might not be normallydistributed, might lead to statistically significant differences in theresults using general population factors. Although personalizedexposure assessment could generate exposure assessment forindividuals, it requires large amount of extra work during sampl-ing and data analysis; while the traditional assessment strategy doesnot require this, since it only provides estimation for the generalpopulation. For PFR exposure via dust ingestion and dermalexposure assessed with hand wipes, it might not be necessary toapply personalized assessment strategy. For inhalation exposureor dermal absorption via dust attachment, personalized assess-ment strategy might reduce the bias of exposure estimation.This study has found differences in the exposure pathways
for the various PFRs. The selection of dust sampling strategyshould be based on the target population groups. Personal airsampling is likely to result in a more accurate inhalation exposurethan using stationary air measurements. Taking into accountthat different results were obtained when using personalizeddata compared to general population data, personalized data arerecommended for exposure assessment. Current studies arefocusing on the exposure to PFRs through diet, as well as on theassessment of internal exposure using samples of urine and bloodon the same population. Along with the results of this study,a complete and comprehensive assessment of human externaland internal exposure to PFRs will be possible by using amodeling approach.
■ ASSOCIATED CONTENT*S Supporting InformationThe Supporting Information is available free of charge on theACS Publications website at DOI: 10.1021/acs.est.6b00246.
Details about the (1) air sampling devices and targetcompounds, (2) sample preparation and analysis, (3)QA/QC, and (4) human exposure assessment (PDF)
■ AUTHOR INFORMATIONCorresponding Authors*E-mail: [email protected] (F.X.).*E-mail: [email protected] (A.C.).
NotesThe authors declare no competing financial interest.
■ ACKNOWLEDGMENTSThe research leading to these results has received fundingfrom the European Union Seventh Framework Programme(FP7/2007-2013) under grant agreement #316665 (A-TEAMproject). Matthias Cuykx, Igor Eulaers, Dr. Alin Ionas, andDr. Nele Van den Eede are acknowledged for their help andadvices on instrumental and statistical analysis.
■ REFERENCES(1) Van Der Veen, I.; de Boer, J. Phosphorus flame retardants:properties, production, environmental occurrence, toxicity andanalysis. Chemosphere 2012, 88 (10), 1119−1153.(2) Hoffman, K.; Garantziotis, S.; Birnbaum, L. S.; Stapleton, H. M.Monitoring Indoor Exposure to Organophosphate Flame Retardants:Hand Wipes and House Dust. Environ. Health Perspect. 2015, 123,160−165.(3) Cequier, E.; Ionas, A. C.; Covaci, A.; Marce, R. M.; Becher, G.;Thomsen, C. Occurrence of a broad range of legacy and emergingflame retardants in indoor environments in Norway. Environ. Sci.Technol. 2014, 48 (12), 6827−6835.(4) Dodson, R. E.; Perovich, L. J.; Covaci, A.; Van den Eede, N.;Ionas, A. C.; Dirtu, A. C.; Brody, J. G.; Rudel, R. A. After the PBDEphase-out: a broad suite of flame retardants in repeat house dustsamples from California. Environ. Sci. Technol. 2012, 46 (24), 13056−13066.(5) UNEP. SC-4/14: Listing of hexabromodiphenyl ether andheptabromodiphenyl ether, 2009.(6) UNEP. SC-4/18: Listing of tetrabromodiphenyl ether andpentabromodiphenyl ether, 2009.(7) UK-DEFRA. Fire Retardant Technologies: Safe Products withOptimised Environmental Hazard and Risk PerformanceAnnexe 3:Review of Alternative Fire Retardant Technologies, 2010.(8) Mendelsohn, E.; Hagopian, A.; Hoffman, K.; Butt, C. M.;Lorenzo, A.; Congleton, J.; Webster, T. F.; Stapleton, H. M. Nailpolish as a source of exposure to triphenyl phosphate. Environ. Int.2016, 86, 45−51.(9) Ballesteros-Gomez, A.; Erratico, C. A.; Van den Eede, N.; Ionas,A. C.; Leonards, P. E. G.; Covaci, A. In vitro metabolism of 2-ethylhexyldiphenyl phosphate (EHDPHP) by human liver micro-somes. Toxicol. Lett. 2015, 232 (1), 203−212.(10) Brommer, S.; Harrad, S. Sources and human exposureimplications of concentrations of organophosphate flame retardantsin dust from UK cars, classrooms, living rooms, and offices. Environ.Int. 2015, 83, 202−207.(11) Zheng, X.; Xu, F.; Chen, K.; Zeng, Y.; Luo, X.; Chen, S.; Mai, B.;Covaci, A. Flame retardants and organochlorines in indoor dust fromseveral e-waste recycling sites in South China: Composition variationsand implications for human exposure. Environ. Int. 2015, 78, 1−7.(12) Matsukami, H.; Minh, N.; Suzuki, G.; Someya, M.; Huu, L.Flame retardant emission from e-waste recycling operation in northernVietnam: Environmental occurrence of emerging organophosphorusesters used as alternatives for PBDEs. Sci. Total Environ. 2015, 514,492−499.(13) Bergh, C.; Torgrip, R.; Emenius, G.; Ostman, C. Organo-phosphate and phthalate esters in air and settled dust - a multi-locationindoor study. Indoor Air 2011, 21 (1), 67−76.(14) Dirtu, A. C.; Ali, N.; Van den Eede, N.; Neels, H.; Covaci, A.Country specific comparison for profile of chlorinated, brominatedand phosphate organic contaminants in indoor dust. Case study forEastern Romania, 2010. Environ. Int. 2012, 49, 1−8.(15) Ali, N.; Ali, L.; Mehdi, T.; Dirtu, A. C.; Al-Shammari, F.; Neels,H.; Covaci, A. Levels and profiles of organochlorines and flameretardants in car and house dust from Kuwait and Pakistan: implicationfor human exposure via dust ingestion. Environ. Int. 2013, 55, 62−70.(16) Cristale, J.; García Vazquez, A.; Barata, C.; Lacorte, S. Priorityand emerging flame retardants in rivers: Occurrence in water andsediment, Daphnia magna toxicity and risk assessment. Environ. Int.2013, 59, 232−243.(17) Xu, F.; García-Bermejo, A.; Malarvannan, G.; Gomara, B.; Neels,H.; Covaci, A. Multi-contaminant analysis of organophosphate andhalogenated flame retardants in food matrices using ultrasonicationand vacuum assisted extraction, multi-stage cleanup and gaschromatography − mass spectrometry. J. Chromatogr. A 2015, 1401,33−41.(18) Greaves, A. K.; Letcher, R. J. Comparative body compartmentcomposition and in ovo transfer of organophosphate flame retardants
Environmental Science & Technology Article
DOI: 10.1021/acs.est.6b00246Environ. Sci. Technol. 2016, 50, 7752−7760
7758
in north American great lakes herring gulls. Environ. Sci. Technol. 2014,48 (14), 7942−7950.(19) Brandsma, S. H.; Leonards, P. E. G.; Leslie, H. A.; de Boer, J.Tracing organophosphorus and brominated flame retardants andplasticizers in an estuarine food web. Sci. Total Environ. 2015, 505, 22−31.(20) Zheng, X.; Xu, F.; Luo, X.; Mai, B.; Covaci, A. Phosphate flameretardants and novel brominated flame retardants in home-producedeggs from an e-waste recycling region in China. Chemosphere 2016,150, 545−550.(21) Wei, G.-L.; Li, D.-Q.; Zhuo, M.-N.; Liao, Y.-S.; Xie, Z.-Y.; Guo,T.-L.; Li, J.-J.; Zhang, S.-Y.; Liang, Z.-Q. Organophosphorus flameretardants and plasticizers: Sources, occurrence, toxicity and humanexposure. Environ. Pollut. 2014, 196C, 29−46.(22) Li, H.; Su, G.; Zou, M.; Yu, L.; Letcher, R. J.; Yu, H.; Giesy, J. P.;Zhou, B.; Liu, C. Effects of Tris(1,3-dichloro-2-propyl) Phosphate onGrowth, Reproduction and Gene Transcription of Daphnia magna atEnvironmentally Relevant Concentrations. Environ. Sci. Technol. 2015,49, 12975−12983.(23) Song, F.; Han, X.; Zeng, T.; Zhang, C.; Zou, C.; Xie, K. Changesin beclin-1 and micro-calpain expression in tri-ortho-cresyl phosphate-induced delayed neuropathy. Toxicol. Lett. 2012, 210 (3), 276−284.(24) Meeker, J. D.; Stapleton, H. M. House dust concentrations oforganophosphate flame retardants in relation to hormone levels andsemen quality parameters. Environ. Health Perspect. 2009, 118, 318−323.(25) Kim, J.-W. W.; Isobe, T.; Muto, M.; Tue, N. M.; Katsura, K.;Malarvannan, G.; Sudaryanto, A.; Chang, K.-H. H.; Prudente, M.; Viet,P. H.; et al. Organophosphorus flame retardants (PFRs) in humanbreast milk from several Asian countries. Chemosphere 2014, 116, 91−97.(26) Sundkvist, A. M.; Olofsson, U.; Haglund, P. Organophosphorusflame retardants and plasticizers in marine and fresh water biota and inhuman milk. J. Environ. Monit. 2010, 12 (4), 943−951.(27) Kucharska, A.; Cequier, E.; Thomsen, C.; Becher, G.; Covaci,A.; Voorspoels, S. Assessment of human hair as an indicator ofexposure to organophosphate flame retardants. Case study on aNorwegian mother−child cohort. Environ. Int. 2015, 83, 50−57.(28) Alves, A.; Kucharska, A.; Erratico, C.; Xu, F.; Den Hond, E.;Koppen, G.; Vanermen, G.; Covaci, A.; Voorspoels, S. Humanbiomonitoring of emerging pollutants through non-invasive matrices:state of the art and future potential. Anal. Bioanal. Chem. 2014, 406(17), 4063−4088.(29) Van den Eede, N.; Neels, H.; Jorens, P. G.; Covaci, A. Analysisof organophosphate flame retardant diester metabolites in humanurine by liquid chromatography electrospray ionisation tandem massspectrometry. J. Chromatogr. A 2013, 1303, 48−53.(30) Van den Eede, N.; Heffernan, A. L.; Aylward, L. L.; Hobson, P.;Neels, H.; Mueller, J. F.; Covaci, A. Age as a determinant of phosphateflame retardant exposure of the Australian population andidentification of novel urinary PFR metabolites. Environ. Int. 2015,74, 1−8.(31) Cequier, E.; Sakhi, A. K.; Marce, R. M.; Becher, G.; Thomsen,C. Human exposure pathways to organophosphate triesters Abiomonitoring study of mother−child pairs. Environ. Int. 2015, 75,159−165.(32) Carignan, C. C.; Heiger-Bernays, W.; McClean, M. D.; Roberts,S. C.; Stapleton, H. M.; Sjodin, A.; Webster, T. F. Flame retardantexposure among collegiate United States gymnasts. Environ. Sci.Technol. 2013, 47 (23), 13848−13856.(33) Schreder, E. D.; Uding, N.; La Guardia, M. J. Inhalation, asignificant exposure route for chlorinated organophosphate flameretardants. Chemosphere 2016, 150, 499−504.(34) Yang, F.; Ding, J.; Huang, W.; Xie, W.; Liu, W. Particle size-specific distributions and preliminary exposure assessments oforganophosphate flame retardants in office air particulate matter.Environ. Sci. Technol. 2014, 48, 63−70.
(35) Abdallah, M. A.-E.; Pawar, G.; Harrad, S. Evaluation of in vitrovs. in vivo methods for assessment of dermal absorption of organicflame retardants: A review. Environ. Int. 2015, 74, 13−22.(36) Stapleton, H. M.; Misenheimer, J.; Hoffman, K.; Webster, T. F.Flame retardant associations between children’s hand wipes and housedust. Chemosphere 2014, 116, 54−60.(37) Papadopoulou, E.; Padilla-Sanchez, J. A.; Collins, C. D.;Cousins, I. T.; Covaci, A.; de Wit, C. A.; Leonards, P. E. G.;Voorspoels, S.; Thomsen, C.; Harrad, S.; et al. Sampling strategy forestimating human exposure pathways to consumer chemicals. Emerg.Contam. 2016, 2, 26.(38) Bergh, C.; Torgrip, R.; Conny, O. Simultaneous selectivedetection of organophosphate and phthalate esters using gaschromatography with positive ion chemical ionization tandem massspectrometry and its application to indoor air and dust. RapidCommun. Mass Spectrom. 2010, 24, 2859−2867.(39) Van den Eede, N.; Dirtu, A. C.; Neels, H.; Covaci, A. Analyticaldevelopments and preliminary assessment of human exposure toorganophosphate flame retardants from indoor dust. Environ. Int.2011, 37 (2), 454−461.(40) Cao, Z.; Yu, G.; Chen, Y.; Liu, C.; Liu, K.; Zhang, T.; Wang, B.;Deng, S.; Huang, J. Mechanisms influencing the BFR distributionpatterns in office dust and implications for estimating human exposure.J. Hazard. Mater. 2013, 252−253, 11−18.(41) Cao, Z.; Xu, F.; Covaci, A.; Wu, M.; Wang, H.; Yu, G.; Wang, B.;Deng, S.; Huang, J.; Wang, X. Distribution Patterns of Brominated,Chlorinated, and Phosphorus Flame Retardants with Particle Size inIndoor and Outdoor Dust and Implications for Human Exposure.Environ. Sci. Technol. 2014, 48 (15), 8839−8846.(42) Cao, Z.; Xu, F.; Li, W.; Sun, J.; Shen, M.; Su, X.; Feng, J.; Yu, G.;Covaci, A. Seasonal and particle size-dependent variations of HBCDsin settled dust: implications for sampling. Environ. Sci. Technol. 2015,49, 11151−11157.(43) Nilsson, H.; Karrman, A.; Rotander, A.; van Bavel, B.;Lindstrom, G.; Westberg, H. Professional ski waxers’ exposure toPFAS and aerosol concentrations in gas phase and different particlesize fractions. Environ. Sci. Process. Impacts 2013, 15, 814−822.(44) Allen, J. G.; McClean, M. D.; Stapleton, H. M.; Nelson, J. W.;Webster, T. F. Personal exposure to polybrominated diphenyl ethers(PBDEs) in residential indoor air. Environ. Sci. Technol. 2007, 41 (13),4574−4579.(45) Ryan, P. H.; Brokamp, C.; Fan, Z. H.; Rao, M. B. Analysis ofPersonal and Home Characteristics Associated with the ElementalComposition of PM2.5 in Indoor, Outdoor, and Personal Air in theRIOPA Study. Res. Rep. Health Eff. Inst. 2015, 185, 3−40.(46) McBride, S. J.; Ferro, A. R.; Ott, W. R.; Switzer, P.; Hildemann,L. M. Investigations of the proximity effect for pollutants in the indoorenvironment. J. Exposure Anal. Environ. Epidemiol. 1999, 9(6), 602−621.10.1038/sj.jea.7500057(47) Weisel, C. P.; Zhang, J.; Turpin, B. J.; Morandi, M. T.; Colome,S.; Stock, T. H.; Spektor, D. M.; Korn, L.; Winer, A. M.; Kwon, J.;Meng, Q. Y.; Zhang, L.; Harrington, R.; Liu, W.; Reff, A.; Lee, J. H.;Alimokhtari, S.; Mohan, K.; Shendell, D.; Jones, J.; Farrar, L.; Maberti,S.; Fan, T. Relationships of Indoor, Outdoor, and Personal Air(RIOPA). Part I. Collection methods and descriptive analyses. J.Exposure Anal. Environ. Epidemiol. 2005, 15 (130), 1−107; discussion109−127.10.1038/sj.jea.7500378(48) Watkins, D. J.; McClean, M. D.; Fraser, A. J.; Weinberg, J.;Stapleton, H. M.; Webster, T. F. Associations between PBDEs in officeair, dust, and surface wipes. Environ. Int. 2013, 59, 124−132.(49) Stapleton, H. M.; Kelly, S. M.; Allen, J. G.; Mcclean, M. D.;Webster, T. F. Measurement of polybrominated diphenyl ethers onhand wipes: estimating exposure from hand-to-mouth contact. Environ.Sci. Technol. 2008, 42 (9), 3329−3334.(50) Pawar, G.; Abdallah, M. A.-E.; de Saa, E. V.; Harrad, S. Dermalbioaccessibility of flame retardants from indoor dust and the influenceof topically applied cosmetics. J. Exposure Sci. Environ. Epidemiol. 2016,in press (doi: 10.1038/jes.2015.84).
Environmental Science & Technology Article
DOI: 10.1021/acs.est.6b00246Environ. Sci. Technol. 2016, 50, 7752−7760
7759
(51) Abdallah, M. A.-E.; Pawar, G.; Harrad, S. Human dermalabsorption of chlorinated organophosphate flame retardants; implica-tions for human exposure. Toxicol. Appl. Pharmacol. 2016, 291, 28−37.(52) Abdallah, M. A.-E.; Pawar, G.; Harrad, S. Effect of BromineSubstitution on Human Dermal Absorption of PolybrominatedDiphenyl Ethers. Environ. Sci. Technol. 2015, 49 (18), 10976−10983.(53) US-EPA. Exposure Factors Handbook: 2011 Edition; WashingtonDC, 2011.(54) Weschler, C. J.; Nazaroff, W. W. SVOC exposure indoors: Freshlook at dermal pathways. Indoor Air 2012, 22 (5), 356−377.(55) Ali, N.; Dirtu, A. C.; Van den Eede, N.; Goosey, E.; Harrad, S.;Neels, H.; ’T Mannetje, A.; Coakley, J.; Douwes, J.; Covaci, A.Occurrence of alternative flame retardants in indoor dust from NewZealand: Indoor sources and human exposure assessment. Chemo-sphere 2012, 88 (11), 1276−1282.
Environmental Science & Technology Article
DOI: 10.1021/acs.est.6b00246Environ. Sci. Technol. 2016, 50, 7752−7760
7760