comprehensive rental housing market study for the plymouth
TRANSCRIPT

7575 Golden Valley Road Suite 385 Golden Valley, MN 55427 612.338.0012 www.maxfieldresearch.com
Comprehensive Rental Housing Market Study for the Plymouth Housing and Redevelopment
Authority

(main) 612-338-0012 (fax) 612-904-7979 7575 Plymouth Road, Suite 385, Plymouth, MN 55427
www.maxfieldresearch.com
April 4, 2018 Jim Barnes HRA Manager City of Plymouth 3400 Plymouth Blvd Plymouth, MN 55447 Dear Mr. Barnes: Attached is the Comprehensive Rental Housing Market Study for the Plymouth Housing and Redevelop-ment Authority conducted by Maxfield Research and Consulting, LLC. The study projects rental housing demand from 2017 through 2030, and provided recommendations on the amount and type of rental housing that could be built in Plymouth to satisfy demand from current and future residents over the next decade. The study identifies a potential demand for approximately 3,500 new housing units through 2030. Be-cause the population in Plymouth of the baby boomers will be aging over the next few decades; about 56% of the total demand will be for age-restricted housing types. At the same time, strong demand ex-ists for general-occupancy apartments with a need for over 1,500 units through 2030. Based on the survey of occupancies, Plymouth vacancies are extremely low posting an overall vacancy rate of only 1.7% for general-occupancy housing and 2.5% for senior housing. Detailed information regarding recommended housing concepts can be found in the Recommendations & Conclusions section at the end of the report. If you have any questions or need additional information, please contact us. We have enjoyed conducting this study for you. Sincerely, MAXFIELD RESEARCH AND CONSULTING, LLC
Matt Mullins Max Perrault Vice President Associate Attachment

TABLE OF CONTENTS Page EXECUTIVE SUMMARY .......................................................................................................... 1 DEMOGRAPHIC ANALYSIS ..................................................................................................... 5 Introduction ...................................................................................................................... 5 Population and Household Growth Trends and Projections from 1990 to 2040 ............. 5
Persons Per Household (Household Size) ......................................................................... 8 Age Distribution Trends .................................................................................................... 9 Household Income by Age of Householder ...................................................................... 12 Net worth .......................................................................................................................... 16 Tenure by Household Income ........................................................................................... 18 Tenure by Age of Householder ......................................................................................... 21 Household Type ................................................................................................................ 23 Tenure by Household Size ................................................................................................. 25 Diversity............................................................................................................................. 26 Mobility in the Past Year ................................................................................................... 28 Demographic Comparison................................................................................................. 28 Summary of Demographic Trends .................................................................................... 30 EMPLOYMENT ....................................................................................................................... 32 Employment Trends .......................................................................................................... 32 Employment Growth and Projections ............................................................................... 32 Resident Labor Force ........................................................................................................ 33 Employment, Earnings, and Employment by Educational Attainment ............................ 35 Commuting Patterns ......................................................................................................... 38 Inflow/Outflow .................................................................................................................. 40 Major Employers ............................................................................................................... 42 Employment Interview ...................................................................................................... 43 HOUSING CHARACTERISTICS ................................................................................................. 44 Introduction ...................................................................................................................... 44 Residential Construction Trends 2000 to Present ............................................................ 44 American Community Survey ............................................................................................ 47 Age of Housing Stock......................................................................................................... 47 Housing Units by Structure and Occupancy or (Housing Stock by Structure Type) ......... 49 Owner Occupied Housing Units by Mortgage Status ....................................................... 49 Housing Units by Occupancy Status & Tenure .................................................................. 50 Renter-Occupied Units by Contract Rent .......................................................................... 55 Housing Characteristics Comparison ................................................................................ 56

HOUSING AFFORDABILITY..................................................................................................... 57 Introduction ...................................................................................................................... 57 Housing Cost Burden ......................................................................................................... 60 Housing Vouchers ............................................................................................................. 62 Housing Costs as Percentage of Household Income ......................................................... 64 RENTAL MARKET ANALYSIS .................................................................................................. 66 Introduction ...................................................................................................................... 66 Overview of Rental Market Conditions ............................................................................. 66 General Occupancy Rental Properties .............................................................................. 70 Natural Occurring Affordable Housing (i.e. Unsubsidized Affordable) ............................. 85 Licensed Rental Ordinance ................................................................................................ 90 SENIOR HOUSING ANALYSIS ................................................................................................. 92 Senior Housing Defined ..................................................................................................... 92 Senior Housing in Plymouth .............................................................................................. 93 Senior Housing Comparison .............................................................................................. 102 HOUSING DEMAND ANALYSIS .............................................................................................. 104 Introduction ....................................................................................................................... 104 Demographic Profile and Housing Demand ...................................................................... 104 Housing Demand Overview ............................................................................................... 105 Estimated Demand for General Occupancy Rental Housing ............................................. 109 Estimated Demand for Independent Adult/Few Services Senior Housing ........................ 111 Estimated Demand for Subsidized/Affordable Independent Senior Housing ................... 113 Estimated Demand for Congregate Senior Housing .......................................................... 114 Demand Estimate for Assisted Living Housing .................................................................. 116 Estimated Demand for Memory Care Housing .................................................................. 119 RECOMMENDATIONS AND CONCLUSIONS .......................................................................... 121 Introduction/Overall Housing Recommendations ............................................................ 121 Recommended Housing Product Types ............................................................................ 123 CHALLENGES AND OPPORTUNITIES ...................................................................................... 128 APPENDIX .............................................................................................................................. 137 Definitions ......................................................................................................................... 138

MAPS Page City of Plymouth 2016 Median Income by Census Tract ....................................................... 20 City of Plymouth Residential Parcels by Total Assessed Parcel Value ................................... 52 City of Plymouth Residential Parcels by Year Built ................................................................ 53 City of Plymouth Residential Parcels Homesteaded .............................................................. 54 Plymouth GO Rental Housing Developments ........................................................................ 83 Plymouth GO Multifamily Rental Housing Units by Census Tract ......................................... 91 Plymouth Senior Housing Developments .............................................................................. 101

LIST OF TABLES Table Number and Title Page D1. Population and Household Growth Trends and Projections, Plymouth Analysis
Area, 1990 to 2040........................................................................................................ 7 D2. Population Age Distribution, Plymouth Analysis Area, 2000 to 2022 .......................... 10 D3. Household Income by Age of Householder, City of Plymouth, 2017 & 2022 ............... 14 D4. Net worth by Age of Householder, Plymouth Analysis Area, 2017 .............................. 17 D5. Tenure by Household Income, Plymouth Analysis Area, 2015 ..................................... 18 D6. Tenure by Age of Householder, Plymouth Analysis Area, 2000 - 2015 ........................ 22 D7. Household Type, Plymouth Analysis Area, 2010 & 2015 .............................................. 24 D8. Tenure by Household Size, Plymouth Analysis Area, 2010 & 2015 .............................. 25 D9. Population Distribution by Race, Plymouth Analysis Area, 2010 and 2015 ................. 27 D10. Mobility Estimate in the Past Year by Age for Current Residence, Plymouth, 2015 .... 28 D11. Demographic Comparison, Plymouth Analysis Area .................................................... 29 E1. Employment Growth Trends & Projections, Plymouth Analysis Area, 2000-2040 ...... 32 E2. Annual Average Resident Employment, Plymouth MN, 2000 to 2017 ........................ 34 E3. Covered Employment Trends, Plymouth MN, 2000, 2005, 2010, 2015, 2016 ............. 35 E4. Employment by Earnings, Plymouth Analysis Area, 2014 ............................................ 36 E5. Employment by Educational Attainment, Plymouth Analysis Area, 2014 ................... 36 E6. Business Summary – by NAICS Code, Plymouth MN, 2017 .......................................... 37 E7. Plymouth Commuting Patterns, 2014 .......................................................................... 39 E8. Commuting Inflow/Outflow, Plymouth, 2014 .............................................................. 40 E9. Major Employers, City of Plymouth, 2017 .................................................................... 42 HC1. Residential Construction Building Permitted Units Issued, City of Plymouth, per
Metropolitan Council, 2000 to 2016 ............................................................................. 45 HC2. Residential Construction Building Permits Issued, City of Plymouth, 2000 to 2016 .... 46 HC3. Age of Housing Stock, Plymouth Analysis Area, 2015 .................................................. 48 HC4. Housing Units by Structure & Tenure, Plymouth Analysis Area, 2015 ......................... 49 HC5. Owner-Occupied Housing Units by Mortgage Status, Plymouth Analysis Area, 2015 . 50 HC6. Housing Units by Occupancy Status & Tenure, Plymouth Analysis Area, 2015 ........... 51 HC7. Renter-Occupied Units by Contract Rent, Plymouth Analysis Area, 2015 ................... 55 HC8. Housing Characteristics Comparison, Plymouth Analysis Area, ................................... 56
HA1. MHFA/HUD Income and Rent Limits, Hennepin County, 2017 .................................... 58 HA2. Maximum Rent Based on Household Size and Area Median Income, Hennepin County, 2017 ................................................................................................ 59 HA3. Housing Cost Burden, Plymouth, Twin City MSA, Hennepin County, Minnesota, 2015 61 HA4. Housing Affordability Expiration Date, City of Plymouth ............................................. 63 HA5. Plymouth Housing Affordability – Based on Household Income, City of Plymouth ..... 65 R1. Average Rents/Vacancies Trends, Plymouth, 4th Quarter 2007-2016 .......................... 67

R2. Bedrooms by Gross Rent, Renter-Occupied Housing Units, Plymouth, 2015 .............. 69 R3. General Occupancy Rental Developments Year Built, Plymouth, August 2017 ........... 71 R4. Select General Occupancy Rental Developments Survey, Plymouth, August 2017 ..... 74 R5. Surveyed Unit Type Summary, Plymouth, September 2017 ........................................ 80 R6. Maximum Rent Based on Household Size and Area Median Income, Hennepin County,
2017 .............................................................................................................................. 86 R7. Multifamily Market Rate Rental Developments, Naturally Occurring Rental Housing, City of
Plymouth, August 2017 ................................................................................................. 87 R8. Multifamily Market Rate Rental Developments, Natural Occurring Summary, Plymouth,
August 2017 .................................................................................................................. 90 S1. Senior Housing Projects, Plymouth, September 2017 .................................................. 96 S2. Surveyed Unit Type Summary, Senior Housing Developments, September 2017 ....... 98 S3. Senior Housing Comparison, Plymouth Analysis Area .................................................. 102 S4. Senior Housing Comparison, Plymouth Analysis Area .................................................. 103 HD1. Rental Housing Demand, City of Plymouth, 2017 to 2030 ........................................... 110 HD2. Market Rate Active Adult Housing Demand, City of Plymouth, 2017 and 2030 .......... 112 HD3. Deep-Subsidy/Shallow Subsidy Independent Housing Demand, City of Plymouth, 2017 and 2030 ....................................................................................................................... 114 HD4. Market Rate Congregate Rental Housing Demand, Plymouth, 2017 and 2030 ........... 115 HD5. Market Rate Assisted Living Demand, Plymouth, 2017 and 2030 ................................ 118 HD6. Market Rate Memory Care Demand, Plymouth, 2017 and 2030 ................................. 120 CR1. Summary of Housing Demand, City of Plymouth, September 2017 ............................ 121 CR2. Recommended Housing Development, Plymouth, 2017 to 2030 ................................ 123

EXECUTIVE SUMMARY
MAXFIELD RESEARCH AND CONSULTING 1
Purpose and Scope of Study Maxfield Research and Consulting LLC (i.e. “Maxfield Research”) was engaged by the City of Plymouth HRA to conduct a Comprehensive Rental Housing Market Study for the City of Plym-outh. The Housing Market Study provides recommendations on the amount and types of rental housing that should be developed in order to meet the needs of current and future households who choose to reside in Plymouth. The scope of this study includes: an analysis of the demographic and economic characteristics of the City; a review of the characteristics of the existing housing stock, building permit trends, and residential land supply; an analysis of the market condition for a variety of rental and for-sale housing products; and an assessment of the need for housing by product type in the City. Recommendations on the number and types of housing products that should be considered in the City are also supplied. Demographic Analysis • As of the 2010 Census, the City of Plymouth had 70,576 people and 29,982 households. The
City of Plymouth is forecast to grow by 8,424 people and 2,418 households between 2010 and 2020 and by another 5,000 people and 2,100 households between 2020 and 2030.
• From 2017 to 2022, growth is expected in all ages except in those ages 18 to 24 and in 45
to 54 year olds. The 65 to 74 age cohorts are projected to have the greatest numeric growth increasing by 1,809 people, while the 75 to 84 age cohort is projected to have the greatest percentage growth in Plymouth increasing by 32% between 2017 and 2022.
• The City of Plymouth had an estimated median household income of $96,274 in 2017. Non-
senior household median incomes peak in the 45 to 54 age group at $124,490. The median income for seniors age 65 to 74 is $84,386 and for 75+ is $45,545.
• Between 2000 and 2015, homeownership rates decreased from 76.5% to 71.4% in the City of Plymouth. The decline was a result of lender-mediated properties during the Great Re-cession and the rental housing market that is currently booming in Plymouth.
• Married without children households accounted for the highest household type percentage
in 2015 at 33.3%. However, living alone is the second largest household type accounting for about 26% of households in Plymouth.

EXECUTIVE SUMMARY
MAXFIELD RESEARCH AND CONSULTING 2
Employment Analysis • Plymouth and Hennepin County had an unemployment rate of 3.1% and 3.4% respectively
in June 2017, which is lower than the State of Minnesota (4.1%).
• According to Employer-Household Dynamics data from the U.S. Census Bureau there are roughly 50,551 workers in Plymouth in 2014, 9.9% live in Plymouth. Most other workers are commuting from Minneapolis (7.4%), Maple Grove (5.9%) and Brooklyn Park (4.3%). Plym-outh is considered a major importer of works as over 90% of the employees working in Plymouth are from other communities.
Housing Characteristics • Per the City of Plymouth Building Department there were 7,225 units permitted from 2000
to May 2017. In 2009 (the peak of the recession), Plymouth observed the fewest building permits issued at 75, but has averaged building permits for 299 units per year since 2007.
• Nearly one-half of Plymouth’s renter-occupied housing were constructed in the 1970s and
1980s (47%), while 22% of Plymouth’s renter-occupied housing stock was built since 2000. • Approximately 70% of Plymouth homeowners have a mortgage compared to 73% of Henne-
pin County and 73% of the metro area. About 17% of homeowners with mortgages also have a second mortgage or home equity loan.
• The median estimated home value in Plymouth was roughly $331,263 in 2017. The income
required to afford a home at this price would be about $94,646 to $110,421 based on the standard of 3.0 to 3.5 times the median income (and assuming these households do not have a high level of debt). About 64% of non-senior households in Plymouth have incomes of $94,646 or more in 2017.
• The median contract rent in Plymouth was $1,057 in 2015. Based on a 30% allocation of in-
come to housing, a household would need an income of about $42,280 to afford the me-dian contract rent in Plymouth.
Rental Housing Market Analysis • In total, Maxfield Research inventoried 6,972 general occupancy rental units in Plymouth
spread across 44 multifamily developments. At the time of the survey, there were 115 va-cant units resulting in an overall vacancy rate of 1.6%. Typically, a healthy rental market maintains a vacancy rate of roughly 5%, which promotes competitive rates, ensures ade-quate consumer choice, and allows for unit turnover.

EXECUTIVE SUMMARY
MAXFIELD RESEARCH AND CONSULTING 3
• Market rate projects make-up 6,372 units and a total of 115 unit vacancies were found, re-sulting in a market rate rental project vacancy rate of 1.8%.
• Affordable/subsidized projects make-up 600 units and posted no vacant units. Senior Housing Market Analysis • There are eight senior housing developments located in the Plymouth with a total of 914
units. There were 23 vacancies identified within the housing developments posting an over-all vacancy rate of 2.5%. Generally, healthy senior housing vacancy rates range from 5% to 7% depending on service level.
Housing Demand Analysis • Based on our calculations, demand exists in the City of Plymouth for the following general
occupancy product types between 2017 and 2030: o Market rate rental 972 units o Affordable rental 408 units o Subsidized rental 188 units
• In addition, we find demand for multiple senior housing product types. By 2030, demand in
the Plymouth Market Area for senior housing is forecast for the following: o Active adult ownership 308 units o Active adult rental 262 units o Active adult affordable 234 units o Active adult subsidized 227 units o Congregate 457 units o Assisted Living 234 units o Memory care 279 units
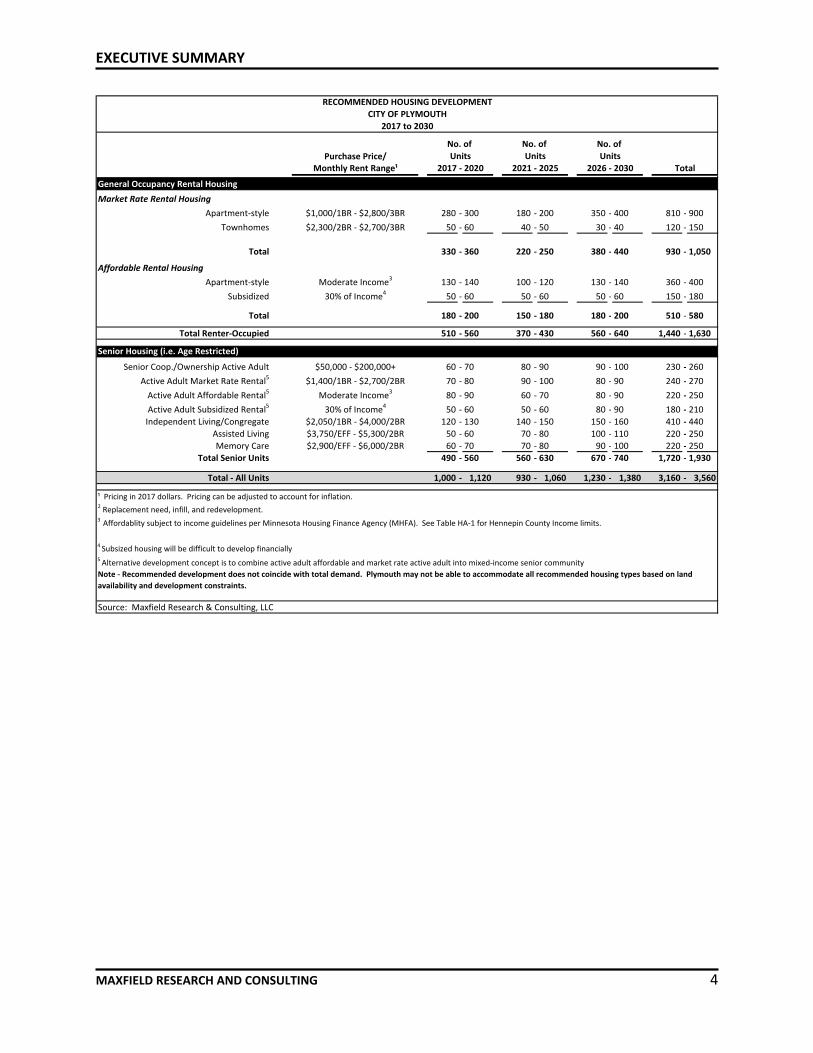
Recommendations and Conclusions • Based on the finding of our analysis and demand calculations, the following chart provides a
summary of the recommended development concepts by product type for the City of Plym-outh through 2030. Detailed findings are described in the Recommendations section of the report.
EXECUTIVE SUMMARY
MAXFIELD RESEARCH AND CONSULTING 4
Purchase Price/Monthly Rent Range¹
General Occupancy Rental Housing Market Rate Rental Housing
Apartment-style $1,000/1BR - $2,800/3BR 280 - 300 180 - 200 350 - 400 810 - 900 Townhomes $2,300/2BR - $2,700/3BR 50 - 60 40 - 50 30 - 40 120 - 150
Total 330 - 360 220 - 250 380 - 440 930 - 1,050
Affordable Rental Housing Apartment-style Moderate Income3 130 - 140 100 - 120 130 - 140 360 - 400
Subsidized 30% of Income4 50 - 60 50 - 60 50 - 60 150 - 180
Total 180 - 200 150 - 180 180 - 200 510 - 580
Total Renter-Occupied 510 - 560 370 - 430 560 - 640 1,440 - 1,630
Senior Housing (i.e. Age Restricted)
Senior Coop./Ownership Active Adult $50,000 - $200,000+ 60 - 70 80 - 90 90 - 100 230 - 260Active Adult Market Rate Rental5 $1,400/1BR - $2,700/2BR 70 - 80 90 - 100 80 - 90 240 - 270
Active Adult Affordable Rental5 Moderate Income3 80 - 90 60 - 70 80 - 90 220 - 250Active Adult Subsidized Rental5 30% of Income4 50 - 60 50 - 60 80 - 90 180 - 210Independent Living/Congregate $2,050/1BR - $4,000/2BR 120 - 130 140 - 150 150 - 160 410 - 440
Assisted Living $3,750/EFF - $5,300/2BR 50 - 60 70 - 80 100 - 110 220 - 250Memory Care $2,900/EFF - $6,000/2BR 60 - 70 70 - 80 90 - 100 220 - 250
Total Senior Units 490 - 560 560 - 630 670 - 740 1,720 - 1,930
Total - All Units 1,000 - 1,120 930 - 1,060 1,230 - 1,380 3,160 - 3,560
Source: Maxfield Research & Consulting, LLC
Note - Recommended development does not coincide with total demand. Plymouth may not be able to accommodate all recommended housing types based on land availability and development constraints.
Total
¹ Pricing in 2017 dollars. Pricing can be adjusted to account for inflation.2 Replacement need, infill, and redevelopment. 3 Affordablity subject to income guidelines per Minnesota Housing Finance Agency (MHFA). See Table HA-1 for Hennepin County Income limits.
4 Subsized housing will be difficult to develop financially 5 Alternative development concept is to combine active adult affordable and market rate active adult into mixed-income senior community
Units Units Units2017 - 2020 2021 - 2025 2026 - 2030
RECOMMENDED HOUSING DEVELOPMENTCITY OF PLYMOUTH
2017 to 2030
No. of No. of No. of

DEMOGRAPHIC ANALYSIS
MAXFIELD RESEARCH AND CONSULTING 5
Introduction This section of the report examines factors related to the current and future demand for owner- and renter-occupied housing units in Plymouth, Minnesota. It includes an analysis of population and household growth trends and projections, projected age distribution, house-hold income, net worth, household types, household tenure, diversity, and mobility trends. A review of these characteristics provides insight into the demand for various types of housing in the City of Plymouth. Population and Household Growth Trends and Projections from 1990 to 2040 Table D-1 presents population and household growth trends and projections from 1990 to 2040. The 1990 to 2010 data is from the U.S. Census. Estimate and projection data is calcu-lated from the Metropolitan Council; ESRI (a national demographics service provider); with ad-justments calculated by Maxfield Research and Consulting LLC. The adjustments are intended to reflect growth that will likely be realized after considering the impact of the current housing market, employment, and review of building permit trends.
Population • The City of Plymouth’s population grew by 4,682 people (+7.1%) between 2000 and 2010.
During this same period Hennepin County grew by +3.2% and the 7-County Metro Area grew by 7.9%.
• In 2010, The City of Plymouth included roughly 6.1% of the total population in Hennepin
County.
0
10,000
20,000
30,000
40,000
50,000
60,000
70,000
80,000
1950 1960 1970 1980 1990 2000 2010 Est. 2017
Historic Population

DEMOGRAPHIC ANALYSIS
MAXFIELD RESEARCH AND CONSULTING 6
• Maxfield Research projects that Plymouth will have an increase in its population by 8,424 people (+11.9%) between 2010 and 2020.
• We project that between 2020 and 2040, Plymouth will increase by approximately 6,100
people (+7.7%).
65,8
94
70,5
76
76,1
50
79,0
00
84,0
00
85,1
00
0
10,000
20,000
30,000
40,000
50,000
60,000
70,000
80,000
90,000
2000 2010 2017 2020 2030 2040
Population Trends

DEMOGRAPHIC ANALYSIS
MAXFIELD RESEARCH AND CONSULTING 7
Estimate
1990 2000 2010 2017 2020 2022 2030 2040 No. Pct. No. Pct. No. Pct.
Plymouth 50,889 65,894 70,576 76,150 79,000 80,600 84,000 85,100 4,682 7.1 8,424 11.9 6,100 7.7
Hennepin County 1,032,431 1,116,200 1,152,425 1,200,862 1,221,620 1,243,336 1,330,200 1,405,060 36,225 3.2 69,195 6.0 183,440 15.07-County Metro Area 2,288,729 2,642,056 2,849,567 2,979,370 3,035,000 3,084,885 3,284,427 3,652,060 207,511 7.9 185,433 6.5 617,060 20.3
Plymouth 19,616 24,820 29,982 31,200 32,400 33,175 34,500 34,700 5,162 20.8 2,418 8.1 2,300 7.1
Hennepin County 419,060 456,129 475,913 512,024 527,500 535,136 565,680 600,040 19,784 4.3 89,767 18.9 72,540 13.87-County Metro Area 1,032,431 1,021,454 1,117,749 1,214,931 1,256,580 1,280,958 1,378,470 1,491,780 96,295 9.4 138,831 12.4 235,200 18.7
Sources: U.S. Census Bureau; ESRI; Metropolitan Council; Maxfield Research & Consulting, LLC
POPULATION
HOUSEHOLDS
Note: Hennepin County and Metro Area totals sourced to Metropolitan Council (2020 to 2040).
TABLE D-1POPULATION AND HOUSEHOLD GROWTH TRENDS AND PROJECTIONS
PLYMOUTH ANALYSIS AREA1990 to 2040
Change
U.S. Census Forecast 2000 to 2010 2010 to 2020 2020 to 2040

DEMOGRAPHIC ANALYSIS
MAXFIELD RESEARCH AND CONSULTING 8
Households • Household growth trends are typically a more accurate indicator of housing needs than
population growth since a household is, by definition, an occupied housing unit. However, additional demand can come from changing demographics of the population base, which results in demand for different housing products.
• Plymouth gained 5,162 households during the 2000s (an increase of +20.8%), increasing its
household base to 29,982 households as of 2010.
• Maxfield Research projects household growth in Plymouth to increase by 2,418 households (+8.1%) between 2010 and 2020. Overall, we project Plymouth to increase to 34,700 households by 2040.
Persons Per Household (Household Size) Household size is calculated by dividing the number of persons in households by the number of households (or householders). Nationally, the average number of people per household has been declining for over a century; however, there have been sharp declines starting in the 1960s and 1970s. Persons per household in the U.S. were about 4.5 in 1916 and declined to 3.2 in the 1960s. Over the past 50 years, it dropped to 2.57 as of the 2000 Census. However, due to the economic recession this trend has been temporarily halted as renters and laid-off em-ployees “doubled-up,” which increased the average U.S. household size to 2.59 as of the 2010 Census.
24,8
20 29,9
82
31,2
00
32,4
00
34,5
00
34,7
00
0
5,000
10,000
15,000
20,000
25,000
30,000
35,000
40,000
2000 2010 2017 2020 2030 2040
Household Trends

DEMOGRAPHIC ANALYSIS
MAXFIELD RESEARCH AND CONSULTING 9
The declining household size has been caused by many factors, including: aging of the popula-tion, higher divorce rates, cohabitation, smaller family sizes, demographic trends in marriage, etc. Most of these changes have resulted from shifts in societal values, the economy, and im-provements in health care that have influenced how people organize their lives. • In 2000, the average household size range increased between 2.65 (City of Plymouth) and
2.45 (Hennepin County). • By 2017, it is estimated that the average household sizes range decreased to 2.44 in Plym-
outh and 2.35 in Hennepin County. The average household size in the seven-county metro area nearly mimics that of the City of Plymouth at 2.45 persons per household.
Age Distribution Trends Age distribution affects demand for different types of housing since needs and desires change at different stages of the life cycle. Table D-2 shows the distribution of persons within nine age cohorts for Plymouth, Hennepin County, and the Metro Area in 2000 and 2010 with estimates for 2017 and projections for 2022. The 2000 and 2010 age distributions are from the U.S. Cen-sus Bureau and the 2017 and 2022 figures are estimates based on 2017 ESRI data. The following are key points from the table. • In Plymouth between 2000 and 2010, growth occurred in all age cohorts except those under
the age of 18 and the 35 to 44 age cohort. The majority of the growth occurred in those be-tween the ages of 45 to 84.
• The City of Plymouth’s population of 18 to 34 year olds, which consists primarily of renters
and first-time homebuyers, decreased by (-1.5%) between 2000 and 2010, but is expected to increase by 445 people (+1.4%) between 2017 and 2022.
2.59 2.
65
2.35
2.442.
46
2.45
2.42
2.35
2.22
2.59
2.55
2.45
1.90
2.00
2.10
2.20
2.30
2.40
2.50
2.60
2.70
1990 2000 2010 2017
Pers
ons
per H
H
Persons Per Household
Plymouth Hennepin Co. Metro Area

DEMOGRAPHIC ANALYSIS
MAXFIELD RESEARCH AND CONSULTING 10
Estimate Projection
2000 2010 2017 2022Age No. No. No. No. No. Pct. No. Pct.
PlymouthUnder 18 17,866 16,872 17,280 17,572 -994 -5.6 292 1.718 to 24 4,869 4,893 5,346 5,148 24 0.5 -198 -3.725 to 34 9,068 9,566 9,761 10,111 498 5.5 350 3.635 to 44 12,647 9,522 10,108 11,339 -3,125 -24.7 1,231 12.245 to 54 10,622 11,899 10,662 10,338 1,277 12.0 -324 -3.055 to 64 5,835 9,307 11,142 11,146 3,472 59.5 4 0.065 to 74 3,162 4,922 7,208 9,017 1,760 55.7 1,809 25.175 to 84 1,517 2,666 3,367 4,435 1,149 75.7 1,068 31.785 and over 308 929 1,277 1,495 621 201.6 217 17.0Total 65,894 70,576 76,150 80,600 4,682 7.1 4,450 5.8
Hennepin CountyUnder 18 267,502 261,345 271,024 273,071 -6,157 -2.3 2,047 0.818 to 24 108,767 113,551 107,328 106,308 4,784 4.4 -1,020 -1.025 to 34 183,860 187,523 184,257 188,290 3,663 2.0 4,033 2.235 to 44 191,872 154,304 158,247 168,823 -37,568 -19.6 10,576 6.745 to 54 156,068 171,130 155,489 148,085 15,062 9.7 -7,403 -4.855 to 64 85,773 133,758 154,813 154,929 47,985 55.9 117 0.165 to 74 59,737 66,516 97,436 118,501 6,779 11.3 21,066 21.675 to 84 44,942 42,476 46,489 58,608 -2,466 -5.5 12,119 26.185 and over 17,679 21,822 25,778 26,720 4,143 23.4 941 3.7Total 1,116,200 1,152,425 1,200,862 1,243,336 36,225 3.2 42,474 3.5
Metro AreaUnder 18 697,534 700,960 715,248 722,852 3,426 0.5 7,604 1.118 to 24 244,226 263,462 248,229 239,719 19,236 7.9 -8,510 -3.425 to 34 411,155 420,311 430,515 441,179 9,156 2.2 10,663 2.535 to 44 469,324 391,324 394,459 427,843 -78,000 -16.6 33,385 8.545 to 54 363,592 440,753 401,611 375,721 77,161 21.2 -25,890 -6.455 to 64 200,980 326,007 386,615 391,102 125,027 62.2 4,487 1.265 to 74 130,615 163,425 239,535 291,236 32,810 25.1 51,701 21.675 to 84 90,292 97,442 108,833 138,681 7,150 7.9 29,848 27.485 and over 34,338 45,883 54,326 56,553 11,545 33.6 2,227 4.1Total 2,642,056 2,849,567 2,979,370 3,084,885 207,511 7.9 105,515 3.5
Sources: U.S. Census Bureau; ESRI; Maxfield Research & Consulting, LLC
Change
2000-2010 2017-2022
Census
TABLE D-2POPULATION AGE DISTRIBUTION
PLYMOUTH ANALYSIS AREA2000 to 2022

DEMOGRAPHIC ANALYSIS
MAXFIELD RESEARCH AND CONSULTING 11
• The senior age cohorts are projected to have the greatest percentage growth. The 75 to 84
age cohort is forecast to increasing by 1,068 people (+31.7%) in Plymouth between 2017 and 2022. The growth in the senior age cohorts can be primarily attributed to the baby boom generation aging into their senior years.
• The social changes that occurred with the aging of the baby boom generation, such as
higher divorce rates, higher levels of education, and lower birth rates has led to a greater variety of lifestyles than existed in the past – not only among baby boomers, but also among their parents and children. The increased variety of lifestyles has also fueled de-mand for alternative housing products to single-family homes. Seniors, in particular, and middle-aged persons tend to do more traveling and participate in more activities than previ-ous generations, and they increasingly prefer maintenance-free housing that enables them to spend more time on activities outside the home.
17,8
66
4,86
9
9,06
8
12,6
47
10,6
22
5,83
5
3,16
2
1,51
7
308
16,8
72
4,89
3
9,56
6
9,52
2 11,8
99
9,30
7
4,92
2
2,66
6
929
17,5
72
5,14
8
10,1
11 11,3
39
10,3
38
11,1
46
9,01
7
4,43
5
1,49
5
0
2,000
4,000
6,000
8,000
10,000
12,000
14,000
16,000
18,000
20,000
Under 18 18 to 24 25 to 34 35 to 44 45 to 54 55 to 64 65 to 74 75 to 84 85 andover
No.
of P
erso
ns
Age Group
Population Age DistributionCity of Plymouth
2000, 2010, & 2022
2000
2010
2022

DEMOGRAPHIC ANALYSIS
MAXFIELD RESEARCH AND CONSULTING 12
Household Income by Age of Householder The estimated distribution of household incomes in Plymouth for 2017 and 2022 are shown in Table D-3. The data was estimated by Maxfield Research based on income trends provided by ESRI. The data helps ascertain the demand for different housing products based on the size of the market at specific cost levels. The Department of Housing and Urban Development defines affordable housing costs as 30% of a household’s adjusted gross income. For example, a household in Plymouth with the median income of $96,274 per year would be able to afford a monthly housing cost of about $2,407. Maxfield Research uses a figure of 25% to 30% for younger households and 40% or more for seniors, since seniors generally have lower living expenses and can often sell their homes and use the proceeds toward rent payments. A generally accepted standard for affordable owner-occupied housing is that a typical house-hold can afford to pay 3.0 to 3.5 times their annual income on a single-family home. Thus, a $96,274 income would translate to an affordable single-family home of $288,822 to $336959. The higher end of this range assumes that the person has adequate funds for down payment and closing costs, but does not include savings or equity in an existing home which would allow them to purchase a higher priced home. • Plymouth has an estimated median household income of $96,274 in 2017 and is expected
to increase over the next five years to $104,687 in 2022 (+8.7%).
2%
-4%
4%
12%
-3%
0%
25%
32%
17%
-10.0%
-5.0%
0.0%
5.0%
10.0%
15.0%
20.0%
25.0%
30.0%
35.0%
Under 18 18 to 24 25 to 34 35 to 44 45 to 54 55 to 64 65 to 74 75 to 84 85 andover
Pct.
Population Pct. Change by Age Cohort, 2017 to 2022

DEMOGRAPHIC ANALYSIS
MAXFIELD RESEARCH AND CONSULTING 13
$49,553
$81,931
$110,773
$124,490$114,964
$84,386
$45,545
$0
$20,000
$40,000
$60,000
$80,000
$100,000
$120,000
$140,000
0
1,000
2,000
3,000
4,000
5,000
6,000
7,000
Under 25 25-34 35-44 45-54 55-64 65 -74 75+
2017
Med
ian
Inco
me
No.
of H
ouse
hold
s
Age of Householder
Growth and Income Trends by Age of HouseholderCity of Plymouth: 2017 and 2022
2017 2022 2017 Median Income
$0
$20,000
$40,000
$60,000
$80,000
$100,000
$120,000
$140,000
Under 25 25-34 35-44 45-54 55-64 65 -74 75+
Median Household Income, 2017
Plymouth Hennepin Co. Metro Area

DEMOGRAPHIC ANALYSIS
MAXFIELD RESEARCH AND CONSULTING 14
Non-Senior Households • In 2017, 3.1% of non-senior (under age 65) households in Plymouth had incomes under
$15,000 (736 households). All of these households would be eligible for deep-subsidy rental housing. Another 3.8% of Plymouth’s non-senior households had incomes between $15,000 and $24,999 (894 households). Many of these households would qualify for deep-subsidy housing, but many could also afford shallow-subsidy or older market rate rentals. If
Total Under 25 25-34 35-44 45-54 55-64 65 -74 75+
Less than $15,000 1,244 85 166 116 124 244 191 316$15,000 to $24,999 1,659 122 229 179 144 219 319 446$25,000 to $34,999 1,674 109 308 236 188 240 234 358$35,000 to $49,999 2,909 161 546 425 370 405 417 587$50,000 to $74,999 4,536 200 824 692 681 727 740 671$75,000 to $99,999 4,061 123 813 783 667 802 650 222$100,000 to $149,999 6,206 81 967 1,206 1,384 1,445 849 273$150,000 to $199,999 3,775 42 482 888 1,018 853 396 96$200,000+ 5,135 24 377 1,060 1,420 1,493 588 174 Total 31,200 948 4,713 5,585 5,997 6,429 4,384 3,144
Median Income $96,274 $49,553 $81,931 $110,773 $124,490 $114,964 $84,386 $45,545
Less than $15,000 1,293 81 169 127 98 217 220 381$15,000 to $24,999 1,626 120 205 152 113 176 337 522$25,000 to $34,999 1,574 103 274 216 140 191 246 405$35,000 to $49,999 2,718 157 474 373 291 328 433 662$50,000 to $74,999 4,196 191 724 630 515 591 765 779$75,000 to $99,999 4,177 144 818 812 597 742 777 287$100,000 to $149,999 7,142 101 1,098 1,446 1,417 1,511 1,144 425$150,000 to $199,999 4,408 51 571 1,081 1,054 925 570 158$200,000+ 6,041 29 466 1,304 1,484 1,607 873 277 Total 33,175 977 4,799 6,141 5,710 6,286 5,364 3,896
Median Income $104,687 $52,440 $90,152 $120,824 $134,719 $124,353 $96,123 $49,326
Less than $15,000 49 -4 3 11 -26 -28 28 65$15,000 to $24,999 -33 -2 -24 -27 -31 -43 17 76$25,000 to $34,999 -100 -6 -34 -21 -49 -49 12 47$35,000 to $49,999 -192 -4 -72 -51 -78 -77 16 75$50,000 to $74,999 -340 -9 -100 -62 -166 -136 25 108$75,000 to $99,999 116 20 4 29 -70 -61 127 65$100,000 to $149,999 936 20 130 240 33 65 295 152$150,000 to $199,999 633 9 89 192 36 72 174 62$200,000+ 906 5 90 245 64 114 285 103 Total 1,975 29 86 556 -286 -143 980 753
Median Income $8,413 $2,887 $8,221 $10,051 $10,229 $9,389 $11,737 $3,781
Sources: ESRI; Maxfield Research and Consulting LLC
Change - 2017 to 2022
TABLE D-3HOUSEHOLD INCOME BY AGE OF HOUSEHOLDER
CITY OF PLYMOUTH(Number of Households)
2017
2022
2017 and 2022
Age of Householder

DEMOGRAPHIC ANALYSIS
MAXFIELD RESEARCH AND CONSULTING 15
housing costs absorb 30% of income, households with incomes of $15,000 to $24,999 could afford to pay $375 to $625 per month.
• In most geographic areas, household median incomes peak in the 45 to 54 age group and
that group is usually considered to be in their peak earning years. In 2017, the median household income in Plymouth was highest in the 45 to 54 age group at $124,490. The 35 to 44 age group has a median income of $110,773 in 2017. By 2022, the median income for the 35 to 44 and the 45 to 54 age groups are projected to increase to $120,824 (9.1%) and $134,719 (8.2%) respectively. The 55 to 64 age group is projected to increase from $114,964 to 124,353 (+8.2%) by 2022.
• The median estimated home value in Plymouth was roughly $331,263 2017. The income
required to afford a home at this price would be about $94,646 to $110,421 based on the standard of 3.0 to 3.5 times the median income (and assuming these households do not have a high level of debt). About 64% of non-senior households in Plymouth have incomes of $94,646 or more in 2017.
• Incomes are expected to increase by 8.7% between 2017 and 2022 in Plymouth. This
equates to an increase of 1.7% annually. Senior Households • The oldest householders have lower incomes in 2017. In Plymouth, 4.4% of households
ages 65 to 74 had incomes below $15,000, compared to 10.1% of households ages 75 and over. Many of these low-income older senior households rely solely on social security bene-fits. Typically, younger seniors have higher incomes due to the fact they are still able to work or are married couples with two pensions or higher social security benefits. The 2017 median income for Plymouth householders age 65 to 74 and 75+ are $84,386 and $45,545, respectively.
• Generally, senior households with incomes greater than $25,000 will be able to afford mar-
ket rate senior housing in Plymouth. Based on a 40% allocation of income for housing, this translates to monthly rents of at least $833. About 6,255 senior households in Plymouth (83% of senior households) have incomes above $25,000 in 2017.
• The median income for seniors age 65+ in Plymouth is $64,965 in 2017. It is projected to
increase by $7,760 (11.9%) to $72,724 by 2022.

DEMOGRAPHIC ANALYSIS
MAXFIELD RESEARCH AND CONSULTING 16
Net Worth Table D-4 shows household net worth in the Plymouth in 2017. Simply stated, net worth is the difference between assets and liabilities, or the total value of assets after the debt is sub-tracted. The data was compiled and estimated by ESRI based on the Survey of Consumer Fi-nances and Federal Reserve Board data. According to data released by the National Association of Realtors, the average American homeowner has a net worth about 31 to 46 times greater than that of a renter and that in 2016 the average American homeowner net worth is estimated at 44 times greater than that of a renter. The Federal Reserve survey is conducted every three years and this research was based on the 2016 Federal Reserve survey that showed the median net worth of a homeowner was $231,400, whereas the median net worth of a renter was $5,200.
• Plymouth had a median net worth of $300,121. Median net worth is generally a more accu-
rate depiction of wealth than the average figure. A few households with very large net worth can significantly skew the average.
• Similar to household income, net worth increases as households age and decreases after
they pass their peak earning years and move into retirement. Median and average net worth usually peak in the 65 to 74 age cohort. The median net worth in the Plymouth for age cohorts 45+ was $250,001 in 2017. Senior households usually have higher net worth due to their saving investments, and other retirement funds.
• Households often delay purchasing homes and instead choose to rent until they acquire suf-
ficient assets to cover the costs of a down payment and closing costs associated with home ownership. Lending has recently become slightly easier for obtaining mortgages making mortgages with little or no down payments easier to obtain in today’s mortgage lending en-vironment than it has been the past year.

DEMOGRAPHIC ANALYSIS
MAXFIELD RESEARCH AND CONSULTING 17
Total Under 25 25-34 35-44 45-54 55-64 65 -74 75+
Less than $15,000 4,467 569 1,639 845 522 457 187 248$15,000 to $34,999 1,659 174 647 384 207 137 35 75$35,000 to $49,999 921 65 274 256 126 111 54 35$50,000 to $99,999 2,529 48 544 763 414 303 225 232$100,000 to $149,999 1,887 21 312 430 333 285 296 210$150,000 to $249,999 2,774 39 417 491 519 519 344 445$250,000 or more 16,917 29 875 2,408 3,866 4,608 3,238 1,893 Subtotal 31,154 945 4,708 5,577 5,987 6,420 4,379 3,138Median Net Worth $300,121 $12,456 $38,090 $166,936 $250,001 $250,001 $250,001 $250,001Average Net Worth $1,131,424 $47,550 $200,338 $955,295 $1,206,892 $1,638,739 $1,853,387 $977,683
Less than $15,000 132,117 19,322 43,495 24,521 17,113 14,620 6,359 6,687$15,000 to $34,999 34,398 2,952 11,846 7,426 5,022 3,770 1,460 1,922$35,000 to $49,999 17,939 826 5,123 4,732 2,584 2,329 1,587 758$50,000 to $99,999 47,217 984 10,944 12,291 7,946 6,303 4,382 4,367$100,000 to $149,999 31,797 380 5,725 6,680 5,433 5,159 4,638 3,782$150,000 to $249,999 47,720 506 6,567 8,915 8,923 9,301 6,165 7,343$250,000 or more 200,417 466 10,094 26,211 45,420 54,365 38,338 25,523 Subtotal 511,605 25,436 93,794 90,776 92,441 95,847 62,929 50,382Median Net Worth $135,412 $9,873 $18,709 $80,165 $237,865 $250,001 $250,001 $250,001Average Net Worth $762,132 $32,697 $123,008 $574,227 $863,354 $1,221,915 $1,415,366 $782,457
Less than $15,000 258,474 33,663 82,288 48,562 35,172 30,573 13,515 14,701$15,000 to $34,999 73,876 6,326 24,863 16,292 10,749 8,282 3,000 4,364$35,000 to $49,999 40,005 1,932 10,851 10,746 5,829 5,349 3,540 1,758$50,000 to $99,999 114,601 2,829 27,811 29,767 19,004 14,762 10,392 10,036$100,000 to $149,999 80,910 1,038 16,128 17,249 13,746 12,508 11,717 8,524$150,000 to $249,999 124,765 1,269 18,267 25,466 24,231 23,335 15,213 16,984$250,000 or more 505,472 1,026 25,484 69,833 122,953 137,329 93,804 55,043 Total 1,198,103 48,083 205,692 217,915 231,684 232,138 151,181 111,410Median Net Worth $168,704 $10,713 $29,794 $108,223 $250,001 $250,001 $250,001 $244,387Average Net Worth $773,328 $37,913 $138,556 $577,985 $872,106 $1,209,626 $1,376,580 $711,663
Sources: ESRI; Maxfield Research & Consulting, LLC
Hennepin County
Metro Area
TABLE D-4NET WORTH BY AGE OF HOUSEHOLDER
PLYMOUTH ANALYSIS AREA2017
Age of Householder
Plymouth

DEMOGRAPHIC ANALYSIS
MAXFIELD RESEARCH AND CONSULTING 18
Tenure by Household Income Table D-5 shows household tenure by income for Plymouth in 2015. Data is an estimate from the American Community Survey. Household tenure information is important to assess the propensity for owner-occupied or renter-occupied housing options based on household afford-ability. As stated earlier, the Department of Housing and Urban Development determines af-fordable housing as not exceeding 30% of the household’s income. The higher the income, the lower percentage a household typically allocates to housing. Many lower income households, as well as many young and senior households spend more than 30% of their income, while mid-dle-aged households in their prime earning years typically allocate 20% to 25% of their income.
• Typically, as income increases, so does the rate of homeownership. This can be seen in the
Plymouth, where the homeownership rate increases from 33.3% of households with in-comes below $15,000 to 89.6% of households with incomes above $100,000.
$0
$50,000
$100,000
$150,000
$200,000
$250,000
$300,000
Under 25 25-34 35-44 45-54 55-64 65 -74 75+
Net
Wor
th
Age
Median Net Worth by Age of Householder, 2017
Plymouth Hennepin County Metro Area
No. Pct. No. Pct. No. Pct. No. Pct. No. Pct. No. Pct.
Less than $15,000 499 33.3 1,000 66.7 11,286 23.0 37,812 77.0 26,809 41.5 37,812 58.5$15,000 to $24,999 1054 55.4 847 44.6 14,948 36.4 26,089 63.6 35,265 57.5 26,089 42.5$25,000 to $34,999 1,136 56.6 871 43.4 17,827 44.0 22,701 56.0 44,018 66.0 22,701 34.0$35,000 to $49,999 1,761 55.9 1,388 44.1 30,782 52.4 27,952 47.6 78,573 73.8 27,952 26.2$50,000 to $74,999 2,702 56.5 2,081 43.5 51,925 62.3 31,379 37.7 139,502 81.6 31,379 18.4$75,000 to $99,999 2,780 71.4 1,116 28.6 46,933 73.6 16,859 26.4 128,280 88.4 16,859 11.6$100,000+ 11,680 89.6 1,352 10.4 133,694 87.0 20,009 13.0 332,965 94.3 20,009 5.7Total 21,612 71.4 8,655 28.6 307,395 62.7 182,801 37.3 785,412 81.1 182,801 18.9
Source: U.S. Census Bureau; American Community Survey; Maxfield Research & Copnsulting, LLC
Own Rent
Hennepin County
Own Rent Own Rent
City of Plymouth
TABLE D-5TENURE BY HOUSEHOLD INCOME
PLYMOUTH ANALYSIS AREA2015
Metro Area

DEMOGRAPHIC ANALYSIS
MAXFIELD RESEARCH AND CONSULTING 19
• A portion of renter households that are referred to as lifestyle renters, or those who are fi-
nancially-able to own but choose to rent, have household incomes of $50,000 or more (about 53% of the Plymouth’s renters in 2015). Households with incomes below $15,000 are typically a market for deep subsidy rental housing (about 11% of the Plymouth’s renters in 2015).
Median Household Income by Census Tract The map on the following page shows median household income by census tract in Plymouth in 2016. Geographic Information System (GIS) data was provided through ESRI, a national de-mographics and GIS service provider. Below are key points from the map. • Census tracts with the highest median income tend to be located on the west and north
sides of Plymouth. Median incomes in Plymouth ranged from $146,581 on the high end to $55,838 on the low end.
• Within the central section of the city and in two census tracts bordering US-Hwy 169, on the eastside of Plymouth, are the areas with the lowest median incomes. These three tracts all had median incomes below $65,000 in 2016.

DEMOGRAPHIC ANALYSIS
MAXFIELD RESEARCH AND CONSULTING 20
2016 Median Income by Census Tract

DEMOGRAPHIC ANALYSIS
MAXFIELD RESEARCH AND CONSULTING 21
Tenure by Age of Householder Table D-6 shows the number of owner and renter households in Plymouth by age group in 2000, 2010 and 2015. This data is useful in determining demand for certain types of housing since housing preferences change throughout an individual’s life cycle. The following are key findings from Table D-6. • In 2000, 76.5% of all households in the Plymouth owned their housing. By 2010, that per-
centage declined to 72.4% and in 2015 it is estimated that 71.4% of all Plymouth house-holds owned their housing.
• The housing market downturn contributed to the decrease in the homeownership rate during the late 2000s as it became more difficult for households to secure mortgage loans, households delayed purchasing homes due to the uncertainty of the housing market, and foreclosures forced households out of their homes. Currently it is estimated that there is a growing trend of lifestyle renters seeking rental properties in the Plymouth area and Metro Area as can be seen by the growing percentage of renters.
8%
36%
67%
82%87% 89%
81%
64%
0%10%20%30%40%50%60%70%80%90%100%
0
1,000
2,000
3,000
4,000
5,000
6,000
15 - 24 25 - 34 35 - 44 45 - 54 55 - 64 65 - 74 75-84 85+
HO R
ate
Hous
ehol
ds
Tenure by Age of HouseholderCity of Plymouth, 2015
Renters Owners Homeownership Rate

DEMOGRAPHIC ANALYSIS
MAXFIELD RESEARCH AND CONSULTING 22
Age No. Pct. No. Pct. No. Pct. No. Pct. No. Pct. No. Pct. No. Pct. No. Pct. No. Pct.
15-24 Own 148 13.7 95 10.1 44 7.6 3,380 11.8 2,790 10.9 1,458 6.8 9,790 17.3 7,947 16.0 4,963 11.6Rent 934 86.3 843 89.9 536 92.4 25,252 88.2 22,734 89.1 19,949 93.2 46,699 82.7 41,789 84.0 37,764 88.4Total 1,082 100.0 938 100.0 580 100.0 28,632 100.0 25,524 100.0 21,407 100.0 56,489 100.0 49,736 100.0 42,727 100.0
25-34 Own 2,269 52.0 2,003 42.5 1,839 35.9 44,563 46.9 39,850 42.3 38,814 39.0 114,071 55.5 102,236 50.6 98,991 46.7Rent 2,092 48.0 2,714 57.5 3,283 64.1 50,435 53.1 54,312 57.7 60,755 61.0 91,342 44.5 99,716 49.4 112,759 53.3Total 4,361 100.0 4,717 100.0 5,122 100.0 94,998 100.0 94,162 100.0 99,569 100.0 205,413 100.0 201,952 100.0 211,750 100.0
35-44 Own 5,538 81.6 3,769 71.6 3,562 67.2 79,041 72.5 57,684 66.6 54,874 62.6 203,729 77.7 154,678 72.3 143,886 68.1Rent 1,249 18.4 1,495 28.4 1,735 32.8 29,926 27.5 28,946 33.4 32,721 37.4 58,438 22.3 59,303 27.7 67,401 31.9Total 6,787 100.0 5,264 100.0 5,297 100.0 108,967 100.0 86,630 100.0 87,595 100.0 262,167 100.0 213,981 100.0 211,287 100.0
45-54 Own 5,267 87.8 5,557 82.4 5,220 81.6 74,037 79.7 75,651 75.4 70,987 73.9 177,090 83.1 202,404 79.8 192,198 78.4Rent 733 12.2 1,190 17.6 1,179 18.4 18,829 20.3 24,688 24.6 25,107 26.1 36,077 16.9 51,379 20.2 52,855 21.6Total 6,000 100.0 6,747 100.0 6,399 100.0 92,866 100.0 100,339 100.0 96,094 100.0 213,167 100.0 253,783 100.0 245,053 100.0
55-64 Own 3,136 90.5 4,742 86.6 5,205 87.3 42,671 81.9 65,466 79.5 69,927 77.6 102,583 84.9 162,595 82.6 174,794 80.9Rent 328 9.5 733 13.4 760 12.7 9,412 18.1 16,891 20.5 20,226 22.4 18,205 15.1 34,355 17.4 41,383 19.1Total 3,464 100.0 5,475 100.0 5,965 100.0 52,083 100.0 82,357 100.0 90,153 100.0 120,788 100.0 196,950 100.0 216,177 100.0
65-74 Own 1,693 87.0 2,706 89.0 3,428 89.0 30,672 81.2 34,028 80.0 40,246 79.5 68,030 82.4 85,347 82.6 100,740 82.5Rent 254 13.0 336 11.0 423 11.0 7,090 18.8 8,502 20.0 10,382 20.5 14,491 17.6 17,998 17.4 21,409 17.5Total 1,947 100.0 3,042 100.0 3,851 100.0 37,762 100.0 42,530 100.0 50,628 100.0 82,521 100.0 103,345 100.0 122,149 100.0
75-84 Own 812 81.8 1,465 80.5 1,666 81.4 22,083 72.8 21,975 75.6 21,813 75.2 43,576 71.8 50,083 75.6 50,917 75.7Rent 181 18.2 354 19.5 381 18.6 8,242 27.2 7,108 24.4 7,209 24.8 17,109 28.2 16,185 24.4 16,330 24.3Total 993 100.0 1,819 100.0 2,047 100.0 30,325 100.0 29,083 100.0 29,022 100.0 60,685 100.0 66,268 100.0 67,247 100.0
85+ Own 131 70.4 419 63.4 648 64.4 5,346 50.9 8,677 56.8 9,276 59.0 10,097 49.9 17,185 54.2 18,923 56.0Rent 55 29.6 242 36.6 358 35.6 5,150 49.1 6,611 43.2 6,452 41.0 10,127 50.1 14,549 45.8 14,841 44.0Total 186 100.0 661 100.0 1,006 100.0 10,496 100.0 15,288 100.0 15,728 100.0 20,224 100.0 31,734 100.0 33,764 100.0
TOTAL Own 18,994 76.5 20,756 72.4 21,612 71.4 301,793 66.2 306,121 64.3 307,395 62.7 728,966 71.4 782,475 70.0 785,412 68.3Rent 5,826 23.5 7,907 27.6 8,655 28.6 154,336 33.8 169,792 35.7 182,801 37.3 292,488 28.6 335,274 30.0 364,742 31.7Total 24,820 100.0 28,663 100.0 30,267 100.0 456,129 100.0 475,913 100.0 490,196 100.0 1,021,454 100.0 1,117,749 100.0 1,150,154 100.0
* 2015 data is from the American Community Survey
Sources: U.S. Census Bureau; Maxfield Research & Consulting, LLC
TABLE D-6TENURE BY AGE OF HOUSEHOLDER
PLYMOUTH ANALYSIS AREA2000 - 2015
2015*20002015*
City of Plymouth
2000
Metro AreaHennepin County
2015*20002010 2010 2010

DEMOGRAPHIC ANALYSIS
MAXFIELD RESEARCH AND CONSULTING 23
• As households progress through their life cycle, housing needs change. The proportion of renter households decreases significantly as households’ age out of their young-adult years. However, by the time households reach their senior years, rental housing often be-comes a more viable option than homeownership, reducing the responsibility of mainte-nance and a financial commitment.
• In 2015, ACS estimated that 92.4% of the Plymouth’s households between the ages of 15
and 24 rented their housing, compared to 64.1% of households between the ages of 25 and 34. Householders between 35 and 84 were overwhelmingly homeowners, with no more than 32.8% of the householders in each 10-year age cohort renting their housing.
• The higher homeownership rates in Plymouth (71.4%) compared to Hennepin County
(62.7%), and the Metro Area (68.3%) reflects the suburban character of the City and was originally developed as a single-family housing community.
Household Type Table D-7 shows a breakdown of the type of households present in Plymouth in 2010 and 2015. The data is useful in assessing housing demand since the household composition often dictates the type of housing needed and preferred. • Between 2010 and 2015, Plymouth experienced an increase in all household types besides
Other Family households, which decreased by -2.8%. Married families without children grew the most numerically, adding +1,101 households (+12.3%), The increase in households married without children can be attributed to couples waiting longer to have children, and the baby boomers aging into empty nester years.
• The differences between Plymouth compared to Hennepin County and the Twin Cities Metro Area reflect the demographic changes that were seen in Table D-2 Population Age Distribution. The aging of baby boomers is increasing the Married without child category and decreasing the Married with Child category. The Other category (Single-parent families, unmarried couples with children) is also increasing at a higher rate in Plymouth, but is catching up to a similar distribution of Other households as compared to Hennepin County and the Twin Cities Metro Area. Roommates are accounting for smaller percentages in all areas which shows that economic conditions are changing in the area for households with more households seeking Living Alone options and more households are considered Family Households in Plymouth in 2015 than there was in 2010

DEMOGRAPHIC ANALYSIS
MAXFIELD RESEARCH AND CONSULTING 24
Number of Households 2010 2015 2010 2015 2010 2015 2010 2015 2010 2015 2010 2015
Plymouth 28,663 30,267 8,971 10,072 6,955 7,200 3,304 3,212 7,569 7,886 1,864 1,897
Hennepin County 475,913 490,196 116,099 123,135 89,084 92,038 67,702 68,773 155,807 160,687 47,221 45,563Twin Cities Metro Area 1,117,749 1,150,154 298,723 316,180 244,687 247,506 164,086 167,069 319,030 331,010 91,223 88,389
Percent of TotalPlymouth 100% 100% 31.3% 33.3% 24.3% 23.8% 11.5% 10.6% 26.4% 26.1% 6.5% 6.3%
Hennepin County Total 100% 100% 24.4% 25.1% 18.7% 18.8% 14.2% 14.0% 32.7% 32.8% 9.9% 9.3%Twin Cities Metro Area Total 100% 100% 26.7% 27.5% 21.9% 21.5% 14.7% 14.5% 28.5% 28.8% 8.2% 7.7%
* Single-parent families, unmarried couples with children.
Sources: U.S. Census Bureau; Maxfield Research & Consulting, LLC
Married w/o Child Married w/ Child RoommatesTotal HH's Other * Living Alone
HOUSEHOLD TYPE
Non-Family HouseholdsFamily Households
TABLE D-7
PLYMOUTH ANALYSIS AREA2010 & 2015
6,95
5
8,97
1
3,30
4
7,56
9
1,86
4
7,20
0
10,0
72
3,21
2
7,88
6
1,89
7
0
2,000
4,000
6,000
8,000
10,000
12,000
Married with Child Married w/o Child Other Family Living Alone Roommates
Hous
ehol
ds
Household TypePlymouth
2010 and 2015
2010
2015

DEMOGRAPHIC ANALYSIS
MAXFIELD RESEARCH AND CONSULTING 25
Tenure by Household Size Table D-8 shows the distribution of households by size and tenure in the Plymouth in 2015 and 2010. This data is useful in that it sheds insight into the number of units by unit type that may be most needed in Plymouth.
• Household size for renters tends to be smaller than for owners. This trend is a result of the
typical market segments for rental housing, including households that are younger and are less likely to be married with children as well as older adults and seniors who choose to downsize from their single-family homes. In 2015, approximately 40% of the total renter-occupied households in the Plymouth were one-person households.
• Approximately 68% of renter households in Plymouth in 2015 have either one or two peo-
ple. The one-person households would primarily seek one-bedroom units and two-person households that are couples would primarily seek one-bedroom units. Two-person house-holds that consist of a parent and child or roommate would primarily seek two-bedroom units. Larger households would seek units with multiple bedrooms.
Age Owners Pct. Renters Pct. Owners Pct. Renters Pct. Owners Pct. Renters Pct.
1PP Household 4,705 59.7 3,181 40.3 78,491 48.8 82,196 51.2 175,681 53.1 155,329 46.92PP Household 8,649 75.9 2,746 24.1 114,302 69.7 49,741 30.3 287,943 74.5 98,732 25.53PP Household 3,382 68.8 1,531 31.2 46,133 67.5 22,257 32.5 124,856 72.6 47,146 27.44PP Household 3,404 80.6 818 19.4 42,974 73.8 15,250 26.2 122,186 78.7 33,141 21.35PP Household 1,122 82.0 247 18.0 16,681 70.4 7,022 29.6 49,255 74.3 17,005 25.76PP Household 239 67.1 117 32.9 5,398 60.7 3,495 39.3 15,930 68.3 7,398 31.7
7PP+ Household 111 88.1 15 11.9 3,416 54.6 2,840 45.4 9,561 61.5 5,991 38.5Total 21,612 71.4 8,655 28.6 307,395 62.7 182,801 37.3 785,412 68.3 364,742 31.7
Average HH Size
Age Owners Pct. Renters Pct. Owners Pct. Renters Pct. Owners Pct. Renters Pct.
1PP Household 4,445 58.7 3,124 41.3 77,198 49.5 78,609 50.5 171,241 53.7 147,789 46.32PP Household 7,888 75.2 2,597 24.8 112,157 71.5 44,706 28.5 280,552 76.3 87,139 23.73PP Household 3,266 74.1 1,143 25.9 47,338 70.3 20,044 29.7 128,197 75.1 42,563 24.94PP Household 3,474 83.7 677 16.3 42,878 76.3 13,330 23.7 123,219 80.6 29,587 19.45PP Household 1,234 83.9 237 16.1 16,863 71.7 6,653 28.3 50,854 77.4 14,883 22.66PP Household 334 80.5 81 19.5 5,442 62.6 3,255 37.4 16,887 71.0 6,908 29.0
7PP+ Household 115 70.6 48 29.4 4,245 57.1 3,195 42.9 11,525 64.3 6,405 35.7Total 20,756 72.4 7,907 27.6 306,121 64.3 169,792 35.7 782,475 70.0 335,274 30.0
Average HH Size
TABLE D-8TENURE BY HOUSEHOLD SIZEPLYMOUTH ANALYSIS AREA
2010 & 2015
2015
Sources: U.S. Census; Maxfield Research & Consutling, LLC
City of Plymouth Hennepin County Metro Area
2.37 2.02 2.52 2.18 2.63 2.19
City of Plymouth Hennepin County Metro Area
2.37 1.86 2.51 2.12 2.64 2.18
2010

DEMOGRAPHIC ANALYSIS
MAXFIELD RESEARCH AND CONSULTING 26
• One-person households in the Plymouth have the highest percentage of renters among all household types. Seven-person plus households have the lowest renter percentage among all household types (11.9%).
Diversity The population distribution by race, Table D-9 presents the diversity of the population in Plym-outh and Hennepin County for 2010 and 2015. The data was obtained from the U.S. Census. • In 2015, “White Alone” comprised the largest proportion of the population in Plymouth
(83.2%), Hennepin County (74.3%), and the Metro Area (78.2%). The percentage has de-creased since 2010 where “White Alone” was 84.2% in Plymouth, 74.4% in Hennepin County, and 78.8% in the Metro Area.
• U.S. Census respondents that list themselves ethnically as Hispanic or Latino, racially list themselves in various race categories. As of 2015, 3.8% of Plymouth’s population was His-panic/Latino. The Hispanic/Latino population was 3.0% of Plymouth’s population in 2010.
• The race “Asian Alone” experienced the largest percentage growth between 2010 and 2015 in Plymouth, increasing by +1.4% from 4,888 to 6,112 people.
0.0%5.0%
10.0%15.0%20.0%25.0%30.0%35.0%40.0%45.0%
1PPHousehold
2PPHousehold
3PPHousehold
4PPHousehold
5PPHousehold
6PPHousehold
7PP+Household
Renter Household SizeCity of Plymouth
2010 2015

DEMOGRAPHIC ANALYSIS
MAXFIELD RESEARCH AND CONSULTING 27
NUMBER 2010 2015 2010 2015 2010 2015 2010 2015 2010 2015 2010 2015 2010 2015 2010 2015
Plymouth 59,460 61,450 3,704 3,756 188 315 22 0 4,888 6,112 717 362 1,597 1,901 2,117 2,772Hennepin County 856,834 889,634 136,262 145,718 10,591 8,273 506 475 71,905 81,406 38,878 30,305 37,449 41,965 77,676 81,719Metro Area 2,246,356 2,309,380 238,723 257,069 20,219 17,200 1,262 1,164 183,421 207,088 74,516 61,390 84,383 98,823 167,558 179,371
PERCENTAGE
Plymouth 84.2% 83.2% 5.2% 5.1% 0.3% 0.4% 0.03% 0.00% 6.9% 8.3% 1.0% 0.5% 2.3% 2.6% 3.0% 3.8%Hennepin County 74.4% 74.3% 11.8% 12.2% 0.9% 0.7% 0.0% 0.0% 6.2% 6.8% 3.4% 2.5% 3.2% 3.5% 6.7% 6.8%Metro Area 78.8% 78.2% 8.4% 8.7% 0.7% 0.6% 0.0% 0.0% 6.4% 7.0% 2.6% 2.1% 3.0% 3.3% 5.9% 6.1%
1 US Census respondents list themselves ethnically Hispanic or Latino and racially in one of the other listed categories.
Hispanic or Latino 1
Ethnicity not RaceTwo or More Races
Alone
2010 and 2015PLYMOUTH ANALYSIS AREA
POPULATION DISTRIBUTION BY RACE TABLE D-9
Sources: U.S. Census Bureau ACS; Maxfield Research and Consulting LLC
White AloneBlack or African American Alone
American Indian and Alaska Native
Alone (AIAN)
Native Hawaiian and Pacific Islander
Alone (NHPI)Asian Alone Some Other Race

DEMOGRAPHIC ANALYSIS
MAXFIELD RESEARCH AND CONSULTING 28
Mobility in the Past Year Table D-10 shows the mobility patterns of Plymouth residents within a one-year time frame (2015 is the last year available). • The majority of residents in the Plymouth (84.7%) did not move within the last year.
• Of the remaining 15.3% of residents that moved within the last year, approximately 3.7%
moved from outside of Hennepin County but within Minnesota and 8.4% were intra-county moves (i.e. one location in Hennepin County to another Hennepin County location).
• A greater proportion of younger age cohorts (a large student population) tended to move
compared to older age cohorts. Approximately 30.7% of those age 18 to 24 moved within the last year compared to 9.6% of those age 75+.
Demographic Comparison Table D-11, on the following page, provides a demographic summary that compares the City of Plymouth to neighboring cities in the Metro Area.
City of PlymouthAge No. Pct. No. Pct. No. Pct. No. Pct. No. Pct.
Under 18 13,171 84.3% 1,518 9.7% 378 2.4% 331 2.1% 222 1.4%18 to 24 3,110 69.3% 736 16.4% 465 10.4% 162 3.6% 15 0.3%25 to 34 7,418 67.6% 1,798 16.4% 1,008 9.2% 528 4.8% 216 2.0%35 to 44 7,982 82.8% 960 10.0% 367 3.8% 191 2.0% 141 1.5%45 to 54 10,110 91.4% 519 4.7% 188 1.7% 235 2.1% 5 0.0%55 to 64 9,897 95.4% 226 2.2% 97 0.9% 138 1.3% 15 0.1%65 to 74 5,956 95.4% 180 2.9% 44 0.7% 23 0.4% 42 0.7%75+ 4,088 90.4% 191 4.2% 174 3.8% 23 0.5% 46 1.0%Total 61,732 84.7% 6,128 8.4% 2,721 3.7% 1,631 2.2% 702 1.0%
Sources: 2010-2015 American Community Survey; Maxfield Research and Consulting LLC
Same House Within Same County AbroadDifferent County Same
StateDifferent State
Moved
TABLE D-10MOBILITY ESTIMATE IN THE PAST YEAR BY AGE FOR CURRENT RESIDENCE
PLYMOUTH ANALYSIS AREA2015
Not Moved

DEMOGRAPHIC ANALYSIS
MAXFIELD RESEARCH AND CONSULTING 29
Demographic SummaryNum Pct. Num Pct. Num Pct. Num Pct. Num Pct. Num Pct. Num Pct. Num Pct.
Total Population and HouseholdsPopulation (2017)Households (2017)
Age Distribution (2017)Under 25 22,626 29.7% 20,637 32.0% 14,677 28.5% 5,420 25.2% 22,300 32.2% 2,015 32.2% 13,416 25.5% 12,855 26.2%25 to 34 9,761 12.8% 8,045 12.5% 4,322 8.4% 2,126 9.9% 8,729 12.6% 494 7.9% 6,027 11.4% 10,152 20.7%35 to 44 10,108 13.3% 8,843 13.7% 5,242 10.2% 2,568 11.9% 10,181 14.7% 608 9.7% 5,911 11.2% 6,889 14.1%45 to 54 10,662 14.0% 9,649 14.9% 7,024 13.6% 2,983 13.9% 10,612 15.3% 1,094 17.5% 7,103 13.5% 5,910 12.1%55 to 64 11,142 14.6% 9,608 14.9% 7,771 15.1% 3,406 15.8% 9,873 14.2% 1,074 17.2% 8,988 17.1% 5,738 11.7%65 to 74 7,208 9.5% 5,048 7.8% 5,867 11.4% 2,429 11.3% 5,377 7.8% 625 10.0% 6,304 12.0% 3,784 7.7%75+ 4,644 6.1% 2,715 4.2% 6,573 12.8% 2,611 12.1% 2,270 3.3% 351 5.6% 4,915 9.3% 3,645 7.4%
Household Income (2017)Average Household IncomeMedian Household Income
Net Worth (2017)Average Net WorthMedian Net Worth
Household Tenure (2015)Owner 21,612 71.4% 17,776 72.8% 15,327 73.4% 6,851 76.9% 21,019 84.4% 1,735 93.6% 15,995 70.5% 12,705 56.8%Renter 8,655 28.6% 6,643 27.2% 5,554 26.6% 2,054 23.1% 3,885 15.6% 119 6.4% 6,681 29.5% 9,662 43.2%
Household Type (2010)Married With Children 6,955 24.3% 6,834 28.6% 4,955 20.7% 1,648 18.7% 7,123 31.1% 626 36.8% 4,306 19.7% 3,084 14.2%Married Without Children 8,971 31.3% 7,091 29.6% 6,153 25.7% 2,784 31.6% 7,508 32.8% 640 37.6% 7,104 32.4% 4,647 21.4%Other 3,304 11.5% 2,592 10.8% 1,810 7.6% 985 11.2% 2,591 11.3% 120 7.1% 2,209 10.1% 2,728 12.5%Living Alone 7,569 26.4% 6,004 25.1% 6,851 28.6% 2,682 30.4% 4,415 19.3% 266 15.6% 6,821 31.1% 8,716 40.1%Roommates 1,864 6.5% 1,409 5.9% 903 3.8% 717 8.1% 1,230 5.4% 50 2.9% 1,461 6.7% 2,568 11.8%
Source: U.S. Census Bureau; ESRI; Maxfield Research, Inc.
48,97323,440
69,34025,516
6,2592,164
52,66423,054
76,15031,200
64,54525,205
21,5369,260
51,47622,121
$136,890$103,684
$1,046,325$333,183
$92,219$69,125
$546,693$110,945$306,465
$1,275,545
$88,511$124,916$144,691
$92,620
$1,782,745$363,665
$129,033 $117,872$96,274 $89,183
$500,001$1,472,410$1,131,424 $1,323,912
$300,121 $325,546 $393,432$1,123,496
$102,799$130,196 $162,377
$107,270
TABLE D-11DEMOGRAPHIC COMPARISON
PLYMOUTH ANALYSIS AREA
Maple Grove Minnetonka St. Louis ParkMedinaPlymouth Golden ValleyEden Prairie Edina

DEMOGRAPHIC ANALYSIS
MAXFIELD RESEARCH AND CONSULTING 30
Summary of Demographic Trends The following points summarize key demographic trends that will impact demand for housing throughout the Plymouth. • The City of Plymouth experienced a population increase between 2000 and 2017, by gaining
an estimated 10,256 people (+15.6%), and 6,380 households (+25.7%). • Between 2010 and 2040, Plymouth’s population is expected to increase by +20.6% (+14,524
people) while the number of households is expected to increase by +15.7% (+4,718 house-holds). The City of Plymouth can expect to see continued population growth since it is lo-cated near employment opportunities and urban services that would support residential de-velopment. More people will choose to locate near their place of work as increasing trans-portation costs increase the desirability of living close to employment. As the amount of buildable land starts to dwindle within Plymouth, the City will need to consider options to support housing growth such as changes to building or zoning restrictions.
• In the City of Plymouth, growth is projected to occur in all age cohorts except the 18 to 24
year olds (-3.7%), 45 to 54 year olds (-3.0%), and 55 to 64 year olds (0.0%) between 2017 and 2022. The greatest percentage growth is projected to occur among seniors 75 to 84 year olds (+31.7%).
• Plymouth has an estimated median household income of $96,274 in 2017 and is projected to increase over the next five years to $104,687. There are 736 non-senior households (3.1% of households with incomes less than $15,000) eligible for deep-subsidy rental hous-ing. Median incomes for households in Plymouth peak at $124,490 for the 45 to 54 age group in 2017. Incomes are expected to increase by 8.2% (1.6% annually) between 2017 and 2022 in the Plymouth.
• Plymouth had an average net worth of $1,131,424 in 2017 and a median net worth of $300,121. Median net worth is generally a more accurate depiction of wealth than the av-erage figure. A few households with very large net worth can significantly skew the aver-age.
• Typically, as income increases, so does the rate of homeownership. Homeownership in the
Plymouth increases from 33.3% of households with incomes below $15,000 to 89.6% of households with incomes above $100,000.
• Between 2010 and 2015, Plymouth experienced an increase in all household types besides
Other Family households, which decreased by -2.8%. Married families without children grew the most numerically, adding +1,101 households (+12.3%), The increase in households married without children can be attributed to couples waiting longer to have children, and the baby boomers aging into empty nester years.

DEMOGRAPHIC ANALYSIS
MAXFIELD RESEARCH AND CONSULTING 31
• An estimated 68.5% of renter households in Plymouth in 2015 had either one or two peo-
ple.
• In 2015, “White Alone” (83.2%) comprised the largest proportion of the population in Plym-outh. The race “Asian Alone” experienced the largest percentage growth between 2010 and 2015 in Plymouth, increasing by +1.4% from 4,888 to 6,112 people.
• Of Plymouth residents that moved in the past year, approximately 3.7% moved from out-
side of Hennepin County but within Minnesota and 8.4% were intra-county moves.

EMPLOYMENT
MAXFIELD RESEARCH AND CONSULTING 32
Employment Trends Since employment growth generally fuels household growth, employment trends are a reliable indicator of housing demand. Typically, households prefer to live near work for convenience. However, housing is often less expensive in smaller towns, making commuting from outlying communities to work in larger employment centers attractive for households concerned about housing affordability. Employment Growth and Projections Table E-1 shows projected employment growth in Plymouth, Hennepin County, and the Twin Cities Metro Area. Table E-1 shows employment growth trends and projections from 2000 to 2040 based on the most recent Minnesota Department of Employment and Economic Develop-ment (DEED) and Metropolitan Council employment outlook projections.
• There was an estimated total of 49,414 jobs in Plymouth in 2015, which was 5.6% of the
Hennepin County total (883,488 jobs).
• The number of jobs in Plymouth is projected to grow by 8,019 jobs from 2010 through 2020 (17.5%). This projection is higher than what is expected for Hennepin County (15.1%) and the Twin Cities Metro Area (16.5%). Between 2010 and 2015 it is estimated that Plymouth added 3,533 jobs. Job creation in Plymouth continues to grow, making Plymouth more ap-pealing for housing.
• Plymouth’s employment is anticipated to increase by 7.1% between 2020 and 2030 and is
forecast to increase another 7.1% between 2030 and 2040.
2000* 2010* 2015* 2020 2030 2040 No. Pct. No. Pct. No. Pct.
Plymouth 53,206 45,881 49,414 53,900 57,700 61,500 -7,325 -13.8% 8,019 17.5% 3,800 7.1%
Hennepin County 874,882 803,733 883,488 924,710 981,800 1,038,140 -71,149 -8.1% 120,977 15.1% 57,090 6.2%
Twin Cities Metro Area 1,600,741 1,537,041 1,675,271 1,791,080 1,913,050 2,032,660 -63,700 -4.0% 254,039 16.5% 121,970 6.8%
*Values from 2000, 2010, 2015 Data is from MNDEED Quarterly Census of Employment and WagesNote: Twin Cities Metro represents the 7-County planning regionSources: MN Dept of Employment and Economic Development; Metropolitan Council; Maxfield Research & Consulting, LLC.
2000-2010 2020-2030
TABLE E-1EMPLOYMENT GROWTH TRENDS AND PROJECTIONS
PLYMOUTH ANALYSIS AREA2000-2040
Employment Change
2010-2020Actual Forecast

EMPLOYMENT
MAXFIELD RESEARCH AND CONSULTING 33
Resident Labor Force Recent employment growth trends are shown in Tables E-2 and E-3. Table E-2 presents resi-dent employment data for the City of Plymouth from 2000 through June 2017. These numbers were derived from the proportion of jobs in Plymouth as compared to Hennepin County, the State of Minnesota, and the United States. Resident employment data is calculated as an an-nual average and reveals the work force and number of employed persons living in the City. It is important to note that not all of these individuals necessarily work in the City or County. Table E-3 presents covered employment numbers as available for the City of Plymouth from 2000 through 2016. Covered employment data is calculated as an annual average and reveals the number of jobs in the designated area, which are covered by unemployment insurance. Many temporary workforce positions, agricultural, self-employed persons, and some other types of jobs are not covered by unemployment insurance and are not included in the table. Some agri-cultural businesses and employees are listed in Table E-3, but not all positions are included. The data in both tables is sourced from the Minnesota Department of Employment and Economic Development. The following are key trends derived from the employment data: Resident Employment • Resident employment (number of employed persons) in Plymouth increased by approxi-
mately 2,334 people between 2000 and June 2017 (+5.9%) and the unemployment rate in-creased from 2.3% (2000) to 3.1% in June 2017. By comparison, Hennepin County’s unem-ployment rate was at 3.4% and the State of Minnesota was at 4.1% as of June 2017.
• Plymouth’s unemployment rate has stayed lower than Minnesota’s unemployment rate
since 2000. The greatest yearly difference was 1.4% lower than the State in 2009. • The unemployment rate in Hennepin County increased to a high of 7.3% (2009) which was
the peak of the recession. However, as of June 2017, the unemployment rate has fallen to 3.4%, which is considered to be below equilibrium (5.0%).
0.0%1.0%2.0%3.0%4.0%5.0%6.0%7.0%8.0%9.0%
2000 2002 2004 2006 2008 2010 2012 2014 2016
Unemployment Rate2000 Through 2016
Plymouth Hennepin Co. 7 Co. Metro Area Minnesota

EMPLOYMENT
MAXFIELD RESEARCH AND CONSULTING 34
LaborYear Force Employed Unemployed Rate
2000 40,187 39,258 929 2.3%2005 41,365 40,081 1,284 3.1%2010 40,078 37,558 2,520 6.3%2015 42,095 40,828 1,267 3.0%2016 42,570 41,264 1,306 3.1%
2017 1 42,922 41,592 1,330 3.1%
Change 2000-2017 1
Number 2,735 2,334 401 -- Percent 6.8% 5.9% 43.2% --
2000 666,621 648,571 18,050 2.7%2005 652,568 628,595 23,973 3.7%2010 650,891 605,294 45,597 7.0%2015 671,702 649,491 22,211 3.3%2016 679,285 656,426 22,859 3.4%
2017 1 685,177 661,652 23,525 3.4%
2010 2,938,795 2,721,194 217,601 7.4%2015 2,975,533 2,864,583 110,950 3.7%2016 3,006,324 2,888,922 117,402 3.9%
2017 1 3,019,856 2,895,136 124,720 4.1%
2010 153,889 139,878 14,011 9.6%2015 157,130 148,833 8,297 5.3%2016 159,396 151,769 7,627 4.8%
2017 1 159,867 152,584 7,283 4.6%1 Through June 20172 Estimated in Thousands
Sources: U.S. Department of Labor, MN Workforce Center, Maxfield Research and Consulting LLC
MINNESOTA
PLYMOUTH
HENNEPIN COUNTY
TABLE E-2ANNUAL AVERAGE RESIDENT EMPLOYMENT
PLYMOUTH MN2000 to 2017 1
U.S. 2
Note: Data not seasonally adjusted

EMPLOYMENT
MAXFIELD RESEARCH AND CONSULTING 35
Covered Employment by Industry
• Between 2000 and 2016, the number of jobs decreased in Plymouth by -1,718, a -3.2% de-crease in the City. Education and Health Services gained the greatest number of jobs (+1,995, jobs) between 2000 and 2016. Manufacturing declined the most (-5,228 jobs) be-tween 2000 and 2016.
Employment, Earnings, and Employment by Educational Attainment Table E-4 displays information on the employment by earnings, Table E-5 identifies employ-ment by educational attainment, and Table E-6 is the business summary in. The employment by earnings and the employment by educational attainment are both sourced by the US Census for 2014 while the business summary for Plymouth is sourced from ESRI for 2017. It should be noted that certain industries in Table E-6 may not display any information which means that there is either no reported economic activity for that industry or the data has been suppressed to protect the confidentiality of cooperating employers. This generally occurs when there are too few employers or one employer comprises too much of the employment in that geography. • As of 2014, approximately 21,910 (57.8%) employees make more than $3,333 per month in
Plymouth. This is a higher percentage than Hennepin County (49.8%) and the Metro Area (49.5%) of those who make more than $3,333 per month.
Industry 2000 2005 2010 2015 2016 No. Pct. 2000 2005 2010 2015 2016Natural Resources & Mining 213 195 180 167 183 -30 -14.1% 0.4% 0.4% 0.4% 0.3% 0.4%Construction 2,213 2,115 1,593 2,220 2,154 -59 -2.7% 4.2% 4.2% 3.6% 4.5% 4.2%Manufacturing 15,034 12,449 9,379 10,041 9,806 -5,228 -34.8% 28.3% 24.7% 20.9% 20.3% 19.0%Trade, Transportation, and Utilities 11,219 10,636 9,113 10,965 11,428 209 1.9% 21.1% 21.1% 20.3% 22.2% 22.2%Information 1,499 1,105 1,281 727 722 -777 -51.8% 2.8% 2.2% 2.9% 1.5% 1.4%Financial Services 4,676 4,496 4,433 3,774 5,179 503 10.8% 8.8% 8.9% 9.9% 7.6% 10.1%Professional and Business Services 10,076 9,185 9,506 9,627 10,096 20 0.2% 18.9% 18.2% 21.2% 19.5% 19.6%Education and Health Services 3,957 4,964 4,793 5,884 5,952 1,995 50.4% 7.4% 9.8% 10.7% 11.9% 11.6%Leisure and Hospitality 2,314 2,931 3,061 3,009 2,949 635 27.4% 4.3% 5.8% 6.8% 6.1% 5.7%Other Services 1,011 1,067 - 1,464 1,403 392 38.8% 1.9% 2.1% - 3.0% 2.7%Public Administration 989 1,273 1,504 1,553 1,611 622 62.9% 1.9% 2.5% 3.4% 3.1% 3.1%
Totals 53,201 50,416 44,843 49,431 51,483 -1,718 -3.2%
Source: Minnesota Workforce Center; Maxfield Research & Consulting, LLC
TABLE E-3
Change2000 - 2016
North American Industrial Classification System (NAICS)
% of Total
2000, 2005, 2010, 2015, 2016PLYMOUTH MN
COVERED EMPLOYMENT TRENDS
Average Number of Employees

EMPLOYMENT
MAXFIELD RESEARCH AND CONSULTING 36
• As of 2014, approximately 11,872 (31.3%) employees have a bachelor’s degree or advanced degree. This is a higher percentage than Hennepin County and the Metro Area where 27.5% and 27.0% respectively have a bachelor’s or advanced degree.
Type No. Pct. No. Pct. No. Pct.
$1,250/month or less 8,011 21.1% 138,086 22.9% 353,773 23.3%$1,251 to $3,333/month 8,007 21.1% 164,242 27.3% 413,324 27.2%More than $3,333/month 21,910 57.8% 300,130 49.8% 750,898 49.5%Total 37,928 100% 602,458 100% 1,517,995 100%
Sources: US Census Bureau; Maxfield Research & Consulting, LLC
TABLE E-4EMPLOYMENT BY EARNINGSPLYMOUTH ANALYSIS AREA
2014
Plymouth Hennepin County Metro Area
Type No. Pct. No. Pct. No. Pct.
Less Than High School 1,865 4.9% 36,078 6.0% 87,877 5.8%High School or Equivalent, No College 6,705 17.7% 109,293 18.1% 281,815 18.6%Some College or Associate Degree 9,518 25.1% 147,741 24.5% 379,952 25.0%Bachelor's Degree or Advanced Degree 11,872 31.3% 165,460 27.5% 410,475 27.0%Educational Attainment Not Available 7,968 21.0% 143,886 23.9% 357,876 23.6%Total 37,928 100% 602,458 100% 1,517,995 100%
Sources: US Census Bureau; Maxfield Research & Consulting, LLC
TABLE E-5EMPLOYMENT BY EDUCATIONAL ATTAINMENT
PLYMOUTH ANALYSIS AREA2014
Plymouth Hennepin County Metro Area

EMPLOYMENT
MAXFIELD RESEARCH AND CONSULTING 37
• As of 2017, there were approximately 3,136 businesses in the City of Plymouth. • Professional, Scientific and Technical Services have the highest proportion of establishments
(12.2%), while the Manufacturing sector had the highest proportion of employees (16.6%) in Plymouth.
• The Retail Trade sector is one of the largest industry types in Plymouth with 10.5% busi-
nesses and 10.2% employees. • The Finance & Insurance sector account for the second largest share of employees (11.3%)
and ranked fifth in proportion of businesses (7.3%).
Business/IndustryNumber Pct Pct
NAICS CODESAgriculture & Mining 7 0.2% 0.1%Mining 3 0.1% 0.0%Utilities 2 0.1% 0.0%Construction 225 7.2% 7.2%Manufacturing 211 6.7% 16.6%Wholesale Trade 216 6.9% 9.9%Retail Trade 330 10.5% 10.2%Transportation & Warehousing 37 1.2% 0.8%Information 86 2.7% 4.0%Finance & Insurance 228 7.3% 11.3%Real Estate, Rental & Leasing 205 6.5% 2.6%Professional, Scientific & Tech Services 384 12.2% 9.8%Management of Companies & Enterprises 6 0.2% 0.3%Admin& Support & Waste Management & Remediation Services 148 4.7% 2.5%Educational Services 75 2.4% 5.1%Health Care & Social Assistance 297 9.5% 7.7%Arts, Entertainment & Recreation 55 1.8% 1.9%Accommodation & Food Services 139 4.4% 5.1%Other Services (except Public Administration) 249 7.9% 3.3%Public Administration 20 0.6% 1.1%Unclassified Establishments 213 6.8% 0.4%Total 3,136 100.0% 100.0%
Sources: ESRI, Maxfield Research & Consulting, LLC
Businesses Employees
TABLE E-6BUSINESS SUMMARY - BY NAICS CODE
PLYMOUTH MN2017

EMPLOYMENT
MAXFIELD RESEARCH AND CONSULTING 38
Commuting Patterns Proximity to employment is often a primary consideration when choosing where to live, since transportation costs often account for a large proportion of households’ budgets. Table E-7 highlights the commuting patterns of workers in Plymouth in 2014 (the most recent data availa-ble), based on Employer-Household Dynamics data from the U.S. Census Bureau. • As shown in Table E-7, 13.1% of Plymouth residents were employed in Plymouth. Most em-
ployees that live in Plymouth commuted to jobs in Minneapolis (20.8%).
• Of the workers who work in Plymouth, 9.9% also live in Plymouth. The remaining workers are commuting from mostly Minneapolis (7.4%), Maple Grove (5.9%), and Brooklyn Park (4.3%).

EMPLOYMENT
MAXFIELD RESEARCH AND CONSULTING 39
Place of Residence Place of Employment Count Percent
Plymouth city, MN Plymouth 4,980 9.9%Minneapolis city, MN Plymouth 3,746 7.4%Maple Grove city, MN Plymouth 2,966 5.9%Brooklyn Park city, MN Plymouth 2,158 4.3%St. Paul city, MN Plymouth 1,451 2.9%Minnetonka city, MN Plymouth 1,317 2.6%Coon Rapids city, MN Plymouth 1,083 2.1%St. Louis Park city, MN Plymouth 1,079 2.1%Eden Prairie city, MN Plymouth 1,022 2.0%Crystal city, MN Plymouth 949 1.9%All Other Locations Plymouth 29,800 59.0%
Metro Area Plymouth 40,362 79.8%Outstate MN Plymouth 9,398 18.6%Other State Plymouth 791 1.6%
50,551 100.0%
Plymouth Minneapolis city, MN 7,879 20.8%Plymouth Plymouth city, MN 4,980 13.1%Plymouth Minnetonka city, MN 2,370 6.2%Plymouth Golden Valley city, MN 2,131 5.6%Plymouth Bloomington city, MN 1,598 4.2%Plymouth Maple Grove city, MN 1,479 3.9%Plymouth St. Paul city, MN 1,424 3.8%Plymouth St. Louis Park city, MN 1,389 3.7%Plymouth Eden Prairie city, MN 1,196 3.2%Plymouth Edina city, MN 1,145 3.0%Plymouth All Other Locations 12,337 32.5%
Plymouth Metro Area 35,776 94.4%Plymouth Outstate MN 1,645 4.3%Plymouth Other State 507 1.3%
37,928 100.0%
Sources: Longitudinal Employer-Household Dynamics; Maxfield Research & Consulting, LLC
TABLE E-7PLYMOUTH COMMUTING PATTERNS
2014
Place of Residence for Workers Commuting to Plymouth
Place of Employment for Plymouth Residents

EMPLOYMENT
MAXFIELD RESEARCH AND CONSULTING 40
Inflow/Outflow Table E-8 provides a summary of the inflow and outflow of workers in the City of Plymouth. Outflow reflects the number of workers living in the City of Plymouth but employed outside of the city while inflow measures the number of workers that are employed in the City of Plym-outh but live outside. Interior flow reflects the number of workers that both live and work in the City of Plymouth. • The City of Plymouth can be considered a major importer of workers, as the number of resi-
dents coming into the City (inflow) for employment was more than the number of residents leaving the City for work (outflow). Approximately 45,571 workers came into the City of Plymouth for work while 32,948 workers left, for a net difference of 12,623.
Num. Pct.
Employed in the Selection Area 50,551 100%Employed in the Selection Area but Living Outside 45,571 90.1%Employed and Living in the Selection Area 4,980 9.9%
Living in the Selection Area 37,928 100%Living in the Selection Area but Employed Outside 32,948 86.9%Living and Employed in the Selection Area 4,980 13.1%
Commuting Distance - Work to Home Num. Pct.Less than 10 miles 20,833 41.2%10 to 24 miles 21,202 41.9%25 to 50 miles 4,886 9.7%Greater than 50 miles 3,630 7.2%
Commuting Distance - Home to Work Num. Pct.Less than 10 miles 20,141 53.1%10 to 24 miles 15,676 41.3%25 to 50 miles 623 1.6%Greater than 50 miles 1,488 3.9%
Sources: Longitudinal Employer-Household Dynamics; Maxfield Research and Consulting LLC
TABLE E-8
2014
Plymouth
PLYMOUTH MNCOMMUTING INFLOW/OUTFLOW

EMPLOYMENT
MAXFIELD RESEARCH AND CONSULTING 41
Sources: Longitudinal Employer-Household Dynamics

EMPLOYMENT
MAXFIELD RESEARCH AND CONSULTING 42
Major Employers Table E-9 shows the major employers in Plymouth based on data provided by the City of Plym-outh. Please note that the table is not a comprehensive list of all employers and presents a se-lected list of employers and their employees as identified by the City of Plymouth. The follow-ing are key points from the major employers table. • Independent School District No. 284 is the largest identified employer with approximately
1,505 employees. Quadion Holdings LLC employs over 1,000 employees. Another major employer in Plymouth is Abbott, previously St. Jude Medical, with approximately 800 em-ployees.
• The list of major employers represents several industry sectors, but the highest concentra-
tions of large employers are in the Educational Services, Healthcare & Social Assistance, and Manufacturing sectors.
• The top four employers account for approximately 47% of the employee base out of the
major employers in the City of Plymouth.
Approximate EmployeeName Size
Independent School Dist No.284 (Wayzata) 1,505Quadion Holdings LLC 1,100Abbott (Previously St Jude Medical) 800Uniprise Inc 600Smiths Medical Asd, Inc. 576Honeywell International Inc. 500Sterilmed, Inc. 500Realogy Holdings Corp. 485Daikin Applied Americas Inc. 450Covidien LP 430Medivators Inc. 413Fluke Electronics Corporation 413Flynn America LP 400Onebeacon Insurance Group LLC 400
Source: City of Plymouth; Maxfield Research and Consulting LLC
TABLE E-9
2017CITY OF PLYMOUTHMAJOR EMPLOYERS

EMPLOYMENT
MAXFIELD RESEARCH AND CONSULTING 43
Employment Interview Maxfield Research and Consulting LLC interviewed a small sample size of economic develop-ment specialists and local officials regarding major employment changes and other issues that may impact long-term employment projections in Plymouth. Community economic develop-ment information provides useful job growth data and assists in identifying housing demand in an area. Though our sample size was small, we encourage diving deeper into interviewing local employers. The following summarizes key points derived from the information provided. • Some employers noted that they had employees having longer commutes, traveling from
cities like St. Paul, Blaine, and Monticello.
• Rental housing is often desired among newer and younger employees. Other employees would prefer to rent before they establish their roots in the community and purchase a home.
• Many middle- to upper positioned employees come from already established backgrounds and primarily consist of home-owners as opposed to renters.

HOUSING CHARACTERISTICS
MAXFIELD RESEARCH AND CONSULTING 44
Introduction The variety and condition of the housing stock in a community provides the basis for an attrac-tive living environment. Housing functions as a building block for neighborhoods and goods and services. We initially examined the characteristics of the housing supply in Plymouth by re-viewing data on the age of the existing housing stock; examining residential building trends since 2000; and reviewing housing data from the American Community Survey that relates to the City of Plymouth. Residential Construction Trends 2000 to Present Maxfield Research obtained data from the Metropolitan Council on the number of building per-mits issued for new housing units in Plymouth from 2000 through 2016 and compared this with the number of units permitted as identified by the City of Plymouth. Table HC-1 displays units permitted issued for different housing types as reported by Metropolitan Council and verified with the City of Plymouth. Table HC-2 displays total units permitted and demolition permits for single-family detached units as recorded by the City of Plymouth. The following are key points about housing development since 2000. • Per the Metropolitan Council, the City of Plymouth issued 7,225 permits between 2000 and
2016. That equates to about 401 residential units permitted annually since 2000. • Since 2007, there have been a decreasing number of single-family attached homes permits.
The City of Plymouth saw a high of 186 single-family attached units permitted in 2004, but has only averaged 25 units permitted since 2008.
• The City of Plymouth averages roughly 160 multifamily units permitted each year since 2000. Plymouth issued a high of 938 multifamily units in 2002. There were a total of seven years between 2000 and 2016 were no multifamily permits were issued.
• The City of Plymouth has issued roughly 15 demolition permits for single-family detached
units per year between 2000 and 2017 for a total of 278 single-family detached demo per-mits.

HOUSING CHARACTERISTICS
MAXFIELD RESEARCH AND CONSULTING 45
YearSingle-Family
(Detached)
Townhomes (Single-Family
Attached)Duplex, Triplex,
QuadplexMultifamily (5+
Units)*2000 142 142 0 77 3612001 86 94 0 621 8012002 115 165 0 938 1,2182003 136 179 0 332 6472004 75 186 28 0 2892005 31 164 2 170 3672006 47 124 14 66 2512007 105 114 4 0 2232008 79 66 0 0 1452009 59 16 0 0 752010 94 39 0 0 1332011 184 35 2 67 2882012 247 16 0 90 3532013 261 8 0 194 4632014 291 12 0 0 3032015 272 20 0 157 4492016 290 11 0 0 301Total 2,514 1,391 50 2,712 6,667
* 2000-2003 may contain units from structures of 3+ unitsSources: Metropolitan Council; City of Plymouth; Maxfield Research & Consulting LLC
HC-1RESIDENTIAL CONSTRUCTION BUILDING PERMITTED UNITS ISSUED
CITY OF PLYMOUTH
2000 to 2016
Total Units
per Metropolitan Council & City of Plymouth
Units Permitted
0
100
200
300
400
500
600
700
800
900
1000
2000 01 02 03 04 2005 06 07 08 09 2010 11 12 13 14 2015
Units
Year
New Construction Permitted (Units): 2000 through 2016
Single-family (Detached)
Multifamily (5+ Units)

HOUSING CHARACTERISTICS
MAXFIELD RESEARCH AND CONSULTING 46
Year Total Building Permits IssuedTotal SF Demo Permits
Issued2000 361 72001 801 182002 1,218 102003 647 102004 289 122005 367 122006 251 162007 223 162008 145 72009 75 92010 133 142011 288 92012 353 82013 463 152014 303 402015 449 312016 301 302017 558 14Total 7,225 278
Sources: City of Plymouth; Maxfield Research and Consulting LLC
HC-2RESIDENTIAL CONSTRUCTION BUILDING & DEMO PERMITS
CITY OF PLYMOUTH2000 to 2017

HOUSING CHARACTERISTICS
MAXFIELD RESEARCH AND CONSULTING 47
American Community Survey The American Community Survey (“ACS”) is an ongoing statistical survey administered by the U.S. Census Bureau that is sent to approximately 3 million addresses annually. The survey gath-ers data previously contained only in the long form of the Decennial Census. As a result, the survey is ongoing and provides a more “up-to-date” portrait of demographic, economic, social, and household characteristics every year, not just every ten years. The most recent ACS high-lights data collected between 2011 and 2015. Tables HC-3 to HC-7 show key data for Plymouth. Age of Housing Stock The following graph shows the age distribution of the housing stock in 2015 based on data from the U.S. Census Bureau American Community Survey (5-Year). Table HC-3 includes the number of housing units built in Plymouth, prior to 1940 and during each decade since. • As of 2015, the City of Plymouth was estimated to have 30,267 housing units, of which
roughly 71.4% were owner-occupied and 28.6% were renter-occupied. In Hennepin County, approximately 37.3% were renter-occupied while in Minnesota 26.2% of the hous-ing stock was renter-occupied.
• Homes in Plymouth are newer than homes in Hennepin County. Most housing (68.2%) was built in the 1970’s, 1980’s and 1990’s. The greatest number of homes in Plymouth were constructed in the 1980’s (roughly 27%). By comparison, the highest number of homes in Hennepin County was built prior to 1940 (19.2%).
• Compared to Hennepin County and the Twin Cities Metro Area, 16.7% of Plymouth’s hous-
ing stock has been built since 2000 compared to 10.5% of Hennepin County, 8.6% of Twin Cities Metro Area.
• Per the City of Plymouth, 508 multifamily units have been permitted since 2010.

HOUSING CHARACTERISTICS
MAXFIELD RESEARCH AND CONSULTING 48
Total Med. Yr.Units Built No. Pct. No. Pct. No. Pct. No. Pct. No. Pct. No. Pct. No. Pct. No. Pct.
Owner-Occupied 21,612 1963 366 1.7 270 1.2 1,016 4.7 1,766 8.2 3,993 18.5 6,081 28.1 4,979 23.0 2,689 12.4Renter-Occupied 8,655 1977 184 2.1 85 1.0 125 1.4 761 8.8 2,064 23.8 2,039 23.6 1,495 17.3 1,810 20.9Total 30,267 1965 550 1.8 355 1.2 1,141 3.8 2,527 8.3 6,057 20.0 8,120 26.8 6,474 21.4 4,499 14.9
Owner-Occupied 307,395 1967 59,724 19.4 20,362 6.6 51,676 16.8 31,070 10.1 38,821 12.6 43,979 14.3 30,348 9.9 28,552 9.3Renter-Occupied 182,801 1972 34,320 18.8 8,125 4.4 15,373 8.4 25,179 13.8 37,714 20.6 26,723 14.6 15,328 8.4 17,116 9.4Total 490,196 1970 94,044 19.2 28,487 5.8 67,049 13.7 56,249 11.5 76,535 15.6 70,702 14.4 45,676 9.3 45,668 9.3
Owner-Occupied 1,026,407 1974 364,742 35.5 110,528 10.8 34,704 3.4 96,299 9.4 76,288 7.4 105,139 10.2 119,915 11.7 109,222 10.6Renter-Occupied 364,742 1977 59,160 16.2 13,428 3.7 28,556 7.8 46,570 12.8 72,799 20.0 56,336 15.4 39,311 10.8 42,555 11.7Total 1,391,149 1975 423,902 30.5 123,956 8.9 63,260 4.5 142,869 10.3 149,087 10.7 161,475 11.6 159,226 11.4 151,777 7.5
Sources: U.S. Census Bureau - American Community Survey; Maxfield Research & Consulting, LLC
TABLE HC-3AGE OF HOUSING STOCK
PLYMOUTH ANALYSIS AREA2015
METRO AREA
HENNEPIN COUNTY
CITY OF PLYMOUTH
Year Unit Built
1980s 1990s 2000s<1940 1940s 1950s 1960s 1970s
550
355
1,14
1
2,52
7
6,05
7
8,12
0
6,47
4
4,49
9
0
1,000
2,000
3,000
4,000
5,000
6,000
7,000
8,000
9,000
<1940s 1940s 1950s 1960s 1970s 1980s 1990s 2000s
Units
Decade of Construction
All Housing Units Built by DecadeCity of Plymouth

HOUSING CHARACTERISTICS
MAXFIELD RESEARCH AND CONSULTING 49
Housing Units by Structure and Occupancy or (Housing Stock by Structure Type) Table HC-4 shows the housing stock in the City of Plymouth by type of structure and tenure as of 2015. • The dominant housing type in Plymouth is the single-family detached home, representing
an estimated 73.1% of all owner-occupied housing units and 7.5% of renter-occupied hous-ing units as of 2015.
• About one-half of the renter-occupied housing units are within structures that have 50 or
more units in Plymouth. • Most of the housing units with two or more units are renter-occupied.
Owner-Occupied Housing Units by Mortgage Status Table HC-5 shows mortgage status and average values from the American Community Survey for 2015 (5-Year). Mortgage status provides information on the cost of homeownership when analyzed in conjunction with mortgage payment data. A mortgage refers to all forms of debt where the property is pledged as security for repayment of debt. A first mortgage has priority claim over any other mortgage or if it is the only mortgage. A second (and sometimes third) mortgage is called a “junior mortgage,” a home equity line of credit (HELOC) would also fall into this category. Finally, a housing unit without a mortgage is owned free and clear and is debt free.
Owner- Renter- Owner- Renter- Owner- Renter-Units in Structure Occupied Pct. Occupied Pct. Occupied Pct. Occupied Pct. Occupied Pct. Occupied Pct.
1, detached 15,792 73.1% 651 7.5% 247,800 80.6% 23,400 13% 632,367 80.5% 50,228 13.8%1, attached 4,427 20.5% 1,189 13.7% 30,109 9.8% 12,592 7% 93,048 11.8% 37,318 10.2%2 56 0.3% 75 0.9% 4,012 1.3% 12,829 7% 6,727 0.9% 23,053 6.3%3 to 4 237 1.1% 195 2.3% 2,669 0.9% 8,885 5% 5,410 0.7% 18,481 5.1%5 to 9 220 1.0% 350 4.0% 2,588 0.8% 10,911 6% 5,610 0.7% 22,420 6.1%10 to 19 45 0.2% 338 3.9% 2,076 0.7% 22,573 12% 3,355 0.4% 43,460 11.9%20 to 49 236 1.1% 1,565 18.1% 4,620 1.5% 32,276 18% 7,767 1.0% 63,623 17.4%50 or more 569 2.6% 4,273 49.4% 12,573 4.1% 58,794 32% 18,628 2.4% 104,067 28.5%Mobile home 30 0.1% 19 0.2% 910 0.3% 446 0% 12,395 1.6% 1,844 0.5%Boat, RV, van, etc. 0 0.0% 0 0.0% 38 0.0% 95 0% 105 0.0% 248 0.1%Total 21,612 100% 8,655 100% 307,395 100% 182,801 100% 785,412 100% 364,742 100%
Sources: U.S. Census Bureau - American Community Survey; Maxfield Research & Consulting, LLC
PLYMOUTH METRO AREAHENNEPIN COUNTY
TABLE HC-4HOUSING UNITS BY STRUCTURE & TENURE
PLYMOUTH ANALYSIS AREA2015

HOUSING CHARACTERISTICS
MAXFIELD RESEARCH AND CONSULTING 50
• Approximately 70% of Plymouth homeowners have a mortgage. About 17% of homeown-ers with mortgages in Plymouth also have a second mortgage and/or home equity loan. These numbers are slightly lower compared to Hennepin County and the Metro Area where approximately 73% of homeowners in Hennepin County and in the Metro Area have a mort-gage.
• The median value for homes with a mortgage for the City of Plymouth homeowners is ap-proximately $301,600, while the median value for homes without a mortgage are $15,700 lower at $285,900.
Housing Units by Occupancy Status & Tenure Tenure is a key variable that analyzes the propensity for householders to rent or own their housing unit. Tenure is an integral statistic used by numerous governmental agencies and pri-vate sector industries to assess neighborhood stability. The Follow are key points from Table HC-6: • The City of Plymouth had a larger portion (68%) of the City’s housing stock devoted to
owner occupied units in 2015 than Hennepin County (59%) and the Metro Area (65%). • Approximately 27% of housing units in the City of Plymouth were renter occupied in the
2015, compared to a moderately higher percentage in Hennepin County (35%) and the Metro Area (30%).
Mortgage Status No. Pct. No. Pct. Pct. Pct.
Housing units without a mortgage 6,450 29.8 83,550 27.2 182,334 26.6Housing units with a mortgage/debt 15,162 70.2 223,845 72.8 503,556 73.4
Second mortgage only 701 3.2 12,747 4.1 30,582 4.5Home equity loan only 3,005 13.9 38,113 12.4 85,592 12.5Both second mortgage and equity loan 61 0.3 1,731 0.6 4,192 0.6No second mortgage or equity loan 11,395 52.7 171,254 55.7 383,190 55.9
Total 21,612 100.0 307,395 100.0 685,890 100.0
Average Value by Mortgage StatusHousing units with a mortgageHousing units without a mortgage
Sources: U.S. Census Bureau - American Community Survey; Maxfield Research & Consuilting, LLC
TABLE HC-5OWNER-OCCUPIED HOUSING UNITS BY MORTGAGE STATUS
PLYMOUTH ANALYSIS AREA2015
$285,900 $220,400 $209,350
PLYMOUTH HENNEPIN CO. METRO AREA
$301,600 $232,200 $224,570

HOUSING CHARACTERISTICS
MAXFIELD RESEARCH AND CONSULTING 51
• About 4.4% of Plymouth’s housing stock was vacant in 2010 and decreased to 4.1% in 2015. It is important to note, however, that the Census’s definition of vacant housing units in-cludes: units that have been rented or sold, but not yet occupied, seasonal housing (vaca-tion or second homes), housing for migrant workers, and even boarded-up housing. Thus, the U.S. Census vacancy figures are not always a true indicator of adequate housing availa-ble for new households wishing to move into the area.
Year/Occupancy No. Pct. No. Pct. Pct. Pct.
Owner Occupied 20,756 69.2 306,121 60.1 782,475 65.9Renter Occupied 7,907 26.4 169,792 33.3 335,274 28.2Vacant 1,319 4.4 33,556 6.6 69,237 5.8Total 29,982 100.0 509,469 100.0 1,186,986 100.0
Owner Occupied 21,612 68.4 307,395 59.3 785,412 65.1Renter Occupied 8,655 27.4 182,801 35.3 364,742 30.2Vacant 1,308 4.1 28,136 5.4 56,584 4.7Total 31,575 100.0 518,332 100.0 1,206,738 100.0
Sources: U.S. Census Bureau; Maxfield Research & Consulting, LLC
TABLE HC-6HOUSING UNITS BY OCCUPANCY STATUS & TENURE
PLYMOUTH ANALYSIS AREA2010 & 2015
2015
PLYMOUTH HENNEPIN CO. METRO AREA
2010
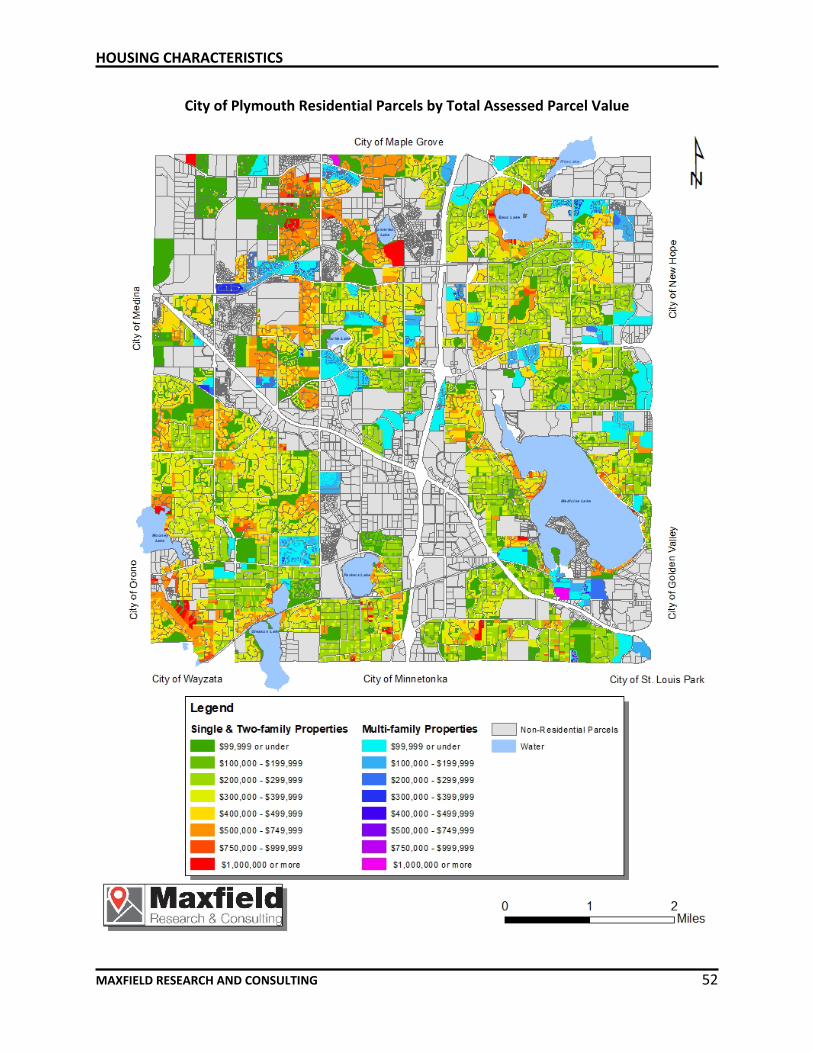
HOUSING CHARACTERISTICS
MAXFIELD RESEARCH AND CONSULTING 52
City of Plymouth Residential Parcels by Total Assessed Parcel Value
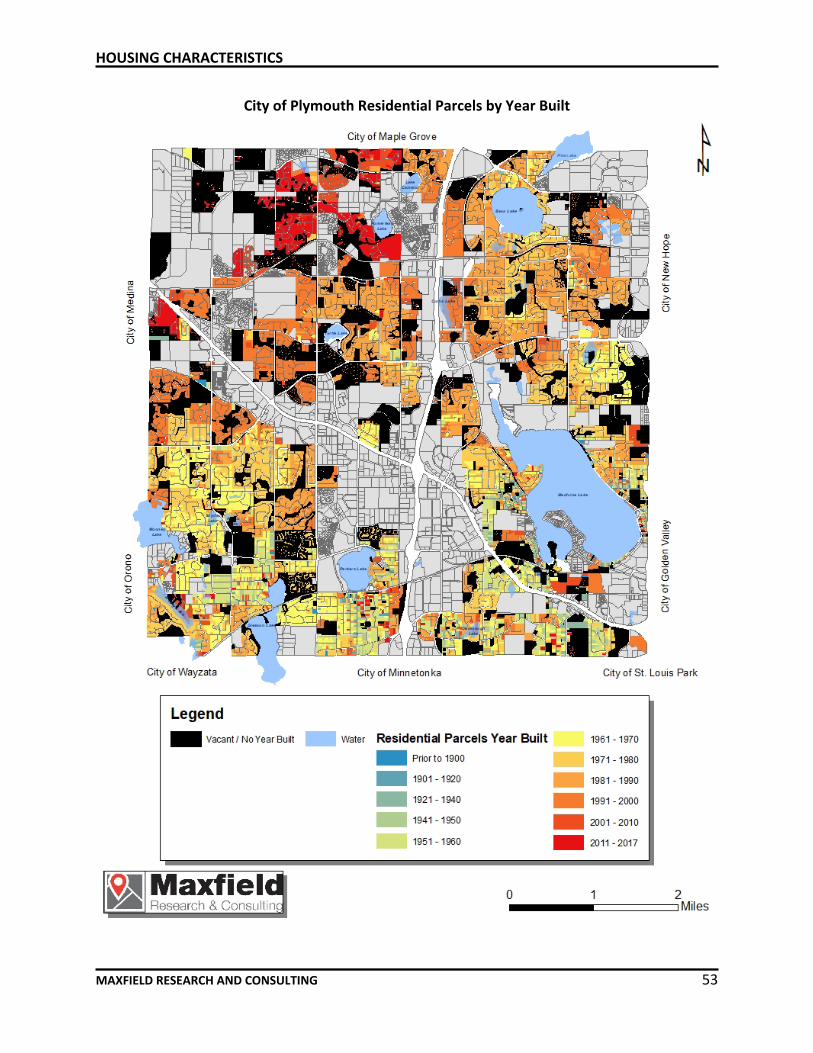
HOUSING CHARACTERISTICS
MAXFIELD RESEARCH AND CONSULTING 53
City of Plymouth Residential Parcels by Year Built

HOUSING CHARACTERISTICS
MAXFIELD RESEARCH AND CONSULTING 54
City of Plymouth Residential Parcels Homesteaded

HOUSING CHARACTERISTICS
MAXFIELD RESEARCH AND CONSULTING 55
Renter-Occupied Units by Contract Rent Table HC-7 presents information on the monthly housing costs for renters called contract rent (also known as asking rent). Contract rent is the monthly rent agreed to regardless of any utili-ties, furnishings, fees, or services that may be included. • The median contract rent in Plymouth was $1,057 and $874 in Hennepin County. Based on
a 30% allocation of income to housing, a household in Plymouth would need an income of about $42,280 to afford an average monthly rent of $1,057.
• Approximately 56% of Plymouth renters have monthly rents over $1,000, 37% of renters paying between $500 and $999, 4.8% of renters pay less than $500.
• Within Hennepin County, nearly half of renters (49.7%) paid a contract rent between $500
and $999, while just over a third of renters (35.9%) paid a contract rent above $1,000. The remaining renters who paid cash rent in Hennepin County consist of renters who paid a con-tract rent less than $500 (12.2%).
Contract Rent No. Pct. No. Pct. Pct. Pct.
No Cash Rent 193 2.2 3,979 2.2 9,618 2.6Cash Rent 8,462 97.8 178,822 97.8 355,124 97.4
$0 to $249 143 1.7 11,121 6.1 20,313 5.6$250-$499 275 3.2 11,119 6.1 23,675 6.5$500-$749 707 8.2 38,975 21.3 79,666 21.8$750-$999 2,505 28.9 51,905 28.4 107,773 29.5$1,000-$1,500 3,910 45.2 47,983 26.2 93,061 25.5$1,500+ 922 10.7 17,719 9.7 30,636 8.4
Total 8,655 100.0 182,801 100.0 364,742 100.0
Median Contract Rent
Sources: U.S. Census Bureau - American Community Survey; Maxfield Research & Consulting, LLC.
TABLE HC-7RENTER-OCCUPIED UNITS BY CONTRACT RENT
PLYMOUTH ANALYSIS AREA2015
$1,057 $864$874
METRO AREAHENNEPIN CO.PLYMOUTH

HOUSING CHARACTERISTICS
MAXFIELD RESEARCH AND CONSULTING 56
Housing Characteristics Comparison Table HC-8, on the following page, provides a comparison on various housing characteristics in Plymouth compared to neighboring peer cities in the Metro Area.
Housing Characteristics Summary Eden Prairie
Owner Units (2015) 21,612 17,776 15,327 6,851 21,019 1,735 15,995 12,642Renter Units (2015) 8,655 6,643 5,554 2,054 3,885 119 6,681 9,872
Median Contract Rent (2015) $1,057 $1,104 $1,126 $1,036 $1,188 $1,207 $1,082 $966
Vacancy Rate (6/2017)* 3.2% 2.2% 3.3% 1.6% 3.6% N/A 2.3% 2.2%
Average Rent (6/2017)* $1,176 $1,212 $1,378 $1,288 $1,312 N/A $1,263 $1,229
Resales (2016) 1,511 1,175 1,004 457 1,462 129 1,018 1,011
Median Resale Price (2016) $325,000 $308,500 $435,010 $290,275 $256,700 $541,250 $307,350 $245,000
Average Resale Price (2016) $372,849 $357,670 $529,736 $343,493 $292,793 $622,633 $355,936 $272,848
15,162 13,534 10,173 4,627 16,674 1,318 11,015 9,287
Median Home Value (2015) $297,400 $303,600 $403,000 $265,300 $248,000 $607,200 $289,300 $236,900
Residential Building Permits 2007 - 2011 878 331 533 39 1,416 79 329 5042012 - 2016 1,926 508 1,523 705 2,173 573 1,087 1,4102007 - 2016 Total 2,804 839 2,056 744 3,589 652 1,416 1,914
*Vacancy Rate & Average Rent for Maple Grove incorporates vacancy rates and rents from Osseo & RogersSource: U.S. Census Bureau; ESRI; Marquette Advisors; Met Council; Northstar MLS; Maxfield Research, Inc.
Mortgage Status - Housing Units with a Mortgage (2015)
TABLE HC-8HOUSING CHARACTERISTICS COMPARISION
PLYMOUTH ANALYSIS AREA
Plymouth Golden Valley Maple Grove Medina Minnetonka St Louis ParkEdina

HOUSING AFFORDABILITY
MAXFIELD RESEARCH AND CONSULTING 57
Introduction Affordable housing is a term that has various definitions according to different people and is a product of supply and demand. According to the U.S. Department of Housing and Urban Devel-opment (HUD), the definition of affordability is for a household to pay no more than 30% of its annual income on housing (including utilities). Families who pay more than 30% of their in-come for housing (either rent or mortgage) are considered cost burdened and may have diffi-culty affording necessities such as food, clothing, transportation and medical care. Generally, housing that is income-restricted to households earning at or below 80% of Area Me-dian Income (AMI) is considered affordable. However, many individual properties have income restrictions set anywhere from 30% to 80% of AMI. Rent is not based on income but instead is a contract amount that is affordable to households within the specific income restriction seg-ment. Moderate-income housing, often referred to as “workforce housing,” refers to both rental and ownership housing. Hence the definition is broadly defined as housing that is in-come-restricted to households earning between 50% and 120% AMI. Figure 1 below summa-rizes income ranges by definition.
Rent and Income Limits Table HA-1 shows the maximum allowable incomes by household size to qualify for affordable housing and maximum gross rents that can be charged by bedroom size in Hennepin County. These incomes are published and revised annually by the Department of Housing and Urban Development (HUD) and also published separately by the Minnesota Housing Finance Agency based on the date the project was placed into service. Fair market rent is the amount needed to pay gross monthly rent at modest rental housing in a given area. This table is used as a basis for determining the payment standard amount used to calculate the maximum monthly subsidy for families at financially assisted housing.
Definition
Extremely Low Income 0% - 30%
Very Low Income 31% - 50%
Low Income 51% - 80%
Moderate Income 80% - 120%
Note: Hennepin County 4-person AMI = $90,400 (2017)
AMI Range
FIGURE 1AREA MEDIAN INCOME (AMI) DEFINITIONS

HOUSING AFFORDABILITY
MAXFIELD RESEARCH AND CONSULTING 58
Table HA-2 shows the maximum rents by household size and AMI based on income limits illus-trated in Table HA-1. The rents on Table HA-2 are based on HUD’s allocation that monthly rents should not exceed 30% of income. In addition, the table reflects maximum household size based on HUD guidelines of number of persons per unit. For each additional bedroom, the maximum household size increases by two persons.
1 pph 2 pph 3 pph 4 pph 5 pph 6 pph 7 pph 8 pph
30% of median $18,990 $21,720 $24,420 $27,120 $29,310 $31,470 $33,630 $35,82050% of median $31,650 $36,200 $40,700 $45,200 $48,850 $52,450 $56,050 $59,700
60% of median $37,980 $43,440 $48,840 $54,240 $58,620 $62,940 $67,260 $71,640
80% of median $50,640 $57,920 $65,120 $72,320 $78,160 $83,920 $89,680 $95,520
100% of median $63,300 $72,400 $81,400 $90,400 $97,700 $104,900 $112,100 $119,400
120% of median $75,960 $86,880 $97,680 $108,480 $117,240 $125,880 $134,520 $143,280
EFF 1BR 2BR 3BR 4BR
30% of median $474 $543 $610 $678 $73250% of median $791 $905 $1,017 $1,130 $1,22160% of median $949 $1,086 $1,221 $1,356 $1,46580% of median $1,266 $1,448 $1,628 $1,808 $1,954100% of median $1,582 $1,810 $2,035 $2,260 $2,442120% of median $1,899 $2,172 $2,442 $2,712 $2,931
EFF 1BR 2BR 3BR 4BR
Fair Market Rent $699 $862 $1,086 $1,538 $1,799
Sources: MHFA, HUD, Novogradac, Maxfield Research and Consulting LLC
TABLE HA-1MHFA/HUD INCOME AND RENT LIMITS
HENNEPIN COUNTY- 2017
Income Limits by Household Size
Maximum Gross Rent
Fair Market Rent

HOUSING AFFORDABILITY
MAXFIELD RESEARCH AND CONSULTING 59
Unit Type1 Min Max Min. Max. Min. Max. Min. Max. Min. Max. Min. Max. Min. Max.
Studio 1 1 $475 - $475 $791 - $791 $950 - $950 $1,266 - $1,266 $1,583 - $1,583 $1,899 - $1,8991BR 1 2 $475 - $543 $791 - $905 $950 - $1,086 $1,266 - $1,448 $1,583 - $1,810 $1,899 - $2,1722BR 2 4 $543 - $678 $905 - $1,130 $1,086 - $1,356 $1,448 - $1,808 $1,810 - $2,260 $2,172 - $2,7123BR 3 6 $611 - $787 $1,018 - $1,311 $1,221 - $1,574 $1,628 - $2,098 $2,035 - $2,623 $2,442 - $3,1474BR 4 8 $678 - $896 $1,130 - $1,493 $1,356 - $1,791 $1,808 - $2,388 $2,260 - $2,985 $2,712 - $3,582
Sources: HUD, Novogradac, Maxfield Research and Consulting, LLC
TABLE HA-2
1 One-bedroom plus den and two-bedroom plus den units are classified as 1BR and 2BR units, respectively. To be classified as a bedroom, a den must have a window and closet.
MAXIMUM RENT BASED ON HOUSEHOLD SIZE AND AREA MEDIAN INCOMEHENNEPIN COUNTY - 2017
Note: 4-person Hennepin County AMI is $90,400 (2017)
HHD SizeMaximum Rent Based on Household Size (@30% of Income)
30% 60% 80% 100% 120%50%

HOUSING AFFORDABILITY
MAXFIELD RESEARCH AND CONSULTING 60
Housing Cost Burden Table HA-3 shows the number and percentage of owner and renter households in Minnesota, Hennepin County, the Twin Cities Metro Area, and Plymouth that pay 30% or more of their gross income for housing. This information was compiled from the American Community Sur-vey 2015 estimates. This information is different than the 2000 Census which separated house-holds that paid 35% or more in housing costs. As such, the information presented in the tables may be overstated in terms of households that may be “cost burdened.” The Federal standard for affordability is 30% of income for housing costs. Without a separate break out for house-holds that pay 35% or more, there are likely a number of households that elect to pay slightly more than 30% of their gross income to select the housing that they choose. Moderately cost-burdened is defined as households paying between 30% and 50% of their income to housing; while severely cost-burdened is defined as households paying more than 50% of their income for housing. Higher-income households that are cost-burdened may have the option of moving to lower priced housing, but lower-income households often do not. The figures focus on owner house-holds with incomes below $50,000 and renter households with incomes below $35,000. Key findings from Table HA-3 follow.
• In Plymouth, 19.6% of owner households and 42.8% of renter households are considered
cost burdened. Plymouth is slightly less cost burdened for owner households than the Twin Cities Metro Area (22.7%), Hennepin County (23.5%), and the State of Minnesota (22.1%). Plymouth is also slightly less cost burdened for renter households than the Twin Cities Metro Area (48.5%), Hennepin County (47.9%), and the State of Minnesota (48.2%).
• Among owner households earning less than $50,000, 57.8% were cost burdened in Plym-outh. This is higher than both the Twin Cities Metro Area (57.7%) and the State of Minne-sota (50.4%), but lower than Hennepin County (60.4%).
• Approximately 93.8% of Plymouth renter households earning less than $35,000 were cost burdened which is significantly higher than the Twin Cities Metro Area (82.3%), Hennepin County (82.3%) and the State of Minnesota (77.7%).
• The median contract rent in Plymouth was $1,057 in 2015 and was significantly higher than the Twin Cities Metro Area ($855), Hennepin County ($874), and the State of Minnesota ($759). Plymouth’s median contract rent was roughly 21% higher than that of Hennepin County.

HOUSING AFFORDABILITY
MAXFIELD RESEARCH AND CONSULTING 61
Community No. Pct. No. Pct. No. Pct. No. Pct.
Owner HouseholdsAll Owner Households 21,612 896,777 307,395 1,522,618 Cost Burden 30% or greater 4,230 19.6% 202,714 22.7% 71,961 23.5% 334,738 22.1%
Owner Households w/ incomes <$50,000 4,450 214,911 74,843 450,483 Cost Burden 30% or greater 2,528 57.8% 121,783 57.7% 44,329 60.4% 223,625 50.4%
Renter HouseholdsAll Renter Households 8,655 389,982 182,801 602,127 Cost Burden 30% or greater 3,594 42.8% 181,389 48.5% 84,579 47.9% 272,894 48.2%
Renter Households w/ incomes <$35,000 2,718 186,890 86,602 316,969 Cost Burden 30% or greater 2,395 93.8% 145,084 82.3% 67,661 82.3% 228,441 77.7%
Median Contract Rent1
1 Median Contract Rent 2015Note: Calculations exclude households not computed.Sources: American Community Survey 2015 estimates; Maxfield Research and Consulting LLC
TABLE HA-3HOUSING COST BURDEN
PLYMOUTH, METRO AREA, HENNEPIN COUNTY, MINNESOTA2015
Plymouth Metro Area Hennepin County Minnesota
$1,057 $855 $759$874
42.8%47.9% 48.5% 48.2%
19.6%23.5% 22.7% 22.1%
0.0%
10.0%
20.0%
30.0%
40.0%
50.0%
60.0%
70.0%
80.0%
90.0%
100.0%
Plymouth Hennepin County Metro Area Minnesota
Cost Burdened Households, 2015
All Renter HHs All Owner HHs

HOUSING AFFORDABILITY
MAXFIELD RESEARCH AND CONSULTING 62
Housing Vouchers In addition to subsidized apartments, “tenant-based” subsidies like Housing Choice Vouchers, can help lower income households afford market-rate rental housing. The tenant-based sub-sidy is funded by the Department of Housing and Urban Development (HUD), and is managed by the City of Plymouth HRA. Under the Housing Choice Voucher program (also referred to as Section 8) qualified households are issued a voucher that the household can take to an apart-ment that has rent levels with Payment Standards. The household then pays approximately 30% of their Adjusted Gross Income (AGI) for rent and utilities, and the Federal government pays the remainder of the rent to the landlord. The maximum income limit to be eligible for a Housing Choice Voucher is 50% Area Median Income (AMI) based on household size, as shown in Table HA-1. The following are key points about the Housing Choice Voucher Program in Plym-outh. • The Plymouth HRA manages roughly 375 Housing Choice rental assistance vouchers
throughout the city.
• The voucher program uses a payment standard which matches the cost of housing and utili-ties and households may use the housing voucher for units with rent that is below or above the payment standard.
• Housing Choice Vouchers can be used for several types of residences to include apartment
rentals, single family housing rentals, duplexes, townhouses, and homeownership. Table HA-4 on the following page provides a breakdown of properties that offer subsidized units and includes the expiration date of the properties funding source as well as the percent-age of subsidized units at the select property.

HOUSING AFFORDABILITY
MAXFIELD RESEARCH AND CONSULTING 63
Name Subsidized Units Total Units Pct. Subsidized Exp. Date FundingAt the Lake 61 204 30% 7/29/2019 Housing Revenue BondsThe Axis 16 161 10% 12/31/2038 TIF/MN DEED/Met CouncilBasset Creek Commons (senior housing) 46 46 100% 2039 TIF/HUDCurrents (Harbor Lane) 64 326 20% 2/15/2026 Housing Revenue BondsKimberly Meadows 39 39 100% 10/8/2018 Project Based Section 8/HUD/MHFALakeview Commons 62 62 100% 7/1/2025 LIHTCLancaster Village 32 160 20% 9/15/2031 BondsMission Oaks 28 28 100% 12/31/2018 Project Based Section 8/HUDParkside Apartments 21 211 10% 4/15/2033 Revenue BondsShenandoah Woods Apartments 46 64 72% 10/26/2024 HRA/Hennepin Co/FHF/MHFAStone Creek Village 34 132 26% 4/1/2038 TIF/Met Council/FHF/LIHTC/Hennepin CountyVicksburg Commons 50 50 100% 9/30/2041 TIF/Section 8/Met CouncilWest View Estates 67 67 100% 6/20/2041 TIF/Section 8/Met CouncilWillow Woods 39 40 98% 12/1/2035 HRA Loan/Project Based section 8
HRA OWNEDPlymouth Towne Square 99 99 100% N/A GO BondsVicksburg Crossing 96 96 100% N/A GO Bonds
TABLE HA-4
Sources: City of Plymouth; Maxfield Research & Consulting, LLC
CITY OF PLYMOUTHHOUSING AFFORDABILITY EXPIRATION DATE

HOUSING AFFORDABILITY
MAXFIELD RESEARCH AND CONSULTING 64
Housing Costs as Percentage of Household Income Housing costs are generally considered affordable at 30% of a households adjusted gross in-come. Table HA-5 on the following page illustrates key housing metrics based on housing costs and household incomes in Plymouth. The table estimates the percentage of Plymouth house-holders that can afford rental housing based on a 30% allocation of income to housing. Housing costs are based on the Plymouth average. The housing affordability calculations assume the following:
Rental Housing Background check on tenant to ensure credit history 30% allocation of income Renter household income per 2015 ACS
• The median income of all Plymouth households in 2017 was about $96,274. However, the
median income varies by tenure. According to the 2015 American Community Survey, the median income of a homeowner is $107,396 compared to $52,043 for renters.
• About 83% of existing renter households can afford to rent a one-bedroom unit in Plymouth
($950/month). The percentage of renter income-qualified households decreases to 62% that can afford an existing three-bedroom unit ($1,850/month). After adjusting for new construction rental housing, the percentage of renters that are income-qualified decreases. About 75% of renters can afford a new market rate one-bedroom unit while 44% can afford a new three-bedroom unit.

HOUSING AFFORDABILITY
MAXFIELD RESEARCH AND CONSULTING 65
Rental (Market Rate)
1BR 2BR 3BR 1BR 2BR 3BRMonthly Rent $950 $1,300 $1,850 $1,300 $2,000 $2,800Annual Rent $11,400 $15,600 $22,200 $15,600 $24,000 $33,600
Housing Costs as % of Income 30% 30% 30% 30% 30% 30%
Minimum Income Required $38,000 $52,000 $74,000 $52,000 $80,000 $112,000
Pct. of ALL Plymouth HHDS who can afford1 83.5% 74.8% 62.4% 74.8% 58.9% 43.7%No. of Plymouth HHDS who can afford1 25,262 22,652 18,898 22,652 17,817 13,221
Pct. of Plymouth renter HHDs who can afford2 65.4% 65.4% 56.8% 46.8% 25.9% 13.2%No. of Plymouth renter HHDs who can afford2 5,659 5,659 4,920 4,050 2,245 1,142No. of Plymouth renter HHDS who cannot afford2 2,996 2,996 3,735 4,605 6,410 7,513
1 Based on 2017 household income for ALL households2 Based on 2015 ACS household income by tenure (i.e. owner and renter incomes. Owner incomes = $107,396 vs. renter incomes = $52,043)Source: Maxfield Research & Consulting, LLC
Existing Rental New Rental
TABLE HA-5
CITY OF PLYMOUTHPLYMOUTH HOUSING AFFORDABILITY - BASED ON HOUSEHOLD INCOME

RENTAL MARKET ANALYSIS
MAXFIELD RESEARCH AND CONSULTING 66
Introduction Maxfield Research and Consulting LLC identified and surveyed larger rental properties of 25 or more units in Plymouth. In addition, interviews were conducted with rental housing manage-ment firms, and others in the community familiar with Plymouth’s’ rental housing stock. For purposes of our analysis, rental properties are classified rental projects into two groups, general occupancy and senior (age-restricted). All senior properties are included in the Senior Housing Market Analysis section of this report. The general occupancy rental properties are di-vided into three groups: market rate (those without income restrictions); affordable or shallow-subsidy housing (those receiving tax credits or another type of shallow-subsidy and where there is a quoted rent for the unit and a maximum income that cannot be exceeded by the tenant); and subsidized or deep-subsidy properties (those with income restrictions at 30% or less of AMI where rental rates are based on 30% of their gross adjusted income. Overview of Rental Market Conditions Maxfield Research utilized data from the American Community Survey (ACS) and Marquette Ad-visors Apartment Trends report for Minnesota, the Twin Cities Metro Area, Hennepin County and Plymouth to summarize rental market conditions in the Plymouth Analysis Area. The data from Marquette Advisors is shown for the 4th Quarter of 2007 through 4th Quarter of 2016, while the ACS data is 2011 – 2015. ACS includes all rental units, regardless of structure size. The following are key points concerning Plymouth’s rental conditions. • The equilibrium vacancy rate for rental housing is considered to be 5.0%. This allows for
normal turnover and an adequate supply of alternatives for prospective renters. During the fourth quarter of 2016, the vacancy rate was 3% in Plymouth overall, with the highest va-cancies in two-bedroom (3.3%) and one-bedroom (3%) units.
• Vacancy rates were lowest for studio (1.6%), two-bedroom with den (1.6%), and one-bed-
room with den (1.8%) units in Plymouth. • Between the fourth quarter 2007 and 2016, the average rents for a studio unit increased
20.7%, 10.7% for a one-bedroom, and 14.5% for a two-bedroom.

RENTAL MARKET ANALYSIS
MAXFIELD RESEARCH AND CONSULTING 67
1 BR 2 BRTotal Studio 1 BR w/ Den 2 BR w/ Den 3 BR
Units 5,598 128 1,918 218 2,868 128 338No. Vacant 170 2 58 4 96 2 8
Avg. Rent $1,166 $857 $1,000 $1,136 $1,234 $1,475 $1,541Vacancy 3.0% 1.6% 3.0% 1.8% 3.3% 1.6% 2.4%
Units 5,661 116 1,852 218 3,016 121 338No. Vacant 189 4 53 4 121 5 2
Avg. Rent $1,127 $831 $960 $1,124 $1,184 $1,426 $1,523Vacancy 3.3% 3.4% 2.9% 1.8% 4.0% 4.1% 0.6%
Units 5,789 128 1,960 218 3,018 127 338No. Vacant 226 2 49 4 143 8 20
Avg. Rent $1,111 $807 $942 $1,122 $1,178 $1,398 $1,498Vacancy 3.9% 1.6% 2.5% 1.8% 4.7% 6.3% 5.9%
Units 5,658 128 1,979 218 2,884 111 338No. Vacant 193 1 63 6 109 7 7
Avg. Rent $1,087 $783 $927 $1,113 $1,150 $1,336 $1,498Vacancy 3.4% 0.8% 3.2% 2.8% 3.8% 6.3% 2.1%
Units 5,423 127 1,834 218 2,747 111 386No. Vacant 225 3 55 4 138 10 15
Avg. Rent $1,102 $748 $950 $1,114 $1,161 $1,386 $1,434Vacancy 4.1% 2.4% 3.0% 1.8% 5.0% 9.0% 3.9%
Units 4,497 128 1,608 206 2,169 111 275No. Vacant 189 3 73 6 93 8 6
Avg. Rent $1,036 $728 $897 $1,061 $1,091 $1,359 $1,408Vacancy 4.2% 2.3% 4.5% 2.9% 4.3% 7.2% 2.2%
Units 5,248 98 1,811 206 2,671 111 351No. Vacant 267 5 68 15 147 14 18
Avg. Rent $1,053 $717 $908 $1,048 $1,109 $1,403 $1,356Vacancy 5.1% 5.1% 3.8% 7.3% 5.5% 12.6% 5.1%
Units 5,269 125 1,851 218 2,648 92 335No. Vacant 389 13 139 16 200 11 10
Avg. Rent $1,055 $742 $915 $1,096 $1,110 $1,440 $1,374Vacancy 7.4% 10.4% 7.5% 7.3% 7.6% 12.0% 3.0%
Units 6,277 121 2,094 218 3,292 104 448No. Vacant 351 2 85 14 212 14 24
Avg. Rent $1,044 $708 $904 $1,070 $1,088 $1,407 $1,372Vacancy 5.6% 1.7% 4.1% 6.4% 6.4% 13.5% 5.4%
Units 5,856 120 2,017 218 2,997 104 400No. Vacant 248 16 44 6 168 6 8
Avg. Rent $1,112 $710 $903 $1,091 $1,078 $1,481 $1,411Vacancy 4.2% 13.2% 2.2% 2.8% 5.6% 5.6% 2.1%
Units -258 8 -99 0 -129 24 -62No. Vacant -78 -14 14 -2 -72 -4 0
Avg. Rent $54 $147 $97 $45 $156 -$6 $130Vacancy -1.2% -11.6% 0.8% -1.0% -2.3% -4.0% 0.3%
Sources: Marquette Advisors; Maxfield Research & Consulting, LLC
Chan
ge20
0820
0720
1120
1020
0920
1520
1420
1320
12
TABLE R-1AVERAGE RENTS/VACANCIES TRENDS
CITY OF PLYMOUTH4th Quarter 2007-2016
2016

RENTAL MARKET ANALYSIS
MAXFIELD RESEARCH AND CONSULTING 68
• The following chart illustrates how the Plymouth general occupancy apartment market re-covered rapidly after struggling with higher vacancy rates between fourth quarter of 2008 and 2010.
• Plymouth has much higher rents compared to Hennepin County and the State of Minnesota.
The median gross rent in Plymouth (estimated as of 2015 ACS) was $1,143 per month, which was 20% higher than the median monthly rent of $951 in Hennepin County and 35% higher than the median monthly rent of $848 in Minnesota.
• Monthly gross rents in Plymouth ranged from less than $300 to more than $1,500
with approximately 16% renting for $1,500 or more per month. Over 49% had gross monthly rents between $1,000 and $1,499, 23% had rents between $750 and $999, while just over 5% had rents between $500 and $749. Only 3% of renters had rents of less than $500.
• By comparison, an estimated 14% in the Hennepin County had gross monthly rents that were $1,500 or more. Also, 30% had gross monthly rents from $1,000 to $1,500, 27% had rents between $750 and $999 and 16% had rents between $500 and $749. In addition, an estimated 10% had rents of less than $500.
0.0%
1.0%
2.0%
3.0%
4.0%
5.0%
6.0%
7.0%
8.0%
$950
$1,000
$1,050
$1,100
$1,150
$1,200
2007 2008 2009 2010 2011 2012 2013 2014 2015 2016
Vaca
ncy R
ate
Rent
Year
Avg. Rents & Vacancy Rate 2007 to 2016Plymouth MN
Avg. Rent Pct. VacantMarquette Advisors

RENTAL MARKET ANALYSIS
MAXFIELD RESEARCH AND CONSULTING 69
MN
#% of Total
#% of Total
% of Total
Total: 8,655 100% 182,801 100% 100%
Median Gross Rent $848
No Bedroom 333 4% 12,192 7% 5%Less than $300 0 0% 1,393 1% 1%$300 to $499 0 0% 1,342 1% 1%$500 to $749 126 1% 5,517 3% 2%$750 to $999 129 1% 2,377 1% 1%$1,000 to $1,499 78 1% 1,066 1% 0%$1,500 or more 0 0% 342 0% 0%No cash rent 0 0% 155 0% 0%
1 Bedroom 2,641 31% 72,588 40% 33%Less than $300 43 0% 7,162 4% 4%$300 to $499 94 1% 3,623 2% 4%$500 to $749 96 1% 18,031 10% 10%$750 to $999 1,050 12% 26,223 14% 9%$1,000 to $1,499 1,209 14% 13,251 7% 4%$1,500 or more 140 2% 3,758 2% 1%No cash rent 9 0% 540 0% 0%
2 Bedrooms 4,207 49% 64,026 35% 38%Less than $300 68 1% 2,173 1% 1%$300 to $499 15 0% 1,655 1% 2%$500 to $749 202 2% 3,691 2% 7%$750 to $999 792 9% 18,235 10% 12%$1,000 to $1,499 2,577 30% 28,507 16% 11%$1,500 or more 478 6% 8,430 5% 3%No cash rent 75 1% 1,335 1% 1%
3 or More Bedrooms 1,474 17% 33,995 19% 24%Less than $300 15 0% 752 0% 1%$300 to $499 34 0% 1,099 1% 1%$500 to $749 77 1% 2,297 1% 3%$750 to $999 43 0% 2,725 1% 4%$1,000 to $1,499 427 5% 11,771 6% 8%$1,500 or more 769 9% 13,402 7% 6%No cash rent 109 1% 1,949 1% 3%
Sources: 2011-2015 American Community Survey; Maxfield Research and Consulting, LLC
$1,143 $951
R-2
PLYMOUTH ANALYSIS AREA2015
Plymouth Hennepin Co.
BEDROOMS BY GROSS RENT, RENTER-OCCUPIED HOUSING UNITS

RENTAL MARKET ANALYSIS
MAXFIELD RESEARCH AND CONSULTING 70
General-Occupancy Rental Properties Our research of Plymouth’s general occupancy rental market included a survey of 44 market rate, affordable, and subsidized apartment properties (25 units and larger) in July & August 2017. These properties represent a combined total of 6,972 units, including 6,372 market rate units, 366 affordable units, and 234 subsidized units. Although we were able to contact and obtain up-to-date information on the majority of rental properties, there were a few projects that chose not to participate in this survey or were unable to reach and had to rely on information from third party sources. At the time of our survey, 115 market rate units were vacant, resulting in an overall vacancy rate of 1.6% for all units. The combined overall vacancy rate is well below the industry stand-ard of 5% vacancy for a stabilized rental market rate which promotes competitive rates, ensures adequate choice, and allows for sufficient unit turnover. Table R-3 summarizes year built of Plymouth general occupancy projects. Table R-4 summarizes information on market rate, affordable, and subsidized general occupancy projects. Table R-5 summarizes available unit types and rents among all general-occupancy housing developments.
4% 7% 5%
31%40%
33%
49%35%
38%
17% 19% 24%
0%10%20%30%40%50%60%70%80%90%
100%
Plymouth Hennepin Co. MN
Renter-Occupied Housing Units by Number of Bedrooms Plymouth MN
3BR+
2BR
1BR
No BR
U.S. Census

RENTAL MARKET ANALYSIS
MAXFIELD RESEARCH AND CONSULTING 71
Property Name/Location Built Type Units
The Axis 2016 MR/AFF 161West View Estates 2012 AFF 67Vicksburg Commons 2007 AFF 50Stone Creek at Medicine Lake 2007 MR/AFF/SUB 132Stoneleigh at the Reserve 2003 MR 361The Quinn 2002 MR 301Shadow Hills 2002 MR 322Creekside Estates 2000 MR 204Shenandoah Woods 1998 MR/AFF/SUB 64Lakeview Commons 1995 AFF 62Fernbrook Townhomes 1993 MR 72Lancaster Park 1991 MR 50Bass Lake Hills 1990 MR 284Vicksburg Village 1989 MR 370Coachman Trails 1988 MR 156Hummingbird Cove 1988 MR 74Stonehill 1988 MR 224Parkers Lake Apartments 1988 MR 248Plymouth Square at 37th 1987 MR 160Plymouth Ponds 1987 MR 200Parkside at Medicine Lake 1986 MR/AFF/SUB 211Summer Creek 1985 MR 72Fox Forest Townhomes 1985 MR 160Park Place Apartments 1985 MR 500Medicine Lake Woods 1984 MR 17Mission Oaks 1983 SUB 26Kimberly Meadows 1980 SUB 39Willow Wood Estates 1980 AFF 40Oakwood 1978 MR 107Willow Creek Apartments 1977 MR 245Medicine Lake Apartments 1977 MR 81Lancaster Village 1974 MR/SUB 160Wellington Apartments 1973 MR 39Plymouth Commons 1972 MR 212At the Lake 1971 MR/AFF/SUB 204Currents 1971 MR/SUB 326Granite Woods 1971 MR 192Manor Royal 1971 MR 132Plymouth Pointe 1969 MR 96South Shore 1969 MR 17Countryside Estates 1968 MR 72Four Season Estates 1968 MR 96Four Seasons Villas 1967 MR 240Plymouth Colony 1945 MR 126
Source: City of Plymouth; Maxfield Research & Consulting, LLC
TABLE R-3GENERAL OCCUPANCY RENTAL DEVELOPMENT YEAR BUILT
CITY OF PLYMOUTHAugust 2017
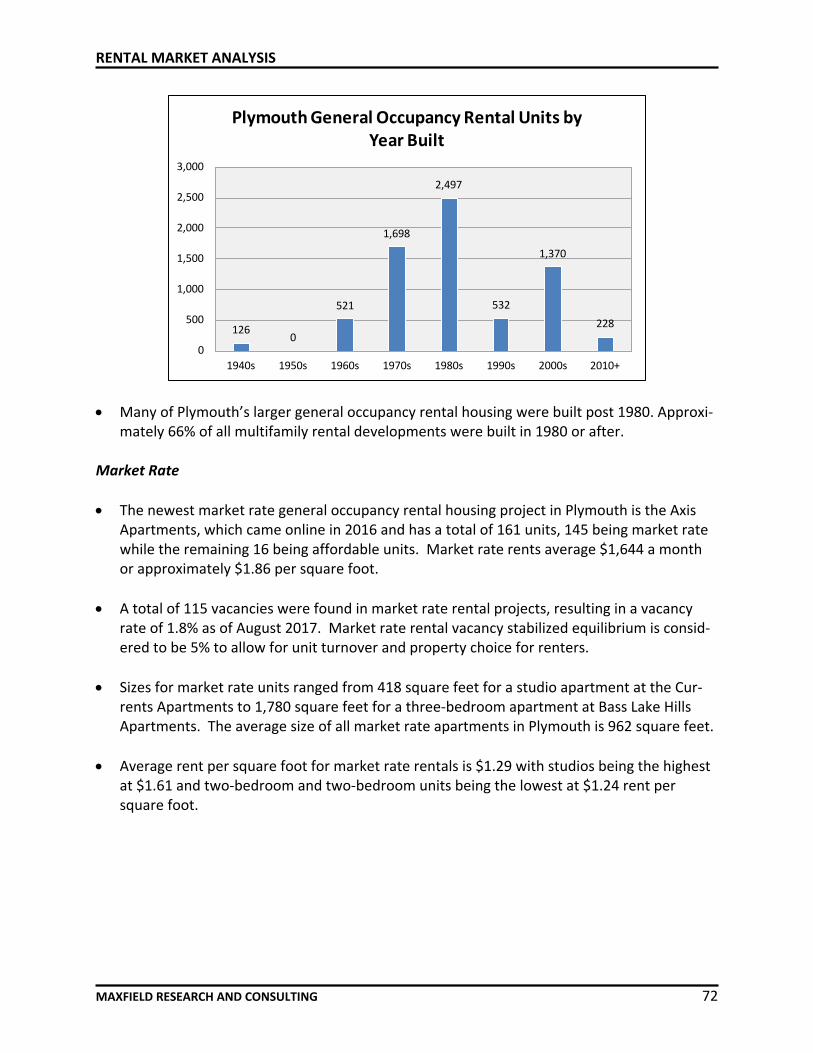
RENTAL MARKET ANALYSIS
MAXFIELD RESEARCH AND CONSULTING 72
• Many of Plymouth’s larger general occupancy rental housing were built post 1980. Approxi-mately 66% of all multifamily rental developments were built in 1980 or after.
Market Rate
• The newest market rate general occupancy rental housing project in Plymouth is the Axis
Apartments, which came online in 2016 and has a total of 161 units, 145 being market rate while the remaining 16 being affordable units. Market rate rents average $1,644 a month or approximately $1.86 per square foot.
• A total of 115 vacancies were found in market rate rental projects, resulting in a vacancy
rate of 1.8% as of August 2017. Market rate rental vacancy stabilized equilibrium is consid-ered to be 5% to allow for unit turnover and property choice for renters.
• Sizes for market rate units ranged from 418 square feet for a studio apartment at the Cur-
rents Apartments to 1,780 square feet for a three-bedroom apartment at Bass Lake Hills Apartments. The average size of all market rate apartments in Plymouth is 962 square feet.
• Average rent per square foot for market rate rentals is $1.29 with studios being the highest
at $1.61 and two-bedroom and two-bedroom units being the lowest at $1.24 rent per square foot.
1260
521
1,698
2,497
532
1,370
228
0
500
1,000
1,500
2,000
2,500
3,000
1940s 1950s 1960s 1970s 1980s 1990s 2000s 2010+
Plymouth General Occupancy Rental Units by Year Built
RENTAL MARKET ANALYSIS
MAXFIELD RESEARCH AND CONSULTING 73
Affordable • There are nine general occupancy affordable properties in Plymouth with 366 total units.
There were no vacant units as of August 2017.
• Typically, tax credit rental properties should be able to maintain vacancy rates of 3% or less in most housing markets. The lack of vacancies for tax credit housing units indicates a need for additional housing of this type.
• Since 2007, three tax credit rental properties have come online, totaling 133. These three properties account for roughly 36% of Plymouth’s affordable housing units.
Subsidized • There are eight income-restricted properties deep subsidized projects in Plymouth with 234
total units. There were no vacant unit as of August 2017.
• Typically, deep-subsidy rental properties should be able to maintain vacancy rates of 3% or less in most housing markets. Because there are no vacancies, there is pent-up demand for additional subsidized product type.

RENTAL MARKET ANALYSIS
MAXFIELD RESEARCH AND CONSULTING 74
Year Units/ AcceptProperty Name/Location Built Vacant Vouchers Amenities/Comments
SubsidizedStone Creek Apartments 2004 26 10 - 1BR 794 - 827 No1020 West Medicine Lake Dr 0 10 - 2BR 1,074 - 1,536Dominium 0.0% 6 - 3BR 1,355 - 1,644
Shenandoah Woods 1998 6 1 - 1BR No2205 Shenandoah Ln N 0 4 - 2BR 851 - 880
0.0% 1 - 3BR 1,049 - 1,171
Parkside at Medicine Lake 1986 21 8 - 1BR 770 - 808 No12102 41st Ave N 0 13 - 2BR 1,008 - 1,233StuartCo 0.0%
Mission Oaks 1983 26 18 - 2BR 920 - 994 No11841 Old Rockford Rd 0 8 - 3BRTapestry Management 0.0%Kimberly Meadows 1980 39 19 - 2BR 920 - 994 No17363 County Road 6 0 18 - 3BRThies & Talle Management 0.0% 2 - 4BRLancaster Village 1974 32 15 - 1BR 700 - 750 No3610 Lancaster Ln N 0 17 - 2BR 900 - 950CSM Corporation 0.0%
Currents 1971 64 48 - 1BR 518 - 818 No3205 Harbor Ln N 0 16 - 2BRMiramar Inc 0.0%
At the Lake 1971 20 10 - 1BR 750 - 750 No2500 Nathan Ln N 0 10 - 2BR 950 - 1,050MN Apartment People 0.0%
Subsidized Total 234 0 0.0%
Outdoor pol, sauna, lounge, underground parking, laundry facilities, two fitness centers, additional storage space, picnic area with grill, near walking/biking trail, dishwasher
30% of AGI n.m. Clubhouse, fitness center, outdoor heated pool with sundeck, picnic area with grills, playground, surface & garage parking
30% of AGI n.m. Outdoor & indoor pool, dry sauna, fitness center, outdoor courtyard, picnic area with BBQ stations, multi-sport court, dog park, playground, tanning suite, coffee café, business center, DVD rentals, dry cleaning service
1,24230% of AGI
1,242
Grill & picnic area, laundry facility, tanning salon, dishwasher, balcony, fitness center, playground, pool, sauna, basketball & volleyball court
TABLE R-4SELECT GENERAL OCCUPANCY RENTAL DEVELOPMENT SURVEY
PLYMOUTHAugust 2017
Monthly Rent per
30% of AGI n.m
Unit Mix Unit Size Rent
Balcony, playground, high speed internet access, storage uits, on-site property manager, flexible lease lengths
Square Foot
Designed for families with children, common area laundry, playground, nearby walking trails
598 30% of AGI n.m30% of AGI30% of AGI
On-site property manager, dishwasher, walk-in closets, heated underground parking, BBQ area, subsidized, affordable, & market rate units offered
1,450
n.m
30% of AGI n.m.
1,150 30% of AGI n.m.
n.mn.m
30% of AGI30% of AGI
30% of AGI
n.mn.m
n.m
30% of AGI n.m30% of AGI n.m
n.m.30% of AGI n.m.
Underground parking included, fitness center, car wash bay, gas grill, playground, patio/terrace, dishwasher, kitchen pantry, in unit washer & dryer, outdoor hot-tub with heated deck
30% of AGI n.m30% of AGI n.m30% of AGI n.m
30% of AGI

RENTAL MARKET ANALYSIS
MAXFIELD RESEARCH AND CONSULTING 75
Year Units/ AcceptProperty Name/Location Built Vacant Vouchers Amenities/Comments
Affordable Tax-Credit (Section 42)The Axis 2016 16 8 - 1BR 576 - 728 Yes350 Nathan Ln N 0 8 - 2BR 1,130 - 1,292Steven Scott Management 0.0%
West View Estates 2012 67 4 - 1BR Yes6125 Vicksburg Ln N 0 38 - 2BRSand Companies 0.0% 25 - 3BR
Vicksburg Commons 2007 50 4 - 1BR Yes6040 Shenandoah Ln N 0 20 - 2BRCommonbond Properties 0% 26 - 3BR
Stone Creek Apartments 2004 8 4 - 1BR 794 - 827 No1020 West Medicine Lake Dr 0 4 - 2BR 1,074 - 1,536Dominium 0.0%
Shenandoah Woods 1998 40 21 - 1BR Yes2205 Shenandoah Ln N 0 8 - 2BR 851 - 880Hornig Companies 0% 11 - 3BR 1,049 - 1,171
Lakeview Commons 1995 62 14 - 2B Yes15235 18th Ave N 0 48 - 3BHeartland Management 0.0%
Parkside at Medicine Lake 1986 42 6 - Studio No12102 41st Ave N 0 9 - 1BR 770 - 808StuartCo 0.0% 25 - 2BR 1,008 - 1,233
2 - 3BR 1,233 - 1,344
Willow Wood Estates 1980 40 36 - 3BR No10850 South Shore Dr 0 4 - 4BRDominium Management 0.0%At the Lake 1971 41 4 - Studio 490 - 500 Yes2500 Nathan Ln N 0 22 - 1BR 750 - 750MN Apartment People 0.0% 11 - 2BR 950 - 1,050
4 - 3BR 1,200 - 1,200
Affordable Total 366 0 0.0%
n.m
N/A N/AN/A N/A
ContinuedTABLE R-4
SELECT GENERAL OCCUPANCY RENTAL DEVELOPMENT SURVEYPLYMOUTHAugust 2017
Monthly Rent perUnit Mix
N/A
N/AN/AN/A
N/A
$1,075 $1.03
Unit Size Rent Square Foot
N/AN/A
560 N/A N/A
N/A N/AN/A N/AN/A N/A
$764$9151,122
956
Bike storage & fix-it station, pet wash, tv room, sundeck, gas grills, surface parking & undergound parking garage, fitness center, pool, in-unit washer & dryer, ping pong table & bocce ball court, tax credit & market rate units offeredDishwasher, assigned parking, coffee bar, playground, walk-in closets, balcony, laundry facilities
Dishwasher, garage parking, walk-in closets, playground, on-site manager, washer & dryer connections, nearby walking & biking trails
N/AN/A
N/A
$0.73
On-site property manager, dishwasher, walk-in closets, heated underground parking, BBQ area, subsidized, affordable, & market rate units offered
N/A
N/AN/A
N/AN/A
N/A
N/A
Outdoor pol, sauna, lounge, underground parking, laundry facilities, two fitness centers, additional storage space, picnic area with grill, near walking/biking trail, dishwasher
N/AN/A
1,444$0.82
N/A
1,1081,283
30% of AGI
N/A N/A
Underground parking included, fitness center, car wash bay, gas grill, playground, patio/terrace, dishwasher, kitchen pantry, in unit washer & dryer, outdoor hot-tub with heated deck
598
N/AN/A
N/AN/A
$1,054
N/A
One & two car attached garages, central air, in-unit washer and dryer, community room, computer lab, playground, waitlist closed, no longer accepting applications at time of survey
1,320 $1,238
n.m30% of AGI
On-site laundry facilities, patio/balcony, playground, clubhouse, storage units, waiting list is closed and not accepting applications at time of survey
1,040
Grill & picnic area, laundry facility, tanning salon, dishwasher, balcony, fitness center, playground, pool, sauna, basketball & volleyball court
$0.80
$0.94

RENTAL MARKET ANALYSIS
MAXFIELD RESEARCH AND CONSULTING 76
Year Units/ AcceptProperty Name/Location Built Vacant Vouchers Amenities/Comments
Market RateThe Axis 2016 145 87 - 1BR 576 - 728 $1,275 - $1,495 $2.05 - $2.21 No350 Nathan Ln N 9 54 - 2BR 1,130 - 1,292 $1,920 - $2,100 $1.63 - $1.70Steven Scott Management 6.2% 4 - 2BR/D
Stone Creek Apartments 2004 98 16 - Studio $1,100 - $1,200 $2.13 - $2.32 No1020 West Medicine Lake Dr 2 12 - 1BR 794 - 827 $1,340 - $1,490 $1.69 - $1.88Dominium 2.0% 16 - 1BR/D 1,095 - 1,107 $1,515 - $1,695 $1.38 - $1.55
34 - 2BR 1,074 - 1,536 $1,405 - $2,350 $1.31 - $1.5320 - 3BR 1,355 - 1,644 $1,900 - $2,540 $1.40 - $1.87
Stoneleigh at the Reserve 2003 361 21 - Studio No5200 Annapolis Ln N 4 211 - 1BR 720 - 1,016 $1,200 - $1,280 $1.26 - $1.67Weidner Apartment Homes 1.1% 42 - 1BR/D
63 - 2BR 1,092 - 1,158 $1,535 - $1,565 $1.35 - $1.4124 - 2BR/D
Shadow Hills 2002 322 119 - 1BR 739 - 957 $1,156 - $1,326 $1.39 - $1.56 No4540 Nathan Ln N 0 18 - 1BR/D $1,280 - $1,305 $1.34 - $1.36Bigos Management 0.0% 130 - 2BR 1,069 - 1,223 $1,370 - $1,525 $1.25 - $1.28
52 - 2BR/D 1,248 - 1,477 $1,500 - $1,629 $1.10 - $1.203 - 3BR $1,695 - $1,725 $1.11 - $1.13
The Quinn 2002 301 125 - 1 BR 677 - 800 $1,084 - $2,805 $1.60 - $3.51 No6110 Quinwood Ln N 6 136 - 2 BR 990 - 1,187 $1,243 - $3,000 $1.26 - $2.53GreyStar 2.0% 40 - 3 BR $1,920 - $4,208 $1.35 - $2.97
Creekside Estates 2000 204 45 - 1BR 719 - 840 $1.57 - $1.35 No200 Nathan Ln N 14 42 - 1BR/D 856 - 1,072 $1.71 - $1.36Steven Scott Management 6.9% 117 - 2BR 1,064 - 1,122 $1,335 - $1,520 $1.25 - $1.35
Shenandoah Woods 1998 18 6 - 1BR $620 - $695 $1.04 - $1.16 Yes2205 Shenandoah Ln N 0 8 - 2BR 851 - 880 $745 - $905 $0.88 - $1.06Hornig Companies 0.0% 4 - 3BR 1,049 - 1,171 $970 - $1,130 $0.92 - $1.08
Fernbrook Townhomes 1993 72 1 - 2BR No3900 Plymouth Boulevard 0 71 - 3BREquity Residential 0.0%
Lancaster Park 1991 50 6 - 1BR $1,110 - $1,310 $1.35 - $1.59 No4015 Lancaster Ln N 0 44 - 2BR 995 - 1,260 $1,310 - $1,610 $1.28 - $1.32Marathon Resources Inc 0.0%
Bass Lake Hills 1990 284 246 - 2BR 1,007 - 1,212 1,495 - 1,565 $1.29 - $1.48 No5875 Teakwood Ln N 4 38 - 3BR 1,487 - 1,780 1,800 - 1,930 $1.08 - $1.21CSM Corporation 1.4%
1,376 $1,720 $1.25
Underground parking included, fitness center, car wash bay, gas grill, playground, patio/terrace, dishwasher, kitchen pantry, in unit washer & dryer, outdoor hot-tub with heated deck
Picnic & BBQ area, additional storage units, walk-in closets, in-unit washer & dryer, car washing station, fitness center, business center, central air
$2,350
TABLE R-4SELECT GENERAL OCCUPANCY RENTAL DEVELOPMENT SURVEY
PLYMOUTH
530
$1.53
Square Foot
Continued
August 2017
MonthlyUnit Mix Rent
Bike storage & fix-it station, pet wash, tv room, sundeck, gas grills, surface parking & undergound parking garage, fitness center, pool, in-unit washer & dryer, ping pong table & bocce ball court, tax credit & market rate units offered
1,417
1,200
1,033 $1,300
598
825
517
$1.26
1,540
$1.36$1.08
Playground, fitness center, lounge/community room, outdoor heated pool with sundeck, sport court, picnic area, attached garages, dishwasher, in-unit washer &dryer, patios
$1,295 Pool, playground, gameroom, dishwasher, two car garage, balcony, near walking/bike trails, additional storage units
Dishwasher, in-unit washer & dryer, garage parking, oversized closets, grills available, picnic area, near walking/bike trails
Rent perUnit Size
$1,130
Outdoor pool, picnic area with grills, playground, hot tub, party room, DVD rentals, bussiness center, fitness center, theater room, undergound parking, in-unit washer & dryer, balcony, dishwasher, walk-in closet, central air
$1,460
On-site property manager, dishwasher, walk-in closets, heated underground parking, BBQ area, subsidized, affordable, & market rate units offered
9 foot ceilings, business center, fitness center, pool, basketball & racquetball courts, balcony, walk-in closets, car wash bay, DVD rental, heated parking garage, gas fireplces
$1,120 $2.11
957
1,525
950$1,295
Dog park, fitness center, game room, playground, outdoor pool & hot tub, clubhouse, central air, gas fireplaces, in-unit washer & dryers, walk-in closets, patio/balconies, underground & surface parking

RENTAL MARKET ANALYSIS
MAXFIELD RESEARCH AND CONSULTING 77
Year Units/ AcceptProperty Name/Location Built Vacant Vouchers Amenities/Comments
Market RateVicksburg Village 1989 370 104 - 1BR 785 - 822 $1,214 - $1,454 $1.55 - $1.77 No15730 Rockford Road 13 198 - 2BR $1,367 - $1,742 $1.31 - $1.51NA 3.5% 36 - 2BR/D 1,248 - 1,528 $2,229 - $2,294 $1.50 - $1.79
32 - 3BR 1,367 - 1,521 $1,766 - $1,958 $1.29 - $1.29
Stonehill 1988 224 6 - Studio $950 - $995 $1.76 - $1.84 No3501 Xenium Ln N 0 90 - 1BR 781 - 893 $1,160 - $1,225 $1.37 - $1.49StuartCo 0.0% 110 - 2BR 1,084 - 1,260 $1,410 - $1,460 $1.16 - $1.30
12 - 2BR/D $1,595 - $1,665 $1.23 - $1.296 - 3BR $1,685 - $1,725 $1.16 - $1.19
Coachman Trails 1988 156 3 - Studio $975 - $1,000 $1.79 - $1.83 No1405 Olive Ln N 2 42 - 1BR 832 - 979 $1,100 - $1,175 $1.20 - $1.32StuartCo 1.3% 6 - 1BR/D $1,200 - $1,250 $1.04 - $1.08
96 - 2BR 1,142 - 1,499 $1,310 - $1,560 $1.04 - $1.159 - 2BR/D $1,495 - $1,550 $1.15 - $1.20
Parkers Lake Apartments 1988 248 74 - 1BR 870 - 910 $1,318 - $1,569 $1.51 - $1.72 No15100 18th Ave N 6 144 - 2BR 1,000 - 1,150 $1,299 - $1,926 $1.30 - $1.67Timberland Partners 2.4% 30 - 3BR $1,784 - $2,389 $1.43 - $1.91
Hummingbird Cove 1988 74 24 - 1BR $950 - $1,000 $1.19 - $1.25 No10405 45th Ave N 0 48 - 2BR 1,112 - 1,194 $1,060 - $1,185 $0.95 - $0.99Hornig Companies 0.0% 2 - 3BR $1,500 - $1,600 $1.02 - $1.09
Plymouth Square at 37th 1987 160 80 - 1BR 752 - 857 $1,150 - $1,765 $1.53 - $2.06 No15300 37th Ave N 1 68 - 2BR 1,003 - 1,238 $1,235 - $2,110 $1.23 - $1.70Weidner Apartment Homes 0.6% 12 - 3BR $1,615 - $2,310 $1.31 - $1.88
Plymouth Ponds 1987 200 60 - 1BR $1,080 - $1,250 $1.37 - $1.59 Yes4545 Nathan Ln N 0 130 - 2BR 1,018 - 1,378 $1,090 - $1,575 $1.07 - $1.14Thies & Talle Management 0.0% 10 - 3BR $1,610 - $1,710 $1.12 - $1.19
Parkside at Medicine Lake 1986 148 13 - Studio No12102 41st Ave N 6 44 - 1BR 770 - 808 $1,095 - $1,135 $1.40 - $1.42StuartCo 4.1% 87 - 2BR 1,008 - 1,233 $1,200 - $1,290 $1.19 - $1.28
4 - 3BR 1,233 - 1,344 $1,545 - $1,610 $1.20 - $1.25
Summer Creek 1985 72 21 - 1BR 742 - 768 $1,000 - $1,145 $1.35 - $1.49 No3900 Plymouth Boulevard 1 45 - 2BR 976 - 1,076 $1,000 - $1,295 $1.02 - $1.20NA 1.4% 6 - 3BR 1,194 - 1,225 $1,245 - $1,495 $1.04 - $1.22
Fox Forest Townhomes 1985 160 80 - 2BR 1,008 - 1,382 $1,620 - $1,715 $1.24 - $1.61 No1798 Magnolia Ln N 5 80 - 3BR $1,799 - $1,880 $1.25 - $1.31Park Avenue of Wayzata 3.1%
Park Place Apartments 1985 500 120 - 1BR $1,196 - $1,684 $1.25 - $1.76 No14550 34th Avenue N 11 380 - 2BR 1,144 - 1,308 $1,356 - $1,767 $1.19 - $1.35Greystar 2.2%
1,250
1,434
1,159
545
1,296
801
$1.64
1,473
1,042
1,294
Fitness center, sauna, pool, tennis court, near walking/bike trails, patio/balcony, dishwasher, additional storage space, in-unit washer & dryer, fireplace
958 Dishwasher, clubhouse, fitness center, walk-in closet, central air, horse shoes, two pools with sun deck, covered parking, business center, near walking/biking trails
Outdoor pool, heated underground garage, car wash facility, patio/balcony, BBQ, in-unit washer & dryer, bicycle racks, flexible lease lengths, picnic area, dishwasher$1,435
BBQ, car wash with vacuum, community room, fitness center, heated underground parking, pool, dishwasher, in-unit washer & dryer, patio/balcony
Attached garage, business center, clubhouse, fitness center, BBQ, plyground, outdoor pool with sundeck, on-site management, patio/balcony, dishwasher, fireplace, in-unit washer & dryer, walk-in closet
Billiard room, fitness center, indoor whirlpool, outdoor pool, party room, theater room, underground heated parking, car wash station, balcony/patio, in-unit washer & dryer, central air
Rent per
560 $920
788
Continued
Business center, fitness center, spa/hot tub, pool, tennis courts, dishwasher, additional storage, fireplace, in-unit washer & dryer
SELECT GENERAL OCCUPANCY RENTAL DEVELOPMENT SURVEYPLYMOUTH
TABLE R-4
August 2017
Unit Mix Unit Size Rent Square Foot
540
Monthly
Patio, in-unit washer & dryer, two-car garage, plyground, grill, boat docks, walk-in closet, dishwasher
Outdoor pol, sauna, lounge, underground parking, laundry facilities, two fitness centers, additional storage space, picnic area with grill, near walking/biking trail, dishwasher
BBQ & picnic area, billiards room, community room, business center, outdoor pool with sundeck, playground, two fitness centers, heated underground parking, balcony
1,447
1,231
In-unit washer & dryer, car wash area, clubhouse, conference room, patio/balcony, fitness center, heated underground garage, outdoor kitchen & firepit, sauna, flexible lease lengths, dog park

RENTAL MARKET ANALYSIS
MAXFIELD RESEARCH AND CONSULTING 78
Year Units/ AcceptProperty Name/Location Built Vacant Vouchers Amenities/Comments
Market RateMedicine Lake Woods 1984 17 2 - 1BR $950 - $995 $1.27 - $1.33 No11210 12th Ave N 1 14 - 2BRNA 5.9% 1 - 3BR
Oakwood 1978 107 44 - 1BR 717 - 741 $980 - $1,095 $1.37 - $1.48 No17600 14th Ave 4 61 - 2BR 961 - 1,011 $1,070 - $1,295 $1.11 - $1.28Bigos Management 3.7% 2 - 2BR/D $1,285 - $1,355 $1.17 - $1.23
Medicine Lake Apartments 1977 81 1 - Studio $1,065 - $1,115 $1.26 - $1.31 No1300 W Medicine Lake Dr 3 55 - 1BR $1,150 - $1,200 $1.28 - $1.33Bigos Management 3.7% 25 - 2BR 1,152 - 1,185 $1,130 - $1,524 $0.98 - $1.29
Willow Creek Apartments 1977 245 26 - Studio 500 - 674 $955 - $1,095 $1.62 - $1.91 No135 Nathan Lane N 14 84 - 1BR $1,145 - $1,220 $1.64 - $1.74Bigos Management 5.7% 135 - 2BR 800 - 1,000 $1,255 - $1,445 $1.45 - $1.57
Lancaster Village 1974 128 62 - 1BR 700 - 750 $885 - $970 $1.26 - $1.29 Yes3610 Lancaster Ln N 1 64 - 2BR 900 - 950 $1,065 - $1,200 $1.18 - $1.26CSM Corporation 0.8% 2 - 3BR
Wellington Apartments 1973 39 16 - 1BR $925 - $1,075 $1.10 - $1.28 No17210 County Road 6 1 23 - 2BR $1,005 - $1,155 $1.01 - $1.16NA 2.6%
Plymouth Commons 1972 212 29 - Studio $750 - $825 $1.29 - $1.42 No3301 Hwy 169 N 0 83 - 1BR $850 - $975 $1.00 - $1.15Gary Brummer Management 0.0% 3 - 1BR/D $900 - $1,000 $1.00 - $1.11
97 - 2BR 1,034 - 1,227 $950 - $1,250 $0.92 - $1.02
Currents 1971 262 196 - 1BR 518 - 818 $962 - $1,020 $1.25 - $1.86 Yes3205 Harbor Ln N 0 66 - 2BR $1,150 - $1,299 $1.00 - $1.13Miramar Inc 0.0%
At the Lake 1971 143 8 - Studio 490 - 500 $729 - $779 $1.49 - $1.56 Yes2500 Nathan Ln N 0 76 - 1BR 750 - 750 $859 - $969 $1.15 - $1.29MN Apartment People 0.0% 51 - 2BR 950 - 1,050 $979 - $1,109 $1.03 - $1.06
8 - 3BR 1,200 - 1,200 $1,149 - $1,415 $0.96 - $1.18Manor Royal 1971 132 72 - 1BR $985 - $1,005 $1.23 - $1.26 No3930 Lancaster Ln N 3 60 - 2BR 1,130 - 1,200 $1,125 - $1,225 $1.00 - $1.02Real Estate Equities Inc 2.3%
Granite Woods 1971 192 42 - 1BR $929 - $999 $1.18 - $1.27 No3925 Landcaster Ln N 1 150 - 2BR 980 - 1,080 $1,150 - $1,200 $1.11 - $1.17Main Street Companies 0.5%
$1.42
1,150
1,100
Rent Square Foot
840
Tennis & vollyball court, plyground, outdoor pool, tanning, business center, fitness center, sauna, indoor pool, whirlpool, DVD library, community room, underground & surface parking, patio/balcony, dishwasher, central air
$1.29$1.14
Walk-in closet, tennis court, pool, sauna, fitness center, clubhouse, additional storage space, dishwasher, underground & surface parking
850
786
900
Clubhouse, fitness center, outdoor heated pool with sundeck, picnic area with grills, playground, surface & garage parking
Dishwasher, patio/balcony, laundry facilities, BBQ, picnic area, fitness center, playground, garage parking, near walking/biking trails
850
800 Flexible lease terms, dishwasher, laundry facilities, underground heated parking, patio/balcony, indoor pool, community room, fitness center
Outdoor & indoor pool, dry sauna, fitness center, outdoor courtyard, picnic area with BBQ stations, multi-sport court, dog park, playground, tanning suite, coffee café, business center, DVD rentals, dry cleaning service
583
Unit Size
Grill & picnic area, laundry facility, tanning salon, dishwasher, balcony, fitness center, playground, pool, sauna, basketball & volleyball court
$1,250
900
750
1,100
848
1,000
700
$1,095Additional storage, patio, garage & surface parking, dishwasher, walk-in closet
ContinuedTABLE R-4
SELECT GENERAL OCCUPANCY RENTAL DEVELOPMENT SURVEYPLYMOUTHAugust 2017
Walk-in closets, volleyball court, pool, sauna, laundry facilites, additianl storage units, balcony, BBQ, garage and surface parking
Monthly Rent per
Underground heated parking, boat docks, outhdoor pool, multi-sport court, fitness center, party room, DVD library, sauna, dishwasher
DVD library, outdoor pool, fitness center, BBQ & picninc area, underground heated parking, playground, party room, laundry facilities, patio/balcony, cenral air, dishwasher
Unit Mix
1,100 $1,560

RENTAL MARKET ANALYSIS
MAXFIELD RESEARCH AND CONSULTING 79
Year Units/ AcceptProperty Name/Location Built Vacant Vouchers Amenities/Comments
Market RatePlymouth Pointe 1969 96 2 - Studio $785 - $865 $1.21 - $1.33 No9630 37th Pl N 2 40 - 1BR $855 - $995 $1.07 - $1.24KMS Management Inc 2.1% 54 - 2BR 1,000 - 1,100 $996 - $1,165 $1.00 - $1.06
South Shore 1969 17 17 - 2BR No10890 South Shore Dr 0NA 0.0%
Countryside Estates 1968 72 35 - 1BR $860 - $925 $1.14 - $1.23 No10101 State Highway 55 1 37 - 2BR $960 - $990 $1.12 - $1.16Steven Scott Management 1.4%
Four Seasons Estates 1968 96 56 - 1BR $849 - $959 $0.99 - $1.12 No9700 37th Pl N 0 40 - 2BR $985 - $1,049 $0.90 - $0.95MN Apartment People 0.0%
Four Seasons Villas 1967 240 18 - Studio $779 - $799 $1.30 - $1.33 No3651 Lancaster Ln N 0 144 - 1BRGary Brummer Management 0.0% 78 - 2BR 1,000 - 1,250 $0.78 - $0.97
Plymouth Colony 1945 126 2 - Studio Yes1805 County Road 101 0 22 - 1BR $850 - $985 $1.02 - $1.18MN Apartment People 0.0% 102 - 2BR 900 - 1,026 $950 - $1,085 $1.06 - $1.06
Market Rate Total 6,372 115 1.805%
Plymouth Market Area Totals* 6,972 115 1.649%
*Vacancy Rate excludes properties that did participate in rental survey.Source: City of Plymouth; Maxfield Research & Consulting, LLC
1,100
Additional storage space, balcony/patio, BBQ, surface & garage parking, dishwasher, picnic area
Additional storage units, housekeeping, clubhouse, fitness center, pool, volleyball court, walk-in closet, sundeck, courtyard, picnic area
Dishwasher, underground & surface parking, pet play area, additional storage units, balcony, fitness center, sauna, pool, playground, theatre room
$869$969
600
860
1,000
832
Garage & surface parking, balcony, BBQ & picnic area, dishwasher, fitness center, sauna, pool
Balcony, garage & surface parking, nearby parks & playground
$0.97
755
$1,150
900
855
$1.15
$750 $1.43
650 Party room, laundry facilities, property manger on-site, dishwasher, sundeck, clubhouse, additional storage space, fitness center, pool800
525
Unit Mix Unit Size Rent Square Foot
ContinuedTABLE R-4
SELECT GENERAL OCCUPANCY RENTAL DEVELOPMENT SURVEYPLYMOUTHAugust 2017
Monthly Rent per

RENTAL MARKET ANALYSIS
MAXFIELD RESEARCH AND CONSULTING 80
Market Rate
Total % of Avg. Avg. Rent/Unit Type Units Total Low - High Rent Sq. Ft.
Studio 145 2% $729 - $1,200 $942 $1.671BR 2299 36% $620 - $2,805 $1,178 $1.461BR/D 127 2% $900 $1,695 $1,378 $1.362BR 3,293 52% $745 - $3,000 $1,411 $1.272BR/D 139 2% $1,285 $2,350 $1,794 $1.323BR 367 6% $970 - $4,208 $1,875 $1.36 Total: 6,372 100% $620 - $4,208 $1,351 $1.34Vacant: 115 1.8%
AffordableTotal % of Avg. Avg. Rent/
Unit Type Units Total Low - High Rent Sq. Ft.
1BR 4 3% $764 - $764 $764 $0.802BR 52 40% $915 - $1,075 $958 $0.873BR 73 57% $1,054 $1,238 $1,175 $0.86 Total: 129 100% $764 - $1,238 $1,075 $0.86Vacant: 0 0%
*
Source: Maxfield Research and Consulting, LLC
This table includes data from rental developments that provided complete survey information
Range
R-5SURVEYED UNIT TYPE SUMMARY
SELECT GENERAL OCCUPANCY RENTAL DEVELOPMENTS
August 2017
Monthly Rents
CITY OF PLYMOUTH
Monthly RentsRange

RENTAL MARKET ANALYSIS
MAXFIELD RESEARCH AND CONSULTING 81
Select general occupancy rental projects – Plymouth, MN
The Axis Apartments
350 Nathan Ln Shenandoah Woods Apartments
2205 Shenandoah Ln N
Parkside Apartments
12105 41st Ave N Stone Creek Apartments
1020 W Medicine Lake Dr
Vicksburg Village
15730 Rockford Rd The Quinn Apartments 6110 Quinwood Ln N

RENTAL MARKET ANALYSIS
MAXFIELD RESEARCH AND CONSULTING 82
At the Lake Apartments
2500 Nathan Ln N Hummingbird Cove Apartments
10405 45th Ave N
Lancaster Park
4015 Lancaster Ln N Manor Royal Apartments
3930 Lancaster Ln N
Medicine Lake Apartments 1300 W Medicine Lake Dr
Stoneleigh at the Reserve 5200 Annapolis Ln N

RENTAL MARKET ANALYSIS
MAXFIELD RESEARCH AND CONSULTING 83

RENTAL MARKET ANALYSIS
MAXFIELD RESEARCH AND CONSULTING 84
1 At the Lake2 Bass Lake Hills3 Coachman Trails4 Countryside Estates5 Creekside Estates6 Currents7 Ellen Villa8 Fernbrook Townhomes9 Four Seasons Estates
10 Four Seasons Villas11 Fox Forest Townhomes12 Granite Woods13 Hummingbird Cove14 Lancaster Park15 Lancaster Village16 Manor Royal17 Medicine Lake Apartments18 Medicine Lake Woods19 Oakwood20 Park Place Apartments21 Parkers Lake Apartments22 Parkside at Medicine Lake23 Plymouth Colony24 Plymouth Commons25 Plymouth Pointe26 Plymouth Ponds27 Plymouth Square at 37th28 Shadow Hills29 South Shore30 Stone Creek Apartments31 Stonehill32 Stoneleigh at the Reserve33 Summer Creek34 Sun Valley Mobile Homes35 The Quinn36 Vicksburg Commons37 Vicksburg Village38 Wellington Apartments39 Willow Creek40 Lakeview Commons41 Shenandoah Woods42 The Axis43 West View Estates44 Kimberly Meadows45 Mission Oaks46 Willow Woods Estates
Source: Maxfield Research & Consulting, LLC
MAP KEYGENERAL OCCUPANCY RENTAL HOUSING DEVELOPMENTS
CITY OF PLYMOUTHAugust 2017
RENTAL MARKET ANALYSIS
MAXFIELD RESEARCH AND CONSULTING 85
Natural Occurring Affordable Housing (i.e. Unsubsidized Affordable) Although affordable housing is typically associated with an income-restricted property, there are other housing units in communities that indirectly provide affordable housing. Housing units that were not developed or designated with income guidelines (i.e. assisted) yet are more affordable than other units in a community are considered “naturally-occurring” or “unsubsi-dized affordable” units. This rental supply is available through the private market, versus as-sisted housing programs through various governmental agencies. Property values on these units are lower based on a combination of factors, such as: age of structure/housing stock, loca-tion, condition, size, functionally obsolete, school district, etc. According to the Joint Center for Housing Studies of Harvard University, the privately unsubsi-dized housing stock supplies three times as many low-cost affordable units than assisted pro-jects nationwide. Unlike assisted rental developments, most unsubsidized affordable units are scattered across small properties (one to four unit structures) or in older multifamily structures. Many of these older developments are vulnerable to redevelopment due to their age, modest rents, and deferred maintenance. Because many of these projects have affordable rents, project-based and private housing mar-kets cannot be easily separated. Some household’s income-qualify for both market rate and project-based affordable housing. Therefore, it is important to recognize the naturally-occur-ring affordable housing stock to quantify the proportion of renters that might be eligible for housing assistance based on income. Table R-6 illustrates monthly rents by unit type and household size as they relate to affordability. Table R-7 presents a breakdown of all market rate general-occupancy rental projects by household size and area median income (AMI). Table R-8 summarizes project data from Table R-7 based on unit type and affordability. • Among the over 5,952 market rate units that were inventoried by unit mix and monthly
rents, over 14% of the units are affordable to householders at 50% AMI. Together with 32% of the units affordable at 60% AMI, over 46% of the market rate rental housing inventory is affordable at 50% to 60% AMI.
• Over 47% of market rate one-bedroom units are affordable at 50% AMI. Comparatively, two-bedroom units and three-bedroom units were 44% and 1%, respectively.
• About 53% of the inventoried market rate units have monthly rents that would be afforda-
ble to householders earning 80% to 120% of AMI. These households would qualify for “workforce” housing. Comparatively, roughly 94% of the inventoried market rate units have monthly rents that would be affordable to householders earning 50% to 80% of AMI.

RENTAL MARKET ANALYSIS
MAXFIELD RESEARCH AND CONSULTING 86
Unit Type1 Min Max Min. Max. Min. Max. Min. Max. Min. Max. Min. Max. Min. Max.Studio 1 1 $451 - $451 $751 - $751 $902 - $902 $1,202 - $1,202 $1,503 - $1,503 $1,803 - $1,8031BR 1 2 $451 - $515 $751 - $858 $902 - $1,029 $1,202 - $1,372 $1,503 - $1,715 $1,803 - $2,0582BR 2 4 $515 - $644 $858 - $1,073 $1,029 - $1,287 $1,372 - $1,716 $1,715 - $2,145 $2,058 - $2,5743BR 3 6 $579 - $746 $965 - $1,244 $1,158 - $1,493 $1,544 - $1,990 $1,930 - $2,488 $2,316 - $2,9854BR 4 8 $644 - $850 $1,073 - $1,416 $1,287 - $1,700 $1,716 - $2,266 $2,145 - $2,833 $2,574 - $3,399
Sources: HUD, Novogradac, Maxfield Research and Consulting, LLC
TABLE R-6
1 One-bedroom plus den and two-bedroom plus den units are classified as 1BR and 2BR units, respectively. To be classified as a bedroom, a den must have a window and closet.
MAXIMUM RENT BASED ON HOUSEHOLD SIZE AND AREA MEDIAN INCOMEHENNEPIN COUNTY - 2017
Note: 4-person Hennepin County AMI is $85,800 (2016)
HHD SizeMaximum Rent Based on Household Size (@30% of Income)
30% 60% 80% 100% 120%50%

RENTAL MARKET ANALYSIS
MAXFIELD RESEARCH AND CONSULTING 87
TotalUnit Type/Project Name Units Min Max 30% 50% 60% 80% 100% 120%
StudioAt the Lake 8 $729 $779 $29,160 - $31,160 -- 8 -- -- -- --Coachman Trails 3 $975 $1,000 $39,000 - $40,000 -- -- 3 -- -- --Four Seasons Villas 18 $779 $799 $31,160 - $31,960 -- 18 -- -- -- --Medicine Lake Apartments 1 $1,065 $1,115 $42,600 - $44,600 -- -- 1 -- -- --Parkside at Medicine Lake 13 $920 $920 $36,800 - $36,800 -- -- 13 -- -- --Plymouth Colony 2 $750 $750 $30,000 - $30,000 -- 2 -- -- -- --Plymouth Commons 29 $750 $825 $30,000 - $33,000 -- 29 -- -- -- --Plymouth Pointe 2 $785 $865 $31,400 - $34,600 -- 2 -- -- -- --Stone Creek Apartments 16 $1,100 $1,200 $44,000 - $48,000 -- -- -- 16 -- --Stonehill 6 $950 $995 $38,000 - $39,800 -- -- 6 -- -- --Stoneleigh at the Reserve 21 $1,120 $1,120 $44,800 - $44,800 -- -- -- 21 -- --Willow Creek Apartments 26 $955 $1,095 $38,200 - $43,800 -- -- 26 -- -- --
Total/ Average -- 60 50 37 -- --
One-Bedroom 30% 50% 60% 80% 100% 120%At the Lake 76 $859 $869 $34,360 - $34,760 -- 76 -- -- -- --Coachman Trails 42 $1,100 $1,175 $44,000 - $47,000 -- -- 42 -- -- --Countryside Estates 35 $860 $925 $34,400 - $37,000 -- 45 -- -- -- --Creekside Estates 45 $1,130 $1,130 $45,200 - $45,200 -- -- 45 -- -- --Currents 139 $962 $1,020 $38,480 - $40,800 -- -- 139 -- -- --Four Seasons Estates 56 $849 $959 $33,960 - $38,360 -- 28 28 -- -- --Four Seasons Villas 144 $869 $869 $34,760 - $34,760 -- 144 -- -- -- --Granite Woods 42 $929 $999 $37,160 - $39,960 -- -- 42 -- -- --Hummingbird Cove 24 $950 $1,000 $38,000 - $40,000 -- -- 24 -- -- --Lancaster Park 6 $1,110 $1,310 $44,400 - $52,400 -- -- 3 3 -- --Lancaster Village 62 $885 $970 $35,400 - $38,800 -- 31 31 -- -- --Manor Royal 72 $985 $1,005 $39,400 - $40,200 -- -- 72 -- -- --Medicine Lake Apartments 55 $1,150 $1,200 $46,000 - $48,000 -- -- -- 55 -- --Medicine Lake Woods 2 $950 $995 $38,000 - $39,800 -- -- 2 -- -- --Oakwood 44 $980 $1,095 $39,200 - $43,800 -- -- 44 -- -- --Park Place Apartments 120 $1,196 $1,684 $47,840 - $67,360 -- -- -- 60 60 --Parkers Lake Apartments 74 $1,318 $1,569 $52,720 - $62,760 -- -- -- 74 -- --Parkside at Medicine Lake 44 $1,095 $1,135 $43,800 - $45,400 -- -- -- 44 -- --Plymouth Colony 22 $850 $985 $34,000 - $39,400 -- 11 11 -- -- --Plymouth Commons 83 $850 $975 $34,000 - $39,000 -- 42 41 -- -- --Plymouth Pointe 40 $855 $995 $34,200 - $39,800 -- 20 20 -- -- --Plymouth Ponds 60 $1,018 $1,378 $40,720 - $55,120 -- -- 30 30 -- --Plymouth Square at 37th 80 $1,150 $1,765 $46,000 - $70,600 -- -- -- 40 40 --Shadow Hills 119 $1,156 $1,326 $46,240 - $53,040 -- -- -- 119 -- --Shenandoah Woods 6 $620 $695 $24,800 - $27,800 -- 6 -- -- -- --Stonehill 90 $1,160 $1,225 $46,400 - $49,000 -- -- 45 45 -- --Stoneleigh at the Reserve 211 $1,200 $1,280 $48,000 - $51,200 -- -- -- 211 -- --Summer Creek 21 $1,000 $1,145 $40,000 - $45,800 -- -- 21 -- -- --The Axis 87 $1,275 $1,495 $51,000 - $59,800 -- -- -- 87 -- --The Quinn 125 $1,084 $2,805 $43,360 - $112,200 -- -- -- 43 41 41Vicksburg Village 104 $1,214 $1,454 $48,560 - $58,160 -- -- -- 104 -- --Wellington Apartments 39 $925 $1,075 $37,000 - $43,000 -- -- 39 -- -- --Willow Creek Apartments 84 $1,145 $1,220 $45,800 - $48,800 -- -- 42 42 -- --Total/Average 2,253 -- 403 721 957 141 41
One-Bedroom plus Den 30% 50% 60% 80% 100% 120%Coachman Trails 6 $1,200 $1,250 $48,000 - $50,000 -- -- -- 6 -- --Creekside Estates 42 $1,460 $1,460 $58,400 - $58,400 -- -- -- 42 -- --Parkside at Medicine Lake 30 $1,200 $1,270 $48,000 - $50,800 -- -- -- 30 -- --Plymouth Commons 3 $900 $1,000 $36,000 - $40,000 -- -- 3 -- -- --Shadow Hills 18 $1,280 $1,305 $51,200 - $52,200 -- -- -- 18 -- --Stone Creek Apartments 16 $1,490 $2,005 $59,600 - $80,200 -- -- -- -- 8 8Stoneleigh at the Reserve 42 $1,300 $1,300 $52,000 - $52,000 -- -- -- 42 -- --Total/Average 157 -- -- 3 138 8 8
Needed to Afford1
TABLE R-7MULTIFAMILY MARKET RATE RENTAL DEVELOPMENTS
NATURALLY OCCURRING AFFORDABLE RENTAL HOUSINGCITY OF PLYMOUTH
August 2017
Rent Range Min. Income Units that are Market Rate Affordability by AMI2
Continued

RENTAL MARKET ANALYSIS
MAXFIELD RESEARCH AND CONSULTING 88
AffUnit Type/Project Name Units Min Max 30% 50% 60% 80% 100% 120%
Two-Bedroom 30% 50% 60% 80% 100% 120%At the Lake 51 $979 $1,109 $39,160 - $44,360 -- 26 25 -- -- --Bass Lake Hills 246 $1,495 $1,565 $59,800 - $62,600 -- -- -- 246 -- --Coachman Trails 95 $1,310 $1,365 $52,400 - $54,600 -- -- 95 -- -- --Countryside Estates 37 $960 $990 $38,400 - $39,600 -- 37 -- -- -- --Creekside Estates 117 $1,335 $1,520 $53,400 - $60,800 -- -- 22 95 -- --Currents 171 $1,150 $1,299 $46,000 - $51,960 -- -- 171 -- -- --Fernbrook Townhomes 1 $1,295 $1,295 $51,800 - $51,800 -- -- 1 -- -- --Four Seasons Estates 40 $985 $1,049 $39,400 - $41,960 -- 40 -- -- -- --Four Seasons Villas 78 $969 $969 $38,760 - $38,760 -- 78 -- -- -- --Fox Forest Townhomes 80 $1,620 $1,715 $64,800 - $68,600 -- -- -- 80 -- --Granite Woods 150 $1,150 $1,200 $46,000 - $48,000 -- -- 150 -- -- --Hummingbird Cove 48 $1,060 $1,185 $42,400 - $47,400 -- -- 48 -- -- --Lancaser Park 44 $1,310 $1,610 $52,400 - $64,400 -- -- -- 44 -- --Lancaster Village 64 $1,065 $1,200 $42,600 - $48,000 -- -- 64 -- -- --Manor Royal 60 $1,125 $1,225 $45,000 - $49,000 -- -- 60 -- -- --Medicine Lake Apartments 25 $1,130 $1,524 $45,200 - $60,960 -- -- 20 5 -- --Medicine Lake Woods 14 $1,095 $1,095 $43,800 - $43,800 -- 14 -- -- -- --Oakwood 61 $1,070 $1,295 $42,800 - $51,800 -- -- 61 -- -- --Park Place Apartments 380 $1,356 $1,767 $54,240 - $70,680 -- -- -- 380 -- --Parkers Lake Apartments 144 $1,299 $1,926 $51,960 - $77,040 -- -- -- 144 -- --Parkside at Medicine Lake 87 $1,235 $1,290 $49,400 - $51,600 -- -- 87 -- -- --Plymouth Colony 102 $950 $1,085 $38,000 - $43,400 -- 102 -- -- -- --Plymouth Commons 97 $950 $1,250 $38,000 - $50,000 -- -- 97 -- -- --Plymouth Pointe 54 $996 $1,165 $39,840 - $46,600 -- 54 -- -- -- --Plymouth Ponds 130 $1,090 $1,575 $43,600 - $63,000 -- -- 110 20 -- --Plymouth Square at 37th Shadow Hills 68 $1,235 $2,110 $49,400 - $84,400 -- -- 22 23 23 --Shadow Hills 130 $1,370 $1,525 $54,800 - $61,000 -- -- -- 130 -- --Shenandoah Woods 8 $745 $905 $29,800 - $36,200 -- 8 -- -- -- --South Shore 17 $1,150 $1,150 $46,000 - $46,000 -- -- 17 -- -- --Stone Creek Apartments 70 $1,750 $2,495 $70,000 - $99,800 -- -- -- -- 35 35Stonehill 110 $1,410 $1,460 $56,400 - $58,400 -- -- -- 110 -- --Stoneleigh at the Reserve 63 $1,535 $1,565 $61,400 - $62,600 -- -- -- 63 -- --Summer Creek 45 $1,000 $1,295 $40,000 - $51,800 -- -- 45 -- -- --The Axis 54 $1,920 $2,100 $76,800 - $84,000 -- -- -- -- 54 --The Quinn 136 $1,243 $3,000 $49,720 - $120,000 -- -- 34 34 34 34Vicksburg Village 198 $1,367 $1,742 $54,680 - $69,680 -- -- -- 198 -- --Wellington Apartments 23 $1,005 $1,155 $40,200 - $46,200 -- -- 23 -- -- --Willow Creek Apartments 135 $1,255 $1,445 $50,200 - $57,800 -- -- 135 -- -- --Total/ Average 3,433 -- 359 1,287 1,572 146 69
TABLE R-7 ContinuedMULTIFAMILY MARKET RATE RENTAL DEVELOPMENTS
NATURALLY OCCURRING RENTAL HOUSINGCITY OF PLYMOUTH
Needed to Afford1Min. Income
August 2017
Rent Range Units that are Market Rate Affordability by AMI2
Continued

RENTAL MARKET ANALYSIS
MAXFIELD RESEARCH AND CONSULTING 89
AffUnit Type/Project Name Units Min Max 30% 50% 60% 80% 100% 120%
Two-Bedroom + Den 30% 50% 60% 80% 100% 120%Coachman Trails 9 $1,495 $1,550 $59,800 - $62,000 -- -- -- 9 -- --Oakwood 2 $1,285 $1,355 $51,400 - $54,200 -- -- 2 -- -- --Shadow Hills 52 $1,500 $1,629 $60,000 - $65,160 -- -- -- 52 -- --Stonehill 12 $1,595 $1,665 $63,800 - $66,600 -- -- -- 12 -- --Stoneleigh at the Reserve 24 $1,720 $1,720 $68,800 - $68,800 -- -- -- 24 -- --The Axis 4 $2,350 $2,350 $94,000 - $94,000 -- -- -- -- -- 4Vicksburg Village 36 $2,229 $2,294 $89,160 - $91,760 -- -- -- -- -- 36$ $Total/ Average 139 -- -- 2 97 -- 40
AffUnit Type/Project Name Units Min Max 30% 50% 60% 80% 100% 120%
Two-Bedroom - PenthouseCoachman Trails 1 $1,560 $1,560 $62,400 - $62,400 -- -- -- 1 -- --Total/ Average 1 -- -- -- 1 -- --
Three Bedroom 30% 50% 60% 80% 100% 120%At the Lake 8 $1,149 $1,415 $45,960 - $56,600 -- 4 4 -- -- --Bass Lake Hills 38 $1,800 $1,930 $72,000 - $77,200 -- -- -- 38 -- --Currents 15 $1,850 $1,850 $74,000 - $74,000 -- -- -- 15 -- --Fernbrook Townhomes 71 $1,295 $1,295 $51,800 - $51,800 -- -- 71 -- -- --Fox Forest Townhomes 80 $1,799 $1,880 $71,960 - $75,200 -- -- -- 80 -- --Hummingbird Cove 2 $1,500 $1,600 $60,000 - $64,000 -- -- 2 -- -- --Lancaster Village 2 $1,425 $1,625 $57,000 - $65,000 -- -- 2 -- -- --Medicine Lake Woods 1 $1,250 $1,250 $50,000 - $50,000 -- 1 -- -- -- --Parkers Lake Apartments 30 $1,784 $2,389 $71,360 - $95,560 -- -- -- 15 15 --Parkside at Medicine Lake 4 $1,545 $1,610 $61,800 - $64,400 -- -- 4 -- -- --Plymouth Ponds 10 $1,610 $1,710 $64,400 - $68,400 -- -- -- 10 -- --Plymouth Square at 37th 12 $1,615 $2,310 $64,600 - $92,400 -- -- -- 6 6 --Shadow Hills 3 $1,695 $1,725 $67,800 - $69,000 -- -- -- 3 -- --Shenandoah Woods 4 $970 $1,130 $38,800 - $45,200 -- 4 -- -- -- --Stone Creek Apartments 20 $2,100 $2,160 $84,000 - $86,400 -- -- -- -- 22 --Stonehill 6 $1,685 $1,725 $67,400 - $69,000 -- -- -- 6 -- --Summer Creek 6 $1,245 $1,495 $49,800 - $59,800 -- -- 6 -- -- --The Quinn 40 $1,920 $4,208 $76,800 - $168,320 -- -- -- 14 13 13Vicksburg Village 32 $1,766 $1,958 $70,640 - $78,320 -- -- -- 32 -- 9
Total/ Average 384 -- 9 89 219 56 22
1 Based on a 30% allocation of income to housing for general-occupancy. Senior housing projects were excluded from the calculation.
Source: Maxfield Research & Consulting, LLC
2 Market rate housing that has rents that could be classified as "unsubsidized affordable" units based on the monthly rents and adjusted for household size.
TABLE R-7 ContinuedMULTIFAMILY MARKET RATE RENTAL DEVELOPMENTS
NATURALLY OCCURRING RENTAL HOUSINGCITY OF PLYMOUTH
August 2017
Rent Range Min. Income Units that are Market Rate Affordability by AMI2
Needed to Afford1
Rent Range Min. Income Units that are Market Rate Affordability by AMI2
Needed to Afford1

RENTAL MARKET ANALYSIS
MAXFIELD RESEARCH AND CONSULTING 90
Licensed Rental Ordinance The City of Plymouth has an ordinance that requires the licensing of all rental properties in the community. The ordinance is designed to ensure all rental properties meet local building and fire safety codes. The rental ordinance requires that all landlords or owners register all rental housing units (from single-family homes to traditional multifamily apartment buildings) and ap-ply for a rental dwelling license. The city requires a license renewal every three years for one and two family dwellings and annual renewals for all other rental dwellings. In addition, initial inspection and periodic inspections to ensure minimum code requirements.
Unit Type 30% 50% 60% 80% 100% 120%
STUDIO -- 60 50 37 -- --
1 BR -- 403 721 957 141 --
1 BR + DEN -- -- 3 138 8 8
2 BR -- 359 1,287 1,572 146 69
2 BR + DEN -- -- -- 97 -- 40
2 BR PH -- -- -- 1 -- --
3 BR -- 9 89 219 56 22
Subtotal -- 831 2,150 3,021 351 139
Pct. Of Total 0.0% 12.8% 33.1% 46.5% 5.4% 2.1%
Pct. Of Affordability Category
STUDIO -- -- -- 1.2% -- --
1 BR -- 48.5% 33.5% 31.7% 40.2% --
1 BR + DEN -- -- -- 4.6% 2.3% 5.8%
2 BR -- 43.2% 59.9% 52.0% 41.6% 49.6%
2 BR + DEN -- -- -- 3.2% -- 28.8%
3 BR -- 1.1% -- 7.2% -- 15.8%
Source: Maxfield Research & Consulting, LLC
TABLE R-8
Market Rate Affordability by AMI
August 2017CITY OF PLYMOUTH
MULTIFAMILY MARKET RATE RENTAL DEVELOPMENTSNATURAL OCCURRING SUMMARY

RENTAL MARKET ANALYSIS
MAXFIELD RESEARCH AND CONSULTING 91

SENIOR HOUSING ANALYSIS
MAXFIELD RESEARCH AND CONSULTING 92
Senior Housing Defined The term “senior housing” refers to any housing development that is restricted to people age 55 or older. Today, senior housing includes an entire spectrum of housing alternatives, which occasionally overlap, thus making the differences somewhat ambiguous. However, the level of support services offered best distinguishes them. Maxfield Research and Consulting LLC classi-fies senior housing projects into five categories based on the level of support services offered: Adult/Few Services; where few, if any, support services are provided, and rents tend to be mod-est; Congregate/Optional-Services; where support services such as meals and light housekeeping are available for an additional fee; Congregate/Service-Intensive; where support services such as meals and light housekeeping are included in the monthly rents; Assisted Living; where two or three daily meals as well as basic support services such as trans-portation, housekeeping and/or linen changes are included in the fees. Personal care services such as assistance with bathing, grooming and dressing is included in the fees or is available ei-ther for an additional fee. Memory Care; where more rigorous and service-intensive personal care is required for people with dementia and Alzheimer’s disease. Typically, support services and meal plans are similar to those found at assisted living facilities, but the heightened levels of personalized care de-mand more staffing and higher rental fees. These five senior housing products tend to share several characteristics. First, they usually offer individual living apartments with living areas, bathrooms, and kitchens or kitchenettes. Second, they generally have an emergency response system with pull-cords or pendants to promote se-curity. Third, they often have a community room and other common space to encourage social-ization. Finally, they are age-restricted and offer conveniences desired by seniors, although as-sisted living projects sometimes serve non-elderly people with special health considerations. The five senior housing products offered today form a continuum of care (see the graphic on the following page), from a low level to a fairly intensive one; often the service offerings at one type overlap with those at another. In general, however, adult/few services projects tend to attract younger, more independent seniors, while assisted living and memory care projects tend to attract older, frailer seniors.

SENIOR HOUSING ANALYSIS
MAXFIELD RESEARCH AND CONSULTING 93
Senior Housing in Plymouth As of September 2017, Maxfield Research identified nine senior housing developments in Plym-outh. These properties contain a total of 914 units. There are 23 vacancies resulting in an over-all vacancy rate of 2.5% for senior housing developments. The equilibrium vacancy rate for sen-ior housing is considered to be between 5% and 7%. Table S-1 provides information on the senior market rate and properties with public assistance. Information in the table includes year built, number of units, unit mix, number of vacant units, rents, and general comments about each project. The following are key points from our survey of the senior housing supply. Market Rate Active Adult (Rental) • Vicksburg Crossing is the only active adult rental project in Plymouth. As of September
2017, there was no vacancy. There are 61 units in this 55+ community. • Market rate units at Vicksburg Crossing have rents from $1,090 for a one-bedroom, $1,250
for a one-bedroom plus den, and range from $1,325 to $1,445 for a two-bedroom unit. Subsidized/Affordable Active Adult (Rental) • Subsidized active adult senior housing offers affordable rents to qualified low income sen-
iors and handicapped/disabled persons. Typically, incomes are restricted to 30% of the area median income adjusted for household size. For those households meeting the age and in-come qualifications, subsidized senior housing is usually the most affordable rental option available. Affordable projects are typically tax-credit projects that are limited to households earning less than 60% of Hennepin County’s area median income.
Townhome or Apartment
Assisted Living
Memory Care (Alzheimer's and Dementia Units)
Nursing Facilities
Fully or Highly Dependent on Care
Senior Housing Product Type
Fully Independent Lifestyle
Source: Maxfield Research and Consulting, LLC
Single-Family Home
CONTINUUM OF HOUSING AND SERVICES FOR SENIORS
Age-Restricted Independent Single-Family, Townhomes, Apartments, Condominiums,
Cooperatives
Congregate Apartments w/ Optional Services
Congregate Service Intensive - Assisted Living with Light Services
SENIOR HOUSING ANALYSIS
MAXFIELD RESEARCH AND CONSULTING 94
• There are three subsidized/affordable active adult developments in Plymouth. As of Sep-tember 2017, there were two vacancies, for an overall vacancy rate of 1.1%. Equilibrium for senior subsidized housing projects is usually around 3%, allowing for optimal housing availa-bility for potential residents. Unit sizes at these senior properties are often smaller than many of the market rate senior rental projects. Some of these senior apartments also main-tain waiting lists for units.
Active Adult (Owner) • There are three cooperative/owner active adult facilities in Plymouth. As of September
2017, there were no vacancies across 210 total owner occupied units. • Tenants purchase their own one-bedroom, two-bedroom, or three-bedroom unit. The cur-
rent listing prices range from $42,000 to $61,299 for a one-bedroom unit, $52,000 to $75,824 for a two-bedroom unit, and $81,000 to $112,745 for a three-bedroom unit. In ad-dition, buyers pay a monthly fee.
Congregate • There are two congregate facilities in Plymouth. As of September 2017, there were no va-
cancies across 99 total congregate units. • Unit types offered are one-bedroom, one-bedroom plus den, and two-bedroom units
among congregate facilities in Plymouth. Monthly base rents range from $2,045 for a one-bedroom at Summer Wood of Plymouth to $3,995 for a two bedroom at the Waters of Plymouth.
Assisted Living • There are three facilities offering assisted living services in Plymouth. As of September
2017, there were five vacancies across 124 total assisted living units, for a vacancy rate of 2.5%.
• Market rate basic service rents range from $3,745 for a studio apartment at Cornerstone
Commons to $5,195 for a two-bedroom apartment at Waters of Plymouth. Additional cost is based on service level needed. Some common features include kitchenettes, private bathrooms, meals, laundry, and light housekeeping.
• Trillium Woods is a Continuing Care Retirement Community (CCRC) and offers independent
living, assisted living, and memory care units. CCRC commonly have a buy in to the facility or prepay for units and offer services with monthly fees.

SENIOR HOUSING ANALYSIS
MAXFIELD RESEARCH AND CONSULTING 95
Memory Care • There are four facilities offering memory care services in Plymouth. As of September 2017,
there were 16 vacant units across 122 total memory care units, for a vacancy rate of 13.1%. • Basic market rate rents for memory care range from $2,855 for a studio at Summer Wood
of Plymouth to $7,075 for a one-bedroom at Cornerstone Commons. There is additional cost based on service level needed. Some features include daily exercise and programs, din-ing, and common areas for recreation.
0.0%
2.0%
4.0%
6.0%
8.0%
10.0%
12.0%
14.0%
0
50
100
150
200
250
Active Adult -Rental
Sub/AffActive Adult
Active Adult -Owner
Congregate AssistedLiving
Memory Care CCRC
Vaca
ncy R
ate
Units
Senior Housing Summary Chart
No. Units Vacancy Rate
Note: Vacancies were not available for the only CCRC property.

SENIOR HOUSING ANALYSIS
MAXFIELD RESEARCH AND CONSULTING 96
Year No. of No.Project Name/City Built Units Vacant No. Type Min - Max Services/Amenities/Comments
Vicksburg Crossing 2006 61 0 31 - 1BR3155 Vicksburg Ln N 0.0% 8 - 1BR/D
22 - 2BR $1,325 - $1,445 $1.13 - $1.23
Sub/Aff Active AdultVicksburg Crossing 2006 33 0 33 - 1 BR 3155 Vicksburg Ln N 0.0%
Bassett Creek Commons 1998 46 0 45 - 1 BR10505 8th Ave N 0.0% 1 - 2 BR
Plymouth Town Square 1994 99 2 60 - 1 BR15500 37th Ave N 2.0% 39 - 2 BR
Cooperative/Ownership Active AdultCornerstone Cooperative 2001 77 0 17 - 1BR3790 Lawndale Ln N 0.0% 58 - 2BR 1,083 - 1,368 $52,000 - $70,000 $48.01 - $51.17
2 - 3BR
Gramercy Park Cooperative Northwest 2001 77 0 7 - 1BR 840 - 998 $51,870 - $61,299 $61.42 - $61.756195 Northwest Blvd 0.0% 61 - 2BR 992 - 1,237 $60,879 - $75,824 $61.30 - $61.37
9 - 3BR 1,778 - 1,832 $106,536 - $112,745 $59.92 - $61.54
Gramercy Park of Plymouth N/A 56 0 7 - 1BR 840 - 1,075 $42,872 - $57,461 $51.04 - $53.4510400 45th Ave N 0.0% 49 - 2BR 992 - 1,257 $54,467 - $65,488 $52.10 - $54.91
CongregateThe Waters of Plymouth 2013 31 0 19 - 1BR 582 - 918 $2,600 - $3,550 $3.87 - $4.4711305 Highway 55 0.0% 8 - 1BR/D 868 - 1,173 $3,500 - $3,995 $3.41 - $4.03
4 - 2BR
SummerWood of Plymouth 2003 68 0 45 - 1BR 805 - 995 $2,045 - $2,320 $2.33 - $2.5416205 36th Ave N 0.0% 23 - 2BR 945 - 1,094 $2,740 - $3,050 $2.79 - $2.90
CCRCTrillium Woods 2014 1205855 Cheshire Parkway N
TABLE S-1 SENIOR HOUSING PROJECTS
PLYMOUTHSeptember 2017
Monthly Rent/ Rent/Sales price/PSF
535 Clubhouse, business center, laundry facilities, 62+
Surface & undergroud parking, lribrary, activity room with kitchen, 55+938 37% of Income N/A
$630$492
Sizes Sale Price
Market Rate Active Adult
$3,9951,134 $3.52
Spa & salon, housekeeping, laundry, dining, various health & wellbeing programs, cable, wi-fi, in-unit washer and dryer
Salon, billiard parlor, community room, conveience store, game room, garage, in-home care, library, message therapy, scheduled transportaion, theatre, private storage unit, emergency call equipment
N/A
In-unit washer & dryer, additional storage, dishwasher, fitness center, heated underground parking, library/computer room, 55+
852 $1,090$1,250950
1174$1.32$1.28
852 In-unit washer & dryer, additional storage, dishwasher, fitness center, heated underground parking, library/computer room, 55+
37% of Income585
$795
779
1,561
Variety of social events, in-unit washer & dryer, car wash bay, heated garage, library, craft room, fitness center, balcony, 54 people on the waiting list, 55+
Social activities, guest suite, craft room, fitness center, library/computer center, underground heated parking, workshop, outdoor deck with grills, 55+
$42,000
$81,000
N/A$0.92N/A
$53.92
$51.89
$0.93
Pool, fitness center, library, auditorium, covered parking, wellness programs, all services available
N/A

SENIOR HOUSING ANALYSIS
MAXFIELD RESEARCH AND CONSULTING 97
Year No. of No.Project Name/City Built Units Vacant No. Type Min - Max Comments
Assisted LivingThe Waters of Plymouth 2013 30 0 18 - 1BR 582 - 918 $3,800 - $4,750 $5.17 - $6.5311305 Highway 55 0.0% 8 - 1BR/D 868 - 1,173 $4,700 - $5,195 $4.43 - $5.41
4 - 2BR
Cornerstone Commons 2004 66 5 4 - Studio3750 Lawndale Ln N 7.6% 55 - 1BR 547 - 667 $4,070 - $4,615 $6.92 - $7.44
7 - 2BR
Summerwood of Plymouth 2002 28 0 22 - 1BR 600 - 803 $3,170 - $3,890 $4.84 - $5.2816205 36th Ave N 0.0% 6 - 2BR 890 - 896 $4,345 - $4,470 $4.88 - $4.99
Memory CareBrookdale Plymouth 1999 52 15 52 - Studio 300 - 700 $13.50 - $5.7915855 22nd Ave N 28.8%
Cornerstone Commons 2004 18 0 16 - Studio $6,220 - $6,605 $7.98 - $8.483750 Lawndale Ln N 0.0% 2 - 1BR 1,083 - 1,368 $6.53 - $5.17
SummerWood of Plymouth 2003 24 1 24 - Studio 394 - 469 $2,855 - $2,925 $6.09 - $7.2516205 36th Ave N 4.2%
The Waters of Plymouth 2013 28 0 24 - Studio 414 - 479 $4,750 - $4,850 $10.13 - $11.4711305 Highway 55 0.0% 4 - 1BR
Source: Maxfield Research and Consulting, LLC
24 hour emergency response, library, beauty/barber shop, daily meals, on-site & off-site activies
$4,050
PLYMOUTHSeptember 2017
Monthly Rent/ Rent fee/PSFSizes Sale Price
$4.58
Walk-in showers, central air, weekly houskeeping, scheduled social events, transportation, spiritual services
493 $4,825
Spa & salon, housekeeping, laundry, dining, various health & wellbeing programs, cable, wi-fi, in-unit washer and dryer
Walk-in showers, central air, weekly houskeeping, scheduled social events, transportation, spiritual services
$9.79
Spa & salon, housekeeping, laundry, dining, various health & wellbeing programs, cable, wi-fi, in-unit washer and dryer
737
779
453 $3,745
Continued
$8.27
$7,075
Salon, billiard parlor, community room, conveience store, game room, garage, in-home care, library, message therapy, scheduled transportaion, theatre, private storage unit, emergency call equipment
Salon, billiard parlor, community room, conveience store, game room, garage, in-home care, library, message therapy, scheduled transportaion, theatre, private storage unit, emergency call equipment
$5,295 $7.18
1,134 $5,195
TABLE S-1 SENIOR HOUSING PROJECTS

SENIOR HOUSING ANALYSIS
MAXFIELD RESEARCH AND CONSULTING 98
Active Adult MR Rental
Total % of Avg. Avg. Avg. Rent/Unit Type Units Total Size Low - High Rent Sq. Ft.
1BR 31 51% 852 $1,090 $1.281BR/D 8 13% 950 $1,250 $1.322BR 22 36% 1,174 $1,325 - $1,445 $1,385 $1.18 Total: 61 100% 992 $1,090 - $1,445 $1,242 $1.26Vacancy Rate: 0.0%
Active Adult Aff. RentalTotal % of Avg. Avg. Avg. Rent/
Unit Type Units Total Size Low - High Rent Sq. Ft.
1BR 138 78% 657 $492 - $795 $644 $0.982BR 40 22% 938 $630 $0.67 Total: 178 100% 798 $492 - $795 $637 $0.83Vacancy Rate: 1.1%
Active Adult OwnerTotal % of Avg. Avg. Avg. Rent/
Unit Type Units Total Size Low - High Rent Sq. Ft.
1BR 31 15% 906 $42,000 - $61,299 $51,100 $56.382BR 168 80% 736 $52,000 - $75,824 $63,110 $85.753BR 11 5% 1,724 $81,000 - $112,745 $100,094 $58.07 Total: 210 100% 1,122 $42,000 - $112,745 $71,435 $66.73Vacancy Rate: 0.0%
CongregateTotal % of Avg. Avg. Avg. Rent/
Unit Type Units Total Size Low - High Rent Sq. Ft.
1BR 64 65% 825 $2,045 - $3,550 $2,629 $3.191BR/D 8 8% 1,021 $3,500 - $3,995 $3,748 $3.672BR 27 27% 1,058 $2,740 - $3,995 $3,262 $3.08 Total: 99 100% 968 $2,045 - $3,995 $3,213 $3.31Vacancy Rate: 0.0%
Assisted LivingTotal % of Avg. Avg. Avg. Rent/
Unit Type Units Total Size Low - High Rent Sq. Ft.
Studio 4 3% 453 $3,745 $8.271BR 95 77% 686 $3,170 - $4,750 $4,049 $5.901BR/D 8 6% 1,021 $4,700 $5,195 $4,948 $4.852BR 17 14% 914 $4,345 - $5,295 $4,826 $5.28 Total: 124 100% 768 $3,170 - $5,295 $4,392 $6.07Vacancy Rate: 4.0%
Memory CareTotal % of Avg. Avg. Avg. Rent/
Unit Type Units Total Size Low - High Rent Sq. Ft.
Studio 116 95% 391 $2,855 - $6,605 $4,608 $11.781BR 6 5% 601 $4,825 - $7,075 $5,950 $9.89 Total: 122 100% 458 $2,855 - $7,075 $5,279 $10.84Vacancy Rate: 13.1%Source: Maxfield Research and Consulting, LLC
Monthly RentsRange
Base Monthly RentsRange
Base Monthly RentsRange
Base Monthly RentsRange
$3,745
Range
$1,090$1,250
$630
Monthly RentsRange
S-2AVALABLE SURVEYED UNIT TYPE SUMMARY
SENIOR HOUSING DEVELOPMENTSSeptember 2017
Purchase Price Range

SENIOR HOUSING ANALYSIS
MAXFIELD RESEARCH AND CONSULTING 99
Select Senior Housing Projects – Plymouth, MN
Summer Wood of Plymouth
16205 36th Ave N Trillium Woods
5855 Cheshire Pkwy
The Waters of Plymouth
11305 Hwy 55 Plymouth Town Square
15300 37th Ave N
Vicksburg Crossing
3155 Vicksburg Ln N Gramercy Park Cooperative Northwest
6195 Northwest Blvd

SENIOR HOUSING ANALYSIS
MAXFIELD RESEARCH AND CONSULTING 100
Bassett Creek Commons
10505 8th Ave N Brookdale Plymouth
15855 22nd Ave N
Cornerstone Commons
3750 Lawndale Ln N Cherrywood Pointe of Plymouth – Expected
2018 18405 Old Rockford Rd

SENIOR HOUSING ANALYSIS
MAXFIELD RESEARCH AND CONSULTING 101

SENIOR HOUSING ANALYSIS
MAXFIELD RESEARCH AND CONSULTING 102
Senior Housing Comparison Table S-3 & S-4 provide a comparison on senior housing units broken down by service level in Plymouth compared to neighboring peer cities in the Metro Area.
Senior Housing Summary 65+ Pop. Pct. of Total Pop. (2017) 65+ Penetration Rate (2017)
Plymouth 15.6% 7.7%
Eden Prairie 12.0% 12.4%
Edina 24.2% 17.9%
Golden Valley 23.4% 19.4%
Maple Grove 11.0% 13.3%
Medina 15.6% 0.0%
Minnetonka 21.3% 13.5%
St Louis Park 15.2% 13.4%
Source: ESRI; Twin Cities Senior Housing Guide; Maxfield Research, Inc.
Table S-3SENIOR HOUSING COMPARISION
PLYMOUTH ANALYSIS AREA
Note: Penetration Rate equals the number of senior housing units divided by senior population

SENIOR HOUSING ANALYSIS
MAXFIELD RESEARCH AND CONSULTING 103
Senior Housing Summary Eden Prairie
Total Population (2017) 76,150 64,545 51,476 21,536 69,340 6,259 52,664 48,973
65+ Population (2017) 11,852 7,763 12,440 5,040 7,647 976 11,219 7,42965+ Pop. Percent of Total Pop. 15.6% 12.0% 24.2% 23.4% 11.0% 15.6% 21.3% 15.2%
MR Active Adult Units (Rental) 61 56 188 0 158 0 73 58
Sub/Aff Active Adult Units (Rental) 178 60 391 202 138 0 314 196
Active Adult/Coop. Units (Owner) 210 337 337 119 176 0 89 106
Congregate Units 99 273 343 225 94 0 485 403
Assisted Living Units 124 188 759 146 293 0 405 149
Memory Care Units 122 51 214 89 157 0 149 80
CCRC Units 120 0 0 199 0 0 0 0
Total Senior Units 914 965 2,232 980 1,016 0 1,515 992
65+ Penetration Rate 7.7% 12.4% 17.9% 19.4% 13.3% 0.0% 13.5% 13.4%
Source: ESRI; Twin Cities Senior Housing Guide; Maxfield Research, Inc.
TABLE S-4SENIOR HOUSING COMPARISION
PLYMOUTH ANALYSIS AREA
Plymouth Golden Valley Maple Grove Medina Minnetonka St Louis ParkEdina
HOUSING DEMAND ANALYSIS
MAXFIELD RESEARCH AND CONSULTING 104
Introduction Previous sections of this study analyzed the existing housing supply and the growth and demo-graphic characteristics of the population and household base in Plymouth. This section of the report presents our estimates of housing demand in Plymouth from 2017 through 2030. Demographic Profile and Housing Demand The demographic profile of a community affects housing demand and the types of housing that are needed. The housing life-cycle stages are:
1. Entry-level householders • Often prefer to rent basic, inexpensive apartments • Usually singles or couples in their early 20’s without children • Will often “double-up” with roommates in apartment setting
2. First-time homebuyers and move-up renters
• Often prefer to purchase modestly-priced single-family homes or rent more upscale apartments
• Usually married or cohabiting couples, in their mid-20's or 30's, some with children, but most are without children
3. Move-up homebuyers
• Typically prefer to purchase newer, larger, and therefore more expen-sive single-family homes
• Typically, families with children where householders are in their late 30's to 40's
4. Empty-nesters (persons whose children have grown and left home) and
never-nesters (persons who never have children) • Prefer owning but will consider renting their housing • Some will move to alternative lower-maintenance housing products • Generally, couples in their 50's or 60's
5. Younger independent seniors
• Prefer owning but will consider renting their housing • Will often move (at least part of the year) to retirement havens in the
Sunbelt and desire to reduce their responsibilities for upkeep and maintenance
• Generally, in their late 60's or 70's

HOUSING DEMAND ANALYSIS
MAXFIELD RESEARCH AND CONSULTING 105
6. Older seniors • May need to move out of their single-family home due to physical
and/or health constraints or a desire to reduce their responsibilities for upkeep and maintenance
• Generally single females (widows) in their mid-70's or older Demand for housing can come from several sources including: household growth, changes in housing preferences, and replacement need. Household growth necessitates building new housing unless there is enough desirable vacant housing available to absorb the increase in households. Demand is also affected by shifting demographic factors such as the aging of the population, which dictates the type of housing preferred. New housing to meet replacement need is required, even in the absence of household growth, when existing units no longer meet the needs of the population and when renovation is not feasible because the structure is physi-cally or functionally obsolete. Rural areas tend to have higher proportions of younger households that own their housing than in the larger growth centers or metropolitan areas such as the Twin Cities Metro Area. In addi-tion, senior households tend to move to alternative housing at an older age. These conditions are a result of housing market dynamics, which typically provide more affordable single-family housing for young households and a scarcity of senior housing alternatives for older house-holds. The graphic on the following page provides greater detail of various housing types supported within each housing life cycle. Information on square footage, average bedrooms/bathrooms, and lot size is provided on the subsequent graphic. Housing Demand Overview The previous sections of this assessment focused on demographic and economic factors driving demand for housing in Plymouth. In this section, we utilize findings from the economic and de-mographic analysis to calculate demand for new general occupancy housing units in Plymouth. Housing markets are driven by a range of supply and demand factors that vary by location and submarket. The following points outline several of the key variables driving housing demand.
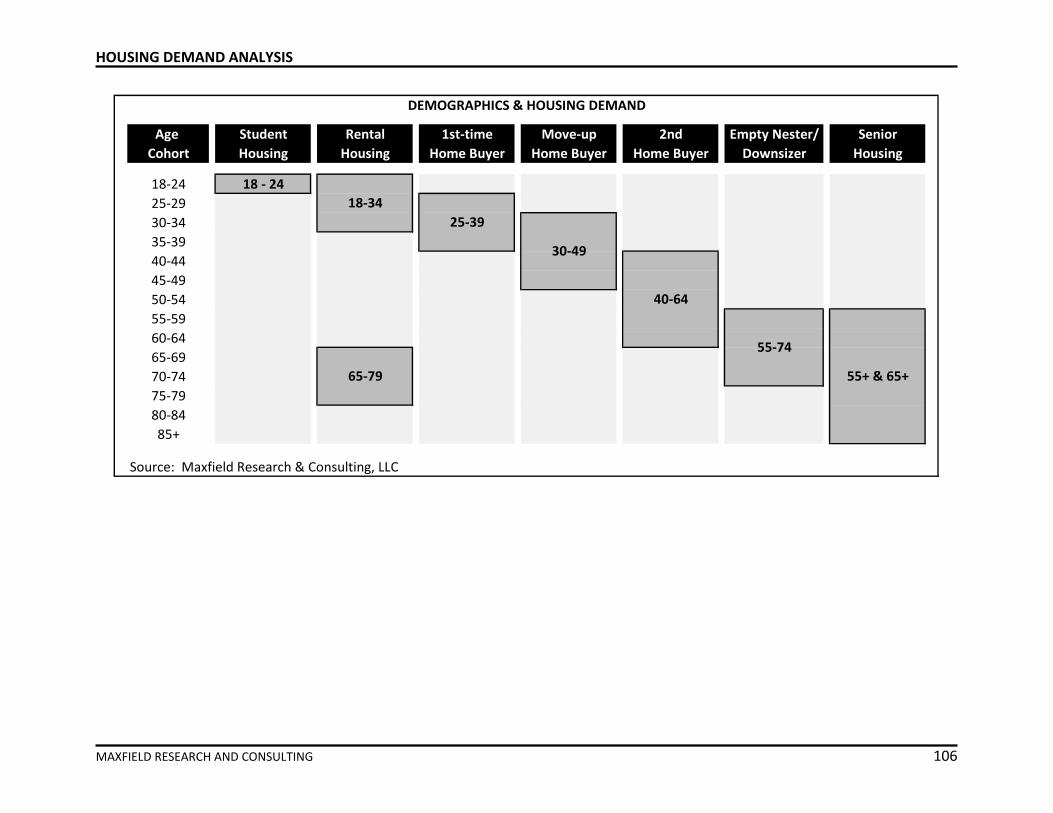
HOUSING DEMAND ANALYSIS
MAXFIELD RESEARCH AND CONSULTING 106
Age Student Rental 1st-time Move-up 2nd Empty Nester/ SeniorCohort Housing Housing Home Buyer Home Buyer Home Buyer Downsizer Housing
18-24 18 - 2425-2930-3435-3940-4445-4950-5455-5960-6465-6970-7475-7980-8485+
Source: Maxfield Research & Consulting, LLC
DEMOGRAPHICS & HOUSING DEMAND
18-34
65-79
25-39
30-49
40-64
55-74
55+ & 65+

HOUSING DEMAND ANALYSIS
MAXFIELD RESEARCH AND CONSULTING 107
Demographics Demographics are major influences that drive housing demand. Household growth and for-mations are critical (natural growth, immigration, etc.), as well as household types, size, age of householders, incomes, etc. Economy & Job Growth The economy and housing market are intertwined; the health of the housing market affects the broader economy and vice versa. Housing market growth depends on job growth (or the pro-spect of); jobs generate income growth which results in the formation of more households and can stimulate household turnover. Historically low unemployment rates have driven both exist-ing home purchases and new-home purchases. Lack of job growth leads to slow or diminishing
Target Market/ Unit/Home Lot Sizes/Demographic Characteristics Units Per Acre1
Entry-level single-family 1,200 to 2,200 sq. ft. 80'+ wide lot2-4 BR | 2 BA 2.5-3.0 DU/Acre
Move-up single-family 2,000 sq. ft.+ 80'+ wide lot3-4 BR | 2-3 BA 2.5-3.0 DU/Acre
Executive single-family 2,500 sq. ft.+ 100'+ wide lot3-4 BR | 2-3 BA 1.5-2.0 DU/Acre
Small-lot single-family 1,700 to 2,500 sq. ft. 40' to 60' wide lot3-4 BR | 2-3 BA 5.0-8.0 DU/Acre
Entry-level townhomes 1,200 to 1,600 sq. ft. 6.0-12.0 DU/Acre2-3 BR | 1.5BA+
Move-up townhomes 1,400 to 2,000 sq. ft. 6.0-8.0. DU/Acre2-3 BR | 2BA+
Executive townhomes/twinhomes 2,000+ sq. ft. 4.0-6.0 DU/Acre3 BR+ | 2BA+
Detached Townhome 2,000+ sq. ft. 4.0-6.0 DU/Acre3 BR+ | 2BA+
Condominums 800 to 1,700 sq. ft. Low-rise: 18.0-24.0 DU/Acre1-2 BR | 1-2 BA Mid-rise: 25.0+ DU/Acre
Hi-rise: 75.0+ DU/Acre
Apartment-style rental housing 675 to 1,250 sq. ft. Low-rise: 18.0-24.0 DU/Acre1-3 BR | 1-2 BA Mid-rise: 25.0+ DU/Acre
Hi-rise: 75.0+ DU/Acre
Townhome-style rental housing 900 to 1,700 sq. ft. 8.0-12.0 DU/Acre2-4 BR | 2BA
Student rental housing 550 to 1,400 sq. ft. Low-rise: 18.0-24.0 DU/Acre1-4BR | 1-2 BA Mid-rise: 25.0+ DU/Acre
Hi-rise: 50.0+ DU/Acre
Senior housing 550 to 1,500 sq. ft. Varies considerably based onSuites - 2BR | 1-2 BA senior product type
1 Dwelling units(DU) per acre expressed in net acreage (minus right-of-way)
Source: Maxfield Research & Consulting, LLC
Housing Types
TYPICAL HOUSING TYPE CHARACTERISTICS
First-time buyers: Singles, couples w/no children
First-time buyers: Families, couples w/no children, some singles
Step-up buyers: Families, couples w/no children
Step-up buyers: Families, couples w/no children
For-
Sale
Hou
sing
Rent
al H
ousi
ngBo
th
Single-parents, families w/children, empty nesters
Retirees, Seniors
Singles, couples, single-parents, some families, seniors
First-time & step-up buyers: Singles, couples, some families, empty-nesters
College students, mostly undergraduates
Step-up buyers: Empty-nesters, retirees
Step-up buyers: Empty-nesters, retirees, some families
First-time & step-up buyers: Singles, couples, empty-nesters, retirees
First-time & move-down buyers: Families, couples w/no children, empty nesters, retirees

HOUSING DEMAND ANALYSIS
MAXFIELD RESEARCH AND CONSULTING 108
household growth, which in-turn relates to reduced housing demand. Additionally, low income growth results in fewer move-up buyers which results in diminished housing turnover across all income brackets. Consumer Choice/Preferences A variety of factors contribute to consumer choice and preferences. Many times a change in family status is the primary factor for a change in housing type (i.e. growing families, empty-nest families, etc.). However, housing demand is also generated from the turnover of existing households who decide to move for a range of reasons. Some households may want to move-up, downsize, change their tenure status (i.e. owner to renter or vice versa), or simply move to a new location. Supply (Existing Housing Stock) The stock of existing housing plays a crucial component in the demand for new housing. There are a variety of unique household types and styles, not all of which are desirable to today’s con-sumers. The age of the housing stock is an important component for housing demand, as com-munities with aging housing stocks have higher demand for remodeling services, replacement new construction, or new home construction as the current inventory does not provide the supply that consumers seek. Plymouth and suburbs like it have an older housing that results in higher demand for remodeling services and infill redevelopment. Pent-up demand may also exist if supply is unavailable as householders postpone a move until new housing product becomes available. Housing Finance Household income is the fundamental measure that dictates what a householder can afford to pay for housing costs. According to the U.S. Department of Housing and Urban Development (HUD), the definition of affordability is for a household to pay no more than 30% of its annual income on housing (including utilities). Families who pay more than 30% of their income for housing (either rent or mortgage) are considered cost burdened and may have difficulty afford-ing necessities such as food, clothing, transportation and medical care. After the Great Recession lenders “tightened the belts” on mortgage lending and it was difficult for many buyers to obtain financing. The ability of buyers to obtain mortgage financing has re-cently lightened as lenders have eased restrictions that had been in place since the recession. However, lenders are still requiring substantially higher credit scores and equity than last dec-ade.

HOUSING DEMAND ANALYSIS
MAXFIELD RESEARCH AND CONSULTING 109
Mobility It is important to note that demand is somewhat fluid between other west/northwest Twin Cit-ies Metro Area communities and will be impacted by development activity in nearby areas. Estimated Demand for General-Occupancy Rental Housing Table HD-1 presents our calculation of general-occupancy rental housing demand in Plymouth. This analysis identifies potential demand for rental housing that is generated from both new households and turnover households. A portion of the demand will be drawn from existing households in Plymouth that want to upgrade their housing situations. The 65 and older cohort is typically not a target market for new general occupancy rental hous-ing, therefore, we limit demand from household growth to only those households under the age of 65. According to our projections, Plymouth is expected to add 3,300 new households be-tween 2017 and 2030 (651 households non-senior households). We estimate that 32% will be renting their housing, which produces demand for 208 new general occupancy rental housing units between 2017 and 2030. Demand is also forecast to emerge from existing Market Area householders through turnover. An estimated 7,592 renter-occupied households under the age of 65 are located in Plymouth in 2017. Based on mobility data from the Census Bureau, an estimated 85% of renter households will turnover in a 15-year period, resulting in 6,453 existing households projected to turnover. Finally, we estimate 15% of the existing renter households will seek new rental housing, resulting in demand for 968 rental units through 2030. Next, we estimate that 25% of the total demand for new rental units in Plymouth will come from people currently living outside of the City of Plymouth. Adding demand from outside Plymouth to the existing demand potential, results in a total estimated demand for 1,568 rental housing units by 2030. Based on a review of rental household incomes and sizes and monthly rents at existing projects, we estimate that approximately 12% of the total demand will be for subsidized housing (30% AMI), 26% will be for affordable housing (40% to 60% AMI), and 62% will be for market rate housing (non-income restricted). As of September 2017, there are no pending or under construction market rate rental housing projects that will satisfy the calculated rental housing demand, which results in an overall de-mand for 188 subsidized units, 408 affordable units, and 972 market rate units.

HOUSING DEMAND ANALYSIS
MAXFIELD RESEARCH AND CONSULTING 110
Projected HH growth under age 65 in Plymouth 2017 to 2030¹(times) Estimated % to be renting their housing2 x(equals) Projected demand from new HH growth =
Number of renter HHs (age 64 and younger) in Plymouth (2017)3
(times) Estimated percent of renter turnover4 x(equals) Total existing households projected to turnover =
(times) Estimated percent desiring new rental housing x(equals) Demand from existing households
(equals) Total demand from HH growth and existing HHs 2017 to 2030 =
(times) Demand from outside Plymouth(equals) Total demand potential for rental housing, 2017 to 2030
Deep Shallow MarketSubsidy Subsidy Rate
(times) Percent of rental demand by product type5 x 12% 26% 62%(equals) Total demand potential for general-occupancy rental housing units = 188 408 972
(minus) Units under construction or pending6 - 0 0 0(equals) Excess demand for new general occupancy rental housing = 188 408 972
2 Pct. of renter households under the age of 65 (ACS - 2015, ESRI, Maxfield Research and Consulting LLC).3 Estimate based on 2015 ACS renter households and new renter household growth 2010 to 2017 (under age 65)4 Based on on turnover from 2015 American Community Survey for households moving over 15-year period.5 Based on the combination of current rental product and household incomes of area renters (non-senior households)
Source: Maxfield Research and Consulting LLC
6,453
TABLE HD-1RENTAL HOUSING DEMAND
CITY OF PLYMOUTH2017 to 2030
Demand from Projected Household Growth65132%208
Demand from Existing Renter Households7,59285%
6 Pending/proposed/under construction at 95% occupancy.
15%968
1,176
25%1,568
1 Estimated household growth based on projections as adjusted by Maxfield Research and Consulting LLC

HOUSING DEMAND ANALYSIS
MAXFIELD RESEARCH AND CONSULTING 111
Estimated Demand for Independent Adult/Few Service Senior Housing Table HD-2 presents our demand calculations for market rate independent senior housing in Plymouth in 2017 and 2022. In order to determine demand for independent senior housing, the potential market is reduced to those households that are both age and income qualified. The age-qualified market is de-fined as seniors age 55 and older, although independent living projects will primarily attract seniors age 65 and older. We calculate that the minimum income needed to afford monthly rents is $35,000 or more plus homeowner households with incomes between $25,000 and $34,999 who would be able to supplement their incomes with the proceeds from a home sale. We estimate the number of age/income-qualified senior households in the Plymouth in 2017 to be 12,077 households. Adjusting to include appropriate long-term capture rates for each age cohort (0.5% of house-holds age 55 to 64, about 5.5% of households age 65 to 74, and 16.5% of households age 75 and over) results in a market rate demand potential for 620 independent senior rental units in 2017. Some additional demand will come from outside the Plymouth. We estimate that 25% of the long-term demand for independent senior housing will be generated by seniors currently resid-ing outside the Plymouth. This demand will consist primarily of parents of adult children living in the Plymouth area, individuals who live just outside of Plymouth and have an orientation to the area, as well as former residents who desire to return. Together, the demand from Plym-outh seniors and demand from seniors who would relocate to Plymouth results in a demand for 827 market rate active adult units in 2017. Independent demand in Plymouth is apportioned between ownership and rental housing. Based on the age distribution, homeownership rates and current product available in Plymouth, we project that 50% of Plymouth’s demand will be for adult ownership housing (413 units) and 50% will be for rental housing (413 units). Next, we subtract existing competitive market rate units (minus a vacancy factor of 5% to allow for sufficient consumer choice and turnover) from the owner and rental demand. Subtracting the existing competitive market rate units results in total demand potential for 214 adult owner-occupied units and 261 active adult rental units.

HOUSING DEMAND ANALYSIS
MAXFIELD RESEARCH AND CONSULTING 112
Adjusting for inflation, we have estimated that households with incomes of $45,000 or more and homeowners with incomes of $35,000 to $44,999 would income qualify for market rate in-dependent senior housing in 2030. Considering the growth in the older adult base, the income distribution of the older adult population in 2030, and planned and under construction units at Cherrywood Pointe and Agora the methodology projected that demand will be 308 adult owner-occupied units and 262 adult rental units in the City of Plymouth.
55-64 65-74 75+ 55-64 65-74 75+
# of Households w/ Incomes of >$35,0001 5,725 3,639 2,024 5,816 4,594 2,462
# of Households w/ Incomes of $25,000 to $34,9991 + 240 234 358 + 227 300 458(times ) Homeownership Rate x 87% 89% 76% x 87% 89% 76%(equals) Total Potential Market Base = 5,934 3,847 2,296 = 6,013 4,861 2,810
(times) Potential Capture Rate x 0.5% 5.5% 16.5% x 0.5% 5.5% 16.5%(equals) Demand Potential = 30 212 379 = 30 267 464
Potential Demand from Residents = 620 = 761
(plus) Demand from Outside Plymouth (25%) + 207 + 254(equals) Total Demand Potential = 827 = 1,015
Owner- Renter- Owner- Renter-Occupied Occupied Occupied Occupied
(times) % by Product Type x 50% x 50% x 50% x 50%(equals) Demand Potential by Product Type = 413 = 413 = 507 = 507
(minus) Existing and Pending MR Active Adult Units2 - 200 - 152 - 200 - 245(equals) Excess Demand for MR Active Adult Units = 214 = 261 = 308 = 262
Source: Maxfield Research and Consulting LLC
² Existing and pending are deducted at market equilibrium (95% occupancy).
2030Age of Householder Age of Householder
2017
TABLE HD-2MARKET RATE ACTIVE ADULT HOUSING DEMAND
CITY OF PLYMOUTH2017 and 2030
1 2030 calculations define income-qualified households as all households with incomes greater than $45,000 and homeowner households with incomes between $35,000 and $44,999.

HOUSING DEMAND ANALYSIS
MAXFIELD RESEARCH AND CONSULTING 113
Estimated Demand for Subsidized/ Affordable Independent Senior Housing Table HD-3 presents our demand calculations for subsidized/affordable independent senior housing in the City of Plymouth in 2017 and 2030. In order to arrive at the potential age and income qualified base for low income and affordable housing, we exclude all senior (65+) households with incomes more than $40,000. We exclude homeowner households with incomes between $35,000 and $39,999, as these households would have additional equity that could be converted to monthly income following the sales of their single-family homes.
Households in a need-based situation (either requiring services or financial assistance) more readily move to housing alternatives than those in non-need based situations. Hence, the cap-ture rate among each age group is higher than for market rate housing. Capture rates are em-ployed at 2.0% for households age 55 to 64, 10.0% for households age 65 to 74 and 20.0% for households age 75 and older. Seniors in need-based situations are less selective when securing housing than those in non-need based situations. We estimate that a high-quality site would capture a greater proportion of total demand for financially-assisted housing than for market rate housing. Using the methodology described above results in a demand potential for 463 total subsidized or affordable senior units. However, after adjusted for household incomes demand results for 236 subsidized units and 227 affordable units. Next we subtract existing competitive units from the overall demand. There are 96 existing subsidized independent units and 77 affordable independent units in Plymouth (minus a va-cancy factor of 3% to allow for sufficient consumer choice and turnover). After we subtract the existing units, there is 140 units demand for subsidized units and demand for 150 affordable units in 2017. Adjusting for inflation, we estimate that households with incomes up to $45,000 would be can-didates for financially-assisted independent housing in 2030. We reduce the potential market by homeowner households earning between $40,000 and $44,999 that would exceed income-restrictions once equity from their home sales is converted to monthly income. Following the same methodology, we project demand in Plymouth for 227 subsidized units and 234 affordable units in 2030.
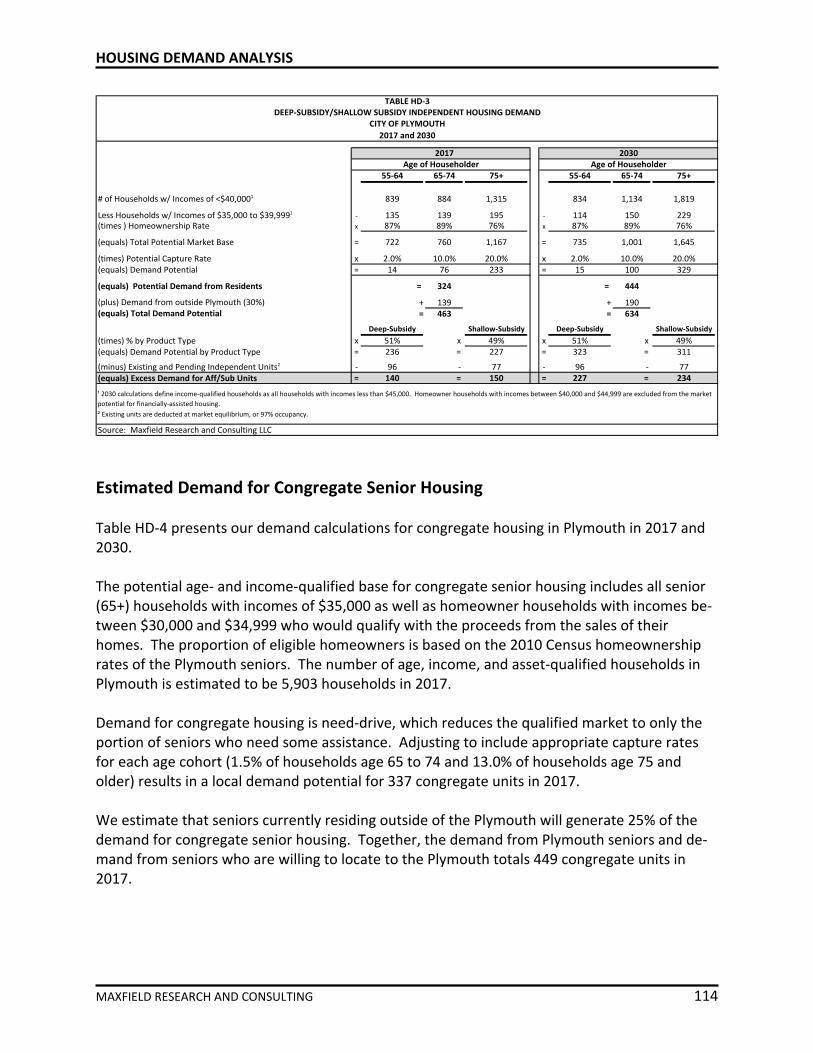
HOUSING DEMAND ANALYSIS
MAXFIELD RESEARCH AND CONSULTING 114
Estimated Demand for Congregate Senior Housing Table HD-4 presents our demand calculations for congregate housing in Plymouth in 2017 and 2030. The potential age- and income-qualified base for congregate senior housing includes all senior (65+) households with incomes of $35,000 as well as homeowner households with incomes be-tween $30,000 and $34,999 who would qualify with the proceeds from the sales of their homes. The proportion of eligible homeowners is based on the 2010 Census homeownership rates of the Plymouth seniors. The number of age, income, and asset-qualified households in Plymouth is estimated to be 5,903 households in 2017. Demand for congregate housing is need-drive, which reduces the qualified market to only the portion of seniors who need some assistance. Adjusting to include appropriate capture rates for each age cohort (1.5% of households age 65 to 74 and 13.0% of households age 75 and older) results in a local demand potential for 337 congregate units in 2017. We estimate that seniors currently residing outside of the Plymouth will generate 25% of the demand for congregate senior housing. Together, the demand from Plymouth seniors and de-mand from seniors who are willing to locate to the Plymouth totals 449 congregate units in 2017.
55-64 65-74 75+ 55-64 65-74 75+
# of Households w/ Incomes of <$40,0001 839 884 1,315 834 1,134 1,819
Less Households w/ Incomes of $35,000 to $39,9991 - 135 139 195 - 114 150 229(times ) Homeownership Rate x 87% 89% 76% x 87% 89% 76%
(equals) Total Potential Market Base = 722 760 1,167 = 735 1,001 1,645
(times) Potential Capture Rate x 2.0% 10.0% 20.0% x 2.0% 10.0% 20.0%(equals) Demand Potential = 14 76 233 = 15 100 329
(equals) Potential Demand from Residents = 324 = 444
+ 139 + 190= 463 = 634
Deep-Subsidy Shallow-Subsidy Deep-Subsidy Shallow-Subsidy(times) % by Product Type x 51% x 49% x 51% x 49%(equals) Demand Potential by Product Type = 236 = 227 = 323 = 311
(minus) Existing and Pending Independent Units2 - 96 - 77 - 96 - 77(equals) Excess Demand for Aff/Sub Units = 140 = 150 = 227 = 234
Source: Maxfield Research and Consulting LLC
² Existing units are deducted at market equilibrium, or 97% occupancy.
TABLE HD-3DEEP-SUBSIDY/SHALLOW SUBSIDY INDEPENDENT HOUSING DEMAND
CITY OF PLYMOUTH2017 and 2030
2017 2030Age of Householder Age of Householder
(plus) Demand from outside Plymouth (30%)(equals) Total Demand Potential
¹ 2030 calculations define income-qualified households as all households with incomes less than $45,000. Homeowner households with incomes between $40,000 and $44,999 are excluded from the market potential for financially-assisted housing.

HOUSING DEMAND ANALYSIS
MAXFIELD RESEARCH AND CONSULTING 115
As of September 2017, there are no pending or under construction senior housing projects with congregate units. This results in an overall demand for 355 congregate units. Adjusting for inflation, we estimate that households with incomes of $45,000 or more and sen-ior homeowners with incomes between $40,000 and $44,999 would qualify for congregate housing in 2030. Following the same methodology, demand is calculated to increase to 457 units through 2030.
# of Households w/ Incomes of >$35,000¹
# of Households w/ Incomes of $30,000 to $34,999¹ + +(times) Homeownership Rate x x(equals) Total Potential Market Base = =
(times) Potential Capture Rate² x x(equals) Potential Demand = + = +
Potential Demand from Plymouth Residents = =
(plus) Demand from Outside Plymouth (25%) + +(equals) Total Demand Potential = =
(minus) Existing and Pending Congregate Units³ - -(equals) Total Congregate Demand Potential = =
Source: Maxfield Research and Consulting LLC
94 94355 457
¹ 2030 calculations define income-qualified households as all households with incomes greater than $45,000 and homeowner households with incomes between $40,000 and $44,999.2 The potential capture rate is derived from data from the Summary Health Statistics for the U.S. Population: National Health Interview Survey, 2008 by the U.S. Department of Health and Human Services. The capture rate used is the percentage of seniors needing assistance with IADLs, but not ADLs (seniors needing assistance with ADLs typcially need assistance with multiple IADLs and are primary candidates for service-intensive assisted living).³ Competitive units include congregate units at 95% occupancy (market equilibrium).
337 414
112 138449 551
1.5% 13.0% 1.5% 13.0%56 281 71 343
89% 76% 89% 76%3,743 2,160 4,728 2,636
4,594 2,462
117 179 150 229
TABLE HD-4MARKET RATE CONGREGATE RENTAL HOUSING DEMAND
CITY OF PLYMOUTH2017 and 2030
2017 2030Age of Householder Age of Householder
65-74 75+ 65-74 75+
3,639 2,024

HOUSING DEMAND ANALYSIS
MAXFIELD RESEARCH AND CONSULTING 116
Estimated Demand for Assisted Living Housing Table HD-5 presents our demand calculations for assisted living senior housing in Plymouth in 2017 and 2030. This analysis focuses on the potential private pay/market rate demand for assisted living units. The availability of more intensive support services such as meals, housekeeping and personal care at assisted living facilities usually attracts older, frailer seniors. According to the 2009 Overview of Assisted Living (which is a collaborative research project by the American Association of Homes and Services for the Aging, the American Seniors Housing Association, National Center for Assisted Living, and National Investment Center for the Seniors Housing and Care Industry), the average age of residents in freestanding assisted living facilities was 87 years in 2008. Hence, the age-qualified market for assisted living is defined as seniors ages 75 and over, as we estimate that of the half of demand from seniors under age 87, almost all would be from seniors over age 75. In 2017, there are a projected 4,052 seniors age 75 and older in Plymouth. Demand for assisted living housing is need-driven, which reduces the qualified market to only the portion of seniors who need assistance. According to a study completed by the U.S. Census Bureau (1999 panels of the Survey of Income and Program Participation (SIPP) files), 30% of seniors needed assistance with everyday activities (from 25.5% of 75-to-79-year-olds, to 33.6% of 80-to-84-year-olds and 51.6% of 85+ year olds). Applying these percentages to the senior population yields a potential assisted living market of 1,658 seniors in Plymouth. Due to the supportive nature of assisted living housing, most daily essentials are included in monthly rental fees, which allow seniors to spend a higher proportion of their incomes on housing with basic services. Therefore, the second step in determining the potential demand for assisted living housing in Plymouth is to identify the income-qualified market based on a senior’s ability to pay the monthly rent. We consider seniors in households with incomes of $40,000 or greater to be income-qualified for assisted living senior housing in Plymouth. Households with incomes of $40,000 could afford monthly assisted living fees of $3,000 by allocating 90% of their income toward the fees. According to the 2009 Overview of Assisted Living, the average arrival income of assisted living residents in 2008 was $27,260, while the average annual assisted living fee was $37,281 ($3,107/month). This data highlights that seniors are spending down assets to live in assisted living and avoid institutional care. Thus, in addition to households with incomes of $40,000 or greater, there is a substantial base of senior households with lower incomes who income-qual-ify based on assets – their homes, in particular. Seventy-one percent of the age 75+ households in the Plymouth are homeowners, and the me-dian resale price of homes through 2016 in Plymouth was $325,000. Seniors selling their homes for the median resale price would generate about $302,250 in proceeds after selling costs. With an average monthly fee of $3,000, these proceeds would last about 101 months in

HOUSING DEMAND ANALYSIS
MAXFIELD RESEARCH AND CONSULTING 117
an assisted living facility, which is higher than the average length of stay in assisted living (27 months according to the 2009 Overview of Assisted Living). For each age group in Table HD-5, we estimate the income-qualified percentage to be all seniors in households with incomes above $40,000 (who could afford monthly rents of $3,000+ per month) plus 40% of the esti-mated seniors in homeowner households with incomes below $40,000 (who will spend down assets, including home-equity, in order to live in assisted living housing). This results in a total potential market of 1,177 units in 2017. Because the vast majority of assisted living residents are single (88% according to the 2009 Overview of Assisted Living), our demand methodology multiplies the total potential market by the percentage of seniors age 75+ in Plymouth living alone. Based on 2010 Census data, only 47% of age 75+ households in Plymouth lived alone. Applying this percentage results in a total base of 554 age/income-qualified singles. The 2009 Overview of Assisted Living found that 12% of residents in assisted living were couples. There are a total of 629 age/income-qualified seniors needing assistance in Plymouth including both couples and singles. We estimate that roughly 60% of the qualified market needing significant assistance with Activities of Daily Living (“ADLs”) would either remain in their homes or less service-intensive senior housing with the assistance of a family member or home health care, or would need greater care provided in a skilled care facility. The remaining 40% could be served by assisted living housing. Applying this potential market penetration rate of 40% results in demand for 252 assisted living units in 2017. We estimate that a portion of demand for assisted living units (25%) will come from outside of the Plymouth. Applying this figure results in total potential demand for 336 market rate assisted living units in Plymouth. There are a total of 115 assisted living units in Plymouth. After deducting these competitive units (minus a 93% occupancy rate) from the total demand potential, we calculate that there is a demand for 220 assisted living units in the Plymouth in 2017. While incorporating 83 under construction or pending assisted living units, the same calculations are applied to the age/income-qualified base in 2030, resulting in demand for 234 units.

HOUSING DEMAND ANALYSIS
MAXFIELD RESEARCH AND CONSULTING 118
Percent PercentNeeding Needing
Age group People Assistance¹ People Assistance¹75 - 79 2,067 25.5% 3,178 25.5%80 - 84 1,365 33.6% 1,948 33.6%85+ 1,302 51.6% 1,726 51.6%Total 4,734 6,852
Percent Income-Qualified2
Total potential market(times) Percent living alone x(equals) Age/income-qualified singles needing assistance =
(plus) Proportion of demand from couples (12%)³ +(equals) Total age/income-qualified market needing assistance =
(times) Potential penetration rate4 x(equals) Potential demand from Plymouth residents =
(plus) Proportion from outside Plymouth (25%) +(equals) Total potential assisted living demand =
(minus) Existing market rate assisted living units5 -(equals) Total excess market rate assisted living demand =
Source: Maxfield Research and Consulting LLC
TABLE HD-5MARKET RATE ASSISTED LIVING DEMAND
CITY OF PLYMOUTH2017 and 2030
2017 2030
672 891
Number NumberNeeding Needing
Assistance1 Assistance1
527 810459 655
1,658 2,356
71% 61%
1,177 1,43747% 49%554 704
76 96629 800
40% 40%252 320
84 107336 427
115 193220 234
2 Includes households with incomes of $40,000 or more (who could afford monthly rents of $3,000+ per month) plus 40% of estimated owner households with incomes below $40,000 (who will spend down assets, including home-equity, in order to live in assisted living housing).3 The 2009 Overview of Assisted Living (a collaborative project of AAHSA, ASHA, ALFA, NCAL & NIC) found that 12% of assisted living residents are couples.
5 Existing and pending units at 93% occupancy.
1 The percentage of seniors unable to perform or having difficulting with ADLs, based on the publication Health, United States, 1999 Health and Aging Chartbook, conducted by the Centers for Disease Control and Prevention and the National Center for Health Statistics.
4 We estimate that 60% of the qualified market needing assistance with ADLs could either remain in their homes or reside at less advanced senior housing with the assistance of a family member or home health care, or would need greater care provided in a skilled care facility.

HOUSING DEMAND ANALYSIS
MAXFIELD RESEARCH AND CONSULTING 119
Additional demand could come from seniors that will need to receive supplemental income in order to afford assisted living or memory care housing. While some of these seniors will re-ceive income from the sales of their homes, others will need to rely on other sources of public aid. The Elderly Waiver program has provided public funding for seniors who wish to receive “alternative” care that allows them to stay in the community as opposed to receiving similar care at a nursing home. Most assisted living developments require residents to have lived in their facility for a certain amount of time before they can use a waiver, and many try to limit the amount of waivers ac-cepted within the community to around roughly 10% to 20%. Some facilities accept higher amounts of residents on waivers and many newer facilities do not accept any waivers. Estimated Demand for Memory Care Housing Table HD-6 presents our demand calculations for market rate memory care senior housing in Plymouth in 2017 and 2030. Demand is calculated by starting with the estimated Plymouth senior (age 65+) population in 2017 and multiplying by the incidence rate of Alzheimer’s/dementia among this population’s age cohorts. According to the Alzheimer’s Association (Alzheimer’s Disease Facts and Figures, 2007), 2% of seniors ages 65 to 74, 19% of seniors ages 75 to 84, and 42% of seniors ages 85+ are inflicted with Alzheimer’s Disease. This yields a potential market of 1,320 seniors in Plym-outh in 2017. Because of the staff-intensive nature of dementia care, typical monthly fees for this type of housing are at least $4,000 and range upwards of $5,000 to $6,000 when including service packages. Based on our review of senior household incomes in Plymouth, homeownership rates and home sale data, we estimate that 65% of seniors in Plymouth would have incomes and/or assets to sufficiently cover the costs of memory care housing. This figure takes into ac-count married couple households where one spouse may have memory care needs and allows for a sufficient income for the other spouse to live independently. Multiplying the number of seniors with Alzheimer’s/dementia (1,320 seniors) by the income-qualified percentage results in a total of 858 age/income-qualified seniors in the Plymouth in 2017. According to data from the National Institute of Aging, about 25% of all individuals with memory care impairments comprise the market for memory care housing units. This figure considers that seniors in the early stages of dementia will be able to live independently with the care of a spouse or other family member, while those in the later stages of dementia will re-quire intensive medical care that would only be available in skilled care facilities. Applying this figure to the estimated population with memory impairments yields a potential market of about 215 seniors in the Plymouth.

HOUSING DEMAND ANALYSIS
MAXFIELD RESEARCH AND CONSULTING 120
We estimate that 25% of the overall demand for memory care housing would come from out-side of Plymouth. Together, demand totals 286 memory care units in 2017.
We reduce the demand potential by accounting for the existing memory care product in Plym-outh. There are a total of 122 units; however, we reduce the competitive units to include memory care units at a 7% vacancy rate. Subtracting these competitive units results in a de-mand for 173 units. The same calculations are applied to the age/income-qualified base in 2030, while incorporating 47 units at a 7% vacancy rate that are under construction or pending. Following the same methodology, potential demand for market rate memory care units is expected to increase to 279 units in Plymouth through 2030.
65 to 74 Population 7,208 9,985(times) Dementia Incidence Rate¹ x 2% x 2%(equals) Estimated Age 65 to 74 Pop. with Dementia = 144 = 200
75 to 84 Population 3,367 5,126(times) Dementia Incidence Rate¹ x 19% x 19%(equals) Estimated Age 75 to 84 Pop. with Dementia = 640 = 974
85+ Population 1,277 1,726(times) Dementia Incidence Rate¹ x 42% x 42%(equals) Estimated Age 85+ Pop. with Dementia = 536 = 725
(equals) Total Senior Population with Dementia = 1,320 = 1,899
(times) Percent Income/Asset-Qualified² x 65% x 69%(equals) Total Income-Qualified Market Base = 858 = 1,310
(times) Percent Needing Specialized Memory Care Assistance x 25% x 25%(equals) Total Need for Dementia Care = 215 = 328
(plus) Demand from Outside the City of Plymouth (25%) + 72 + 109Total Demand for Memory Care Units = 286 437
(minus) Existing and Pending Memory Care Units3 - 113 - 157(equals) Excess Demand Potential = 173 = 279
Source: Maxfield Research and Consulting LLC
¹ Alzheimer's Association: Alzheimer's Disease Facts & Figures (2007)² Includes seniors with income at $60,000 or above ($75,000 in 2030) plus 40% of homeowners with incomes below this threshold (who will spend down assets, including home-equity), in order to live in memory care housing.3 Existing memory care units at 7% vacancy rate.
TABLE HD-6MARKET RATE MEMORY CARE DEMAND
CITY OF PLYMOUTH2017 and 2030
2017 2030

RECOMMENDATIONS AND CONCLUSIONS
MAXFIELD RESEARCH AND CONSULTING 121
Introduction/Overall Housing Recommendations This section summarizes demand calculated for specific housing products in Plymouth and rec-ommends development concepts to meet the housing needs forecast for the City. All recom-mendations are based on findings of the Comprehensive Rental Housing Market Study. The fol-lowing table and charts illustrate calculated demand by product type. It is important to recog-nize that housing demand is highly contingent on projected household growth and land availa-bility; household growth could be higher if additional acreage was available for housing devel-opment/redevelopment.
Type of Use 2017-2030 2015
General-OccupancyRental Units - Market Rate 972Rental Units - Shallow-Subsidy 408Rental Units - Deep-Subsidy 188Total General Occupancy Supportable 1,568
2017 2030
Age-Restricted (Senior)Market RateAdult Few Services (Active Adult) 475 570
Ownership 214 308 Rental 261 262
Congregate 355 457Assisted Living 220 234Memory Care 173 279Total Market Rate Senior Supportable 1,223 1,541
Shallow-Subsidy/Deep-SubsidyActive Adult - Shallow-Subsidy 150 234Active Adult - Deep-Subsidy 140 227Total Shallow/Deep-Subsidy Senior Supportable 290 461
Source: Maxfield Research & Consulting, LLC
TABLE CR-1SUMMARY OF HOUSING DEMAND
CITY OF PLYMOUTHSeptember 2017

RECOMMENDATIONS AND CONCLUSIONS
MAXFIELD RESEARCH AND CONSULTING 122
Based on the finding of our analysis and demand calculations, Table CR-2 provides a summary of the recommended development concepts by product type for the City of Plymouth. It is im-portant to note that these proposed concepts are intended to act as a development guide to most effectively meet the housing needs of existing and future households in Plymouth. The recommended development types do not directly coincide with total demand as illustrated in Table CR-1.
972
408
188
0 200 400 600 800 1,000 1,200
Rental - Market
Rental - Aff.
Rental - Subs.
Units
General-Occupancy Demand by Type, Plymouth MN2017 to 2030
150
140
173
220
355
261
214
234
227
279
234
457
262
308
0 100 200 300 400 500
Shallow-Subsidy
Deep-Subsidy
Memory Care
Assisted Living
Congregate
Adult - Rental
Adult - Owner
Units
Senior Housing Demand by Service Level: 2017 & 2030, Plymouth MN
2030 2017

RECOMMENDATIONS AND CONCLUSIONS
MAXFIELD RESEARCH AND CONSULTING 123
Recommended Housing Product Types General Occupancy Rental Housing Our competitive inventory identified that the vacancy rates for all types of general occupancy rental product is below market equilibrium (1.6% vacancy rate) indicating pent-up demand for rental housing. Due to the age and positioning of the existing rental supply (pre-1990 construction), a signifi-cant portion of units are priced at or below guidelines for affordable housing, which indirectly satisfies demand from some households that income-qualify for financially assisted housing.
Purchase Price/Monthly Rent Range¹
General Occupancy Rental Housing Market Rate Rental Housing
Apartment-style $1,000/1BR - $2,800/3BR 280 - 300 180 - 200 350 - 400 810 - 900 Townhomes $2,300/2BR - $2,700/3BR 50 - 60 40 - 50 30 - 40 120 - 150
Total 330 - 360 220 - 250 380 - 440 930 - 1,050
Affordable Rental Housing Apartment-style Moderate Income3 130 - 140 100 - 120 130 - 140 360 - 400
Subsidized 30% of Income4 50 - 60 50 - 60 50 - 60 150 - 180
Total 180 - 200 150 - 180 180 - 200 510 - 580
Total Renter-Occupied 510 - 560 370 - 430 560 - 640 1,440 - 1,630
Senior Housing (i.e. Age Restricted)
Senior Coop./Ownership Active Adult $50,000 - $200,000+ 60 - 70 80 - 90 90 - 100 230 - 260Active Adult Market Rate Rental5 $1,400/1BR - $2,700/2BR 70 - 80 90 - 100 80 - 90 240 - 270
Active Adult Affordable Rental5 Moderate Income3 80 - 90 60 - 70 80 - 90 220 - 250Active Adult Subsidized Rental5 30% of Income4 50 - 60 50 - 60 80 - 90 180 - 210Independent Living/Congregate $2,050/1BR - $4,000/2BR 120 - 130 140 - 150 150 - 160 410 - 440
Assisted Living $3,750/EFF - $5,300/2BR 50 - 60 70 - 80 100 - 110 220 - 250Memory Care $2,900/EFF - $6,000/2BR 60 - 70 70 - 80 90 - 100 220 - 250
Total Senior Units 490 - 560 560 - 630 670 - 740 1,720 - 1,930
Total - All Units 1,000 - 1,120 930 - 1,060 1,230 - 1,380 3,160 - 3,560
Source: Maxfield Research & Consulting, LLC
Note - Recommended development does not coincide with total demand. Plymouth may not be able to accommodate all recommended housing types based on land availability and development constraints.
Total
¹ Pricing in 2017 dollars. Pricing can be adjusted to account for inflation.
3 Affordablity subject to income guidelines per Minnesota Housing Finance Agency (MHFA). See Table HA-1 for Hennepin County Income limits.
4 Subsized housing will be difficult to develop financially 5 Alternative development concept is to combine active adult affordable and market rate active adult into mixed-income senior community
2 Replacement need, infill, and redevelopment.
Units Units Units2017 - 2020 2021 - 2025 2026 - 2030
TABLE CR-2RECOMMENDED HOUSING DEVELOPMENT
CITY OF PLYMOUTH2017 to 2030
No. of No. of No. of

RECOMMENDATIONS AND CONCLUSIONS
MAXFIELD RESEARCH AND CONSULTING 124
However, the growing renter base is seeking newer rental properties with additional and up-dated amenities that are not offered in older developments. As a result, there are numerous new market rate apartments buildings with vacancies near or below market equilibrium. • Market Rate Rental – Currently, there are no general-occupancy units under construction or
planned in the short-term; and there is substantial demand (972 units) found through 2030. As of September 2017, there were only 115 vacancies found among market rate properties for a total vacancy of 1.7% which is well below market equilibrium and suggest the demand for more market rate rental units. Plymouth can accommodate a variety of development types; from higher-density suburban five-story buildings to lower-density townhome rent-als. Because the land supply is dwindling fast in Plymouth, the majority of new construction will likely be multifamily style with densities of at least 12 - 20 units per acre.
• Affordable General Occupancy Multifamily Housing– There are five affordable rental pro-jects in Plymouth; these developments have been very successful and are all 100% occu-pied as of September 2017. The existing products target households between 50% and 60% of area median income. However, new affordable projects would have income-re-strictions established by HUD and could target households with incomes between 50% to 80% of area median income; however, some could be workforce units with affordability up to 120% AMI.
We find that demand exists for about 408 affordable units through 2030. Affordable hous-ing attracts households that cannot afford market rate housing units but do not income-qualify for deep subsidy housing. One-bedroom units target singles and couples, whereas two and three-bedroom units target families. Some retired seniors would also be attracted to an affordable concept. We recommend an affordable concept that would target resi-dents at 50% to 60% AMI. Demand is strong for both stand-alone tax credit projects and for mixed-income market rate developments that have a small proportion of units at 50% to 60% AMI. Similar to market rate general-occupancy rental housing, new affordable development will likely oc-cur in multifamily development with higher densities.
• Subsidized General Occupancy Multifamily Housing– There are four subsidized rental pro-
jects in Plymouth; these developments also are all 100% occupied as of September 2017. The existing products target households at 30% Adjusted Gross Income (AGI). These prop-erties should consist of the standard one- & two-bedroom unit types but should also in-clude some three- & four-bedroom units for families with children. However, because of lack of funding sources for subsidized housing it will be exceptionally challenging to de-velop future deep subsidy projects.

RECOMMENDATIONS AND CONCLUSIONS
MAXFIELD RESEARCH AND CONSULTING 125
Senior Housing As illustrated in Table CR-1, demand exists for all types of senior housing product types in Plym-outh. Over the course of the next decade, there is demand for roughly 2,000 new senior units through 2030. The unmet of additional senior housing is recommended in order to provide housing opportunity to these aging residents in their stages of later life. The development of additional senior housing serves a two-fold purpose in meeting the housing needs in Plymouth: older adult and senior residents are able to relocate to new age-restricted housing in Plymouth, and existing homes and rental units that were occupied by seniors become available to other new households. Hence, development of additional senior housing does not mean the housing needs of younger households are neglected; it simply means that a greater percentage of hous-ing need is satisfied by housing unit turnover. The types of housing products needed to accom-modate the aging population base are discussed individually in the following section. • Active Adult Rental – Demand was projected for about 262 market rate active adult rental
units in Plymouth through 2030. Currently, there is only one market rate rental active adult products in Plymouth; Vicksburg Crossing which has 61 market rate units. Development of this product could be in a separate stand-alone facility or in a mixed-in-come project. A mixed-income building could include a portion of units that would be af-fordable to seniors with incomes established the Minnesota Housing Finance Agency. We recommend a new project of about 70 to 80 units later this decade. The project modest rents with base monthly rents starting at $1,400 per month for one-bedroom units and from $2,700 or more for two-bedroom units. The project should offer transportation, activ-ities, and optional services for housekeeping, etc.
• Active Adult Senior Cooperative/Owner – There are three senior age-restricted for-sale de-velopments in Plymouth at this time – Cornerstone Cooperative which has 77 units, Gra-mercy Park Cooperative Northwest also with 77 units, and Gramercy Park of Plymouth with 56 units. Maxfield Research and Consulting, LLC projected demand for 308 active adult ownership units through 2030. The cooperative model, in particular, appeals to a larger base of potential residents in that it has characteristics of both rental and ownership hous-ing. Cooperative developments allow prospective residents an ownership option and homestead tax benefits without a substantial upfront investment as would be true in a condominium development or life care option. Maxfield Research & Consulting, LLC has found the cooperative model to be very well-accepted in suburban communities in the Twin Cities Metro Area and across the Midwest. As such, we recommend a 60 to 70-unit senior cooperative later this decade with sliding scale share costs starting at about $50,000.

RECOMMENDATIONS AND CONCLUSIONS
MAXFIELD RESEARCH AND CONSULTING 126
• Affordable/Subsidized Active Adult Rental – Plymouth’s demand for affordable and subsi-dized senior housing is approximately 234 affordable units and 227 subsidized units through 2030. Although this product would be well received by seniors in and near the Plymouth area; it can be difficult to develop given financing challenges and development costs. Af-fordable senior housing will likely be a low-income tax credit project through the Minnesota Housing Finance Agency (MHFA). MHFA recently started to consider affordable senior housing projects under the tax credit program and is slowly starting to expand financing for this product type. Affordable/subsidized senior housing products can also be incorporated into a mixed-income building which may increase the projects financial feasibility.
• Independent Living/Congregate – There are two designated congregate units (meals and
limited support service) in Plymouth, The Waters of Plymouth with 31 units and Summer Wood of Plymouth with 68 units. Demand was calculated for upwards of 457 congregate units through 2030. Based on this demand, multiple projects could be supported in the community to meet this forthcoming demand. The approved Agora senior project would meet a portion of this demand if the project moves forward. We recommend a mix of one-bedroom, one-bedroom plus den, and two-bedroom units. Base monthly rents should range from $2,000 for one-bedroom units to $4,000 for two-bedroom units. The monthly fees should include all utilities (except telephone and basic cable/satellite television) and the following services:
• I’m OK program; • Daily noon meal; • Regularly scheduled van transportation; • Social, health, wellness and educational programs; • 24-hour emergency call system; and • Complimentary use of laundry facilities.
In addition, meals and other support and personal care services will be available to congre-gate residents on a fee-for-service basis, such as laundry, housekeeping, etc. When their care needs increase, residents also have the option of receiving assisted living packages in their existing units. New independent housing could be developed adjacent to an existing senior project or in a stand-alone development.
• Assisted Living and Memory Care Senior Housing – Based on our analysis, there is substan-tial demand for assisted living and memory care in Plymouth through 2030. We project de-mand to support an additional 234 assisted living units and 279 memory care units through 2030. Although we find strong demand today, the demand will grow with each subsequent year as the baby boomers start to desire services next decade. Demand will be strongest after 2020.

RECOMMENDATIONS AND CONCLUSIONS
MAXFIELD RESEARCH AND CONSULTING 127
We recommend assisted living units include a mix of studio, and one-bedroom, and a few two-bedroom units with base monthly rents ranging from $3,750 to $5,300. Memory care unit mix should be mostly studios and one-bedroom units with a few two-bedroom units for couples with base monthly rents ranging from $2,900 to $6,000. Memory care units should be located in a secured, self-contained wing located on the first floor of a building and should feature its own dining and common area amenities including a secured outdoor patio and wandering area.
The base monthly fees should include all utilities (except telephone and basic cable/satel-lite television) and the following services:
• Three meals per day; • Weekly housekeeping and linen service; • Two loads of laundry per week; • Weekly health and wellness clinics; • Meal assistance; • Regularly scheduled transportation; • Professional activity programs and scheduled outings; • Nursing care management; • I’m OK program; • 24-hour on site staffing; • Personal alert pendant with emergency response; and • Nurse visit every other month.
Additional personal care packages should also be available for an extra monthly charge above the required base care package. A care needs assessment is recommended to be conducted to determine the appropriate level of services for prospective residents.

CHALLENGES AND OPPORTUNITIES
MAXFIELD RESEARCH AND CONSULTING 128
Challenges and Opportunities Table CR-2 identified and recommended housing types that would satisfy the housing needs in Plymouth over the next thirteen years. The following were identified as the greatest challenges and opportunities for developing the recommended housing types (in no particular order - al-phabetically). • Age of Housing Stock. As illustrated in the Housing Characteristics Section of the report (Ta-
ble HC-3, the median year built for a home in Plymouth is 1965 and about 35% of the hous-ing stock was built prior to 1980. Although the housing stock is newer compared to other inner-ring suburban communities, a portion of the housing stock in Plymouth may be in need of remodeling programs that reinvestment into the city’s owner and renter housing stock.
• Affordability. As illustrated in Table HA-5, most householders (84%) can afford the average
market rate rent for a one-bedroom at an existing rental project ($950) in Plymouth. How-ever, when adjusted for rental household incomes the affordability decreases as 65% of renters could afford a one-bedroom rent of $1,300. Because of the higher rent structures at the new market rental buildings being constructed in Plymouth, the minimum incomes needed to afford a luxury rental are significantly higher than that of the existing rental housing stock in Plymouth. The new rental housing development target “lifestyle renters” or those with higher incomes who have enough money to buy a house but choose to rent for the convenience and lifestyle. Many of these renters may be cost burdened, but they choose so for the location, amenities, and proximity to transit.
550
355
1,14
1
2,52
7
6,05
7
8,12
0
6,47
4
4,49
9
544
0
1,000
2,000
3,000
4,000
5,000
6,000
7,000
8,000
9,000
<1940s 1940s 1950s 1960s 1970s 1980s 1990s 2000s 2010+
Units
Decade of Construction
All Housing Units Built by DecadeCity of Plymouth

CHALLENGES AND OPPORTUNITIES
MAXFIELD RESEARCH AND CONSULTING 129
• Aging Population/City Services. As illustrated in Table D-2, there is significant growth in the Plymouth senior population, especially among ages 75 to 84 (+32% growth through 2022). In addition, Table D-6 shows the Plymouth homeownership rates among seniors 65+ is ap-proximately 83%. High homeownership rates among seniors indicate there could be lack of senior housing options, or simply that many seniors prefer to live in their home and age in place. Because of the rising population of older adults, demand for alternative mainte-nance-free housing products should be rising. In addition, demand for home health care services and home remodeling programs to assist seniors with retrofitting their existing homes should also increase.
2%
-4%
4%
12%
-3%
0%
25%
32%
17%
-10.0%
-5.0%
0.0%
5.0%
10.0%
15.0%
20.0%
25.0%
30.0%
35.0%
Under 18 18 to 24 25 to 34 35 to 44 45 to 54 55 to 64 65 to 74 75 to 84 85 andover
Pct.
Population Pct. Change by Age Cohort, Plymouth 2017 to 2022
89.0%81.4%
64.4%
0.0%
10.0%
20.0%
30.0%
40.0%
50.0%
60.0%
70.0%
80.0%
90.0%
100.0%
65-74 75-84 85+
Hom
e O
wne
rshi
p Ra
te
Age Range
Senior Home Ownership Rate: 2015Plymouth, MN

CHALLENGES AND OPPORTUNITIES
MAXFIELD RESEARCH AND CONSULTING 130
The following chart illustrates the historic and projected growth rates of the senior (ages 65+) population in the seven-county Metro Area. At present, seniors account for about 13.5% of the Twin Cities population in 2017 which is projected to double over the next two decades. By 2040, 27% of the population in the Twin Cities (993,000+) will be 65 and nearly 75% of all seniors in the State of Minnesota will be residing in the Metro Area.
The vast majority of older adults desire to stay in their home as they age. Because many seniors will remain in their homes, these households will desire various services such as re-modeling/home modifications, snow removal, lawn care, transportation, home health care, etc. Many of these older adults and boomers will also desire to “down size or right size” from single-family homes into maintenance-free options with fewer stair and upkeep. At the same time, there is a growing demand for seniors residing with relatives (primarily chil-dren) increasing the demand for multi-generational households. Because of the anticipated increase in multi-generational households, the demand for ac-cessory dwelling units (ADU) will increase; more commonly termed “granny flats” or “in-law apartments.” Granny flats are designed for 1-2 persons and are a separate structure from the single-family home and are receiving more attention today in part because of the tiny house trend on home improvement shows. Granny flats provide affordability and inde-pendence for seniors and allow many seniors to age in place.
0.0%
5.0%
10.0%
15.0%
20.0%
25.0%
30.0%
0
200,000
400,000
600,000
800,000
1,000,000
1,200,000
1980 1990 2000 2010 2015 2020 2025 2030 2040
Pctd
. 65+
65+
Pop
Year
Metro Area 65+ Population

CHALLENGES AND OPPORTUNITIES
MAXFIELD RESEARCH AND CONSULTING 131
The demand for senior services will increase and today’s boomers will have higher expecta-tions. Senior programming was historically tied to a senior center; however, today’s active seniors want to walk, run, bike, play tennis or pickleball, and want proximity to cultural amenities and transit. As people age, they generally drive less and rely more on transit and walking. Many seniors will eventually decide to own only one car and will seek walkable neighborhoods and convenient access to transit, commercial goods and services, health care, and cultural and recreational activities. Finally, seniors desire to live in close proximity to their adult children and grandchildren. Plymouth has a large population of adult children and vibrant schools, which will aid future senior housing growth in Plymouth. Although service needs change as people age; seniors can be a fiscal plus to cities as they generate tax revenue but not students attending public school. Seniors are typically less de-pendent on automobiles, and rely more on walking, biking and on public transit. At the same time, seniors will desire other services such as library usage, community center/fit-ness centers, and first responder calls. Generally, service-intensive senior housing buildings generate a higher volume of emergency calls than other residential land uses. On average, it is estimated a senior housing building will generate 1 call per unit per year. We recom-mend Plymouth consider policies that will assist the housing and service needs of seniors in the future.
• Housing Resources & Programs. Many communities and local Housing and Redevelopment
Authorities (HRAs) offer programs to promote and preserve the existing housing stock. In addition, there are various regional and state organizations that assist local communities enhance their housing stock. The City of Plymouth utilizes numerous housing programs, in-cluding Architectural Design Service, Community Fix Up Loans, Emergency Repair Grant Fund, First – Time Homebuyer, Foreclosure Prevention, Home Improvement Deferred Loan, Rehabilitation Loans, and Reverse Mortgage Assistance, among other housing programs and services. The following is a sampling of potential programs that could be explored to aid and improve Plymouth’s housing stock. o Construction Management Services – Assist homeowners regarding local building codes,
reviewing contractor bids, etc. Typically provided as a service by the building depart-ment. This type of service could also be rolled into various remodeling related pro-grams.
o Corridor Housing Program - Program where city provides a funding source to acquire sites for multifamily housing development on or near community, commercial, or transit corridors. Funds can also be utilized to assemble larger redevelopment sites for new mixed-income and ownership multifamily housing. At least 20% of the units need to be affordable. Typically located near a TOD or BRTOD location.
o Density Bonuses – Since the cost of land is a significant barrier to housing affordability, increasing densities can result in lower housing costs by reducing the land costs per unit. The City of Plymouth can offer density bonuses as a way to encourage higher-density residential development while also promoting an affordable housing component.

CHALLENGES AND OPPORTUNITIES
MAXFIELD RESEARCH AND CONSULTING 132
o Fast Track Permitting – Program designed to reduce delays during the development process that ultimately add to the total costs of housing development. By expediting the permitting process costs can be reduced to developers while providing certainty into the development process. Typically, no-cost to the local government jurisdiction.
o Home Improvement Area (HIA) - HIAs allow a townhome or condo association low inter-est loans to finance improvements to common areas. Unit owners repay the loan through fees imposed on the property, usually through property taxes. Typically, a "last resort" financing tool when associations are unable to obtain traditional financing due to the loss of equity from the real estate market or deferred maintenance on older properties.
o Inclusionary Housing – Inclusionary housing policies and programs rely on private sector housing developers to create affordable housing as they develop market rate projects. Inclusionary zoning encourages or mandates the inclusion of a set proportion of afforda-ble housing units in each new market rate housing development above a certain size. These programs are popular approaches for local and state governments, in high cost urban areas to encourage the development of affordable housing.
o Infill Lots – The City or HRA purchase blighted or substandard housing units from willing sellers. After the home has been removed, the vacant land is placed into the program for future housing redevelopment. Future purchasers can be builders or the future owner-occupant who has a contract with a builder. Typically, all construction must be completed within an allocated time-frame (one year in most cases).
o Land Banking – Land Banking is a program of acquiring land with the purpose of devel-oping at a later date. After a holding period, the land can be sold to a developer (often at a price lower than market) with the purpose of developing affordable housing.
o Live Where You Work - Program designed to promote homeownership in the same community where employees work. City provides a grant to eligible employees to pur-chase a home near their workplace. Employers can also contribute or match the city's contribution. Participants must obtain a first mortgage through participating lenders. The grant can be allocated towards down payment assistance, closing costs, and gap fi-nancing. Some restrictions apply (i.e. length of employment, income, home buyer edu-cation, etc.)
o Realtor Forum - Typically administered by City with partnership by local school board. Inform local Realtors about school district news, current development projects, and other marketing factors related to real estate in the community. In addition, Realtors usually receive CE credits.
o Remodeling Tours - City-driven home remodeling tour intended to promote the en-hancement of the housing stock through home renovations/additions. Homeowners open their homes to the public to showcase home improvements.
o Rent to Own - Income-eligible families rent for a specified length of time with the end-goal of buying a home. The HRA saves a portion of the monthly rent that will be allo-cated for a down payment on a future house.
o Shallow Rent Subsidy: The HRA funds a shallow rent subsidy program to provide pro-gram participants living in market rate rentals a rent subsidy (typically about $100 to $300 per month).

CHALLENGES AND OPPORTUNITIES
MAXFIELD RESEARCH AND CONSULTING 133
o Tax Increment Financing (TIF): Program that offers communities a flexible financing tool to assist housing projects and related infrastructure. TIF enables communities to dedi-cate the incremental tax revenues from new housing development to help make the housing more affordable or pay for related costs. TIF funds can be used to provide a di-rect subsidy to a particular housing project or they can also be used to promote afforda-ble housing by setting aside a portion of TIF proceeds into a dedicated fund from other developments receiving TIF.
o Transfer of Development Rights – Transfer of Development Rights (TDR) is a program that shifts the development potential of one site to another site or different location, even a different community. TDR programs allow landowners to sever development rights from properties in government-designated low-density areas, and sell them to purchasers who want to increase the density of development in areas that local govern-ments have selected as higher density areas.
o Waiver or Reduction of Development Fees – There are several fees developers must pay including impact fees, utility and connection fees, park land dedication fees, etc. To help facilitate affordable housing, some fees could be waived or reduced to pass the cost savings onto the housing consumer.
• Job Growth/Employment/Inflow. Historically, low unemployment rates have driven both
existing home purchases and new-home purchases. Lack of job growth leads to slow or di-minishing household growth, which in-turn relates to reduced housing demand. Like most areas across the Twin Cities and Minnesota, the unemployment rate peaked in 2009 during the Great Recession at 9.1%. However, over the past 8 years the unemployment rate has decreased annually and is presently at only 3.1% in Plymouth through 2016. Although the low unemployment rate is positive, if the unemployment rate continues to decline it could be difficult for Plymouth businesses to find enough labor to fill job openings.
In addition, Plymouth is home to many large companies that are job generators in the Twin Cities. Nearly 90% of the jobs in Plymouth are filled by non-residents of the community. As a result, there is a tremendous opportunity to capture these workers as residents and em-ployees in the City of Plymouth.
• Land Supply (Dwindling). The City of Plymouth continues to develop and with each passing
year has fewer areas that can accommodate single-family and multifamily residential devel-opment. Most of the vacant land is located in the northwest sector of Plymouth and most this land will be developed over the next decade. As a result, many of the housing concepts identified on Table CR-1 may have to seek out infill or redevelopment sites. As the land sup-ply dwindles upward pressure on land costs will likely ensue resulting in higher acquisition costs for development that may drive up the consumer’s price on housing.
• Lender-mediated Properties. Lender-mediated properties in Plymouth have declined sub-stantially since the housing downturn and Great Recession of last decade. Lender mediated properties (i.e. foreclosures and short sales) accounted for 20% to 30% of transactions in between 2009 and 2012 before declining annually since and comprising about 4.4% of

CHALLENGES AND OPPORTUNITIES
MAXFIELD RESEARCH AND CONSULTING 134
transactions in 2016. Plymouth experienced far fewer foreclosures than many communities across the Metro Area that experienced much higher rates of short sales and foreclosures. The continued decline in lender-mediated properties will enhance the overall real estate market and pricing will continue to gain from all the losses of last decade. As most home-owners have regained lost equity, the Plymouth housing market should continue to experi-ence stronger velocity as existing homeowners who were unable to move now may have the equity to pursue a trade-up home.
• Mortgage Rates. Mortgage rates play a crucial part in housing affordability. Lower mort-
gage rates result in a lower monthly mortgage payment and buyers receiving more home for their dollar. Rising interest rates often require homebuyers to raise their down payment in order to maintain the same housing costs. Mortgage rates have remained at historic lows over the past several years coming out of the Great Recession. The Federal Reserve has raised the short-term interest rate only twice since the recession; however, they have hinted at rates increasing in 2017. However, at this time it is unknown if the central bank will raise rates to head off inflation. A significant increase in rates (+1% or more; over 5% in the short term) would greatly affect the housing market and would slow projected for-sale housing demand. The following chart illustrates historical mortgage rate averages as compiled by Freddie Mac. The Freddie Mac Market Survey (PMMS) has been tracking mortgage rates since 1971 and is the most relied upon benchmark for evaluating mortgage interest market conditions. The Freddie Mac survey is based on 30-year mortgages with a loan-to-value of 80%.
0.0%
5.0%
10.0%
15.0%
20.0%
25.0%
30.0%
35.0%
0
50
100
150
200
250
300
2005 2006 2007 2008 2009 2010 2011 2012 2013 2014 2015 2016
Plymouth Lender-Mediated Sales: 2005-2016
Lender Med. Resales Pct.

CHALLENGES AND OPPORTUNITIES
MAXFIELD RESEARCH AND CONSULTING 135
• Millennials. The Millennials (generally defined as persons born in the 1980 and 1990s) are now bigger than the Baby Boom generation and have begun impacting real estate develop-ment. The 80 million Millennials have begun to influence real estate as they formed new households. However, many Millennials’ are delaying home ownership due to high student loan debt and social changes (i.e. delayed marriage, delayed childbearing, delayed careers, etc.). The median first-time home buyer is now age 32 (an older Millennial) which is up from age 30 about a decade ago. Increasing monthly rents for rental housing in the Twin Cities has also affected the ability of Millennial’s to save for a down payment and qualify for a mortgage. Although Millennial’s have favored more urban locations and are typically renters today, survey’s show they are not that different in their preferences from other generations. Many millennials’ have indicated they still desire to live in the suburbs, however they desire communities with amenities such as parks, walking trails, shopping, proximity to jobs, and entertainment. Once Millennial’s start having kids, many will begin households that will shift from renters to buyers. Because Plymouth has strong employment and relatively affordable older housing stock compared to other inner-ring suburban areas, we believe there is an opportunity to capture the Millennials in Plymouth from households currently residing in other inner-ring areas seeking more housing value for their dollar.
0.00%
2.00%
4.00%
6.00%
8.00%
10.00%
12.00%
14.00%
16.00%
18.00%
1972
1974
1976
1978
1980
1982
1984
1986
1988
1990
1992
1994
1996
1998
2000
2002
2004
2006
2008
2010
2012
2014
2016
Historic 30-year Mortgage Rates 1972 to 2017 YTD

CHALLENGES AND OPPORTUNITIES
MAXFIELD RESEARCH AND CONSULTING 136
• Naturally Occurring Affordable Housing/Preservation. As illustrated in Table R-8 in the Rental Market Analysis section, about 46% of the market rate rental housing stock in Plym-outh is affordable at 50% to 60% of area median incomes. According to the Harvard’s Joint Center for Housing Studies (JCHS) unsubsidized rentals account for more than 75% of the affordable housing stock in the United States. It is estimated that over one-third of the nat-urally occurring affordable housing stock is composed of smaller multifamily buildings from 5 to 49 units. Within the Twin Cities Metro Area, it is estimated that about 60% of the rental stock is unsubsidized rentals affordable to households at or below 50% AMI. Because the unsubsidized housing market is unregulated and is fluid, there is the chance some affordable market rate units could be lost. New construction costs for apartments in Plymouth will likely exceed $200,000 per unit; whereas an older Class B or Class C rental building may be acquired for under $100,000 per unit. Therefore, it is typically more eco-nomical to rehabilitate an existing property than build a new one. Because of the high cost of new construction, we recommend the City monitor and maintain the unsubsidized rental market as an effort to maintain the affordable housing product type.
• Shadow Rental Inventory. Shadow rentals are generally considered nontraditional rentals that were previously owner-occupied single-family homes, townhomes, or condominiums. The shadow market has originally particularly fueled by homeowners who lost their home to foreclosure after the recession who opt to not rent in a traditional rental complex. Typi-cally, short sales and foreclosures between 2009 and 2012 resulted in substantial price re-ductions which allowed buyers or investors to charge rents below market while still main-taining a profit. Although the shadow market rentals tend to be more affordable, renters run the risk of evictions if the owner does not pay the mortgage. Because the City of Plymouth enforces rental licenses, the City has been able to monitor the number of non-traditional rental units in the community. According to Table HC-4, there are about 1,915 one- and two-unit homes in Plymouth serving as rental properties (22% of rental housing stock). As the housing market continues to rebound, many of these proper-ties will likely transition back to the for-sale market. Plymouth should continue to monitor the shadow rental market to mitigate any problem properties and improve the overall rental housing stock.

APPENDIX
MAXFIELD RESEARCH AND CONSULTING 137
APPENDIX

APPENDIX
MAXFIELD RESEARCH AND CONSULTING 138
Definitions Absorption Period – The period of time necessary for newly constructed or renovated proper-ties to achieve the stabilized level of occupancy. The absorption period begins when the first certificate of occupancy is issued and ends when the last unit to reach the stabilized level of oc-cupancy has signed a lease. Absorption Rate – The average number of units rented each month during the absorption pe-riod. Active adult (or independent living without services available) – Active Adult properties are similar to a general-occupancy apartment building, in that they offer virtually no services but have age-restrictions (typically 55 or 62 or older). Organized activities and occasionally a trans-portation program are usually all that are available at these properties. Because of the lack of services, active adult properties typically do not command the rent premiums of more service-enriched senior housing. Adjusted Gross Income “AGI” – Income from taxable sources (including wages, interest, capital gains, income from retirement accounts, etc.) adjusted to account for specific deductions (i.e. contributions to retirement accounts, unreimbursed business and medical expenses, alimony, etc.). Affordable housing – Housing that is income-restricted to households earning at or below 80% AMI, though individual properties can have income-restrictions set at 40%, 50%, 60% or 80% AMI. Rent is not based on income but instead is a contract amount that is affordable to house-holds within the specific income restriction segment. It is essentially housing affordable to low or very low-income tenants. Amenity – Tangible or intangible benefits offered to a tenant in the form of common area amenities or in-unit amenities. Typical in-unit amenities include dishwashers, washer/dryers, walk-in showers and closets and upgraded kitchen finishes. Typical common area amenities in-clude detached or attached garage parking, community room, fitness center and an outdoor pa-tio or grill/picnic area. Area Median Income “AMI” – AMI is the midpoint in the income distribution within a specific geographic area. By definition, 50% of households earn less than the median income and 50% earn more. The U.S. Department of Housing and Urban Development (HUD) calculates AMI an-nually and adjustments are made for family size. Assisted Living – Assisted Living properties come in a variety of forms, but the target market for most is generally the same: very frail seniors, typically age 80 or older (but can be much younger, depending on their particular health situation), who are in need of extensive support services and personal care assistance. Absent an assisted living option, these seniors would otherwise need to move to a nursing facility. At a minimum, assisted living properties include

APPENDIX
MAXFIELD RESEARCH AND CONSULTING 139
two meals per day and weekly housekeeping in the monthly fee, with the availability of a third meal and personal care (either included in the monthly fee or for an additional cost). Assisted living properties also have either staff on duty 24 hours per day or at least 24-hour emergency response. Building Permit – Building permits track housing starts and the number of housing units author-ized to be built by the local governing authority. Most jurisdictions require building permits for new construction, major renovations, as well as other building improvements. Building permits ensure that all the work meets applicable building and safety rules and is typically required to be completed by a licensed professional. Once the building is complete and meets the inspec-tor’s satisfaction, the jurisdiction will issue a “CO” or “Certificate of Occupancy.” Building per-mits are a key barometer for the health of the housing market and are often a leading indicator in the rest of the economy as it has a major impact on consumer spending. Capture Rate – The percentage of age, size, and income-qualified renter households in a given area or “Market Area” that the property must capture to fill the units. The capture rate is cal-culated by dividing the total number of units at the property by the total number of age, size and income-qualified renter households in the designated area. Comparable Property – A property that is representative of the rental housing choices of the designated area or “Market Area” that is similar in construction, size, amenities, location and/or age. Concession – Discount or incentives given to a prospective tenant to induce signature of a lease. Concessions typically are in the form of reduced rent or free rent for a specific lease term, or free amenities, which are normally charged separately, such as parking. Congregate (or independent living with services available) – Congregate properties offer sup-port services such as meals and/or housekeeping, either on an optional basis or a limited amount included in the rents. These properties typically dedicate a larger share of the overall building area to common areas, in part, because the units are smaller than in adult housing and in part to encourage socialization among residents. Congregate properties attract a slightly older target market than adult housing, typically seniors age 75 or older. Rents are also above those of the active adult buildings, even excluding the services. Contract Rent – The actual monthly rent payable by the tenant, including any rent subsidy paid on behalf of the tenant, to the owner, inclusive of all terms of the lease. Demand – The total number of households that would potentially move into a proposed new or renovated housing project. These households must be of appropriate age, income, tenure and size for a specific proposed development. Components vary and can include, but are not lim-ited to: turnover, people living in substandard conditions, rent over-burdened households, in-come-qualified households and age of householder. Demand is project specific.

APPENDIX
MAXFIELD RESEARCH AND CONSULTING 140
Density – Number of units in a given area. Density is typically measured in dwelling units (DU) per acre – the larger the number of units permitted per acre the higher the density; the fewer units permitted results in lower density. Density is often presented in a gross and net format:
• Gross Density – The number of dwelling units per acre based on the gross site acreage. Gross Density = Total residential units/total development area
• Net Density - The number of dwelling units per acre located on the site, but excludes public right-of-way (ROW) such as streets, alleys, easements, open spaces, etc. Net Density = Total residential units/total residential land area (excluding ROWs)
Detached housing – a freestanding dwelling unit, most often single-family homes, situated on its own lot. Effective Rents – Contract rent less applicable concessions. Elderly or Senior Housing – Housing where all the units in the property are restricted for occu-pancy by persons age 62 years or better, or at least 80% of the units in each building are re-stricted for occupancy by households where at least one household member is 55 years of age or better and the housing is designed with amenities, facilities and services to meet the needs of senior citizens. Extremely low-income – person or household with incomes below 30% of Area Median In-come, adjusted for respective household size. Fair Market Rent – Estimates established by HUD of the Gross Rents needed to obtain modest rental units in acceptable conditions in a specific geographic area. The amount of rental income a given property would command if it were open for leasing at any given moment and/or the amount derived based on market conditions that is needed to pay gross monthly rent at mod-est rental housing in a given area. This figure is used as a basis for determining the payment standard amount used to calculate the maximum monthly subsidy for families on at financially assisted housing.
Fair Market Rent – Hennepin County 2017
Floor Area Ratio (FAR) Ratio of the floor area of a building to area of the lot on which the build-ing is located.
EFF 1BR 2BR 3BR 4BR
Fair Market Rent $699 $862 $1,086 $1,538 $1,799
Fair Market Rent

APPENDIX
MAXFIELD RESEARCH AND CONSULTING 141
Foreclosure – A legal process in which a lender or financial institute attempts to recover the balance of a loan from a borrower who has stopped making payments to the lender by using the sale of the house as collateral for the loan. Gross Rent – The monthly housing cost to a tenant which equals the Contract Rent provided for in the lease, plus the estimated cost of all utilities paid by tenants. Maximum Gross Rents for Hennepin County in 2016 are as follows:
Gross Rent Hennepin County – 2017
Household – All persons who occupy a housing unit, including occupants of a single-family, one person living alone, two or more families living together, or any other group of related or unre-lated persons who share living arrangements. Household Trends – Changes in the number of households for any particular areas over a measurable period of time, which is a function of new household’s formations, changes in aver-age household size, and met migration. Housing Choice Voucher Program – The federal government's major program for assisting very low-income families, the elderly, and the disabled to afford decent, safe, and sanitary housing in the private market. A family that is issued a housing voucher is responsible for finding a suit-able housing unit of the family's choice where the owner agrees to rent under the program. Housing choice vouchers are administered locally by public housing agencies. They receive fed-eral funds from the U.S. Department of Housing and Urban Development (HUD) to administer the voucher program. A housing subsidy is paid to the landlord directly by the public housing agency on behalf of the participating family. The family then pays the difference between the actual rent charged by the landlord and the amount subsidized by the program. Housing unit – House, apartment, mobile home, or group of rooms used as a separate living quarters by a single household. HUD Project-Based Section 8 – A federal government program that provides rental housing for very low-income families, the elderly, and the disabled in privately owned and managed rental
EFF 1BR 2BR 3BR 4BR
30% of median $474 $543 $610 $678 $73250% of median $791 $905 $1,017 $1,130 $1,22160% of median $949 $1,086 $1,221 $1,356 $1,46580% of median $1,266 $1,448 $1,628 $1,808 $1,954100% of median $1,582 $1,810 $2,035 $2,260 $2,442120% of median $1,899 $2,172 $2,442 $2,712 $2,931
Maximum Gross Rent

APPENDIX
MAXFIELD RESEARCH AND CONSULTING 142
units. The owner reserves some or all of the units in a building in return for a Federal govern-ment guarantee to make up the difference between the tenant's contribution and the rent. A tenant who leaves a subsidized project will lose access to the project-based subsidy. HUD Section 202 Program – Federal program that provides direct capital assistance and operat-ing or rental assistance to finance housing designed for occupancy by elder household who have incomes not exceeding 50% of Area Median Income. HUD Section 811 Program – Federal program that provides direct capital assistance and operat-ing or rental assistance to finance housing designed for occupancy of persons with disabilities who have incomes not exceeding 50% Area Median Income. HUD Section 236 Program – Federal program that provides interest reduction payments for loans which finance housing targeted to households with income not exceeding 80% Area Me-dian Income who pay rent equal to the greater or market rate or 30% of their adjusted income. Income limits – Maximum household’s income by a designed geographic area, adjusted for household size and expressed as a percentage of the Area Median Income, for the purpose of establishing an upper limit for eligibility for a specific housing program.
Inflow/Outflow – The Inflow/Outflow Analysis generates results showing the count and charac-teristics of worker flows in to, out of, and within the defined geographic area. Low-Income – Person or household with gross household incomes below 80% of Area Median Income, adjusted for household size. Low-Income Housing Tax Credit – A program aimed to generate equity for investment in af-fordable rental housing authorized pursuant to Section 42 of the Internal Revenue Code. The program requires that a certain percentage of units built be restricted for occupancy to house-holds earning 60% or less of Area Median Income, and rents on these units be restricted ac-cordingly. Market analysis – The study of real estate market conditions for a specific type of property, ge-ographic area or proposed (re)development.
1 pph 2 pph 3 pph 4 pph 5 pph 6 pph 7 pph 8 pph
30% of median $18,990 $21,720 $24,420 $27,120 $29,310 $31,470 $33,630 $35,82050% of median $31,650 $36,200 $40,700 $45,200 $48,850 $52,450 $56,050 $59,700
60% of median $37,980 $43,440 $48,840 $54,240 $58,620 $62,940 $67,260 $71,640
80% of median $50,640 $57,920 $65,120 $72,320 $78,160 $83,920 $89,680 $95,520
100% of median $63,300 $72,400 $81,400 $90,400 $97,700 $104,900 $112,100 $119,400
120% of median $75,960 $86,880 $97,680 $108,480 $117,240 $125,880 $134,520 $143,280
Income Limits by Household Size

APPENDIX
MAXFIELD RESEARCH AND CONSULTING 143
Market rent – The rent that an apartment, without rent or income restrictions or rent subsi-dies, would command in a given area or “Market Area” considering its location, features and amenities. Market study – A comprehensive study of a specific proposal including a review of the housing market in a defined market or geography. Project specific market studies are often used by de-velopers, property managers or government entities to determine the appropriateness of a pro-posed development, whereas market specific market studies are used to determine what house needs, if any, existing within a specific geography. Market rate rental housing – Housing that does not have any income-restrictions. Some prop-erties will have income guidelines, which are minimum annual incomes required in order to re-side at the property. Memory Care – Memory Care properties, designed specifically for persons suffering from Alz-heimer’s disease or other dementias, is one of the newest trends in senior housing. Properties consist mostly of suite-style or studio units or occasionally one-bedroom apartment-style units, and large amounts of communal areas for activities and programming. In addition, staff typi-cally undergoes specialized training in the care of this population. Because of the greater amount of individualized personal care required by residents, staffing ratios are much higher than traditional assisted living and thus, the costs of care are also higher. Unlike conventional assisted living, however, which deals almost exclusively with widows or widowers, a higher pro-portion of persons afflicted with Alzheimer’s disease are in two-person households. That means the decision to move a spouse into a memory care facility involves the caregiver’s con-cern of incurring the costs of health care at a special facility while continuing to maintain their home. Migration – The movement of households and/or people into or out of an area. Mixed-income property – An apartment property contained either both income-restricted and unrestricted units or units restricted at two or more income limits. Mobility – The ease at which people move from one location to another. Moderate Income – Person or household with gross household income between 80% and 120% of the Area Median Income, adjusted for household size. Multifamily – Properties and structures that contain more than two housing units. Naturally Occurring Affordable Housing – Although affordable housing is typically associated with an income-restricted property, there are other housing units in communities that indi-rectly provide affordable housing. Housing units that were not developed or designated with income guidelines (i.e. assisted) yet are more affordable than other units in a community are

APPENDIX
MAXFIELD RESEARCH AND CONSULTING 144
considered “naturally-occurring” or “unsubsidized affordable” units. This rental supply is avail-able through the private market, versus assisted housing programs through various governmen-tal agencies. Property values on these units are lower based on a combination of factors, such as: age of structure/housing stock, location, condition, size, functionally obsolete, school dis-trict, etc. Net Income – Income earned after payroll withholdings such as state and federal income taxes, social security, as well as retirement savings and health insurance. Net Worth – The difference between assets and liabilities, or the total value of assets after the debt is subtracted. Pent-up demand – A market in which there is a scarcity of supply and as such, vacancy rates are very low or non-existent. Population – All people living in a geographic area. Population Density – The population of an area divided by the number of square miles of land area. Population Trends – Changes in population levels for a particular geographic area over a spe-cific period of time – a function of the level of births, deaths, and in/out migration. Project-Based rent assistance – Rental assistance from any source that is allocated to the prop-erty or a specific number of units in the property and is available to each income eligible tenant of the property or an assisted unit. Redevelopment – The redesign, rehabilitation or expansion of existing properties. Rent burden – gross rent divided by adjusted monthly household income. Restricted rent – The rent charged under the restriction of a specific housing program or sub-sidy. Saturation – The point at which there is no longer demand to support additional market rate, affordable/subsidized, rental, for-sale, or senior housing units. Saturation usually refers to a particular segment of a specific market. Senior Housing – The term “senior housing” refers to any housing development that is re-stricted to people age 55 or older. Today, senior housing includes an entire spectrum of hous-ing alternatives. Maxfield Research Inc. classifies senior housing into four categories based on the level of support services. The four categories are: Active Adult, Congregate, Assisted Living and Memory Care.

APPENDIX
MAXFIELD RESEARCH AND CONSULTING 145
Short Sale – A sale of real estate in which the net proceeds from selling the property do not cover the sellers’ mortgage obligations. The difference is forgiven by the lender, or other ar-rangements are made with the lender to settle the remainder of the debt. Single-family home – A dwelling unit, either attached or detached, designed for use by one household and with direct street access. It does not share heating facilities or other essential electrical, mechanical or building facilities with another dwelling. Stabilized level of occupancy – The underwritten or actual number of occupied units that a property is expected to maintain after the initial lease-up period. Subsidized housing – Housing that is income-restricted to households earning at or below 30% AMI. Rent is generally based on income, with the household contributing 30% of their adjusted gross income toward rent. Also referred to as extremely low income housing. Subsidy – Monthly income received by a tenant or by an owner on behalf of a tenant to pay the difference between the apartment’s contract/market rate rent and the amount paid by the ten-ant toward rent. Substandard conditions – Housing conditions that are conventionally considered unacceptable and can be defined in terms of lacking plumbing facilities, one or more major mechanical or electrical system malfunctions, or overcrowded conditions. Target population – The market segment or segments of the given population a development would appeal or cater to. Tenant – One who rents real property from another individual or rental company. Tenant-paid utilities – The cost of utilities, excluding cable, telephone, or internet necessary for the habitation of a dwelling unit, which are paid by said tenant. Tenure – The distinction between owner-occupied and renter-occupied housing units. Turnover – A measure of movement of residents into and out of a geographic location. Turnover period – An estimate of the number of housing units in a geographic location as a per-centage of the total house units that will likely change occupants in any one year. Unrestricted units – Units that are not subject to any income or rent restrictions. Vacancy period – The amount of time an apartment remains vacant and is available on the market for rent.

APPENDIX
MAXFIELD RESEARCH AND CONSULTING 146
Workforce housing – Housing that is income-restricted to households earning between 80% and 120% AMI. Also referred to as moderate-income housing. Zoning – Classification and regulation of land use by local governments according to use catego-ries (zones); often also includes density designations and limitations