comprehensive housing market analysis for boise city, · pdf filecomprehensive housing market...
TRANSCRIPT
C O M P R E H E N S I V E H O U S I N G M A R K E T A N A L Y S I S
Boise City, IdahoU.S. Department of Housing and Urban Development Office of Policy Development and Research As of January 1, 2016
Malheur
Elmore
Elko
CusterValley
Camas
TwinFalls
Washington
Gooding
Baker
Payette
Humboldt
Blaine
Adams
IdahoOre
gon
Nevada
Owyhee
Boise
Ada
Gem
Canyon
Housing Market Area
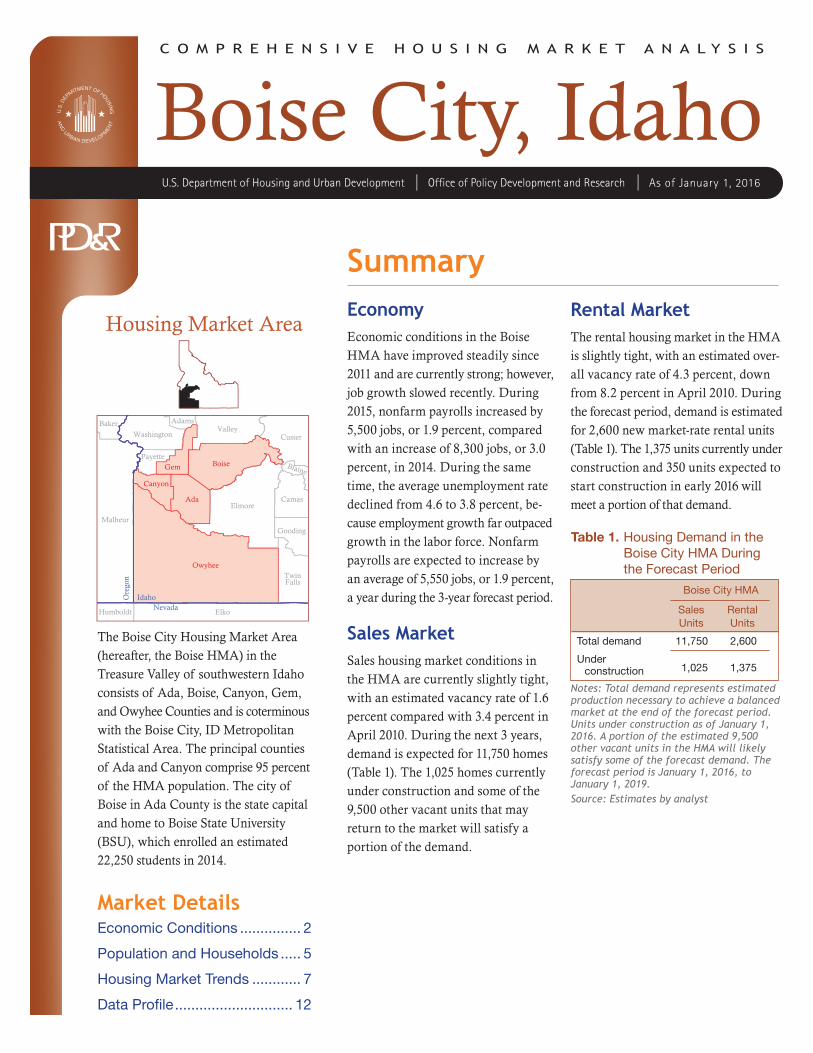
The Boise City Housing Market Area (hereafter, the Boise HMA) in the Treasure Valley of southwestern Idaho consists of Ada, Boise, Canyon, Gem, and Owyhee Counties and is coterminous with the Boise City, ID Metropolitan Statistical Area. The principal counties of Ada and Canyon comprise 95 percent of the HMA population. The city of Boise in Ada County is the state capital and home to Boise State University (BSU), which enrolled an estimated 22,250 students in 2014.
SummaryEconomy Economic conditions in the Boise HMA have improved steadily since 2011 and are currently strong; however, job growth slowed recently. During 2015, nonfarm payrolls increased by 5,500 jobs, or 1.9 percent, compared with an increase of 8,300 jobs, or 3.0 percent, in 2014. During the same time, the average unemployment rate declined from 4.6 to 3.8 percent, be - cause employment growth far outpaced growth in the labor force. Nonfarm payrolls are expected to increase by an average of 5,550 jobs, or 1.9 percent, a year during the 3-year forecast period.
Sales MarketSales housing market conditions in the HMA are currently slightly tight, with an estimated vacancy rate of 1.6 percent compared with 3.4 percent in April 2010. During the next 3 years, demand is expected for 11,750 homes (Table 1). The 1,025 homes currently under construction and some of the 9,500 other vacant units that may return to the market will satisfy a portion of the demand.
Rental MarketThe rental housing market in the HMA is slightly tight, with an estimated over - all vacancy rate of 4.3 percent, down from 8.2 percent in April 2010. During the forecast period, demand is estimated for 2,600 new market-rate rental units (Table 1). The 1,375 units currently under construction and 350 units expected to start construction in early 2016 will meet a portion of that demand.
Table 1. Housing Demand in the Boise City HMA During the Forecast Period
Boise City HMA
SalesUnits
RentalUnits
Total demand 11,750 2,600
Under construction 1,025 1,375
Notes: Total demand represents estimated production necessary to achieve a balanced market at the end of the forecast period. Units under construction as of January 1, 2016. A portion of the estimated 9,500 other vacant units in the HMA will likely satisfy some of the forecast demand. The forecast period is January 1, 2016, to January 1, 2019.Source: Estimates by analyst
Market DetailsEconomic Conditions ............... 2
Population and Households ..... 5
Housing Market Trends ............ 7
Data Profile ............................. 12
Bo
ise
Cit
y,
ID •
CO
MP
RE
HE
NS
IVE
HO
US
ING
MA
RK
ET
AN
ALY
SIS
2Economic Conditions
Economic conditions in the Boise HMA are currently strong,
continuing the recovery that began in 2011. The HMA experienced an eco-nomic expansion from 2004 through 2007, with nonfarm payrolls increas-ing by an average of 10,600 jobs, or 4.2 percent, annually; the unemployment rate averaged 3.6 percent. Strong labor market conditions led to an influx of new residents, increasing the demand for residential construction, which further increased the demand for labor, especially construction labor. Popula-tion growth during this time led to an increase in the demand for healthcare services as well. Subsequent to that increase, the national recession caused
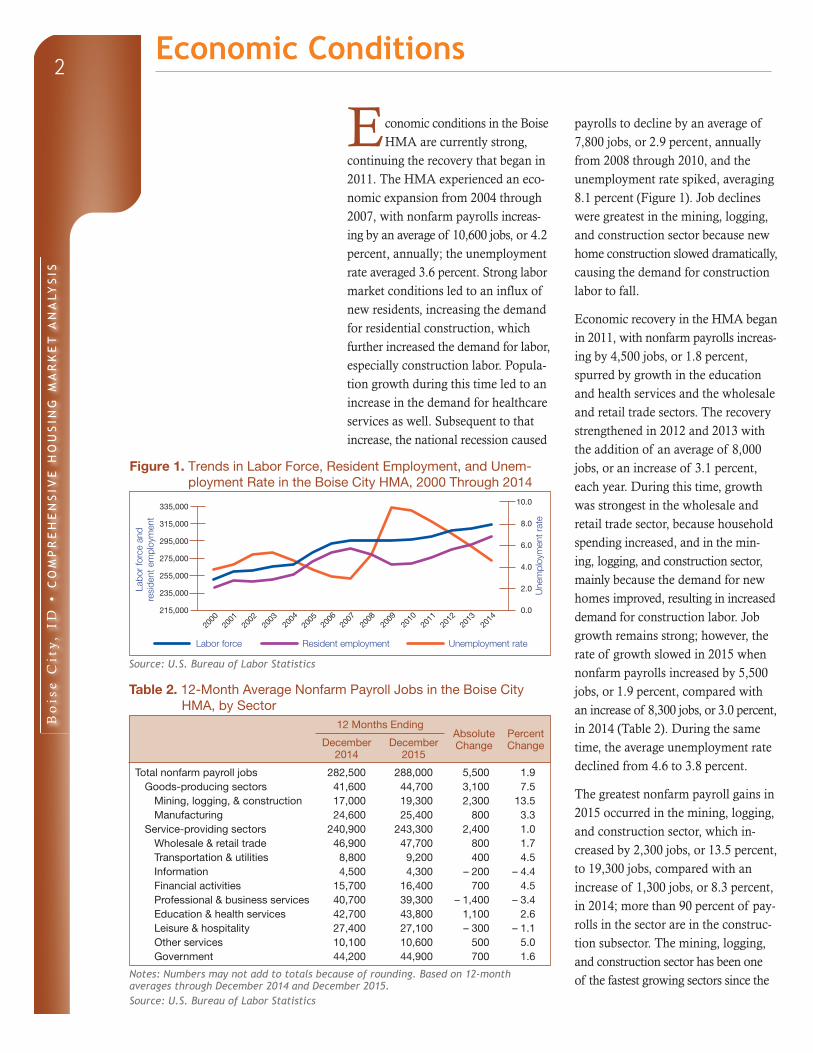
payrolls to decline by an average of 7,800 jobs, or 2.9 percent, annually from 2008 through 2010, and the unemployment rate spiked, averaging 8.1 percent (Figure 1). Job declines were greatest in the mining, logging, and construction sector because new home construction slowed dramatically, causing the demand for construction labor to fall.
Economic recovery in the HMA began in 2011, with nonfarm payrolls increas-ing by 4,500 jobs, or 1.8 percent, spurred by growth in the education and health services and the wholesale and retail trade sectors. The recovery strengthened in 2012 and 2013 with the addition of an average of 8,000 jobs, or an increase of 3.1 percent, each year. During this time, growth was strongest in the wholesale and retail trade sector, because household spending increased, and in the min-ing, logging, and construction sector, mainly because the demand for new homes improved, resulting in increased demand for construction labor. Job growth remains strong; however, the rate of growth slowed in 2015 when nonfarm payrolls increased by 5,500 jobs, or 1.9 percent, compared with an increase of 8,300 jobs, or 3.0 percent, in 2014 (Table 2). During the same time, the average unemployment rate declined from 4.6 to 3.8 percent.
The greatest nonfarm payroll gains in 2015 occurred in the mining, logging, and construction sector, which in-creased by 2,300 jobs, or 13.5 percent, to 19,300 jobs, compared with an increase of 1,300 jobs, or 8.3 percent, in 2014; more than 90 percent of pay - rolls in the sector are in the construc-tion subsector. The mining, logging, and construction sector has been one of the fastest growing sectors since the
Figure 1. Trends in Labor Force, Resident Employment, and Unem-ployment Rate in the Boise City HMA, 2000 Through 2014
Source: U.S. Bureau of Labor Statistics
Table 2. 12-Month Average Nonfarm Payroll Jobs in the Boise City HMA, by Sector
12 Months EndingAbsolute Change
Percent ChangeDecember
2014December
2015
Total nonfarm payroll jobs 282,500 288,000 5,500 1.9Goods-producing sectors 41,600 44,700 3,100 7.5
Mining, logging, & construction 17,000 19,300 2,300 13.5Manufacturing 24,600 25,400 800 3.3
Service-providing sectors 240,900 243,300 2,400 1.0Wholesale & retail trade 46,900 47,700 800 1.7Transportation & utilities 8,800 9,200 400 4.5Information 4,500 4,300 – 200 – 4.4Financial activities 15,700 16,400 700 4.5Professional & business services 40,700 39,300 – 1,400 – 3.4Education & health services 42,700 43,800 1,100 2.6Leisure & hospitality 27,400 27,100 – 300 – 1.1Other services 10,100 10,600 500 5.0Government 44,200 44,900 700 1.6
Notes: Numbers may not add to totals because of rounding. Based on 12-month averages through December 2014 and December 2015.Source: U.S. Bureau of Labor Statistics
Une
mpl
oym
ent r
ate
Labo
r fo
rce
and
resi
dent
em
ploy
men
t
335,000
315,000
295,000
275,000
255,000
235,000
215,000
2000
2002
2004
Labor force Resident employment Unemployment rate
10.0
8.0
6.0
4.0
2.0
0.0
2006
2001
2003
2005
2007
2009
2010
2008
2012
2013
2014
2011
Bo
ise
Cit
y,
ID •
CO
MP
RE
HE
NS
IVE
HO
US
ING
MA
RK
ET
AN
ALY
SIS
3
economic recovery began, despite being the hardest hit during the economic recession and housing market collapse, losing an average of 2,300 jobs, or 12 percent, annually from 2007 through 2011. Most of the job growth during the past 5 years can be attributed to increased demand for construction labor as the demand for new homes and apartments returned and also to a boost in commercial construction. Approximately 5 million square feet of retail, office, and industrial space have been added to the HMA since 2010 (Colliers International). The largest commercial construction project currently under way is the $79 million City Center Plaza and underground transit center, which is employing 150 people and is expected to be complete in mid-2016. Growth in this sector is expected to continue during the 3-year forecast period as new commercial and residential development continues throughout the HMA and the demand for con-struction labor remains high.
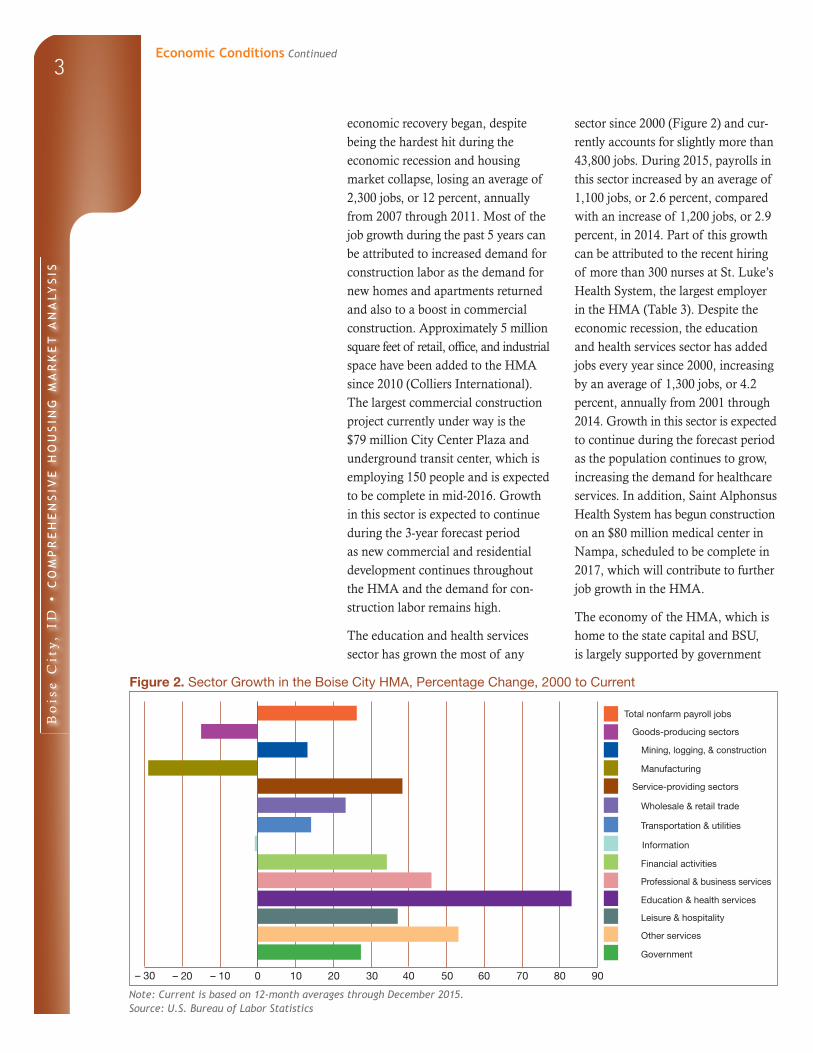
The education and health services sector has grown the most of any
sector since 2000 (Figure 2) and cur-rently accounts for slightly more than 43,800 jobs. During 2015, payrolls in this sector increased by an average of 1,100 jobs, or 2.6 percent, compared with an increase of 1,200 jobs, or 2.9 percent, in 2014. Part of this growth can be attributed to the recent hiring of more than 300 nurses at St. Luke’s Health System, the largest employer in the HMA (Table 3). Despite the economic recession, the education and health services sector has added jobs every year since 2000, increasing by an average of 1,300 jobs, or 4.2 percent, annually from 2001 through 2014. Growth in this sector is expected to continue during the forecast period as the population continues to grow, increasing the demand for healthcare services. In addition, Saint Alphonsus Health System has begun construction on an $80 million medical center in Nampa, scheduled to be complete in 2017, which will contribute to further job growth in the HMA.
The economy of the HMA, which is home to the state capital and BSU, is largely supported by government
Figure 2. Sector Growth in the Boise City HMA, Percentage Change, 2000 to Current
Note: Current is based on 12-month averages through December 2015.Source: U.S. Bureau of Labor Statistics
Economic Conditions Continued
Total nonfarm payroll jobs
Goods-producing sectors
Mining, logging, & construction
Manufacturing
Service-providing sectors
Information
Financial activities
Professional & business services
Education & health services
Government
Other services
Leisure & hospitality
Transportation & utilities
Wholesale & retail trade
– 20 – 10 200 10– 30 30 40 50 60 70 80 90

Bo
ise
Cit
y,
ID •
CO
MP
RE
HE
NS
IVE
HO
US
ING
MA
RK
ET
AN
ALY
SIS
4
payrolls, accounting for 44,900 jobs in the HMA. In 2015, government pay-rolls increased by 700 jobs, or 1.6 per-cent, compared with an increase of 600 jobs, or 1.4 percent, in 2014. State government and local government are the predominant subsectors, with 13,600 and 25,100 employees, respec-tively, including 2,750 state employees at BSU. The university, with 22,250 enrolled students in the fall of 2015 and total expenses of nearly $344.1 million in 2014, has a considerable impact on the local economy. A 2010 economic impact study estimated that students spent $195 million a year on living expenses, with an additional $17 million in indirect expenses (BSU). The government sector was a steady source of growth from 2001 through
2009; however, budget shortfalls caused by the recession resulted in the loss of 600 jobs, or 1.3 percent, annually during 2010 and 2011. As the labor market began to improve, government revenue increased and the sector added an average of 500 jobs, an increase of 1.2 percent, a year from 2012 through 2013. Modest growth in the government sector is expected to continue during the forecast period.
The wholesale and retail trade sector added 800 jobs, an increase of 1.7 percent, to total 47,700 jobs, in 2015 and is the largest employment sector in the economy, accounting for 16.6 percent of total nonfarm payrolls in the HMA (Figure 3). By comparison, payrolls increased by 1,200 jobs, or 2.6 percent, in 2014. Job growth in this sector is attributed to increased consumer spending as a result of the strong economic recovery and improv-ing household finances in the HMA. During the second and third quarters of 2015, more than 500,000 square feet of retail space were leased or sold in the HMA (Colliers International). Sector payrolls declined significantly during the economic recession when consumer spending slowed dramatically, but payrolls have since surpassed the prerecession level of jobs. Job growth is expected to continue in this sector as the economy continues to expand.
The largest job losses in 2015 occurred in the professional and business ser - vices sector, down 1,400 jobs, or 3.4 percent, to 39,300 jobs, compared with a gain of 800 jobs, or 2.0 percent, during 2014. These job losses were largely a result of job losses at Maximus, a call center that provided customer support for the Affordable Care Act, which laid off 1,500 people in 2015.
Table 3. Major Employers in the Boise City HMA
Name of Employer Nonfarm Payroll Sector Number of Employees
St. Luke’s Health System Education & health services 8,450Micron Technology, Inc. Manufacturing 5,750Boise State University Government 4,550Saint Alphonsus Regional Medical Center Education & health services 3,450Wal-Mart Stores, Inc. Wholesale & retail trade 2,550Alberstons, LLC Wholesale & retail trade 2,050HP Inc. Manufacturing 2,050J.R. Simplot Company Manufacturing 2,050Idaho Power Transportation & utilities 1,750Wells Fargo & Company Financial activities 1,450
Notes: Excludes local school districts. Data include military personnel, who are generally not included in nonfarm payroll survey data.Source: Boise Valley Economic Partnership, June 2014
Figure 3. Current Nonfarm Payroll Jobs in the Boise City HMA, by Sector
Note: Based on 12-month averages through December 2015.Source: U.S. Bureau of Labor Statistics
Government 15.6%
Leisure & hospitality 9.4%
Other services 3.7%
Education & health services 15.2%
Professional & business services 13.6%
Wholesale & retail trade 16.6%
Manufacturing 8.8%
Mining, logging, & construction 6.7%
Information 1.5%
Transportation & utilities 3.2%
Financial activities 5.7%
Economic Conditions Continued

Bo
ise
Cit
y,
ID •
CO
MP
RE
HE
NS
IVE
HO
US
ING
MA
RK
ET
AN
ALY
SIS
5
The sector was a strong source of job growth before the economic recession but declined by an average of 1,800 jobs, or 4.4 percent, a year during 2009 and 2010 as a result of poor economic conditions. As the economy began to recover, payrolls increased by an aver-age of 600 jobs, or 1.6 percent, a year from 2011 through 2013, partially because the call center industry began to expand in the HMA. Some recent job losses were mitigated when Sykes opened a call center in the summer of
2015, hiring 300 people, with plans to expand to 900 employees during 2016.
During the 3-year forecast period, non - farm payrolls are expected to increase by an average of 5,550 jobs, or 1.9 percent, annually, with growth slowing in the first year and flattening in the second and third years. The wholesale and retail trade and the education and health services sectors are expected to drive economic growth. Table DP-1 at the end of this report provides additional employment data.
Population and Households
As of January 1, 2016, the population of the Boise HMA
is estimated at 684,100, reflecting an average annual growth rate of 1.8 percent, or 11,750 people, since 2010, with net in-migration accounting for more than 65 percent of the increase. From 2000 to 2003, population growth in the HMA averaged 3.0 percent, or 14,650 people, annually, with net in- migration accounting for approximately 9,625 people each year, or 66 percent of the increase (intercensal, based on Census population estimates as of July 1). As the economy expanded from 2003 to 2008, the population increased an average of 3.3 percent, or by 18,150, a year, and net in-migration increased to 12,400 people a year. Job growth in the mining, logging, and construction sector climbed sharply to meet the rising demand for new homes, which stemmed from rapid population growth. Service-related industries, such as healthcare services and retail trade, expanded in the HMA to serve the increase in population, which resulted in even stronger labor market conditions,
prompting further net in-migration from jobseekers, creating even more demand for new homes. Most people moving to the HMA came from Alaska, Arizona, California, Oregon, and Washington (U.S. Census Bureau, Migration Flows).
The economic recession and the fore - closure crisis that followed caused home prices to decline rapidly, which resulted in a sharp reduction in home - building activity. This reduction led to a quick downturn in construction-related payrolls and in the number of new people moving to the HMA—people who had been attracted to strong hiring in the industry. The recession had a similar, but milder, effect on other sectors, including the manufac-turing, the leisure and hospitality, and the wholesale and retail trade sectors. The weak labor and housing markets slowed the rate of population growth to an average of 1.2 percent, or 7,350 people, a year from 2008 to 2010, and net in-migration fell to an average of 1,975 a year, accounting for only 27
Economic Conditions Continued
Bo
ise
Cit
y,
ID •
CO
MP
RE
HE
NS
IVE
HO
US
ING
MA
RK
ET
AN
ALY
SIS
6
percent of the growth. From 2010 to 2012, as economic and housing market conditions began to improve, the popu-lation growth rate increased to an average of 1.6 percent, or 9,875 people,
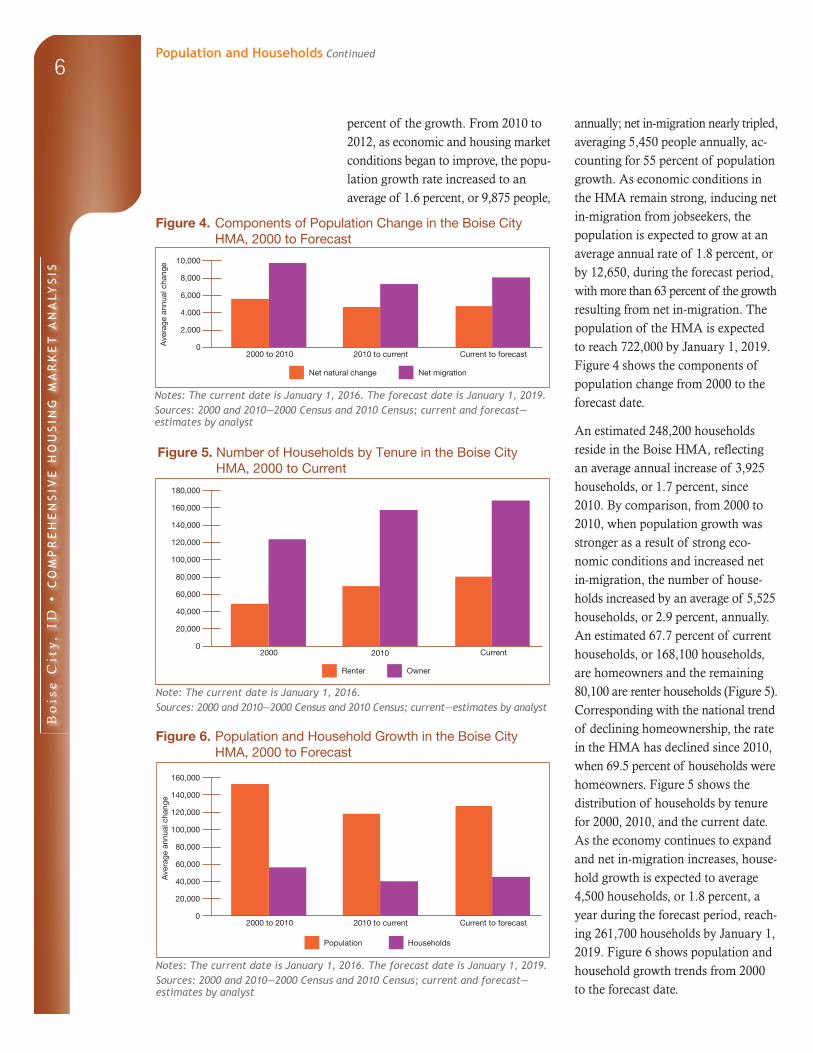
annually; net in-migration nearly tripled, averaging 5,450 people annually, ac - counting for 55 percent of population growth. As economic conditions in the HMA remain strong, inducing net in-migration from jobseekers, the population is expected to grow at an average annual rate of 1.8 percent, or by 12,650, during the forecast period, with more than 63 percent of the growth resulting from net in-migration. The population of the HMA is expected to reach 722,000 by January 1, 2019. Figure 4 shows the components of population change from 2000 to the forecast date.
An estimated 248,200 households reside in the Boise HMA, reflecting an average annual increase of 3,925 households, or 1.7 percent, since 2010. By comparison, from 2000 to 2010, when population growth was stronger as a result of strong eco-nomic conditions and increased net in-migration, the number of house-holds increased by an average of 5,525 households, or 2.9 percent, annually. An estimated 67.7 percent of current households, or 168,100 households, are homeowners and the remaining 80,100 are renter households (Figure 5). Corresponding with the national trend of declining homeownership, the rate in the HMA has declined since 2010, when 69.5 percent of households were homeowners. Figure 5 shows the distribution of households by tenure for 2000, 2010, and the current date. As the economy continues to expand and net in-migration increases, house - hold growth is expected to average 4,500 households, or 1.8 percent, a year during the forecast period, reach - ing 261,700 households by January 1, 2019. Figure 6 shows population and household growth trends from 2000 to the forecast date.
Figure 4. Components of Population Change in the Boise City HMA, 2000 to Forecast
Notes: The current date is January 1, 2016. The forecast date is January 1, 2019.Sources: 2000 and 2010—2000 Census and 2010 Census; current and forecast—estimates by analyst
Figure 5. Number of Households by Tenure in the Boise City HMA, 2000 to Current
Note: The current date is January 1, 2016.Sources: 2000 and 2010—2000 Census and 2010 Census; current—estimates by analyst
Figure 6. Population and Household Growth in the Boise City HMA, 2000 to Forecast
Notes: The current date is January 1, 2016. The forecast date is January 1, 2019.Sources: 2000 and 2010—2000 Census and 2010 Census; current and forecast—estimates by analyst
Population and Households Continued
2000 2010 Current
Renter Owner
180,000
160,000
140,000
120,000
100,000
80,000
60,000
40,000
20,000
0
Population Households
160,000
140,000
120,000
100,000
80,000
60,000
40,000
20,000
02000 to 2010 2010 to current Current to forecast
Ave
rage
ann
ual c
hang
e
10,000
8,000
6,000
4,000
2,000
02000 to 2010 2010 to current Current to forecast
Ave
rage
ann
ual c
hang
e
Net natural change Net migration

Bo
ise
Cit
y,
ID •
CO
MP
RE
HE
NS
IVE
HO
US
ING
MA
RK
ET
AN
ALY
SIS
7Housing Market Trends
Sales Market
Sales housing market conditions in the Boise HMA are currently slightly tight, with an estimated sales vacancy rate of 1.6 percent, down from 3.4 percent in April 2010. The decline in vacancies reflects increased demand for homes because household finances and access to credit are improving, and much of the excess inventory that resulted from the foreclosure crisis has been absorbed. The amount of for-sale inventory peaked in July 2008 at more than 10 months’ supply. As of December 2015, the HMA had 2.4 months of unsold, available inventory, down from 3.4 months in December 2014 (Intermountain Multiple Listing Service).
During the 12 months ending October 2015, sales of existing single-family homes, townhomes, and condominiums (hereafter, existing homes) totaled 17,550 homes sold, reflecting a 14- percent increase compared with the 15,400 existing homes sold a year earlier (CoreLogic, Inc., with adjust-ments by the analyst). Existing home sales peaked in 2005 and 2006 with an average of 23,650 homes sold a year because of strong population growth and increased demand. Despite strong economic conditions in 2006, sales declined from 2006 through 2008 by an average of 18 percent a year, to a low of 11,400 sales. Existing home sales increased moderately in 2009, in part, because of an increase in the number of homes purchased by investors to be held as rental proper-ties, followed by a 15-percent spike in sales during 2010, largely a result of the incentives offered by the first-time homebuyer tax credit program. An average of 14,700 existing homes sold a year from 2011 through 2013 when economic growth returned.
The average existing home sales price was $224,900 during the 12 months ending October 2015, up 7 percent from the same period a year ago. The average sales price increased at an average annual rate of 19 percent from 2004 through 2006, to a high of $272,900. The market softened as economic growth slowed, however, and the average sales price declined 1 percent in 2007, followed by an average annual decline of 12 percent from 2008 through 2011, to a low of $163,600. The demand for homes improved as the economy expanded, leading the average sales price to increase at an average annual rate of 13 percent during 2012 and 2013.
The housing market collapse had a significant impact on the HMA, caus-ing a sharp increase in the number of distressed properties, but conditions have improved. As of November 2015, 2.0 percent of all home loans were seriously delinquent (90 or more days delinquent or in foreclosure) or had transitioned into real estate owned (REO) status compared with a high of 9.0 percent in February 2010 (Black Knight Financial Services, Inc.). REO home sales accounted for 30 percent of total existing home sales from 2009 through 2012 compared with only 3 percent from 2000 through 2008. REO sales have declined steadily since 2012 and, during the 12 months ending October 2015, comprised only 6 percent of existing home sales (CoreLogic, Inc., with adjustments by the analyst).
Sales of new single-family homes, town - homes, and condominiums ( hereafter, new homes) have increased each year since 2011. During the 12 months ending October 2015, 2,800 new homes sold, up 9 percent from the previous 12 months (CoreLogic, Inc., with
Bo
ise
Cit
y,
ID •
CO
MP
RE
HE
NS
IVE
HO
US
ING
MA
RK
ET
AN
ALY
SIS
8
adjustments by the analyst). An average of 5,400 new homes sold a year from 2003 through 2006, when economic and population growth were strongest, but, from 2007 through 2011, sales fell an average of 23 percent a year as demand plummeted because of weak economic conditions. The average sales price for a new home during the 12 months ending October 2015 was $257,900, up 6 percent from a year earlier. By contrast, prices increased by an average of 17 percent a year from 2004 through 2007, peaking at $309,000. Prices declined in response to decreased demand, and, from 2008 through 2010, the average price declined by an average of 24 percent, to a low of $179,600. As the economy started adding jobs and population growth increased, the demand for new homes strengthened, and the average sales price increased at an average annual rate of 8 percent from 2011 through 2013.
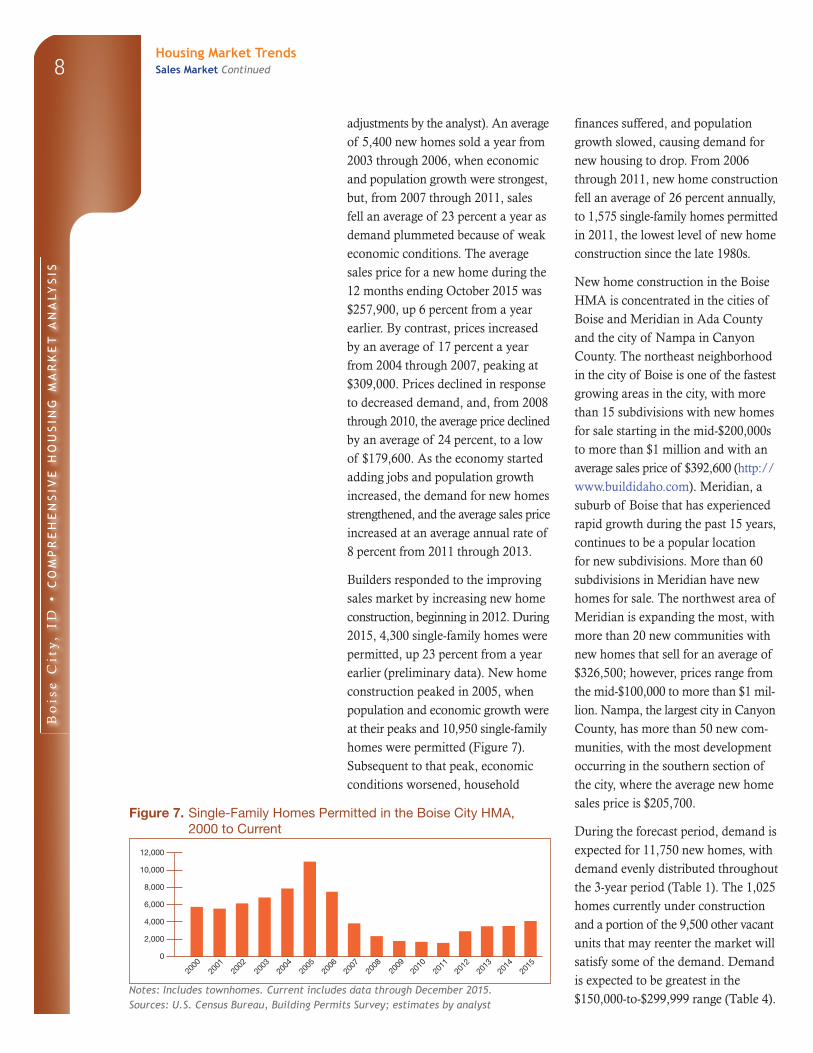
Builders responded to the improving sales market by increasing new home construction, beginning in 2012. During 2015, 4,300 single-family homes were permitted, up 23 percent from a year earlier (preliminary data). New home construction peaked in 2005, when population and economic growth were at their peaks and 10,950 single-family homes were permitted (Figure 7). Subsequent to that peak, economic conditions worsened, household
finances suffered, and population growth slowed, causing demand for new housing to drop. From 2006 through 2011, new home construction fell an average of 26 percent annually, to 1,575 single-family homes permitted in 2011, the lowest level of new home construction since the late 1980s.
New home construction in the Boise HMA is concentrated in the cities of Boise and Meridian in Ada County and the city of Nampa in Canyon County. The northeast neighborhood in the city of Boise is one of the fastest growing areas in the city, with more than 15 subdivisions with new homes for sale starting in the mid-$200,000s to more than $1 million and with an average sales price of $392,600 (http://www.buildidaho.com). Meridian, a suburb of Boise that has experienced rapid growth during the past 15 years, continues to be a popular location for new subdivisions. More than 60 subdivisions in Meridian have new homes for sale. The northwest area of Meridian is expanding the most, with more than 20 new communities with new homes that sell for an average of $326,500; however, prices range from the mid-$100,000 to more than $1 mil - lion. Nampa, the largest city in Canyon County, has more than 50 new com-munities, with the most development occurring in the southern section of the city, where the average new home sales price is $205,700.
During the forecast period, demand is expected for 11,750 new homes, with demand evenly distributed throughout the 3-year period (Table 1). The 1,025 homes currently under construction and a portion of the 9,500 other vacant units that may reenter the market will satisfy some of the demand. Demand is expected to be greatest in the $150,000-to-$299,999 range (Table 4).
Figure 7. Single-Family Homes Permitted in the Boise City HMA, 2000 to Current
Notes: Includes townhomes. Current includes data through December 2015.Sources: U.S. Census Bureau, Building Permits Survey; estimates by analyst
Housing Market TrendsSales Market Continued
2000
2001
2002
2003
2004
2005
2006
12,000
10,000
8,000
6,000
4,000
2,000
0
2008
2009
2010
2011
2013
2015
2014
2012
2007

Bo
ise
Cit
y,
ID •
CO
MP
RE
HE
NS
IVE
HO
US
ING
MA
RK
ET
AN
ALY
SIS
9
Table 4. Estimated Demand for New Market-Rate Sales Housing in the Boise City HMA During the Forecast Period
Price Range ($) Units of PercentFrom To Demand of Total
100,000 149,999 1,525 13.0150,000 199,999 2,350 20.0200,000 249,999 2,350 20.0250,000 299,999 1,875 16.0300,000 349,999 1,175 10.0350,000 399,999 820 7.0400,000 and higher 1,650 14.0
Notes: The 1,025 homes currently under construction and a portion of the esti-mated 9,500 other vacant units in the submarket will likely satisfy some of the forecast demand. The forecast period is January 1, 2016, to January 1, 2019.Source: Estimates by analyst
Rental MarketThe rental housing market in the Boise HMA is slightly tight, with an estimated overall vacancy rate of 4.3 percent as of January 1, 2016, down from 8.2 percent in April 2010 (Figure 8). The market tightened rapidly in 2010 and 2011 because weak labor market con-ditions and stricter lending standards brought on by the foreclosure crisis contributed to a decrease in home-ownership and an increase in demand for rental units. Conditions continued to tighten in 2012 and 2013, but at a slower rate as more investor homes were purchased to be put on the market as rentals and new apartment construction increased significantly.
Approximately 56 percent of all renter households in the HMA occupy apartments, which have a lower vacancy rate than the overall rental market (American Community Survey 2014, 1-year estimates). The apartment vacancy rate was 5.6 percent in the fourth quarter of 2015, up from 2.1 percent in the fourth quarter of 2014 (Reis, Inc.). The rate increase reflects the significant number of new units that entered the market in the past year and an increase in the number of units still in lease up. The apartment vacancy rate peaked in 2009, at 9.0 percent, and has since fallen because of a shift in preferences toward rent-ing and record low inventory growth from 2008 through 2011. From the fourth quarter of 2014 to the fourth quarter of 2015, the average asking rent increased 4 percent, to $797, and rents averaged $558 for studio units, $727 for one-bedroom units, $824 for two-bedroom units, and $931 for three-bedroom units.
An estimated 19,750 BSU students live off campus in private housing, providing a stable source of renter demand in the HMA. The university
Figure 8. Rental Vacancy Rates in the Boise City HMA, 2000 to Current
Note: The current date is January 1, 2016.
Sources: 2000 and 2010—2000 Census and 2010 Census; current—estimates by analyst
Housing Market TrendsSales Market Continued
2000 Current2010
5.8
4.3
8.29.0
8.0
7.0
6.0
5.0
4.0
3.0
2.0
1.0
0.0

Bo
ise
Cit
y,
ID •
CO
MP
RE
HE
NS
IVE
HO
US
ING
MA
RK
ET
AN
ALY
SIS
10
has 2,500 beds of student housing, with potential plans, but no firm commitment, to build a 655-bed dormitory for honors students and freshmen in the next few years. The average cost per bed (excluding a meal plan) ranges from $351 to $581 a month (http://www.idahostatesman.com). Private developers, however, have been very active recently, building new luxury apartment communities geared toward students, with amenities uncommon in the rest of the market, some of which include tanning booths, hot tubs, game rooms, basketball and volleyball courts, outdoor movie screens, private study and meeting rooms, and complementary coffee bars. These new apartments are available to the general public but are leased per bedroom, and apartment managers help match students with roommates. Three new communities opened in the summer of 2015, adding 541 apart-ments, approximately 1,500 beds, to the rental housing market. Occupancy rates averaged 65 to 75 percent during the 2015 fall semester. One-bedroom units range from $600 to $1,000 per month, and bedroom rents decrease as the number of bedrooms per unit increases.
Apartment construction has been strong since 2011 as developers have responded to increased population growth and tight rental market conditions (Figure 9). During 2015, approximately 1,200 multifamily units were permitted in the HMA, a 31-percent decline compared with the 1,750 multifamily units permitted during the same period in 2014 (preliminary data). Builders scaled back construction recently to see the impact the increase in new inventory will have on vacancy rates and rent growth. Apartment construction was strong from 2001 through 2007, aver - aging 970 units permitted annually because economic and population growth were robust. The onset of the recession and subsequent housing market collapse caused multifamily construction to decline at an average annual rate of 30 percent from 2008 through 2010, to a low of 65 multi-family units permitted. During this time, financing for new construction was particularly difficult to obtain, despite an increased demand for rental units brought on by the foreclosure crisis. This obstacle resulted in a very limited supply of new apartments, which, coupled with increased demand, caused apartment market conditions to tighten; 160 units were permitted in 2011. As lenders became increasingly confident in the economic recovery, financing returned, builders increased apartment construction, and an average of 760 multifamily units were permit-ted annually in 2012 and 2013.
An estimated 1,375 apartments are currently under construction in the Boise HMA, with an additional 350 units expected to begin construction in early 2016; all units are expected
Figure 9. Multifamily Units Permitted in the Boise City HMA, 2000 to Current
Notes: Excludes townhomes. Current includes data through December 2015.Sources: U.S. Census Bureau, Building Permits Survey; estimates by analyst
Housing Market TrendsRental Market Continued
2000
2001
2002
2003
2004
2005
2006
1,800
1,600
1,400
1,200
1,000
800
600
400
200
0
2008
2009
2010
2011
2013
2015
2014
2012
2007
Bo
ise
Cit
y,
ID •
CO
MP
RE
HE
NS
IVE
HO
US
ING
MA
RK
ET
AN
ALY
SIS
11
to be completed during the 3-year forecast period. More than 90 percent of the units under construction are in Ada County. The largest concentra-tion of multifamily construction is occurring in the city of Boise, with an estimated 750 apartments currently under construction, followed by the city of Meridian, with 460 units under construction. Developments that have been completed since 2014 include those located in the downtown area of the city of Boise. The 951, which opened in January 2015 and is currently 95 percent occupied, has 68 units, with rents ranging from $850 to $925 for one-bedroom units to $1,295 to $1,400 for two-bedroom units. Owyhee Flats, which opened in July 2014 and is 96 percent occupied (averaging an average absorption rate of 10 units a month) has one-bedroom units that rent for between $1,025 and $1,275. In the city of Meridian, the 88-unit Red Tail Luxury Apartments, which opened in June 2014 and is 97 percent occupied (averaging an absorption rate
of 18 units a month) Has monthly rents that average $905 for one-bedroom units and $1,060 for two-bedroom/two-bathroom units. The newest apartment complex in the city of Nampa, the 112-unit Aspen Creek Apartments, which opened in October 2014 and is 90 percent occupied, has unit rents of $795 for one-bedroom units, $895 for two-bedroom/two-bathroom units, and $995 for three-bedroom/two-bathroom units.
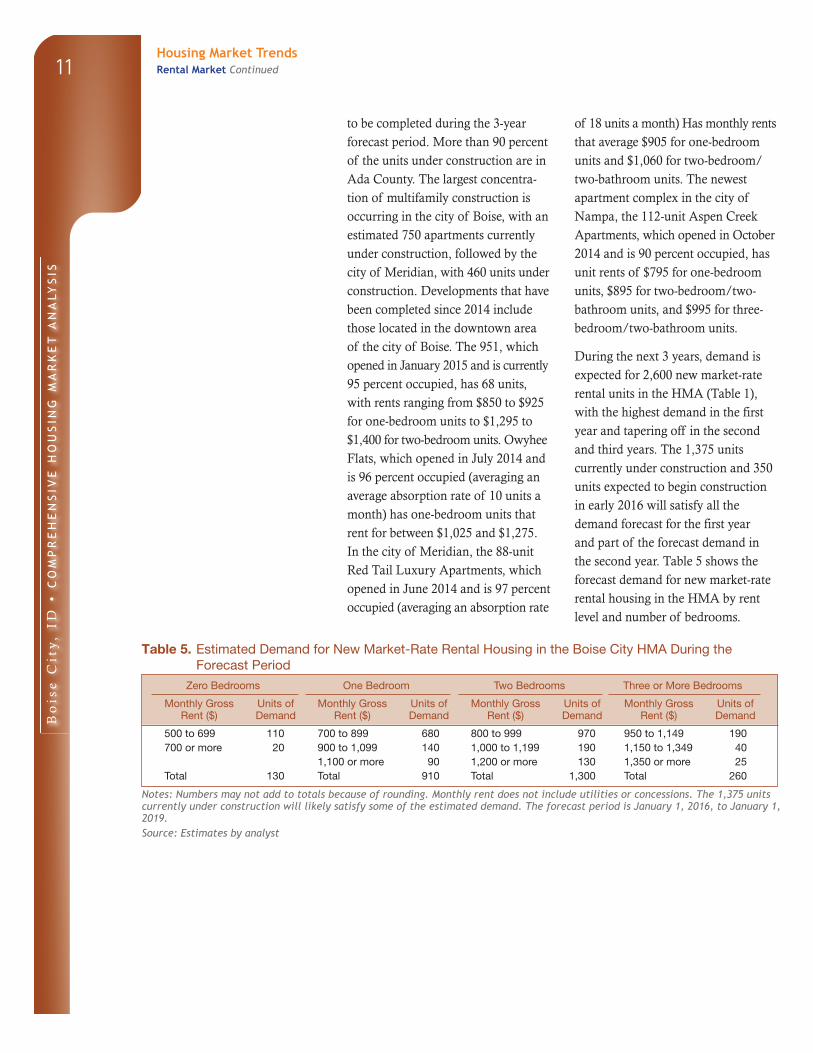
During the next 3 years, demand is expected for 2,600 new market-rate rental units in the HMA (Table 1), with the highest demand in the first year and tapering off in the second and third years. The 1,375 units currently under construction and 350 units expected to begin construction in early 2016 will satisfy all the demand forecast for the first year and part of the forecast demand in the second year. Table 5 shows the forecast demand for new market-rate rental housing in the HMA by rent level and number of bedrooms.
Table 5. Estimated Demand for New Market-Rate Rental Housing in the Boise City HMA During the Forecast Period
Zero Bedrooms One Bedroom Two Bedrooms Three or More Bedrooms
Monthly Gross Rent ($)
Units of Demand
Monthly Gross Rent ($)
Units of Demand
Monthly Gross Rent ($)
Units of Demand
Monthly Gross Rent ($)
Units of Demand
500 to 699 110 700 to 899 680 800 to 999 970 950 to 1,149 190700 or more 20 900 to 1,099 140 1,000 to 1,199 190 1,150 to 1,349 40
1,100 or more 90 1,200 or more 130 1,350 or more 25Total 130 Total 910 Total 1,300 Total 260
Notes: Numbers may not add to totals because of rounding. Monthly rent does not include utilities or concessions. The 1,375 units currently under construction will likely satisfy some of the estimated demand. The forecast period is January 1, 2016, to January 1, 2019.Source: Estimates by analyst
Housing Market TrendsRental Market Continued

Bo
ise
Cit
y,
ID •
CO
MP
RE
HE
NS
IVE
HO
US
ING
MA
RK
ET
AN
ALY
SIS
12Data Profile
Table DP-1. Boise City HMA Data Profile, 2000 to Current
Average Annual Change (%)
2000 2010 Current 2000 to 2010 2010 to Current
Total resident employment 241,499 270,116 308,700 1.1 2.7
Unemployment rate 3.8% 9.2% 3.8%
Nonfarm payroll jobs 229,000 253,600 288,000 1.0 2.6
Total population 464,840 616,561 684,100 2.9 1.8
Total households 170,291 225,594 248,200 2.9 1.7
Owner households 122,323 156,740 168,100 2.5 1.2
Percent owner 71.8% 69.5% 67.7%
Renter households 47,968 68,854 80,100 3.7 2.7
Percent renter 28.2% 30.5% 32.3%
Total housing units 181,170 246,052 264,100 3.1 1.2
Owner vacancy rate 2.1% 3.4% 1.6%
Rental vacancy rate 5.8% 8.2% 4.3%
Median Family Income NA $62,500 $60,000 NA – 1.0
NA = data not available.Notes: Numbers may not add to totals because of rounding. Employment data represent annual averages for 2000, 2010, and the 12 months through December 2015. Median Family Incomes are for 2009 and 2013. The current date is January 1, 2016.Sources: U.S. Census Bureau; U.S. Department of Housing and Urban Development; estimates by analyst

Bo
ise
Cit
y,
ID •
CO
MP
RE
HE
NS
IVE
HO
US
ING
MA
RK
ET
AN
ALY
SIS
13
Data Definitions and Sources
2000: 4/1/2000—U.S. Decennial Census
2010: 4/1/2010—U.S. Decennial Census
Current date: 1/1/2016—Analyst’s estimates
Forecast period: 1/1/2016–1/1/2019—Analyst’s
estimates
The metropolitan statistical area definition in this
report is based on the delineations established by
the Office of Management and Budget (OMB) in
the OMB Bulletin dated February 28, 2013.
Demand: The demand estimates in the analysis
are not a forecast of building activity. They are
the estimates of the total housing production
needed to achieve a balanced market at the end
of the 3-year forecast period given conditions on
the as-of date of the analysis, growth, losses, and
excess vacancies. The estimates do not account
for units currently under construction or units in
the development pipeline.
Other Vacant Units: In the U.S. Department of
Housing and Urban Development’s (HUD’s)
analysis, other vacant units include all vacant
units that are not available for sale or for rent.
The term therefore includes units rented or sold
but not occupied; held for seasonal, recreational,
or occasional use; used by migrant workers; and
the category specified as “other” vacant by the
Census Bureau.
Building Permits: Building permits do not neces-
sarily reflect all residential building activity that
occurs in an HMA. Some units are constructed
or created without a building permit or are issued
a different type of building permit. For example,
some units classified as commercial structures are
not reflected in the residential building permits.
As a result, the analyst, through diligent fieldwork, makes
an estimate of this additional construction activity. Some
of these estimates are included in the discussions of
single-family and multifamily building permits.
For additional data pertaining to the housing market
for this HMA, go to huduser.gov/publications/pdf/
CMARtables_BoiseCityID_16.pdf.
Contact Information
Holi Weaver, Economist
Seattle HUD Regional Office
206–220–5291
This analysis has been prepared for the assistance and
guidance of HUD in its operations. The factual informa-
tion, findings, and conclusions may also be useful to
builders, mortgagees, and others concerned with local
housing market conditions and trends. The analysis
does not purport to make determinations regarding the
acceptability of any mortgage insurance proposals that
may be under consideration by the Department.
The factual framework for this analysis follows the
guidelines and methods developed by HUD’s Economic
and Market Analysis Division. The analysis and findings
are as thorough and current as possible based on informa -
tion available on the as-of date from local and national
sources. As such, findings or conclusions may be modi-
fied by subsequent developments. HUD expresses its
appreciation to those industry sources and state and local
government officials who provided data and information
on local economic and housing market conditions.
For additional reports on other market areas, please go to huduser.gov/portal/ushmc/chma_archive.html.