comprehensive guide how to avoid abuse, misuse and … · 2017-04-25 · comprehensive guide how to...
TRANSCRIPT

Comprehensive Guide
How to avoid abuse, misuse and fraud in your T&E and P-Card programs
Controlling costs and reducing abuse of travel and entertainment (T&E) expenses is a concern for companies of all sizes. From air travel to meals and ride-sharing services, continuously monitoring these expenses is difficult, especially for companies that rely on spreadsheets, emails and paper receipts.
Though companies that use corporate cards (P-Cards) and expense management systems have an advantage, there are still significant inherent risks that needs to be managed.
This eBook examines emerging risks in procurement processes and how analytics can be used to mitigate them.
Introduction

Many companies opt for solutions like Concur to electronically manage their expenses. While these solutions provide spend reports, reduce document storage costs and decrease the approval and reimbursement cycle, most are not designed to provide the analytics necessary to detect misuse, abuse and fraud.
Fraud schemes can be complex and a mix of prescriptive and behavioral analytics is required to actively detect and manage exposure.
Actively Monitoring T&E Expense Risks

16.7%of organizations with less than 100
employees experience expense reimbursement fraud
Source: 2016 ACFE Report to the Nations on Occupational Fraud and Abuse
13.9%of organizations with more than
100 employees experience expense reimbursement fraud

Source: 2016 ACFE Report to the Nations on Occupational Fraud and Abuse
5%Typical yearly organizational
losses due to fraud
24 monthsto detect expense fraud

Rising volumes of T&E transactions plus the increasing push to be more productive while also maintaining compliance (i.e., anti-bribery legislation), are forcing companies to leverage technology and analytics to automate the management of T&E expenses.
Before implementing a technology solution to monitor T&E expenses, there are three things that every organization must do…
Fighting Fraud at a Corporate Level

1. Put the company T&E expense policy in writing
2. Train everyone, including new-hires and executives, on the policies
3. Commit to enforcing all T&E policies—even with the executives
Once a corporate policy on T&E expenses has been developed and communicated, the next step is to leverage technology to monitor the risks and controls.
3 Policy Must-Haves For Every T&E Program

Source: CFO Innovation
Data analytics techniques are well-suited to detecting fraud. Emerging technologies in this area can allow a forensic accountant to quickly
and effectively sieve through large volumes of transactions to identify anomalies in data which can often be indicative of fraudulent activity.

1. Personal expenses represented as business expenses
2. Modifying receipts
3. Reimbursement for cancelled trips and events
4. Purchasing items and then getting a refund without reimbursing the company
5. Overstating mileage claims
6. Claiming non-acceptable items like electronics and jewelry
7. Multiple reimbursements for same expense either by multiple employees colluding with one another or through different proofs of payment
7 Fraud Schemes For T&E Expenses
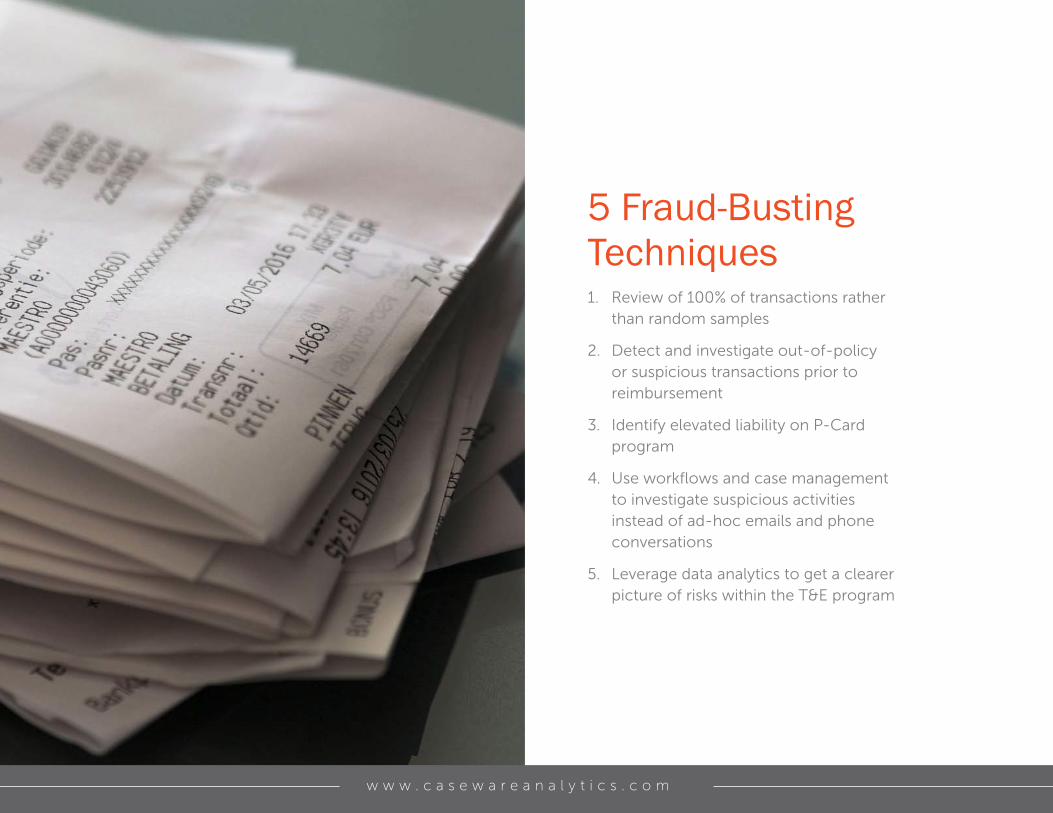
1. Review of 100% of transactions rather than random samples
2. Detect and investigate out-of-policy or suspicious transactions prior to reimbursement
3. Identify elevated liability on P-Card program
4. Use workflows and case management to investigate suspicious activities instead of ad-hoc emails and phone conversations
5. Leverage data analytics to get a clearer picture of risks within the T&E program
5 Fraud-Busting Techniques

To effectively monitor and manage T&E expenses, it is vital that a chosen monitoring solution contains:
1. Automated transaction monitoring
2. Cross-departmental and cardholder analysis capabilities
3. Both prescriptive and behavioral analytics models
4. Workflow and case management capabilities
5. Data visualizations
Framework for Effective Monitoring

Data is the sensory information produced by a business that has its eyes and ears on operations and customers. Analytics is the brain that processes the information and provides insight, which ideally leads a company to take
meaningful action.
Source: CFO.com

Continually looks at every transaction to ensure that business or expense rules have not been violated. If a deviation or violation is detected, the system automatically flags the transaction for investigation and resolution.
This functionality ensures that travel, entertainment and expense policies are not violated, and flags any transactions that may affect the company’s reputation, such as violations of the Foreign Corrupt Practices Act (FCPA) or business dealings with politically exposed persons (PEPs).
Automated Transaction Monitoring
Examines data from other systems to maximize insights and ensure that transactions are analyzed holistically rather than from a purely policy perspective.
For example, if an employee completed a business trip with hotel accommodations costing $1,750 last week, the transaction by itself would appear to comply with company policies. However, if HR data is also looked at and reveals that the employee was on leave that day, the transaction should be flagged for further investigation.
Cross-Departmental & Cardholder Analysis

Suppose an employee charged $970.54 on their P-Card on April 11th for a hotel stay.By itself this transaction may not violate any company policies. However, if looking at the accounting data it was revealed that the employee had also submitted an expense report with a $970.54 charge for the same hotel on the same days, with T&E monitoring this transaction would automatically be flagged for further investigation.

When implementing an analytics model for monitoring procurement expenses, it is important to include these two key elements for your models:
1. Prescriptive analytics using rules-based scenarios
2. Behavioral analytics, which includes anomaly detection, predictive analytics and text analytics
Prescriptive and Behavioral Analytics

Rules-based analytics are easy to implement and understand. They are also very effective at detecting specific suspicious and fraudulent scenarios.
Where rules-based analytics fail is in the fact that abusers can find loopholes, and in that it also lags in detecting new forms of fraud. This is why rules-based analytics should be partnered with behavioral analytics like anomaly detection, predictive analytics and text analytics.
Rules-Based Scenarios

An anomaly detection model involves segmenting the population to determine peers. Transactions are then assessed to provide an outlier score that will determine if it is worthwhile investigating as an anomaly. The advantage of this detection method is that no rules need to be implemented—the system learns from history and segmentation based on the data.
Anomaly Detection
Group outliers and
anomalies that need
to be investigated
For example, if someone from the marketing department purchases a computer, the purchase may be flagged--not
because there is a rule in place that only IT should buy computers, but because this is an unusual purchase for the
marketing department. The IT department, not marketing, makes almost all computer-related purchases for the company.

Predictive analytics help determine future behavior. They can also be used to identify potential threats and establish patterns.
The model looks at past contextualized data and variables known to have been involved in past fraud events to determine whether new events are likely to result in a fraud.
This allows for earlier detection and prevention of fraudulent behavior.
Predictive Analytics
Information buried in unstructured data such as expense descriptions and manager’s review/approval notes can be a valuable resource to determine potential fraud.
This form of analysis searches through free-form text in documents and other data sources to explore relationships between terms and weights them by the terminology, frequency and even tone.
Combined with an organization’s terminology and fraud dictionary, the system can then score terms and highlight any potential suspicious activities.
Text Analytics

Text analytics will look at several variables to determine the fraud score. Examples of variables include keywords that represent opportunity (override, write-off and recognize revenue), pressure/incentive (meet deadline, sales quota) and rationalization (sounds reasonable, I deserve). When combined and put in context, they can be used to provide a likelihood of fraud.

Analytics for Airfare and Vehicle Expenses
Analytics for Airfare Claims
Analytics for Car and Gas Mileage Claims
Airfare purchases that do not comply with policies (seat class, airline, etc.)
Late bookings
Refund of ticket issued to employee but balance not refunded to company
Travel to multiple cities on the same day
Claims for personal car usage and rental car usage for same period
Inflated mileage claims for personal car use
Claims for personal use during weekends and/or holidays
Multiple mileage claims for employees that travel together
Unusual tips, tools and/or parking expenses
Rental of vehicles from non-preferred vendors
Duplicate mileage submissions
Airfare claims without associated hotel and meal charges

Analytics for Lodging and Meals
Analytics for Lodging and Meals Claims
Multiple employees requesting reimbursement for the same room
Lodging expenses that are outside the norm or don’t comply with policy
Expenses for lodging that exceed the average for location
Lodging claims for days when employee was on vacation
Duplicate claims for meals (i.e., multiple people for same day and location)

Analytics for Policy ComplianceAnalytics for Out-of-Policy or Other Suspicious Claims
Policy Violations
Purchases made on weekends and holidays
Expenses incurred while employee was on vacation
Expenses for events that did not materialize
Transactions authorized by requester
Employees who consistently claim amounts just below approval thresholds
Transactions not reviewed prior to approval (auto-approval)
Potential split transactions across single/multiple cards to avoid card limits
Transactions with missing receipts
Claims made by former employees
Credits not reported on an expense report but corresponding debits reimbursed to employee
Duplicate claims across T&E and P-Cards
Same claim across multiple employees’ expense reports

Analytics for Spend ProfilingEmployee, Vendor and Expense Spend Profiling
Increase in the cardholder’s average spend or highest spend amount
Elevated liability on card program
Unusually large T&E claims compared to employees in similar role
Vendors with higher activity than others in same MCC
Vendors with high amounts and frequency to determine top vendors
Vendor/Employee/Supplier check to ensure not on OFAC terrorist watch list
Average expense transaction sizes by business unit/division/department
Search for keywords in expense submissions to identify invalid claims

Analytics for Purchase CardsAnalytics for Card Management
Suspicious Activities and Claims
Cardholder using unauthorized card
Cardholders with zero activity within a specific time period
Transactions made by terminated/on leave/retired employees
Elevated liability – card usage vs. credit limit
Duplicate payments through Accounts Payable and/or T&E
Duplicate transactions (same merchant, same amount, same day)
Multiple cards with same transactions (i.e., same merchant & amount)
Split transactions over single and multiple cards
Transactions outside of business hours, during holidays or vacation
Managers approving own transactions or outside of their cost center
Keyword search of non-compliant purchases such as jewelry, tobacco
Excessive small dollar transactions
Time spent by managers to approve transactions

More Analytics for Purchase Cards
Program Performance
Policy Management
Card limit exceeded (i.e., single transaction, monthly, daily dollar)
Spending patterns of employees to identify outliers
Personal purchases that have not been repaid
Cardholders that did not receive tax exemptions with specified vendors
Even dollar net amounts that may indicate cash advances
Purchases from “not allowed” or “not recommended” MCCs
Potential high-risk personal purchases
Purchases from merchants on a black list
Ghost cards being used outside of expected category
Transactions without sufficient explanation attached
Appropriate transaction approval from manager
Excessive single vendor usage
Cardholder charging incorrect cost center
Excessive year-end budget usage
Compare employee spend to internal spending patterns

Once a transaction has been flagged, it is important that it be investigated quickly and methodically. Tracking the resolution of issues via phone, email and in-person conversations can delay or prevent the investigation of anomalies to resolution. This method also impedes the ability to create a proper audit trail.
Workflows and case management provide the framework for automated and complete remediation. In some solutions alerts can be delivered via email, text message or an on-screen pop-up and provide:
• Links to related issues that may help the user make decisions
• The entire history and nature of the issue, including who performed what actions when
• Remediation guidelines on how to approach the issue
• Indicators that will inform processes improvements, including possible root causes and the actions performed
Configurable workflows ensure that processes that meet the company’s culture and policies are implemented.
Workflow and Case Management Capabilities

Some view data visualizations as the most exciting part of a solution because they make it easier to detect control weaknesses and help answer questions such as:
1. Where are the risks?
2. What controls are failing?
3. What are the root causes?
4. What needs to change in the business to get better results?
5. Are we compliant with internal and/or regulatory requirements?
6. How can we get business value from effective controls?
Data visualizations are also an effective tool to analyze and communicate with management on how much is being spent by category, vendor, department and employee. They provide a straightforward way to determine where savings can be found or which pricing agreements should be renegotiated with vendors.
Data Visualizations

80%of finance executives polled said that on a
scale of 1 to 5 (with 5 being ‘very important’), identifying spend falling outside of their T&E
program ranked 4 or 5.Source: Business Travel News

Whether you want to more easily track and manage T&E expenses, monitor travel policy compliance or minimize P-Card misuse, CaseWare Analytics is the right choice. Our enterprise solutions provide organizations with immediate identification of non-compliant expenses before they are approved for reimbursement. Key components of the solution include automated notifications and workflows that track all deficiencies as they occur and provide the assurance that they are being addressed in a timely manner.
CaseWare Analytics also takes a consulting approach to implementing our solutions, allowing organizations to get a solution that works for them and to grow their risk-management and fraud detection initiatives.
To learn more about what CaseWare Analytics can do for you, visit CaseWareAnalytics.com.
Need to Stop Abuse in Your T&E and P-Card Programs?
To learn more visit casewareanalytics.com.
April 2017
