comprehensive food security and vulnerability...
TRANSCRIPT
Comprehensive Food Security
and Vulnerability
Analysis
and
Nutrition Survey
RWANDA
December 2012
(Data collected in
March – April 2012)

Comprehensive Food Security
and Vulnerability
Analysis
and
Nutrition Survey
RWANDA
December 2012
(Data collected in
March – April 2012)
MINAGRI NISR


Rwanda: Comprehensive Food Security and Vulnerability Analysis and Nutrition Survey 2012 (Data collected in March-April 2012) Prepared by Laura de Franchis of WFP. Reviewed by Dominique Habimana of NISR; Jean Baptiste Habyarimana of MINAGRI; Jan Delbaere, Ibrahima Diop,
Amit Wadhwa, Sergio Regi, Kathryn Ogden, Oscar Caccavale, Dong-eun Kim and Laetitia Gahimbaza of WFP; Eugene Kanyandekwe of SDC; Dan Chizelema and Nadia Musaninkindi of FEWS NET; Elizabeth Uwanyiligira of World Vision. Edited by Katy Williams (WFP consultant).
Survey design, data processing, analysis and mapping done by the WFP Rwanda VAM team: Laura de Franchis, Jean Paul Dushimumuremyi, Jules Rugwiro with technical support from Jan Delbaere (WFP Rwanda Deputy Country Director), Cinzia Papavero (WFP consultant), Rogerio Bonifacio and George Mu'Ammar (WFP spatial analysts). Secondary data analysis by Janno van der Laan (WFP market analysis consultant) and Claire Mazin (WFP food security analysis consultant).
Financial support for this study was provided by the Swiss Agency for Development and Cooperation (SDC), the
One UN, the Bill and Melinda Gates Foundation (BMGF) through WFP, the Canadian International Development Agency (CIDA), and World Vision Rwanda (WVR). The Famine Early Warning Systems Network (FEWS NET) and the Ministry of Agriculture and Animal Resources (MINAGRI) contributed in kind to the supervision and teams’ transportation. The views expressed herein can in no way be taken to reflect the official opinion of the donors. Other people and organisations who contributed technically to this CFSVA and Nutrition Survey 2012 include: Dassan Hategekimana of FAO, Rachel Sabates Wheeler of UNICEF, Valens Mwumvaneza of WB, Tarik Kubach and
Diego Zurdo of EU, Jean-Marie Byakweli and Samantha Yates of DFID, Rossella Bottone, Matthieu Tockert, Susana Moreno, Jeannette Kayirangwa and Diego Rose of WFP. December 2012 © World Food Programme, VAM Food Security Analysis Cover Photo: © Jan Delbaere of WFP
The 2012 Rwanda CFSVA & Nutrition Survey Report is available at http://www.wfp.org/food-security, www.statistics.gov.rw
United Nations World Food Programme Headquarters: Via C.G. Viola 68, Parco dei Medici, 00148, Rome, Italy. For information about the Food Security Analysis/VAM, contact [email protected]
For questions or comments concerning any aspect of the survey and this report please contact: National Institute of Statistics of Rwanda Yusuf Murangwa [email protected] Dominique Habimana [email protected] Juvenal Ntambara [email protected]
Ministry of Agriculture and Animal resources Raphael Rurangwa [email protected] Jean-Marie Vianney Nyabyenda [email protected] Jean-Baptiste Habyarimana [email protected]
World Food Programme Rwanda Abdoulaye Balde [email protected] Jan Delbaere [email protected] Laura de Franchis [email protected] World Food Programme Rome (Head quarters) OMXF Service Joyce Luma [email protected]
Amit Wadhwa [email protected]
P a g e | i
TABLE OF CONTENTS
List of Figures, Tables, Boxes and Maps ........................................................................... ii Acronyms and Abbreviations ............................................................................................ v Foreword ...................................................................................................................... viii Acknowledgements .......................................................................................................... x Key findings ..................................................................................................................... 2 1 Introduction ............................................................................................................ 4
1.1 Rwanda’s impressive accomplishements .................................................................. 4 1.2 Poverty and inequality persist ................................................................................ 4 1.3 Outlook and reasons for this assessment................................................................. 5
2 Study objectives and methodology .......................................................................... 6 2.1 Key objectives of the assessment ........................................................................... 6 2.2 Conceptual framework and definitions..................................................................... 6 2.3 Methodology ........................................................................................................ 7 2.4 Study limitations .................................................................................................. 9
3 The state of food security and nutrition in Rwanda in 2012 ................................... 11 3.1 Increasing food availability .................................................................................. 11 3.2 Markets are generally efficient and fair ................................................................. 18 3.3 Half of households have difficulty accessing food .................................................... 29 3.4 Almost four in five households had acceptable food consumption in March/April 2012 . 30 3.5 Acceptable levels of acute malnutrition but still alarmingly high rates of chronic
malnutrition for children under five ............................................................................. 37 3.6 Women’s nutritional status .................................................................................. 38
4 Understanding the issues behind poor food consumption and chronic malnutrition
in Rwanda ...................................................................................................................... 40 4.1 What are the individual factors that determine child stunting? ................................. 42 4.2 What households are food insecure or have stunted children? .................................. 46 4.3 Where do the food insecure households and the malnourished children live? ............. 62
5 How shocks impact food security .......................................................................... 78 5.1 Risk and vulnerability approach ............................................................................ 78 5.2 Main shocks ....................................................................................................... 79 5.3 Resilience and capacity to cope with shocks ........................................................... 82 5.4 Rainfall deficit and erratic rainfall ......................................................................... 85 5.5 Floods ............................................................................................................... 88 5.6 Increases in staple food prices ............................................................................. 89
6 What is being done? key tools and mechanisms in place to address poverty,
malnutrition and food insecurity in Rwanda ................................................................... 92 6.1 Assistance received ............................................................................................ 92 6.2 Government led social protection ......................................................................... 96 6.3 Livelihoods, agriculture and livestock support ........................................................ 99 6.4 Education support ............................................................................................ 101 6.5 Multisectoral strategy to eliminate malnutrition .................................................... 101 6.6 Health ............................................................................................................ 101 6.7 Food assistance ............................................................................................... 102
7 The way forward to tackle food insecurity and malnutrition ................................ 103 7.1 Conclusion ...................................................................................................... 103 7.2 Recommendations ............................................................................................ 105
Annexes (included in the CD-ROM) .............................................................................. 108
P a g e | ii
LIST OF FIGURES, TABLES, BOXES AND MAPS
FIGURES
Figure 1: CFSVA and Nutrition Survey conceptual framework ................................................... 7 Figure 2: Regional maize prices between August 2007 - August 2011 (USD/t) .......................... 12 Figure 3: Production (in tons) of main staple crops (2007-2011) ............................................. 13 Figure 4: Animals owned by households in 2012 - headcount ................................................. 16 Figure 5: Household level food stocks .................................................................................. 19 Figure 6: Maize value chain ................................................................................................ 20 Figure 7: Nominal and real price trends of maize, beans, Irish and sweet potatoes (2006-2011) . 21 Figure 8: Differences in real and nominal prices of main food commodities between 2009 and 2012
...................................................................................................................................... 22 Figure 9: Average 6 year monthly prices for selected commodities (2006-2011) ....................... 23 Figure 10: Grand seasonal index for maize, potatoes and beans ............................................. 23 Figure 11: Average bean prices in different provinces (2006-2011) ......................................... 24 Figure 12: Nominal prices and centred moving average trends (in RWF/kg, 2006-2011) ............ 25 Figure 13: Co-variations of maize nominal prices in provinces of Kigali (grey), northern (red) and
eastern provinces (green) (prices in RWF) ............................................................................ 27 Figure 14: Correlation of monthly maize prices between provincial markets (2006-2011) ........... 28 Figure 15: Food access groups, coping strategy index and coping strategy index terciles ........... 30 Figure 16: Average number of days coping strategies were used by households in the seven days
preceding their interview, by type of food access problem reported ......................................... 30 Figure 17: Number of days in a week different food groups are consumed, by household food
consumption group ........................................................................................................... 31 Figure 18: Percentage of households in each food consumption group in 2009 and 2012 (CI: 95%)
...................................................................................................................................... 36 Figure 19: Rates of child stunting by mother’s nutritional status ............................................. 42 Figure 20: Rates of stunting by level of mother’s education .................................................... 42 Figure 21: Prevalence of underweight, wasting and stunting for children aged 6-59 months, by sex
and by age groups (CI: 95%) ............................................................................................. 43 Figure 22: Effect of consumption of various foods on stunting of children aged 12-23 months .... 45 Figure 23: Household reported ubudehe categories ............................................................... 47 Figure 24: Estimated rates of stunting for each (reported) ubudehe category (CI: 95%) ............ 47 Figure 25: Percentage of households in each food consumption group, by (reported) ubudehe
category .......................................................................................................................... 48 Figure 26: Percentage of households owning each asset, by wealth quintile ............................. 49 Figure 27: Percentage of households reporting seasonal, acute and chronic difficulties in accessing
food, by wealth quintile ..................................................................................................... 49 Figure 28: Unacceptable food consumption by number of household livelihood activities ............ 51 Figure 29: Percentage of Rwandan households in each livelihood group ................................... 51 Figure 30: Average share of households with poor and borderline food consumption, by livelihood
group .............................................................................................................................. 55 Figure 31: Food access issues and livelihoods ....................................................................... 55 Figure 32: Percentage of households farming land in season A 2012, by land size ..................... 56 Figure 33: Average FCS by land cultivation in season A 2012 and share of households with
unacceptable food consumption, by land size ....................................................................... 56 Figure 34: FCS by number of livestock owned and number of crops cultivated .......................... 57 Figure 35: Food consumption groups and cultivation of a household vegetable garden............... 57 Figure 36: Households reporting difficulty in having enough food in the last 12 months, by food
consumption group ........................................................................................................... 58 Figure 37: Percentage of households with poor and borderline food consumption, by level of
education of head of household .......................................................................................... 59

P a g e | iii
Figure 38: The urban rural divide: food consumption (CI: 95%) ............................................. 62 Figure 39: The urban rural divide: child nutrition (CI: 95%) ................................................... 63 Figure 40: The urban rural divide: nutrition of women in reproductive age (CI: 95%) ................ 63 Figure 41: Household levels of food consumption in Rwanda in March/April 2012 (CI: 95%) ...... 73 Figure 42: Percentage of households reporting seasonal, acute and chronic difficulties in accessing
food, by province .............................................................................................................. 73 Figure 43: Rates of malnutrition for children aged between 6-59 months, by province (CI 95%) . 74 Figure 44: Percentage of poor households (according to EICV 3) and percentage of households in
the two poorest wealth quintiles (according to CFSVA and Nutrition Survey 2012) per district. ... 77 Figure 45: Share of households reporting shocks in the 12 months preceding the interview, by
reported food access problems and wealth quintiles .............................................................. 80 Figure 46: Percentage of households adopting ‘increased casual labour’ and ‘spend savings’ as
coping strategy, by wealth quintile ...................................................................................... 83 Figure 47: Number of days in the week during which coping strategies are used by households in
each wealth quintile .......................................................................................................... 83 Figure 48: Average CSI and use of coping strategies in households with and without stunted
children (only considering households with children under 5 (CU5)) ........................................ 84 Figure 49: Average CSI and use of coping strategies in households by food consumption group .. 84 Figure 50: Share of households not having recovered from shock by wealth quintile ................. 84 Figure 51: Share of households in Rwanda reporting having received different types of assistance
...................................................................................................................................... 92 Figure 52: Sources of assistance mentioned by households .................................................... 93 Figure 53: Percentage of households receiving assistance, by reported ubudehe categories and
household food consumption groups .................................................................................... 96 Figure 54: Household livestock ownership and expenditures, by self-reported ubudehe category 97 Figure 55: Household food consumption group and wealth quintile, by self-reported ubudehe
category .......................................................................................................................... 97 Figure 56: Households reporting VUP assistance, by self-reported ubudehe category ................. 99 Figure 57: Percentage of households reporting financial assistance, by type of VUP sector ......... 99 Figure 58: Household agricultural and livestock assistance, by province .................................. 100
TABLES
Table 1: Selected social and economic indicators .................................................................... 5 Table 2: Main crops grown in Rwanda and percentage sold to market ...................................... 14 Table 3: Production of food crops and animal products per province in 2011 ............................ 17 Table 4: Consumption patterns in 2010-2011 ....................................................................... 18 Table 5: Description of food consumption groups .................................................................. 31 Table 6: FCS in countries neighbouring Rwanda .................................................................... 32 Table 7: Prevalence of malnutrition among children under five years ....................................... 38 Table 8: Effect of variables found to be statistically significant to explain household food
consumption and child stunting........................................................................................... 41 Table 9: Percentage of 12 - 23 month olds consuming certain food items the day before the survey
...................................................................................................................................... 45 Table 10: Description of ubudehe categories ........................................................................ 46 Table 11: Description of livelihood groups ............................................................................ 53 Table 12: Per capita household expenditures and share of food expenditures, by livelihood group 54 Table 13: Literacy and level of education of household head ................................................... 59 Table 14: Time (in minutes) to access the nearest facilities out of the village, by households ..... 64 Table 15: Agriculture suitability based on slopes ................................................................... 65 Table 16: Understanding food insecurity by livelihood zone .................................................... 69 Table 17: Understanding malnutrition by livelihood zone ........................................................ 71 Table 18: Estimated percentage and number of households by food consumption group in Rwanda,
by province and by district ................................................................................................. 76 Table 19: Community and household level shocks ................................................................. 79

P a g e | iv
Table 20: Percentage of households reporting main shock in 12 months preceding the interview
(100% is the total households reporting any type of shock) ................................................... 81 Table 21: Negative effects of identified hazards on food security ............................................. 82 Table 22: Cut-offs for level of exposure to rainfall deficit ........................................................ 86 Table 23: Risk for food security from medium rainfall deficit in season A .................................. 87 Table 24: Types of assistance received and sources .............................................................. 93 Table 25: Enrolment rates ................................................................................................. 101
BOXES
Box 1: Key questions of the assessment ................................................................................ 6 Box 2: Main cropping seasons in Rwanda ............................................................................. 15 Box 3: Seasonal household food stocks................................................................................ 19 Box 4: Comparing levels of food consumption with neighbouring countries ............................... 32 Box 5: Likely, but not confirmed, improvements in household food consumption since 2009 ...... 35 Box 6: Cut off values used for the calculations of women malnutrition (*not valid for pregnant
women). .......................................................................................................................... 38 Box 7: Summary - The state of food security and nutrition in Rwanda in 2012 .......................... 39 Box 8: Confounding factors included in the analysis .............................................................. 44 Box 9: Summary - Immediate causes of high levels of stunting in Rwanda ............................... 46 Box 10: Reminder of poverty trends in Rwanda .................................................................... 50 Box 11: EICV 3 Livelihood groups ....................................................................................... 52 Box 12: Households with food access problems, especially chronic are those with worst food
consumption .................................................................................................................... 58 Box 13: Summary - Who are the food insecure and the malnourished? .................................... 61 Box 14: Summary - Where do the food insecure and the malnourished live? ............................ 75 Box 15: Comparing the district distribution of poor households (according to EICV 3) and
percentage of households in the two poorest wealth quintiles (according to CFSVA and Nutrition
Survey 2012) ................................................................................................................... 77 Box 16: Definitions useful for food security risk analysis ........................................................ 78 Box 17: Summary - Shocks to food security ......................................................................... 91 Box 18: The importance of friends and relatives ................................................................... 94 Box 19: Summary - What is being done in Rwanda to address food insecurity and malnutrition?102
MAPS Map 1: CFSVA and Nutrition Survey 2012 sample and demographic characteristics by district .... 10 Map 2: Crop presence for maize, beans, Irish potatoes and sweet potatoes .............................. 15 Map 3: Crop presence for bananas, banana wine, cassava and sorghum .................................. 16 Map 4: Percentage of households consuming eggs, milk, meat and fish at least once per week... 33 Map 5: Percentage of households consuming cooking banana, bread, cassava, maize, pulses and
sweet potatoes at least four times per week ......................................................................... 34 Map 6: Proportion of households whose head did not receive any formal education ................... 60 Map 7: Road accessibility in Rwanda ................................................................................... 64 Map 8: Potential soil erosion and soil fertility ........................................................................ 66 Map 9: FEWS NET livelihood zones ...................................................................................... 67 Map 10: Distribution of households with unacceptable food consumption (poor and borderline) .. 68 Map 11: Distribution of stunting .......................................................................................... 70 Map 12: Distribution of unacceptable food consumption and stunting ...................................... 72 Map 13: Distribution of households in the poorest two wealth quintiles .................................... 75 Map 14: Risk-of and vulnerability-to rainfall deficit for maize growing in season A ..................... 86 Map 15: Distribution of marshlands in Rwanda ..................................................................... 88 Map 16: Percentage of households in each district relying on markets as main source of beans, in
April and in November ....................................................................................................... 90 Map 17: Distribution of households reporting having received some type of assistance .............. 95

P a g e | v
ACRONYMS AND ABBREVIATIONS
ADDAWIN Analisi dei Dati – Windows version (Data analysis software) ARV Africa Risk View BMI Body Mass Index BMGF Bill and Melinda Gates Foundation Cap Capita
CFSVA Comprehensive Food Security and Vulnerability Analysis CGIS-NUR Center Of Geographic Information Systems of the National University of Rwanda CI Confidence Interval CIDA Canadian International Development Agency CIP Crop intensification Programme
COMESA Common Market for Eastern and Southern Africa
CPI Consumer Price Index CSI Coping Strategy Index CU5 Children under 5 years old DFID United Kingdom Department for International Development DHS Demographic Health Survey DPEM District Plans to Eliminate Malnutrition DRC Democratic Republic of Congo
EAC East African Community EDPRS Economic Development and Poverty Reduction Strategy EFSA Emergency Food Security Assessment EICV 3 The third Integrated Household Living Conditions Survey ENA Emergency Nutrition Assessment EU European Union FAO United Nations Food and Agriculture Organisation
FARG Genocide Survivors Support and Assistance Fund FCG Food Consumption Group FCS Food Consumption Score FEWS NET Famine Early Warning Systems Network FNSMS Food and Nutrition Security Monitoring System FS Food Security GDP Gross Domestic Product
GLM General Linear Model GSI Grand Seasonal Index H Hour ha Hectare HAZ Height for age z-score (stunting) HH Household
HQ Headquarters IYCF Infant and Young Child Feeding
JAP Joint Action Plan Kcal Kilocalorie Km Kilometer Km2 Square kilometer Logit logistic regression
Min Minute MINAGRI Ministry of Agriculture and Animal Ressources MINALOC Ministry of Local Government MIDIMAR Ministry of Disaster Management and Refugee Affairs MINECOFIN Ministry of Finance and Economic Planning MINEDUC Ministry of Education MIGEPROF Ministry of Gender and Family Promotion
MINISANTE Ministry of Health mm millimeter t ton
MUAC Mid-Upper Arm Circumference NBR National Bank of Rwanda

P a g e | vi
NGO Non-Governmental Organization
NISR National Institute of Statistics of Rwanda NSR National Strategic Reserve PCA Principal Component Analysis
PDA Personal Digital Assistant PRRO Protracted Relief and Recovery Operation RAB Rwanda Agriculture Board RDRC Rwanda Demobilization and Reintegration Commission REMA Rwanda Environment Management Authority RRA Rwanda Revenue Authority RWF Rwandan Franc
SD Standard Deviation SDC Swiss Agency for Development and Cooperation SPSS Statistical Package for Social Sciences SSA Sub Saharan Africa TC Technical Committee
TLU Tropical Livestock Unit
UN United Nations UNDP United Nations Development Programme UNICEF United Nations Children’s Fund UNISDR United Nations Office for Disaster Risk Reduction USAID United States Agency for International Development USD United States dollar VAM Vulnerability Analysis and Mapping (WFP)
VUP Vision 2020 Umurenge Program WAZ Weight for age z-score (underweight)
WB World Bank WFP United Nations World Food Programme WHO United Nations World Health Organization WHZ Weight for height z-score (wasting) WI Wealth Index
WRSI Water Requirement Satisfaction Index
yr Year z-score Standard score, normal score Currency Equivalents Currency Unit Rwandan Franc RWF 1 USD 605 RWF (Exchange rate as of March 2012)1
1 Source: UN treasury website.

P a g e | vii

P a g e | viii
FOREWORD
The objective of this Comprehensive Food Security and Vulnerability Analysis & Nutrition Survey
2012 (CFSVA and Nutrition Survey 2012) is to measure the extent and depth of food and nutrition
insecurity in Rwanda, analyze trends over time, and integrate the findings with those from the
recent ‘Third Integrated Household Living Conditions Survey’ (EICV 3) and ‘Rwanda Demographic
Health Survey 2010’ (DHS 2010). The key questions of the report are:
Who are the people currently facing food insecurity and malnutrition?
How many are they?
Where do they live?
Why are they food insecure and/or malnourished?
How can food assistance and other interventions make a difference in reducing food
insecurity, malnutrition and supporting livelihoods?
It is the third time that this type of survey has been conducted in Rwanda. The previous ones took
place in 2006 and 2009 under the overall lead of the National Institute of Statistics of Rwanda. The
results of this CFSVA and Nutrition survey confirm the findings of the EICV 3 and DHS 2010,
namely that since 2006 Rwanda has taken great strides in terms of reducing poverty and
malnutrition. However, it also confirms that food access, food consumption and chronic
malnutrition are issues that still need to be tackled and that they go hand in hand with poverty.

P a g e | ix

P a g e | x
ACKNOWLEDGEMENTS
This Comprehensive Food Security and Vulnerability Analysis & Nutrition Survey 2012 (CFSVA and
Nutrition Survey 2012) is a joint initiative between the Rwandan National Institute of Statistics
(NISR) and the Ministry of Agriculture and Animal Resources (MINAGRI).
It was possible, thanks to funding from the Swiss Agency for Development and Cooperation (SDC),
One UN, World Food Programme (WFP - via the Bill and Melinda Gates Foundation), Canadian
International Development Agency (CIDA), and World Vision Rwanda (WVR). Famine Early
Warning Systems Network (FEWS NET) and the MINAGRI contributed in kind to the supervision
and team’s transportation. It was coordinated by the CFSVA and Nutrition Survey technical
committee composed of, and chaired by, the NISR and MINAGRI in partnership with the Ministry of
Local Government (MINALOC), Ministry of Disaster Management and Refugee Affairs (MIDIMAR),
Ministry of Health (MINISANTE) and Ministry for Gender and Family promotion (MIGEPROF).
We would, hereby, like to acknowledge the hard work of the data collectors and generosity of the
7500 women and men household heads who devoted their time and sat down with enumerators to
answer all the survey questions.
Our profound gratitude is extended to the WFP team who coordinated the survey and
questionnaire design, field work, data processing analysis and report writing. Lastly, we appreciate
the contribution of the CFSVA and Nutrition Survey 2012 Technical Committee which participated
in and validated each step of the survey, and who proofread and approved the report at the final
stage of its production.

P a g e | 1
P a g e | 2
KEY FINDINGS
This report analyses the state of food security in Rwanda through the three distinct, but
interrelated, dimensions of food availability, food access and food utilization. It also describes the
nutritional status of children under five years old and discusses the underlying causes of, and
threats to, food and nutrition security in the country, as well as the existing mechanisms in place
to solve them. Finally, it formulates recommendations on the way forward to tackle these issues in
Rwanda.
Food production is increasing, markets are functioning relatively well and food is flowing easily
within and outside the country, thanks to the well-connected road network and market
infrastructure.
Still, more than half (51%) of all households report some type of difficulty in accessing food in the
year preceding the survey: one fifth of all households report seasonal food access problems,
usually from March to May and September to November (in the run up to the season A and B
harvests, when food prices are higher and opportunities for casual employment lower); 17% of
households experienced unusual ‘acute difficulties’ in accessing food at some point in the year
preceding the survey; and 14% of Rwandan households have usual and almost year round ‘chronic
difficulties’ in accessing food for their families.
In March/April 2012, almost four in five (79%) or about 1,717,000 households had acceptable food
consumption and could be considered food secure. Others either had poor food consumption
(82,000 households, representing 4% of all households) or borderline food consumption patterns
(378,000 households, 17%), adding up to a total of 21% of food insecure households in Rwanda.
These figures show clear improvement since the 2006 CFSVA and seem to indicate a slight,
although not confirmed, improvement in household food consumption since the last CFSVA and
Nutrition Survey was conducted in February/March 2009.
Percentages of households with unacceptable food consumption are especially high in the rural
areas bordering Lake Kivu (42%) and West and East of the Congo Nile Crest (43% and 29%
respectively), where soils are less fertile and the land more susceptible to erosion. The western
province accounts for the largest numbers and highest rates of food insecure households (37%).
Although it is home to less than a quarter of all Rwandan households, half of all households with
poor food consumption live there as do 38% of those with borderline food consumption. Kigali has
by far the highest proportion of households with acceptable food consumption (93%) followed by
the eastern province (86%), which is relatively better off than other provinces but most prone to
rainfall deficit. At district level, Rutsiro (53%), Ngororero (44%), Rusizi (49%), Nyamasheke
(37%) and Karongi (37%) have the highest percentages of households with unacceptable
consumption. If a major rainfall deficit were to affect the East (which happens every 4-5 years) an
additional 170,000 households would become food insecure.
Food insecure households are typically poor, rural households, living in small crowded homes,
depending on low income agriculture or casual labour. They rely on a small number of livelihood
activities; often have no kitchen garden and their household food stocks are not sufficient to last
through the lean season until the next harvest. The further households are located from a main
road or market, the more likely they are to be food insecure. Food insecure households are more
likely to be headed by a lowly educated, elderly person. Food insecure households involved in
agriculture and land cultivation are likely to farm small plots of land (less than 0.5 ha).
Conversely, households relying on more diversified activities, and especially urban households not
involved in agricultural production, are better off in terms of food security. The more crops a
farming household cultivates and the more livestock it owns the more likely it is to be food secure.
Acute malnutrition among children between six months and five years is the only nutrition
indicator within ’acceptable’ limits (3.6%). The prevalence of underweight, which reflects both
chronic and acute malnutrition, is ‘poor’ at 12%. The prevalence of chronic malnutrition (stunting)
among children between six months and five years is ‘very high’ at 43%.
P a g e | 3
The northern livelihood zones have the highest rates of stunting, exceeding 60% in rural areas,
followed by rural areas bordering Lake Kivu (51% stunting), and along the Congo Nile Crest
(50%). At provincial level, the northern and western provinces have the highest rates of stunting
with over half of all children between six months and five years of age stunted. Stunting is lowest
in Kigali (24%).
Boys are more stunted than girls. The smaller the baby at birth, the more likely it is to be stunted
later on, and stunting increases with age. Stunted children are more likely to live in poor, crowded,
rural households that are further away from services (hospital), often on steeply sloping land.
They have young, lowly educated mothers who are themselves stunted. Child feeding practices of
children between 12 and 23 months - in particular the types of foods consumed by children - are
significant predictors of their stunting. In particular, children between one and two years old who
had consumed milk products were significantly less stunted than other children of the same age
category.
Four percent of reproductive age women are stunted, 17% overweight and 7% wasted. In
addition, 5% of pregnant women are wasted (MUAC).
Based on these results, this report formulates recommendations on the way forward to improve
food and nutrition security in Rwanda. They are related to:
Improving coverage and targeting of assistance and social protection safety nets;
Upgrading household living conditions, strengthening livelihood strategies and tackling
poverty;
Developing and diversifying agricultural production;
Building community resilience to food and nutrition insecurity;
Improving child food consumption;
Monitoring and further analysing the food security and malnutrition situation.

P a g e | 4
1 INTRODUCTION
Located just south of the equator, Rwanda is a small (26,000 km2) landlocked country with limited
natural resources2 characterized by its high population density and hilly terrain. According to the
latest EICV 3 the total population of Rwanda in 2011 was 10.7 million people. The average
population density of around 400 people3 per square kilometre is the highest in Africa.
1.1 RWANDA’S IMPRESSIVE ACCOMPLISHEMENTS
Since the 1994 Genocide and the total collapse of Rwanda’s economy and social services, the
country has embarked on rebuilding itself and improving the quality of life of its population.
At the turn of the century, Rwanda still faced enormous difficulties. Sixty percent of its population
of eight million was living below the poverty line, over 90% of the labour force worked mainly in
subsistence agriculture and half the population was illiterate. Public debt exceeded GDP, which was
only 214 USD per capita, while other social and economic problems were severe.
Rwanda is a small country with high population density, little capital and few natural resources.
Landlocked, and connected to ports by bad roads, its inputs are expensive. However, from a
tragically low starting point, Rwanda has accomplished a lot in the last decade. Progress with
implementing the country’s first Economic Development and Poverty Reduction Strategy (EDPRS)
has been quite impressive. It has exceeded its poverty reduction targets by reducing poverty from
about 56.7% of the population in 2005/6 to 44.9% in 2010/11, while extreme poverty has reduced
from 35.8% to 24.1%.4
Progress is fast and widespread. The country’s macroeconomic framework was remarkably stable,
given the difficult external post-crisis environment and Rwanda’s position as a highly import-
dependent land-locked country.5 The GDP per capita was 595 USD in 2010 (509 USD in Uganda),
which is above the Vision 2020 target of 400 USD for 2010. GDP growth was 8.6% in 2011, which
was not an exceptional year.
Agricultural production has been continuously increasing and the country is reporting to have
produced enough food to feed its entire people since 2008. Health indicators have improved, as
has school enrolment, parity between girls and boys in school and access to clean water.
1.2 POVERTY AND INEQUALITY PERSIST
Despite recent progress in agricultural production and a rapidly growing economy, Rwanda is still
facing many developmental challenges. Although, according to the EICV 3, it has made significant
progress in terms of poverty reduction, in 2010/2011 almost every other rural household in
Rwanda still lived on less than 118,000 RWF per adult per year at current prices,6 and about one in
four rural households on less than 83,000 RWF.7
The most recent household living conditions survey (the EICV 3) also found that poverty rates vary
enormously between provinces and from district to district. The northern and the eastern provinces
have seen the most improvement and now have the lowest rates of poverty in the country while
the western and southern provinces still have the highest share. Poverty in Rwanda still remains
2 Mineral resources are mainly heavy minerals and to a lesser extent gold and sapphires. The potential for hydroelectric power is substantial and is exploited through joint hydroelectric projects with Burundi and the Democratic Republic of the Congo. 3 Source: NISR. 4 EICV 3. 5 World Bank, Rwanda Economic Update Spring Edition April 2011. 6 Poverty line of 2011. 194 US dollars at the exchange rate of April 2012: 1USD=607.08 RWF. 7 Extreme poverty line 2011. 137 US dollars at the exchange rate of April 2012: 1USD=607.08 RWF.

P a g e | 5
disproportionately a rural phenomenon with 22.1% poor in urban areas and 48.7% poor in rural
areas according to the EICV 3. There are also large differences in access to health and other
facilities between urban and rural areas.
High levels of poverty inequality are a major concern that can hinder growth and reduce its
positive impacts. While the Gini coefficient8 showed modest improvement between 2005/2006 and
2010/2011, it had slipped during the previous five. Today, Rwanda still has a higher Gini than
neighbouring Tanzania, Kenya, Uganda or Burundi.9
In addition recent surveys estimated that 44% (including urban areas) of children under five were
chronically malnourished10 in 2010 and that 36%11 of rural households had unacceptable food
consumption in September 2011 and could be considered food insecure.
1.3 OUTLOOK AND REASONS FOR THIS ASSESSMENT
Against this context of socio-economic progress mitigated by population growth, widespread
poverty and high levels of chronic malnutrition and food insecurity, it was decided to undertake the
third national Comprehensive Food Security and Vulnerability Analysis and Nutrition Survey
(CFSVA and Nutrition Survey 2012) in Rwanda. Like previous CFSVAs, the overall objective is to
analyze trends of food insecurity, malnutrition and vulnerability over time, measuring the extent
and depth of food insecurity and identifying the underlying causes. In addition, building on the
recently released EICV 3 and 2010 DHS surveys, this study is specifically geared toward producing
evidence based support for targeting (including at district level) of social protection and other
assistance aimed at eliminating food insecurity and malnutrition in Rwanda.
Table 1: Selected social and economic indicators
Indicators 2000/01 2005/06 2010/11
Total population (million) 7.9 9.5 10.7
Population density/ km² 300 343 393
Population growth 2.7% 3.3% 2.9%
Urban population (percent) 17% 17% 18%
Agriculture/ GDP (percent) 37% 38% 32%
Industry/ GDP (percent) 14% 14% 16%
Services/ GDP (percent) 43% 42% 46%
GDP Growth (percent) 8.5% 9.2% 8.6%
Agricultural growth (percent) 9% 3% 5%
Industrial growth (percent) 13% 12% 18%
Per capita GDP (USD) 212 USD 333 USD 595 USD
Consumer price change (percent) 1.1% 8.8% 5.6%
Food price change (percent) - 10.2% 6.3%
Exter. public debt service (% revenue) 1.3% 9.8% 2.6%
Overall fiscal deficit (percent GDP) 6.3% 1.4% 4.9%
Poverty 58.9% 56.7% 44.9%
Extreme poverty 40.0% 35.8% 24.1%
Gini coefficient 0.507 0.522 0.490
Source: NISR
8 Gini coefficient of inequality: this is the most commonly used measure of inequality. The coefficient varies between 0, which reflects complete equality and 1, which indicates complete inequality (one person has all the income or consumption, all others have none) (source: www.worldbank.org). 9 The Gini coefficient has seen an increase from 0.47 in 2000 to 0.51 in 2005 (EICV 2, 2005/06), mostly in rural areas, which are high levels by global standards. But over the last period 2006-2011, the inequality seems to have decreased as indicated by the Gini coefficient of 0.49 in 2010/2011. 10 DHS 2010, confirmed by the FNSMS round 3: 43%. 11 FNSMS round 3, September 2011.

P a g e | 6
2 STUDY OBJECTIVES AND METHODOLOGY
Previous research 12 shows that poverty and the resulting poor food consumption patterns in
Rwandan households are among the main underlying causes of chronic malnutrition. There are
strong indications 13 that malnutrition rates are linked to specific livelihood profiles (such as
agriculture and daily labour) and have defined geographic distribution patterns (e.g. along the
crest of the Nile).
In order to verify these findings, and to further analyze the link between poverty, food insecurity,
precarious livelihoods and malnutrition in the rapidly changing context of Rwanda,14 the third
CFSVA and Nutrition Survey was conducted 15 jointly by the Government of Rwanda, the UN,
donors and NGOs.
It looks into social protection issues, food insecurity and malnutrition in Rwanda to formulate
recommendations so that interventions to tackle poverty, food insecurity and malnutrition can be
adequately targeted and designed (including district plans to eliminate malnutrition) and to help
monitor progress in the implementation of the Joint Action Plan to fight malnutrition in Rwanda.
2.1 KEY OBJECTIVES OF THE ASSESSMENT
As in 2006 and 2009, WFP and partner organisations launched the CFSVA and Nutrition Survey
2012 in March, just a few months after the main season A harvest. The assessment broadly aims
to:
1. Answer the key food security and nutrition questions specified in Box 1;
2. Train and build capacity of government partners to manage and conduct food security and
nutrition assessments;
3. Formulate specific recommendations for social protection, food security and nutrition
interventions, including geographic and household level targeting criteria.
Box 1: Key questions of the assessment
1. What have been the historical food security and nutrition trends and what is the outlook for
the country?
2. Who are the food-insecure, malnourished or vulnerable people?
3. How many people are food-insecure, malnourished or vulnerable?
4. Where do they live?
5. What are the underlying causes and threats of food insecurity and malnutrition?
6. What are the implications for social protection, food security and nutrition interventions?
2.2 CONCEPTUAL FRAMEWORK AND DEFINITIONS
The CFSVA and Nutrition Survey analysis is based on a particular understanding of food security
and vulnerability. The Food and Nutrition Security Conceptual Framework presented in
Figure 1 informed not only the selection of indicators for analysis, but also the design of field
assessment instruments.
12 CFSVA 2006-2009, a study by WFP (unpublished) on the causal analysis of chronic malnutrition in Rwanda based on the 2005 DHS 13 Regularly conducted rounds of FNSMS (coordinated by MINAGRI) also point at poor food consumption and differences between livelihood zones. 14As the population of Rwanda is quickly growing, pressure on resources is continuously increasing. In addition the government is putting a lot of efforts in modernizing the country. 15 Previous CFSVAs were conducted in 2006 and 2009.

P a g e | 7
This report first describes the state of food security and nutrition in Rwanda in 2012 and then
follows the logic of the Food and Nutrition Security Conceptual Framework to identify determinants
of food insecurity and malnutrition. Lastly, after looking at existent tools and mechanisms in place
to tackle poverty, food insecurity and malnutrition in Rwanda, recommendations are provided for
development partners regarding social safety nets, food security and nutrition interventions,
including geographic and household level targeting criteria.
Figure 1: CFSVA and Nutrition Survey conceptual framework
Source: CFSVA guidelines, 2012
2.2.1 Food security
Food security exists when all people, at all times, have access to sufficient, safe and nutritious
food to meet their dietary needs and food preferences for an active and healthy life. Food security
is divided into three components: food availability, food access and food utilization.
Food availability is the quantity of food that is physically present in a country or area through all
forms of domestic production, commercial imports and food aid.
Food access represents the households’ ability to regularly acquire adequate amounts of food
through a combination of their own stock and home production, purchases, barter, gifts, borrowing
or food aid.
Food utilization refers to: a) households’ use of the food to which they have access, b) intra-
household food distribution, and c) individuals’ ability to absorb nutrients – the conversion
efficiency of food by the body.
2.2.2 Nutritional status and nutritional security
Nutritional status is the balance between the intake of nutrients by an organism and their
expenditure in the processes of growth, reproduction and health maintenance. Consequently
malnutrition is any condition caused by excess or deficient nutrient intake.
Nutritional security is achieved when a household has secure physical, economic and
environmental access to a balanced diet and safe drinking water, a sanitary environment,
adequate health services and knowledgeable care to ensure adequate nutritional status for an
active and healthy life at all times for all its members.
2.3 METHODOLOGY
Primary data collection took place over six weeks from early March to the end of April 2012. Two
instruments were used to collect primary data: a key informant questionnaire administered to the
P a g e | 8
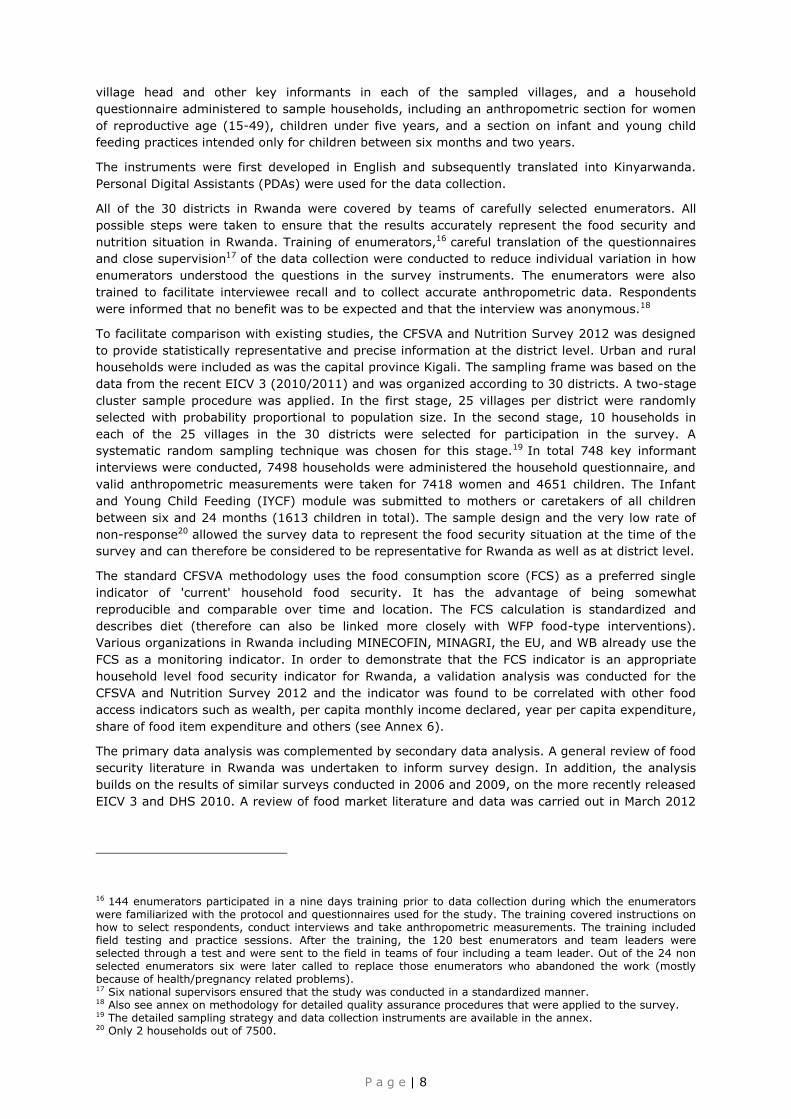
village head and other key informants in each of the sampled villages, and a household
questionnaire administered to sample households, including an anthropometric section for women
of reproductive age (15-49), children under five years, and a section on infant and young child
feeding practices intended only for children between six months and two years.
The instruments were first developed in English and subsequently translated into Kinyarwanda.
Personal Digital Assistants (PDAs) were used for the data collection.
All of the 30 districts in Rwanda were covered by teams of carefully selected enumerators. All
possible steps were taken to ensure that the results accurately represent the food security and
nutrition situation in Rwanda. Training of enumerators,16 careful translation of the questionnaires
and close supervision17 of the data collection were conducted to reduce individual variation in how
enumerators understood the questions in the survey instruments. The enumerators were also
trained to facilitate interviewee recall and to collect accurate anthropometric data. Respondents
were informed that no benefit was to be expected and that the interview was anonymous.18
To facilitate comparison with existing studies, the CFSVA and Nutrition Survey 2012 was designed
to provide statistically representative and precise information at the district level. Urban and rural
households were included as was the capital province Kigali. The sampling frame was based on the
data from the recent EICV 3 (2010/2011) and was organized according to 30 districts. A two-stage
cluster sample procedure was applied. In the first stage, 25 villages per district were randomly
selected with probability proportional to population size. In the second stage, 10 households in
each of the 25 villages in the 30 districts were selected for participation in the survey. A
systematic random sampling technique was chosen for this stage.19 In total 748 key informant
interviews were conducted, 7498 households were administered the household questionnaire, and
valid anthropometric measurements were taken for 7418 women and 4651 children. The Infant
and Young Child Feeding (IYCF) module was submitted to mothers or caretakers of all children
between six and 24 months (1613 children in total). The sample design and the very low rate of
non-response20 allowed the survey data to represent the food security situation at the time of the
survey and can therefore be considered to be representative for Rwanda as well as at district level.
The standard CFSVA methodology uses the food consumption score (FCS) as a preferred single
indicator of 'current' household food security. It has the advantage of being somewhat
reproducible and comparable over time and location. The FCS calculation is standardized and
describes diet (therefore can also be linked more closely with WFP food-type interventions).
Various organizations in Rwanda including MINECOFIN, MINAGRI, the EU, and WB already use the
FCS as a monitoring indicator. In order to demonstrate that the FCS indicator is an appropriate
household level food security indicator for Rwanda, a validation analysis was conducted for the
CFSVA and Nutrition Survey 2012 and the indicator was found to be correlated with other food
access indicators such as wealth, per capita monthly income declared, year per capita expenditure,
share of food item expenditure and others (see Annex 6).
The primary data analysis was complemented by secondary data analysis. A general review of food
security literature in Rwanda was undertaken to inform survey design. In addition, the analysis
builds on the results of similar surveys conducted in 2006 and 2009, on the more recently released
EICV 3 and DHS 2010. A review of food market literature and data was carried out in March 2012
16 144 enumerators participated in a nine days training prior to data collection during which the enumerators were familiarized with the protocol and questionnaires used for the study. The training covered instructions on how to select respondents, conduct interviews and take anthropometric measurements. The training included field testing and practice sessions. After the training, the 120 best enumerators and team leaders were selected through a test and were sent to the field in teams of four including a team leader. Out of the 24 non selected enumerators six were later called to replace those enumerators who abandoned the work (mostly because of health/pregnancy related problems). 17 Six national supervisors ensured that the study was conducted in a standardized manner. 18 Also see annex on methodology for detailed quality assurance procedures that were applied to the survey. 19 The detailed sampling strategy and data collection instruments are available in the annex. 20 Only 2 households out of 7500.

P a g e | 9
to prepare for a more thorough investigation during the primary data collection and to inform the
market section of the study. This information has been integrated into the report.
2.4 STUDY LIMITATIONS
2.4.1 Sample size and representativeness of key informant interviews
The sample size was not designed to produce very precise estimates for malnutrition prevalence at
district level mainly because the primary goal of collecting the nutrition data was to analyse the
link between food security and nutrition (and does not require very precise nutrition estimates)
and also because the recently released 2010 DHS had estimated district level malnutrition
prevalence. Nevertheless the survey provides unbiased estimates of the main malnutrition
indicators.
Also, the information from the key informants was collected through a structured questionnaire but
the sample was not designed to be statistically representative for villages in Rwanda; the
information from the community questionnaire was therefore used for contextual information only.
2.4.2 The complexity of measuring food security
Food security and vulnerability are complex concepts to measure. The limitations for the use of the
FCS as a food security indicator may include the fact that it is a very temporal specific indicator at
the household level (it provides a snapshot of household food consumption in the seven days
preceding the interview), that it only considers meals eaten at home, that it does not look at the
individual food consumption, which implies a larger range of factors- including micronutrient
consumption - and that it does not take into account the quantity of food items eaten.
2.4.3 Comparisons with previous CFSVA and nutrition surveys
When comparing the levels of food security in 2012, 2009 and 2006 the following points need to
be taken into account: exact timing of the survey in the year, type of harvest (good vs. bad) that
preceded the survey and differences in sampling.
Seasonality
For the CFSVA and Nutrition Survey 2012, data collection was conducted during the lean season
(March-April) that followed a relatively good harvest. The 2009 survey was also conducted in a
relatively good year although the data collection was done earlier in the year (February-March)
which could account for a better overall food security situation. On the contrary, the 2006 CFSVA
and Nutrition Survey was conducted in March-April 2006, during a lean period after a poor harvest.
These differences were discussed when the trend analysis of the food security situation was
conducted.
Differences in samples
The CFSVA and Nutrition Survey 2012 was designed to produce estimates of food security
indicators at district level and covered both urban and rural households. This was not the case for
the two previous CFSVA and Nutrition Surveys; the 2006 study was conducted only among rural
households of Rwanda whereas the 2009 sample excluded Kigali City and only included households
with children under five years (which is common practice for nutrition surveys). Hence only
households living outside of Kigali province with children under five years can be compared with
the 2009 CFSVA and Nutrition Survey.
Other differences that do not affect comparability of the data
The sampling units have changed from enumeration zones in 2006 and 2009 to villages in 2012.
Weight calculations for 2012 were based on projected population data from the EICV 3 while 2006
and 2009 calculations were based on projections of the 2002 census.
In addition, building on experience from previous surveys (including the 2009 CFSVA and Nutrition
Survey as well as the FNSMS rounds) some questions were improved and asked in a slightly
different way compared with the preceding surveys.
1
P a g e | 10
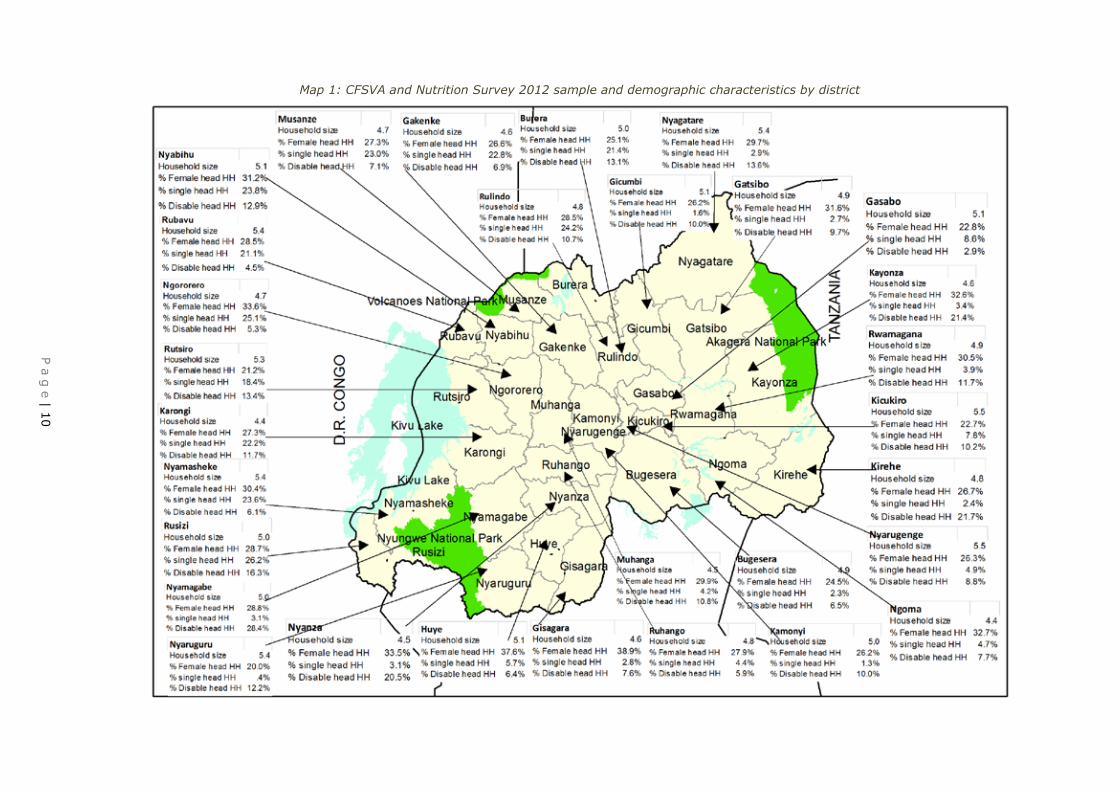
Map 1: CFSVA and Nutrition Survey 2012 sample and demographic characteristics by district
Pa
ge
| 10
Map 1: C
FSVA and N
utrition Survey 2012 sam
ple and demographic characteristics by district
P a g e | 11
3 THE STATE OF FOOD SECURITY AND NUTRITION
IN RWANDA IN 2012
The food security of any household or individual is typically determined by the interaction of a
broad range of agro-environmental, socio-economic and biological factors. As with the concepts of
health or social welfare, there is no single direct measure of food security.
This chapter describes the state of food security in Rwanda through the three distinct, but
interrelated, dimensions of food availability, food access and individual food utilization (see
definitions in section 2.2). This chapter also goes one step further and describes the nutritional
status of children under five years old and women in reproductive age in the country using the
standard indicators of weight for height, height for age, weight for age and mid upper arm
circumference (MUAC) for children and body mass index (BMI) for (non-pregnant) women. MUAC
was taken for all women in reproductive age.
3.1 INCREASING FOOD AVAILABILITY
Food availability represents the food that is physically present in the area of concern, through all
forms of domestic production, commercial imports, reserves and food aid. This might be
aggregated at regional, national, district or community level. Markets make an important
contribution to the availability of food and the access to food year-round (both physically and
economically). Sub nationally, for example between producing and non-producing areas, markets
determine the movement of commodities from supply to demand and deliver them to end
consumers.
This section of the report starts by giving a macro-picture of the market interaction with other food
markets in the region. Secondly, it discusses food availability at national level and thirdly zooms in
on the district level, elaborating on market functioning and price trends and differences between
districts.
3.1.1 Regional interaction and cross border trade flows
Rwanda shares borders with four surrounding countries (Uganda, Tanzania, Burundi and
Democratic Republic of Congo) and is integrated in the regional East African market. The two trade
agreements that dominate East Africa’s regional trade system are the East African Community
(EAC)21 and the Common Market for Eastern and Southern Africa (COMESA).22 Trade within both
the EAC region and the larger COMESA region represents a critical portion of imports and exports
for all of the countries involved—in the range of 30–50%.23
In general, food can flow relatively freely across the borders within the Eastern African Customs
Union, which was established in 2005, although there are still some non-tariff trade barriers.24
Free flow of goods also applies to intra-regional trade although more exceptions apply, including a
list of sensitive goods such as milk, maize and wheat that are excluded from the tax exemption.
Although the steep increase in agricultural production might tilt the future balance in favour of
exports (see further on), Rwanda still remains (formally) a net importer of food when all trade is
21 Rwanda joined the East African Community in 2007. The member states of EAC are Burundi, Kenya, Rwanda, Tanzania, and Uganda. 22 The member states of COMESA are Angola, Burundi, Comoros, Democratic Republic of Congo, Djibouti, Egypt, Eritrea, Ethiopia, Kenya, Madagascar, Malawi, Mauritius, Rwanda, Seychelles, Sudan, Swaziland, Uganda, Zambia, and Zimbabwe. 23 USAID report: Cross-Border Trade in East African countries, 2009. 24 2008 survey of the East African Business Council.
P a g e | 12
considered. The cereal balance sheet as calculated by the Food and Agricultural Organisation
(FAO) in September 2012 also indicates that Rwanda is a formal importer of cereals. 25
Informal trade was estimated to represent 23% of total cross-border trade in 2010.26 In 2011,
according to the reports of the National Bank of Rwanda, Rwanda’s informal exports exceeded
informal imports, leaving the country with a positive trading balance. Livestock and food products
are the main informally traded commodities.27 Beans, maize and even wheat are some of the
exported commodities while Rwanda informally imports rice. Overall Rwanda has a negative food
trading balance with Tanzania and a positive trading balance with Burundi, DRC and Uganda.28
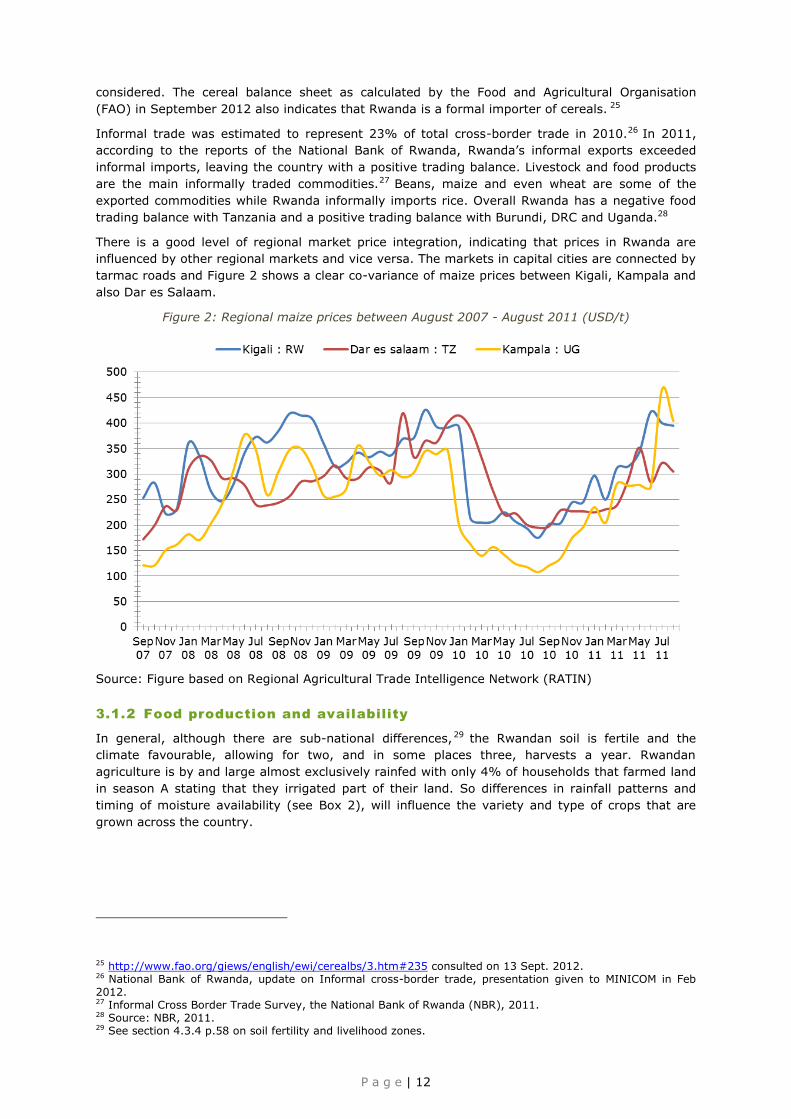
There is a good level of regional market price integration, indicating that prices in Rwanda are
influenced by other regional markets and vice versa. The markets in capital cities are connected by
tarmac roads and Figure 2 shows a clear co-variance of maize prices between Kigali, Kampala and
also Dar es Salaam.
Figure 2: Regional maize prices between August 2007 - August 2011 (USD/t)
Source: Figure based on Regional Agricultural Trade Intelligence Network (RATIN)
3.1.2 Food production and availability
In general, although there are sub-national differences, 29 the Rwandan soil is fertile and the
climate favourable, allowing for two, and in some places three, harvests a year. Rwandan
agriculture is by and large almost exclusively rainfed with only 4% of households that farmed land
in season A stating that they irrigated part of their land. So differences in rainfall patterns and
timing of moisture availability (see Box 2), will influence the variety and type of crops that are
grown across the country.
25 http://www.fao.org/giews/english/ewi/cerealbs/3.htm#235 consulted on 13 Sept. 2012. 26 National Bank of Rwanda, update on Informal cross-border trade, presentation given to MINICOM in Feb 2012. 27 Informal Cross Border Trade Survey, the National Bank of Rwanda (NBR), 2011. 28 Source: NBR, 2011. 29 See section 4.3.4 p.58 on soil fertility and livelihood zones.
P a g e | 13
Crop production
The government has prioritized agricultural development, and the sector has witnessed an
impressive improvement in productivity over the past decade, including substantial growth in
staple food crops, particularly for cereals, roots and tubers. Land consolidation and input provision
through the Crop Intensification Programme (CIP, launched in 2007) are reported to be the main
contributors to smallholder productivity gains, 30 translating into continuously improving food
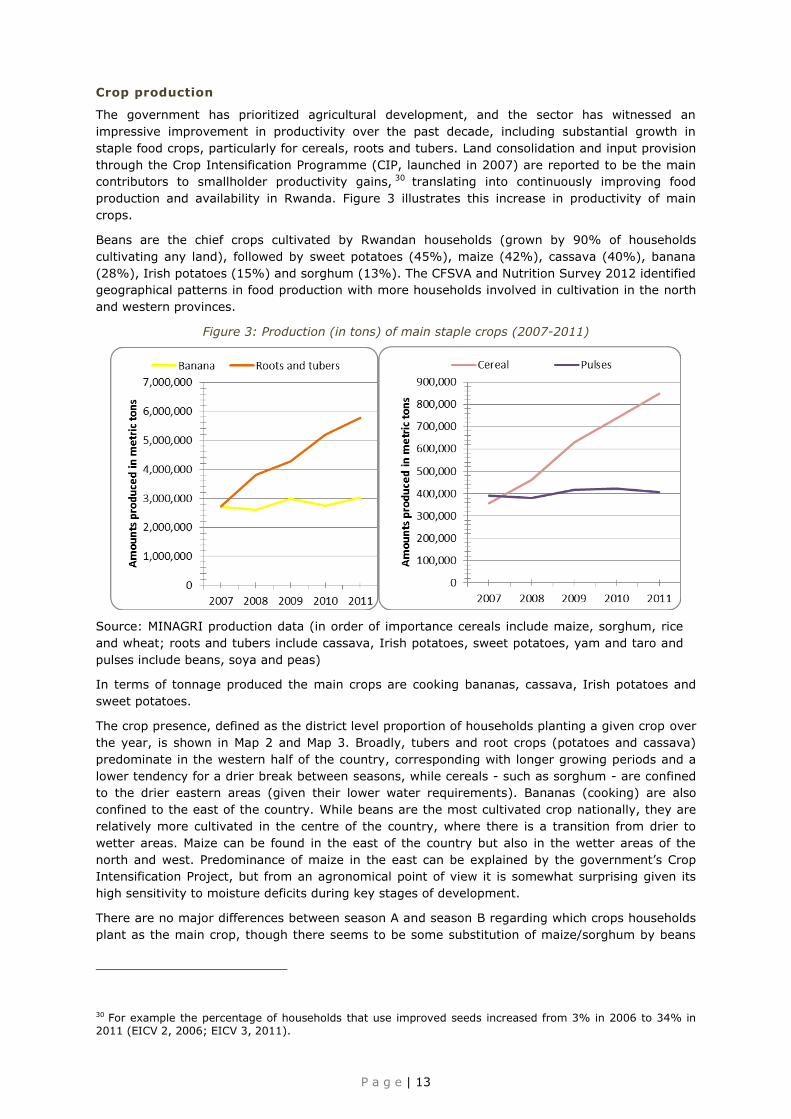
production and availability in Rwanda. Figure 3 illustrates this increase in productivity of main
crops.
Beans are the chief crops cultivated by Rwandan households (grown by 90% of households
cultivating any land), followed by sweet potatoes (45%), maize (42%), cassava (40%), banana
(28%), Irish potatoes (15%) and sorghum (13%). The CFSVA and Nutrition Survey 2012 identified
geographical patterns in food production with more households involved in cultivation in the north
and western provinces.
Figure 3: Production (in tons) of main staple crops (2007-2011)
Source: MINAGRI production data (in order of importance cereals include maize, sorghum, rice
and wheat; roots and tubers include cassava, Irish potatoes, sweet potatoes, yam and taro and
pulses include beans, soya and peas)
In terms of tonnage produced the main crops are cooking bananas, cassava, Irish potatoes and
sweet potatoes.
The crop presence, defined as the district level proportion of households planting a given crop over
the year, is shown in Map 2 and Map 3. Broadly, tubers and root crops (potatoes and cassava)
predominate in the western half of the country, corresponding with longer growing periods and a
lower tendency for a drier break between seasons, while cereals - such as sorghum - are confined
to the drier eastern areas (given their lower water requirements). Bananas (cooking) are also
confined to the east of the country. While beans are the most cultivated crop nationally, they are
relatively more cultivated in the centre of the country, where there is a transition from drier to
wetter areas. Maize can be found in the east of the country but also in the wetter areas of the
north and west. Predominance of maize in the east can be explained by the government’s Crop
Intensification Project, but from an agronomical point of view it is somewhat surprising given its
high sensitivity to moisture deficits during key stages of development.
There are no major differences between season A and season B regarding which crops households
plant as the main crop, though there seems to be some substitution of maize/sorghum by beans
30 For example the percentage of households that use improved seeds increased from 3% in 2006 to 34% in 2011 (EICV 2, 2006; EICV 3, 2011).

P a g e | 14
from one season to another – this is more noticeable in the most southeastern districts (Kayonza,
Kirehe and Ngoma) where beans become even more dominant in season B. Since season B is
shorter and ends in a dry period, it is safer to plant beans because they have a shorter
development period than maize/sorghum and are less drought-sensitive.
The most important commodities from a consumption point of view are: sweet potatoes, cooking
bananas, beans, maize, cassava and Irish potatoes (see Map 4 and Map 5 p.33).
The most important commodities from an income earning point of view are the following cash
crops: coffee, tea and sorghum. 31 Households were asked to estimate the percentage of last
season’s food production that was sold at the market. On average and for all crops produced,
households were selling 23% of their production, and consuming 71%. The rest was reported as
either given away (2%) or spoiled/lost after harvest (3%). This confirms the findings of the EICV 3
(around 21% of the agricultural produce harvested was marketed32) and varies little from the
findings of the 2009 CFSVA and Nutrition survey.33 Unsurprisingly households generally sold more
than half of their production of cash crops (tea, coffee, pineapple, sugar cane all over 85% sold)
and fruits and vegetables (tomato 80% sold, passion fruit 60%, cabbage 58%) in addition to
sorghum (54%) and rice (63%). Crops that households kept mostly for own consumption were the
main consumed cereals, roots and tubers as well as beans, and cooking banana (see Table 2).
Table 2: Main crops grown in Rwanda and percentage sold to market
Crop % HHs growing main crop in 2006(1)
% HHs growing main crop in 2009(1)
% HHs growing main crop in 2012(1)
Tons produced in 2011(2)
% sold to market in 2012(1)
Beans 83 88 90 332,892 12
Sweet potatoes
54 61 45 853,071 11
Maize 23 38 42 508,123 22
Cooking banana
-34 -35 28 3,057,895 30
Irish potatoes
-36 -37 15 2,177,164 32
Cassava 36 46 40 2,616,424 23
Sorghum 38 34 13 181,534 54
Source: Table based on data from
(1) CFSVA and Nutrition Survey 2006, 2009 and 2012, and
(2) MINAGRI production data
31 While sorghum is not a typical cash crop, 23% of sorghum output is marketed; a significant higher percentage than for other food crops grown (see Table 2). 32 The share of harvest sold is highest at Eastern Province (25%) and around 20% is the other provinces outside Kigali City (EICV 3). Depending on the type of crop considered this percentage can be a lot higher (97% for tea and coffee) or lower (between 9 and 12% for cassava, potatoes and beans). 33 According to the CFSVA and Nutrition survey 2009, ‘for the main crops cultivated, over 70% of the production is consumed’. Beans 86% consumed, sweet potatoes 86%, cassava 79%, maize 80% and sorghum 70%. 34 Information not available. 35 Information not available. 36 Information not available. 37 Information not available.
P a g e | 15
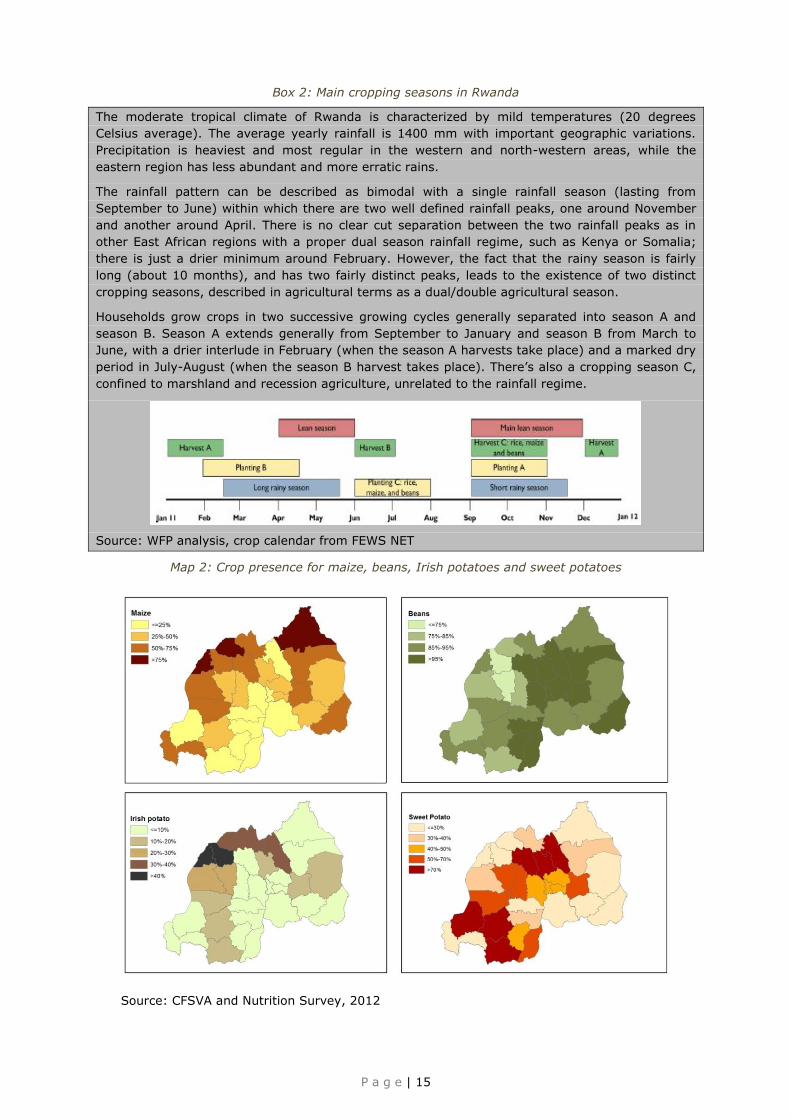
Box 2: Main cropping seasons in Rwanda
The moderate tropical climate of Rwanda is characterized by mild temperatures (20 degrees
Celsius average). The average yearly rainfall is 1400 mm with important geographic variations.
Precipitation is heaviest and most regular in the western and north-western areas, while the
eastern region has less abundant and more erratic rains.
The rainfall pattern can be described as bimodal with a single rainfall season (lasting from
September to June) within which there are two well defined rainfall peaks, one around November
and another around April. There is no clear cut separation between the two rainfall peaks as in
other East African regions with a proper dual season rainfall regime, such as Kenya or Somalia;
there is just a drier minimum around February. However, the fact that the rainy season is fairly
long (about 10 months), and has two fairly distinct peaks, leads to the existence of two distinct
cropping seasons, described in agricultural terms as a dual/double agricultural season.
Households grow crops in two successive growing cycles generally separated into season A and
season B. Season A extends generally from September to January and season B from March to
June, with a drier interlude in February (when the season A harvests take place) and a marked dry
period in July-August (when the season B harvest takes place). There’s also a cropping season C,
confined to marshland and recession agriculture, unrelated to the rainfall regime.
Source: WFP analysis, crop calendar from FEWS NET
Map 2: Crop presence for maize, beans, Irish potatoes and sweet potatoes
Source: CFSVA and Nutrition Survey, 2012

P a g e | 16
Map 3: Crop presence for bananas, banana wine, cassava and sorghum
Source: CFSVA and Nutrition Survey, 2012
Livestock ownership
Animal production and the integration of livestock into smallholder farming is a key contributor to food security. Animal products are a good source of proteins and lipids and, in times of crisis, livestock functions as a shock absorber, contributing to the resilience of poor households. According to the CFSVA and Nutrition Survey 2012, 70% of all households in Rwanda own some
type of livestock.38
Figure 4: Animals owned by households in 2012 - headcount
Source: CFSVA and Nutrition Survey, 2012
38 68% according to the EICV III,38 Third Integrated Household Living Conditions Survey (EICV III), National Institute of Statistics (NISR), 2012.

P a g e | 17
In order to compare livestock ownership at household level irrespective of the species, the
‘Tropical Livestock Unit’ (TLU)39 was used. Livestock ownership is widespread in rural Rwanda with
56% of households owning some type of livestock (30% own the equivalent of one cow or above,
and 26% own less than the equivalent of a cow). On average households own the equivalent of 1
TLU (0.8 TLU being the equivalent of one cow).
There are no clear geographical patterns regarding the average number of livestock equivalent per
household with the notable exception of Nyagatare district where the average number of TLU
owned by livestock rearing households is about three times higher than any other district.
Unsurprisingly rural households are far more likely to own livestock than urban: 78% of
households in urban areas do not rear any livestock vs. 38% in rural areas and 44% in peri-urban
areas (same difference toned down a little can be observed between Kigali and the rest of the
provinces).
3.1.3 Aggregate food availability in kilocalories
Adding up the nutritional value of food crops and animal products, the Ministry of Agriculture
estimates that since 2008 Rwanda’s average production per capita is above the international
standard requirement of 2,100 kilocalories per adult (see Table 3). The picture at provincial and
district level is relatively similar with the expected exception of urban areas and of places
geographically less suitable for agricultural production. The overall production can be described as
very carbohydrate based and deficient in lipids.
The most productive province in terms of total tonnage in 2011 is the western province, but in
terms of per capita energy production, the eastern province is recorded to have produced the most
calories and lipids per person, while the northern province produced the most proteins per person
in 2011. Unsurprisingly, Kigali province has the lowest productivity as the food consumed there is
supplied from elsewhere.
The three districts with the highest calculated production per capita in terms of Kilocalories in 2011
are Kirehe (3,822 Kcal), Nyagatare (3,172 Kcal) and Kamonyi (3,098 Kcal). The three districts
with the lowest production per capita in terms of Kilocalories apart from Kigali City 40 are
Nyamagabe (2,031 Kcal), Nyaruguru (2,128 Kcal) and Rutsiro (2,199 Kcal).
Table 3: Production of food crops and animal products per province in 2011
2011 Tons
produced
Kcal/cap/da
y
Protein
g/cap/day
Lipids
g/cap/day
Kigali 90,153 244.5 7.5 3.5
North 2,403,319 3110.0 84.5 22.5
East 2,678,482 3416.0 74.5 29.5
West 3,351,007 3191.5 80.5 23.5
South 2,689,304 2957.5 58.0 23.5
Total/
Average
11,212,265 2583.9 61.0 20.5
Source: MINAGRI, 2011
39 One TLU is equivalent to one cattle of 205kg at maintenance. The summative scale used the following standard weight: cattle: 0.8, goat: 0.1, pork: 0.3, poultry: 0.007, rabbit: 0.007. The coefficients have not been specifically validated for Rwanda. 40 Kigali City is the lowest production area (424 Kcal per capita/day) as it is a mainly urban area.

P a g e | 18
3.2 MARKETS ARE GENERALLY EFFICIENT AND FAIR
3.2.1 Increasing household reliance on markets for food
The EICV 3 show that, on average, an increasing share of food consumed by households was
procured from the market rather than from the households’ own production in 2010-2011
compared with 2005-2006, indicating increased market reliance (see Table 4).
Table 4: Consumption patterns in 2010-2011
Source: EICV 3, 2010-2011
For the CFSVA and Nutrition Survey 2012, households were asked to provide the main sources for
each of the food items consumed during the seven days preceding their interview. The relative
importance of various food sources to the overall diet of the household was estimated by
combining the frequency of consumption and the sources.
Markets provide, on average, 65% of the food consumed by a household with own production
contributing an average of 30%. Other sources including fishing, gathering, hunting, exchange,
borrowing, gifts and food aid account for 5%. Unsurprisingly, the percentage of food from own
production is higher in rural (33%) than in urban areas (10%). The market is the main source for
rice (81%), groundnuts (67%), fish and meat (90% - except poultry: 50%), and milk (55%). Own
production is the main source for roots and tubers - cassava (51%) and sweet potato (61%) -
banana (63%), beans and peas (68%), cassava leaves (67%), and sunflower seeds (64%). For
maize and fruits, market and own production play an equally important role.
While district markets around the country are well connected by road, translating into reasonably
good market integration and price stability (see section 3.2.4), getting to and from the market is a
challenge for many rural households. In fact, only 6% of households are served by a market
facility within their village. The rest have to walk on average 1h and 15 min to another village to
reach a market place. The districts in which households need to walk the furthest to reach a
market are Rulindo (2h and 24 min), Kayonza (2h), Nyamasheke (1h and 55 min), Ngororero (1h
and 50 min), Kirehe (1h and 48 min) and Rutsiro (1h and 36 min). Although most households do
not have a market in their community 71% of the population are less than 5km from a main road
with public transport. Almost three quarters of these roads (73%) are accessible year-round, while
27% are inaccessible during parts of the rainy season (one month on average).41
Economic access to food depends on household income as well as on food prices, which have
almost doubled in nominal terms in the past 6 years (see section 3.2.3). In line with the global
increase in food prices over this decade, the food price inflation is higher than that of non-food
commodities.42 In other words, households heavily dependent on markets for their food have been
hit hardest by inflation.
41 The Second Integrated Household Living Conditions Survey (EICV 3 II), NISR, 2006. 42 Based on EICV 3 data NISR calculated a food and a non-food index. The food index is calculated by computing monthly province-level average prices for 17 main food commodities (covering 60% of household consumption) over the past ten years. The non-food index is calculated by computing monthly average data from 12 locations (the 12 main towns of the old provinces) of 41 commodities (corresponding to 41% of non-
Category of consumption Average value in real
Prices
(RwF/HH/year)
Share of total
consumption
% change since
2005/2006
A. Food purchases 33,891 26.6% +24%
B. Consumption of own food 20,880 15.8% -6%
Total food consumption (A+B) 54,772 42,4% +11%
Other/non-food expenditures 69,119 57,8% +38%
Total 123,891 100% +24%

P a g e | 19
Box 3: Seasonal household food stocks
Eighty five percent of households in Rwanda cultivated land during the 2012 season A, and
according to EICV 3 estimates, in 2010-2011 only 10% of households cultivating any given crops
would sell over half of that crop’s harvest.43 This means that households store most of the
consumed crops at household level for their own consumption.
The longer the household food stock lasts, the better for a household’s food security. When food
stocks run out households become reliant on the market for food and are exposed to price
increases. This explains why the ‘food access insecurity seasons’ (see section 3.3) overlap exactly
with the periods in the year when the fewest households have food stocks from their own
production. Figure 5 shows that around December/January more than 60% of all households in
Rwanda have some food stocks from their (relatively good) season A harvest that took place in
December/January. This percentage decreases to around 15% in May just before the season B
harvest. In June, after season B harvest, almost 60% of households again have food stocks.
Figure 5: Household level food stocks
Source: CFSVA and Nutrition Survey, 2012
3.2.2 Market structure
In Rwanda markets generally function well and pricing is fair with an absence of excessive profit
margins. 44 A 2011 market assessment conducted by WFP, 45 estimates that on average local
farmers capture around 80% of the end market value, a relatively high percentage, and traders
make an 8% profit on the end market value of a product. Other costs include transport, offloading
and taxes.46 Figure 6 details the maize value chain, a major crop in Rwanda. Other value chains
are structured in a roughly similar fashion.
food purchases). For the indexes, prices were expressed relative to the national average price for the same commodity in January 2001; the latter was computed as the population weighted average of the province-level average prices in January 2001. The commodity weights used for the food price index were estimated based on the EICV 3 I and III survey. The weights were calculated based on the sum of both purchases and consumption of own production for the commodity. This is appropriate because the consumption measure to be deflated will include both purchases and consumption from own production. (NISR, 2012). 43 Only 8% of households cultivating sweet potatoes sell more than half their harvest, 12 % for Irish potatoes, 8% for cassava, 9 beans, 12 cooking banana (EICV 3). 44 According to WFP 2011 market study, markets do experience malignant practices like underweight bags and wrongly adjusted weighing scales, but this seems to be more of an exception than a rule. Exploitation of individual farmers by small scale traders are chiefly anecdotal. 45 This data was collected during a trader survey conducted by WFP in 2011 (‘Food or Cash’ WFP, 2011). 26 traders in Kibuye, Byumba, Ngarama and surrounding markets were included in the survey. 46 Transport costs to/from Kigali are around 20 RWF/kg depending on location. Other costs are 2 RWF/kg for offloading and 1 RWF/kg for taxes.
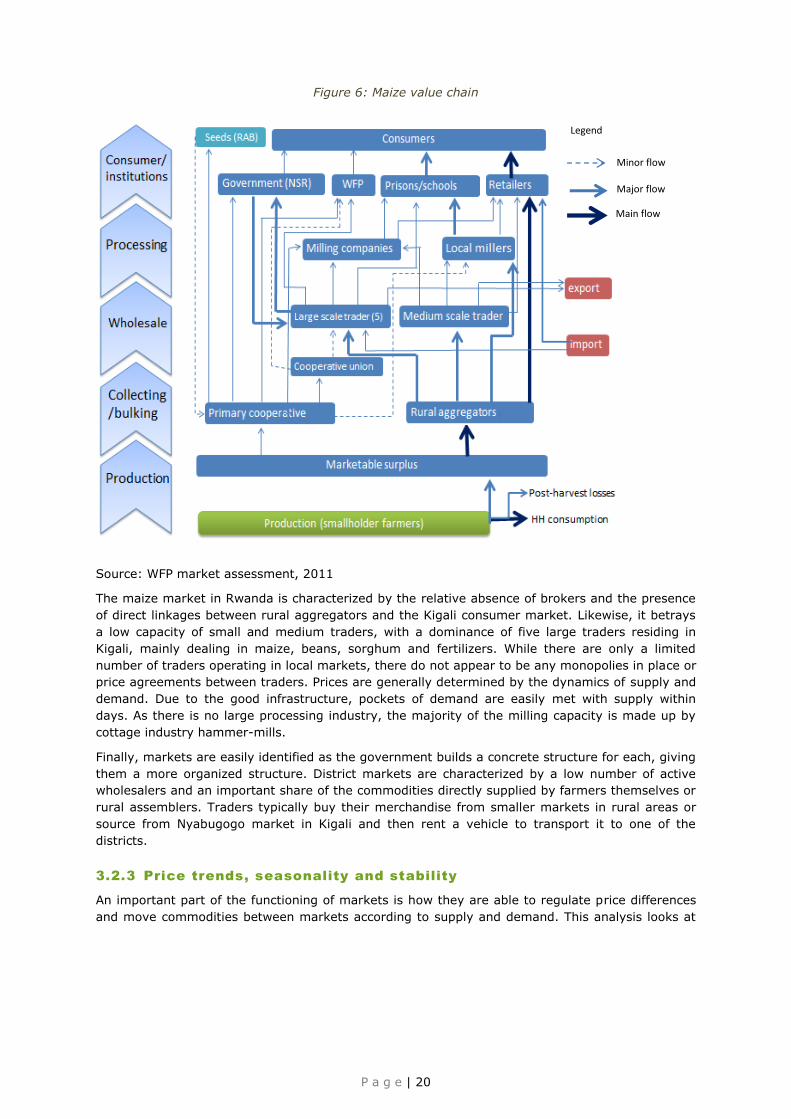
P a g e | 20
Figure 6: Maize value chain
Source: WFP market assessment, 2011
The maize market in Rwanda is characterized by the relative absence of brokers and the presence
of direct linkages between rural aggregators and the Kigali consumer market. Likewise, it betrays
a low capacity of small and medium traders, with a dominance of five large traders residing in
Kigali, mainly dealing in maize, beans, sorghum and fertilizers. While there are only a limited
number of traders operating in local markets, there do not appear to be any monopolies in place or
price agreements between traders. Prices are generally determined by the dynamics of supply and
demand. Due to the good infrastructure, pockets of demand are easily met with supply within
days. As there is no large processing industry, the majority of the milling capacity is made up by
cottage industry hammer-mills.
Finally, markets are easily identified as the government builds a concrete structure for each, giving
them a more organized structure. District markets are characterized by a low number of active
wholesalers and an important share of the commodities directly supplied by farmers themselves or
rural assemblers. Traders typically buy their merchandise from smaller markets in rural areas or
source from Nyabugogo market in Kigali and then rent a vehicle to transport it to one of the
districts.
3.2.3 Price trends, seasonality and stability
An important part of the functioning of markets is how they are able to regulate price differences
and move commodities between markets according to supply and demand. This analysis looks at
Minor flow
Major flow
Main flow
Legend

P a g e | 21
price trends, seasonality47 and stability. For the price analysis the main crops considered are
beans, maize, cassava, Irish and sweet potatoes.48
Price trends
Figure 7 shows that nominal maize prices tend to increase at the end of each year. However, once
nominal prices are deflated into real prices to take into account inflation, real prices appear quite
stable with some exceptional spikes. Similarly, Irish and sweet potato real prices have remained
relatively stable in the past six years. With regard to the same two-year period, real beans prices
seem to be the most affected by yearly seasonality.
Figure 7: Nominal and real price trends of maize, beans, Irish and sweet potatoes (2006-2011)
Source: Based on MINAGRI data, CPI=100 in Jan 2012
Compared to 2009, when the previous CFSVA and Nutrition Survey was conducted, in nominal
terms, prices in 2012 were overall higher than in 2009 (see Figure 8). However, when deflated
into real prices, prices in February, March and April were lower in 2012 for maize and cassava. On
the contrary real prices for potatoes were higher in 2012 than in 2009 for the same three months.
Interestingly, the real prices of beans were lower in February 2012 than in February 2009, but as
the lean season progressed they increased compared with 2009. In March 2012 beans prices were
10% higher than in March 200949 and in April they were 26% higher.
47 To analyse price seasonality, the average monthly price trends over the last 6 years for the commodities of maize, beans, Irish and sweet potatoes were analysed. Cassava and livestock prices are excluded from the analysis because they do not follow a similar annual bimodal pattern. 48 Despite the significantly high production of bananas, this crop is left out of the analysis for a number of reasons: 1. Bananas are not only used for food consumption, but also to make wine and beer 2. Quantities include part of the plant therefore not reflecting actual food intake 3. Quantities and corresponding prices are difficult to determine as they are not sold per kg. 49 Prices are corrected for inflation, in nominal terms.

P a g e | 22
Figure 8: Differences in real and nominal prices of main food commodities between 2009 and 2012
Source: based on MINAGRI price data and CPI data from NISR - (CPI=100 in Jan
2012)50
Price seasonality
Figure 9 depicts the average monthly price trends over the last six years for maize, beans, Irish
and sweet potatoes. The general pattern is always an increase in prices up to the harvest and then
a gradual drop. Nationally however, the price increase is much more marked in the run up to
season A harvest (December-January) than to season B (June-July). In fact, Figure 9 shows
increases of 27% in prices for beans and 28% for maize between July and November (the time
between the two harvests) corresponding to the second peak of ‘food access insecurity’ (see
section on food access p.29).
50 The Consumer Price Index takes February 2009 as base (February 2009=100). The All Urban CPI is regarded as the headline index, producing the official inflation rate and therefore adopted in this study.

P a g e | 23
This is confirmed by the analysis of the Grand Seasonal Index (GSI).51 Figure 10 shows that Irish
potato prices present a bimodal pattern, with two increases in prices - one in April and one in
September. Similarly, sweet potato prices spike in April, while for the remainder of the year they
fluctuate less. Maize and bean prices both show quite steady prices over the year, with a
remarkable increase during the last quarter, in the run up to the season A harvest (November-
December).
Figure 9: Average 6 year monthly prices for selected commodities (2006-2011)
Source: based on MINAGRI price data, 2006-2011
Figure 10: Grand seasonal index for maize, potatoes and beans
Source: Calculations based on MINAGRI price data, 2006-2011
When combining this analysis with that of the food stocks (see Box 3) it becomes clear that before
harvest and towards the end of the calendar year, farmers run out of food stocks and have to
resort to the market for food when they will face relatively higher prices.
51 The GSI is the average by month of the ratios between prices and their centred moving averages. It incorporates the full cycle of seasonal patterns and detects, based on historical values, the upper and lower bands where prices fluctuate across the year once common factors including inflation are smoothed out. The seasonality is quite pronounced for the four commodities.
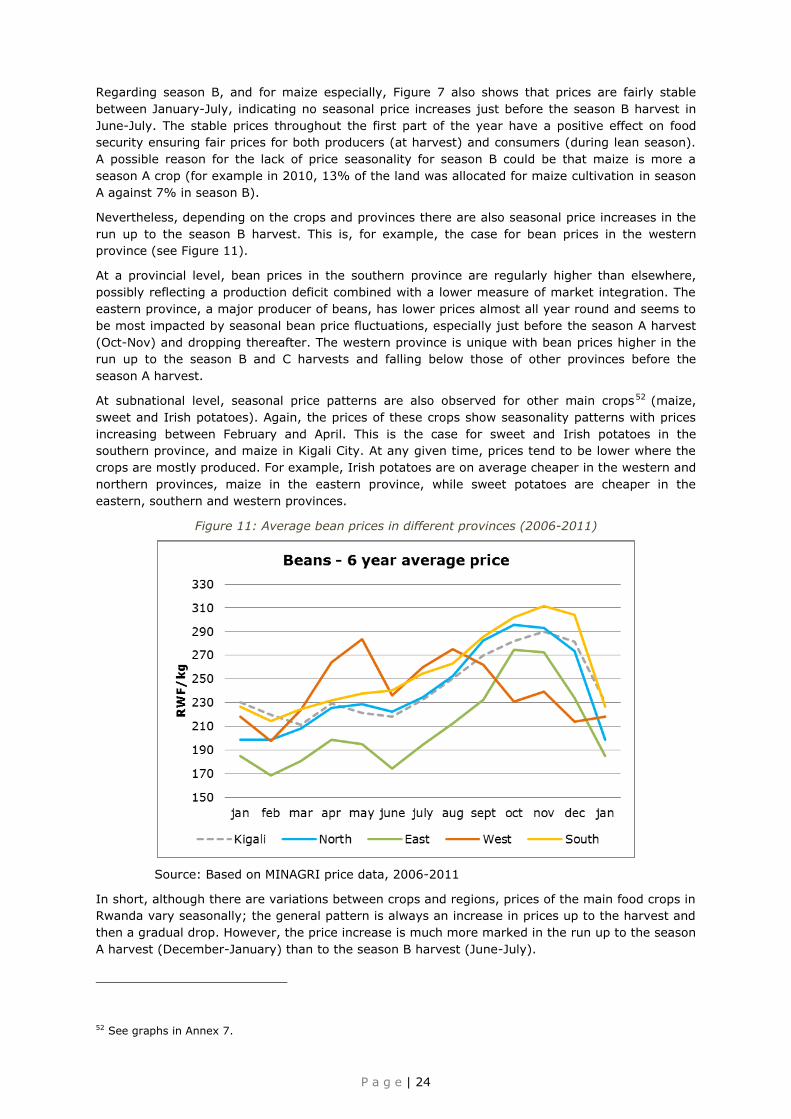
P a g e | 24
Regarding season B, and for maize especially, Figure 7 also shows that prices are fairly stable
between January-July, indicating no seasonal price increases just before the season B harvest in
June-July. The stable prices throughout the first part of the year have a positive effect on food
security ensuring fair prices for both producers (at harvest) and consumers (during lean season).
A possible reason for the lack of price seasonality for season B could be that maize is more a
season A crop (for example in 2010, 13% of the land was allocated for maize cultivation in season
A against 7% in season B).
Nevertheless, depending on the crops and provinces there are also seasonal price increases in the
run up to the season B harvest. This is, for example, the case for bean prices in the western
province (see Figure 11).
At a provincial level, bean prices in the southern province are regularly higher than elsewhere,
possibly reflecting a production deficit combined with a lower measure of market integration. The
eastern province, a major producer of beans, has lower prices almost all year round and seems to
be most impacted by seasonal bean price fluctuations, especially just before the season A harvest
(Oct-Nov) and dropping thereafter. The western province is unique with bean prices higher in the
run up to the season B and C harvests and falling below those of other provinces before the
season A harvest.
At subnational level, seasonal price patterns are also observed for other main crops52 (maize,
sweet and Irish potatoes). Again, the prices of these crops show seasonality patterns with prices
increasing between February and April. This is the case for sweet and Irish potatoes in the
southern province, and maize in Kigali City. At any given time, prices tend to be lower where the
crops are mostly produced. For example, Irish potatoes are on average cheaper in the western and
northern provinces, maize in the eastern province, while sweet potatoes are cheaper in the
eastern, southern and western provinces.
Figure 11: Average bean prices in different provinces (2006-2011)
Source: Based on MINAGRI price data, 2006-2011
In short, although there are variations between crops and regions, prices of the main food crops in
Rwanda vary seasonally; the general pattern is always an increase in prices up to the harvest and
then a gradual drop. However, the price increase is much more marked in the run up to the season
A harvest (December-January) than to the season B harvest (June-July).
52 See graphs in Annex 7.

P a g e | 25
Price stability
Figure 12 shows both the nominal price of maize, sweet potatoes, Irish potatoes and beans and
their 12-month moving averages, which represent long-term cycles once short-term fluctuations
are smoothed out. When the seasonal component is smoothed away, Irish potato and sweet potato
prices have been quite stable in the past few years, while beans and maize prices have been
showing higher long-term volatility, in particular between 2007 and 2009. In the last months of
2011, only maize prices showed an increasing trend.
Figure 12: Nominal prices and centred moving average trends (in RWF/kg, 2006-2011)
Source: Based on MINAGRI price data, 2006-2011
3.2.4 Market integration
Apart from national price trends, market functioning depends on how different markets are
integrated with each other. Market integration refers to co-movement in prices between different
markets, reflecting a supply effectively meeting market demand throughout the country. Market
integration is measured here (see Figure 14) by correlating monthly market prices between 2006-
2011, resulting in a score between 0 and 1.53
Overall, markets are reasonably well integrated for maize. Most variation in scores can be
explained by geographical distances and the quality of the transportation network. Kigali, the
northern and the eastern provinces are the best connected, (also see Figure 13 that shows co-
movement of prices between markets in these three provinces) probably because the East and
North are the main maize producing areas and are well connected to the capital by road. Markets
are least integrated between the western and eastern provinces; for instance the lowest
integration is 0.33 between Kirehe (East) and Ngororero (West) districts and between Gisenyi
(West) and Nyaruguru (South) districts and in both cases the markets are located in opposite parts
of the country.
53 A correlation of 1 between Kigali and Kirehe market means that if the price increases 50 RWF in Kirehe market, this is directly reflected by a 50 RWF price increase in Kigali market. A correlation of 0 between Kigali and Kirehe market means that there is no relation between the prices in Kigali and Kirehe and traders in one market are unresponsive to prices in the other.

P a g e | 26
The markets in the southern province, where production is lowest, are neither well integrated with
the rest of the country nor amongst each other. The picture for the western province is more
diverse with some markets in the more food insecure areas less well connected (Ngororero) to the
north and east. The Gisenyi market at the border with Congo is not well integrated with Kigali. A
more in depth and cross border analysis would probably show stronger connections with prices in
Congo. On the other hand Mukamira market in Nyabihu district (West) is relatively well integrated
with the northern province markets (probably again a matter of proximity).
Markets in districts with higher percentages of food insecure households are nearly as integrated
as the other markets, at least in the western province. For the southern province, lower levels of
market integration were observed for Nyamagabe and Nyaruguru, whose district market (Ndago),
has the lowest integration score of all markets. This probably reflects the fact that this market is
less easily supplied by traders in a maize deficit area and prices tend to be generally higher,
impeding the access of poorer households.
Looking at the market integration for other crops,54 beans show a remarkably high level of market
integration (0.8 on average), while sweet potatoes and Irish potatoes show low (0.48 and 0.64)
levels, of integration between the different district markets. This can be explained by geographical
differences in consumption patterns as beans are consumed equally throughout the country, while
Irish potatoes are consumed predominantly in the north and less in the South and sweet potatoes
the reverse - predominantly in the South and less in the North.
54 See Annex 6.

2
P a g e | 27
Figure 13: Co-variations of maize nominal prices in provinces of Kigali (grey), northern (red) and eastern provinces (green) (prices in RWF)
Source: based on MINAGRI price data, 2006-2011
Pa
ge
| 27
Figure 13: Co-variations of m
aize nominal prices in provinces of K
igali (grey), northern (red) and eastern provinces (green) (prices in RW
F)
S
ourc
e: b
ased o
n M
INAG
RI p
rice d
ata
, 2006-2
011
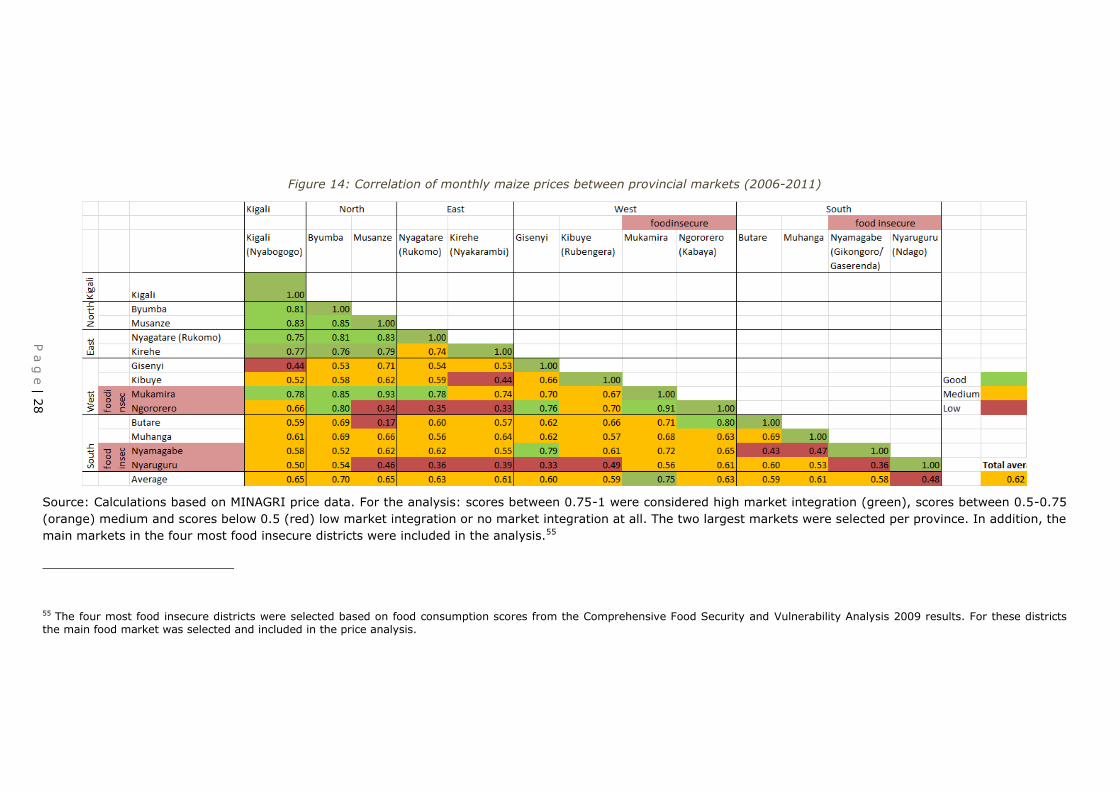
3
P a g e | 28
Figure 14: Correlation of monthly maize prices between provincial markets (2006-2011)
Source: Calculations based on MINAGRI price data. For the analysis: scores between 0.75-1 were considered high market integration (green), scores between 0.5-0.75
(orange) medium and scores below 0.5 (red) low market integration or no market integration at all. The two largest markets were selected per province. In addition, the
main markets in the four most food insecure districts were included in the analysis.55
55 The four most food insecure districts were selected based on food consumption scores from the Comprehensive Food Security and Vulnerability Analysis 2009 results. For these districts the main food market was selected and included in the price analysis.
Pa
ge
| 28
Figure 14: Correlation of m
onthly maize prices betw
een provincial markets (2006-2011)
Sourc
e: C
alc
ula
tions b
ased o
n M
INAG
RI p
rice d
ata
. For th
e a
naly
sis
: score
s b
etw
een 0
.75-1
were
consid
ere
d h
igh m
ark
et in
tegra
tion (g
reen), s
core
s b
etw
een 0
.5-0
.75
(ora
nge) m
ediu
m a
nd s
core
s b
elo
w 0
.5 (re
d) lo
w m
ark
et in
tegra
tion o
r no m
ark
et in
tegra
tion a
t all. T
he tw
o la
rgest m
ark
ets
were
sele
cte
d p
er p
rovin
ce. In
additio
n, th
e
main
mark
ets
in th
e fo
ur m
ost fo
od in
secure
dis
tricts
were
inclu
ded in
the a
naly
sis
.55
55 T
he fo
ur m
ost fo
od in
secure
dis
tricts
were
sele
cte
d b
ased o
n fo
od c
onsum
ptio
n s
core
s fro
m th
e C
om
pre
hensiv
e F
ood S
ecurity
and V
uln
era
bility
Analy
sis
2009 re
sults
. For th
ese d
istric
ts
the m
ain
food m
ark
et w
as s
ele
cte
d a
nd in
clu
ded in
the p
rice a
naly
sis
.
P a g e | 29
3.3 HALF OF HOUSEHOLDS HAVE DIFFICULTY ACCESSING FOOD
The CFSVA and Nutrition Survey 2012 household questionnaire asked whether households had
enough food or money to buy food during the last 12 months, and if they did not, they were
labelled as having ‘food access issues’.
For the analysis below, food access issues lasting for at least six months of the year and described
as ‘usual’ are considered chronic. Chronic food access insecurity can be characterized as a long-
term or persistent inability to access food to meet minimum food consumption requirements. If
food access issues were experienced for a total of less than six months a year, and they were not
reported to be usual, they are considered to be a short-term or temporary inability to meet
minimum food consumption requirements and qualified as ‘acute food access issues’. Seasonal
food access issues can be described as food access issues recurrent for less than six months a year
and considered by households as ‘usual’.
In total, almost half of all households do not have food access issues (49%). A fifth of all
households reported seasonal food access problems, 17% acute and 14% chronic problems,
adding up to a total of 51% of all households reporting some type of difficulty in accessing food in
the 12 months preceding the survey.
For the one fifth of all households in Rwanda that mentioned having had seasonal food access
problems, the shortages occurred in the lean seasons just before the two main harvests (from
March to May and from September to November - see Box 2 p.15). Much of the seasonality in food
insecurity can be linked to household level availability of food stocks (see Box 3 p.19), price trends
(see section 3.2.3 p.20) and - for some livelihood groups - to the availability of work (see section
4.2.2). The households most exposed to seasonal food insecurity were the poorest and those
relying most on seasonal work.
Households were asked how often they had used a list of five coping strategies in the seven days
prior to the survey.56 The information was used to compute a reduced coping strategy index (CSI)
that took into account both the frequency and gravity of the mechanisms used.57 Households that
mentioned using the coping strategies were further regrouped into three terciles (‘low’, ‘medium’
and ‘high’) reflecting the relative severity of their coping strategy index. While half of households
did not mention any coping strategies, the other half were re-categorised into three groups, each
representing 16.5% of all households, having a ‘low’, ‘medium’ or ‘high’ CSI.
Figure 15 shows that the average coping strategy index for households with chronic food access
issues was a lot higher than that of the other groups; 44% of households with chronic food access
problems have a high CSI compared to 22% for the other households mentioning food access
problems and 4% of those that did not mention any food access problems.58 This suggests that
households with chronic food access problems are more regularly reliant on severe coping
strategies than other households (also see Figure 16). In other words households with seasonal or
acute access problems can temporarily resolve their food access issues while households with
chronic access issues are more likely to be at a last resort stage.
56 The five coping strategies were 1) ‘relying on less preferred and less expensive foods’, 2) ‘borrowing food or relying on help from friends or relatives’, 3) ‘limiting portion size at meal times’, 4) ‘restricting consumption by adults in order for small children to eat’, and 5) ‘reducing number of meals eaten in a day’. 57 “Eating less-preferred/expensive foods”, “limiting portion size at meal time” and “reducing the number of meals per day” have a severity score of 1. “Borrowing food or relying on help of friends/relatives” and “limiting adult intake in order for small children to eat” have a severity score of 2 and 3 respectively. 58 Households with chronic food access issues had a CSI of 13 on average compared to two for households who did not have any access issues, and eight and seven for households with seasonal and acute issues respectively.

P a g e | 30
Figure 15: Food access groups, coping strategy index and coping strategy index terciles
Source: CFSVA and Nutrition Survey 2012
Figure 16: Average number of days coping strategies were used by households in the seven days preceding their interview, by type of food access problem reported
Source: CFSVA and Nutrition Survey 2012
3.4 ALMOST FOUR IN FIVE HOUSEHOLDS HAD ACCEPTABLE FOOD
CONSUMPTION IN MARCH/APRIL 2012
The diet diversity score or “food consumption score” (FCS) 59 is an internationally used WFP
standard score calculated by weighing the frequency of consumption (number of days per week) of
different food groups consumed by a household during the seven days that preceded the
interview. The different food items are reorganized into specific food groups. Consumption
frequencies of food items belonging to the same group are added up and values above seven are
recoded as seven.60 The value obtained for each food group is multiplied by its weight. The food
consumption score is the sum of the weighted food groups. Two thresholds (21 and 35) distinguish
three different food consumption levels (‘poor’, ‘borderline’ and ‘acceptable’, see Table 5 and
Figure 17).
59 See for Annex 2 for the detailed calculation. 60 As seven is the maximum number of days per week.
2
13
8 7
2
4
6
8
10
12
14
Noproblem
Chronic Seasonal Acute
CSI by food access problem
76%
10%
30% 30%
12%
16%
23% 24%
8%
30%
25% 24%
4%
44%
22% 22%
0%
10%
20%
30%
40%
50%
60%
70%
80%
90%
100%
No problem Chronic Seasonal Acute
CSI terciles by food access problem
No coping strategies Low CSI Medium CSI High CSI
.6
2.92.0 1.8 1.4.3
2.4
1.6 1.7
1.1
.3
2.1
1.2 1.2
.9
.1
1.2
.5 .5
.4
.1
1.0
.6 .6
.4
No problem Chronic Seasonal Acute Total
Restrict consumption byadults in order for smallchildren to eat
Borrow food, or rely on help
from a friend or relative
Reduce number of mealseaten in a day
Limit portion size atmealtimes
Rely on less preferred andless expensive foods
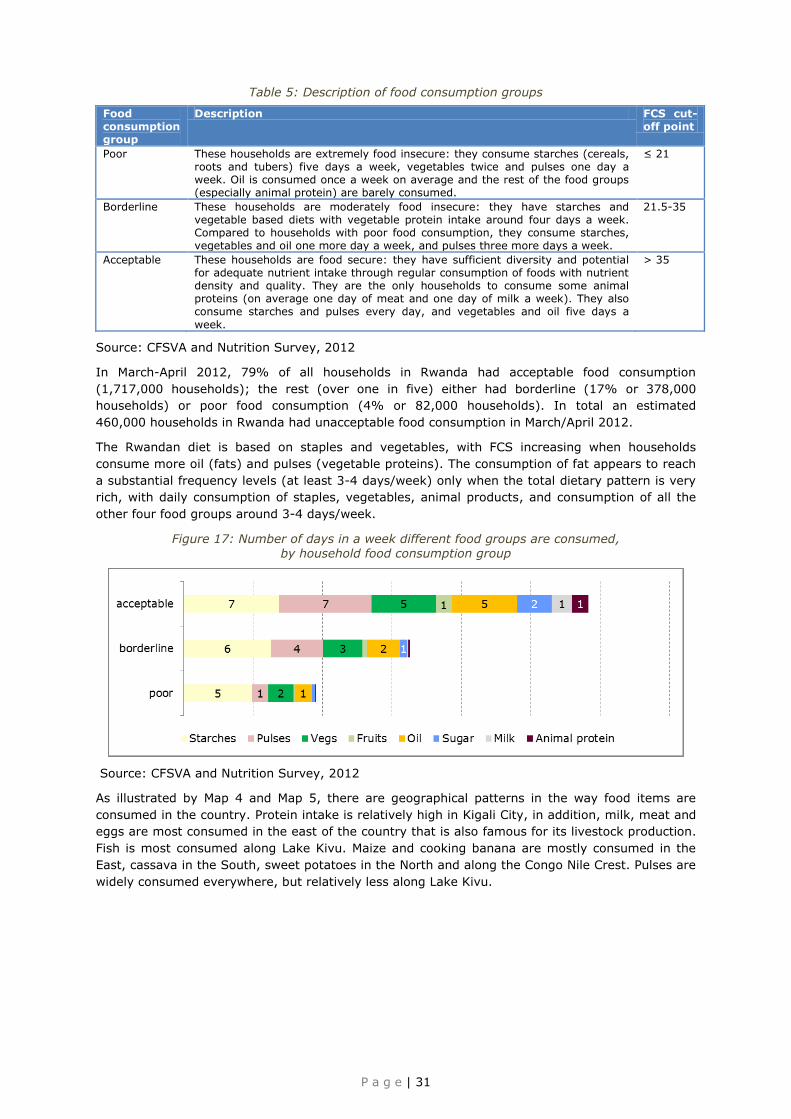
P a g e | 31
Table 5: Description of food consumption groups
Food consumption group
Description FCS cut-off point
Poor These households are extremely food insecure: they consume starches (cereals, roots and tubers) five days a week, vegetables twice and pulses one day a week. Oil is consumed once a week on average and the rest of the food groups (especially animal protein) are barely consumed.
≤ 21
Borderline These households are moderately food insecure: they have starches and vegetable based diets with vegetable protein intake around four days a week. Compared to households with poor food consumption, they consume starches, vegetables and oil one more day a week, and pulses three more days a week.
21.5-35
Acceptable These households are food secure: they have sufficient diversity and potential for adequate nutrient intake through regular consumption of foods with nutrient density and quality. They are the only households to consume some animal proteins (on average one day of meat and one day of milk a week). They also consume starches and pulses every day, and vegetables and oil five days a
week.
> 35
Source: CFSVA and Nutrition Survey, 2012
In March-April 2012, 79% of all households in Rwanda had acceptable food consumption
(1,717,000 households); the rest (over one in five) either had borderline (17% or 378,000
households) or poor food consumption (4% or 82,000 households). In total an estimated
460,000 households in Rwanda had unacceptable food consumption in March/April 2012.
The Rwandan diet is based on staples and vegetables, with FCS increasing when households
consume more oil (fats) and pulses (vegetable proteins). The consumption of fat appears to reach
a substantial frequency levels (at least 3-4 days/week) only when the total dietary pattern is very
rich, with daily consumption of staples, vegetables, animal products, and consumption of all the
other four food groups around 3-4 days/week.
Figure 17: Number of days in a week different food groups are consumed, by household food consumption group
Source: CFSVA and Nutrition Survey, 2012
As illustrated by Map 4 and Map 5, there are geographical patterns in the way food items are
consumed in the country. Protein intake is relatively high in Kigali City, in addition, milk, meat and
eggs are most consumed in the east of the country that is also famous for its livestock production.
Fish is most consumed along Lake Kivu. Maize and cooking banana are mostly consumed in the
East, cassava in the South, sweet potatoes in the North and along the Congo Nile Crest. Pulses are
widely consumed everywhere, but relatively less along Lake Kivu.

P a g e | 32
Box 4: Comparing levels of food consumption with neighbouring countries61
Even though one needs to be aware of limitations of comparing levels of food consumption
between countries, Table 5 below reports the latest available national percentages of households
with acceptable, borderline and poor food consumption for countries neighbouring Rwanda.
With 79% of households with unacceptable food consumption in the lean season nationwide,
Rwanda’s food consumption situation is comparable with that of Tanzania in 2010 and of Uganda
in 2012. Comparatively the food security situation depicted is considerably better than that of
neighbouring Burundi (2008) even after harvest, and the Democratic Republic of Congo.
Table 6: FCS in countries neighbouring Rwanda
Source: WFP CFSVAs
61 Limitations of international comparisons include that the calculation of food consumption score is heavily dependent on cultural dietary practices, that the national figures hide subnational disparities which can be very big especially when countries are very large and diverse, and that the measure of the food consumption score is very dependent on the timing of the data collection. One country may score better than another because the data was collected in a period of plenty while in the other country it was done in a lean season or after a bad harvest.
Country
Year of
CFSVA
publication
Period of
data
collection
% hh with
acceptable
FC
% hh with
borderline
FC
% hh with
poor FC Comments
Kenya 2012
Aug-Sept
2010 87% 8% 5%
Only densely populated
urban areas
Rwanda 2012
March - April
2012
(lean season) 79% 17% 4%
Tanzania 2010
Nov 2009 -
Jan 2010
(lean season) 77% 19% 4%
Uganda 2009
Oct - Nov
2008
(after
harvest) 72% 21% 6%
Uganda 2012
2010, whole
year 80% 16% 5%
Data aggregated by
households interviewed
over the course of the
year should ‘smooth’
over any seasonal
changes
Burundi 2008
Jun-Jul 2008
(after
harvest) 72% 23% 5%
Congo
DRC 2008
Jul 2007 and
Feb 2008 64% 30% 6%
Data collection was
done in two phases

P a g e | 33
Map 4: Percentage of households consuming eggs, milk, meat and fish at least once per week
Source: CFSVA and Nutrition Survey, 2012

P a g e | 34
Map 5: Percentage of households consuming cooking banana, bread, cassava, maize, pulses and
sweet potatoes at least four times per week
Source: CFSVA and Nutrition Survey, 2012

P a g e | 35
Box 5: Likely, but not confirmed, improvements in household food consumption since 2009
When looking at food consumption as described by the food consumption score, and while
adjusting the calculations in order to maintain comparability with 2006 and 2009, food
consumption has drastically improved since 2006 but does not appear to have improved a lot
between 2009 and 2012. In statistical terms - considering 95% confidence intervals - the results
of the 2012 CFSVA and Nutrition survey are not significantly different from those of the 2009
assessment when considering percentages of households with poor, borderline and acceptable food
consumption (see Figure 18). That said, it is important to discuss some of the factors that need to
be taken into account when comparing the estimated shares of food secure and insecure
households between 2009 and 2012.62
As already mentioned, the household survey provides only a snapshot of the food security
situation at the time of the survey, and seasonality in Rwanda plays a very important role,
especially in determining the levels of food stocks available for a household at a given time. Much
of the CFSVA and Nutrition Survey 2012 data collection took place a month later in the year than
that of 2009. For many households this represents a critical moment in the lean season. If one
refers to Figure 5 p. 19, there is a drop of around 15 percentage points between March and April in
the estimated percentage of households having food stocks from the previous harvests.
In other words, if the survey had taken place one month earlier in the year, the results would have
been more comparable in terms of seasonality, and it is likely that household food consumption
would have shown more significant improvements since 2009.
In fact, even though the improvements are not significant, the CFSVA and Nutrition Survey 2012
suggests that the estimates of the percentage of households with poor food consumption have
decreased by one percentage point while the percentage of households that can be considered to
be food secure has remained roughly the same, with perhaps a slight increase in the estimate of
households with borderline food consumption. Looking at the provincial level,63 results seem to
indicate that the only increases - if any - in the percentage of food insecure households are to be
attributed to a higher percentage of households with borderline food consumption. The situation in
the western province appears to be slightly worse than in 2009 with increases in the share of
households with borderline food consumption, whereas in other provinces the differences are
minimal. At sub provincial level no clear patterns emerge in terms of differences between 2009
and 2012.
62 Besides the limitations in comparability mentioned in the methodology section of the report. 63 Differences are again not statistically significant.
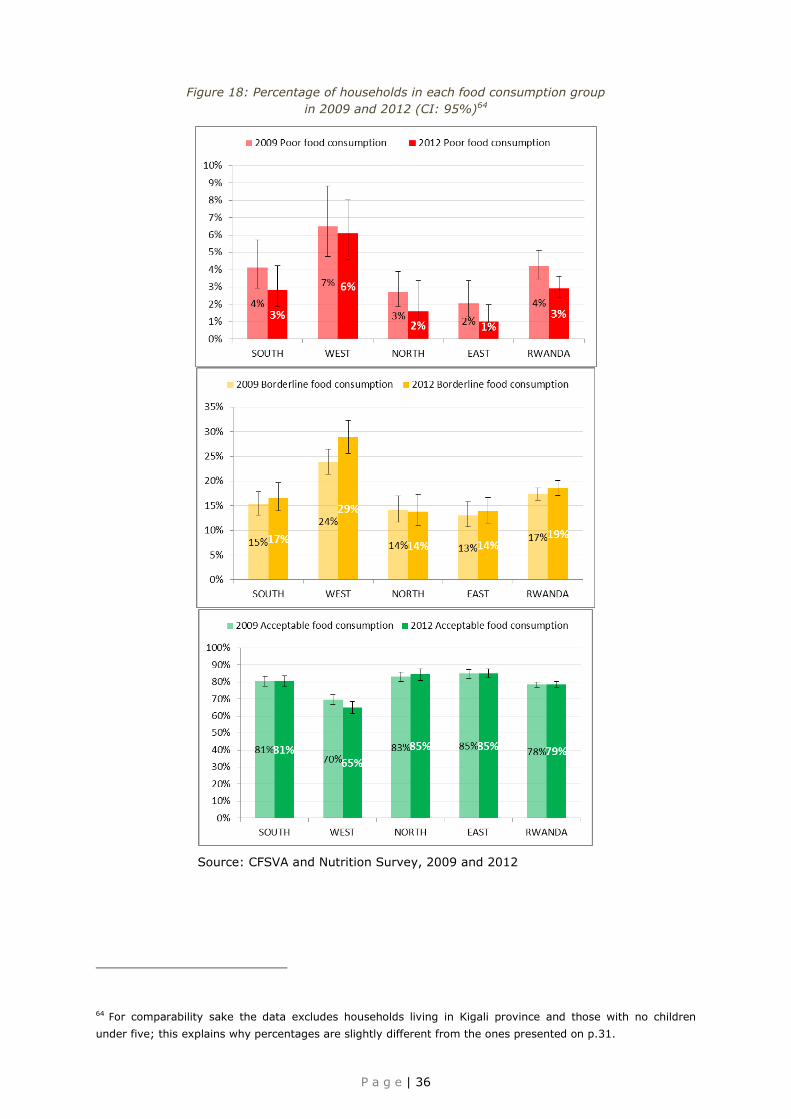
P a g e | 36
Figure 18: Percentage of households in each food consumption group
in 2009 and 2012 (CI: 95%)64
Source: CFSVA and Nutrition Survey, 2009 and 2012
64 For comparability sake the data excludes households living in Kigali province and those with no children
under five; this explains why percentages are slightly different from the ones presented on p.31.

P a g e | 37
3.5 ACCEPTABLE LEVELS OF ACUTE MALNUTRITION BUT STILL
ALARMINGLY HIGH RATES OF CHRONIC MALNUTRITION FOR
CHILDREN UNDER FIVE
A child’s full potential for survival, normal growth, and cognitive development is predetermined by
conditions in intra-uterine life beginning at conception. Post-natal conditions determine whether
that potential is achieved. Malnourished children cannot fulfil their development potential. Because
stunted growth in childhood is a risk factor for increased mortality, poor cognitive and physical
development and other impairments, stunted children may do badly in school and have low
productivity in adulthood; as a result they pass on poverty, food insecurity, malnutrition and
deprivation to future generations.
According to the 2010 DHS, more than one third (38%) of children age 6-59 months are
anaemic.65 Anaemia is highest among children under 12 months old (69-70%) and declines with
age (falling to 25% amongst children aged 48-59 months). It is higher in boys (41%) than girls
(35%). Children of uneducated mothers and those from poor households are more likely to be
anaemic (43% in lowest wealth quintile compared to 36% in each of the three highest quintiles).
The highest regional prevalence of anaemia is found in the eastern province (43%) and lowest
prevalence in the northern province (31%).
For the CFSVA and Nutrition Survey 2012, 4651 children under five years old were measured for
their age, weight and height or length in order to calculate levels of stunting, wasting and
underweight.66 These three nutritional indicators are expressed in standard deviation (SD) units
(z-score) from the median of the 2006 WHO reference standards, with cut-offs set at -2 SD and -3
SD.67 The main purpose of collecting nutrition data was to explore linkages between food security
and malnutrition. Still, the survey provides unbiased estimates of the main malnutrition indicators.
The results of the CFSVA and Nutrition Survey 2012 are relatively precise at provincial and country
level; at district level the estimates are less precise but where needed confidence intervals are
given. The calculated prevalences for all three indicators are very much in line with the 2010 DHS
results.68 They also confirm the estimates of malnutrition provided by the Food and Nutrition
Security Monitoring System (FNSMS) rounds (September 2010, March 2011 and September 2011).
As shown by Table 7, in Rwanda, the rate of acute malnutrition (or wasting) measured by weight
for height and confirmed by MUAC measurements is relatively low at 3.6% (CI 3.1-4.3%) and is
within ’acceptable’69 limits.70 , 71 On the contrary, and despite the success in reducing poverty
levels, levels of chronic malnutrition (stunting) among children between 6-59 months old has
remained ‘very high’72 over the last 20 years: 49% in 1992, 51% in 2005, 44% in 201073 and 43%
65 24% mild, 14% moderate , 1% severe. 66 In general, stunting (height-for-age z-score = HAZ) reflects an assessment of body growth and is often referred to as chronic malnutrition. Wasting (weight-for-height z-score = WHZ) is an indicator for acute malnutrition or thinness, whereas underweight (weight-for-age z-score = WAZ) is a measurement of both acute and chronic malnutrition. While wasting can be the result of an acute insufficiency, mainly a calorie-reduced diet or acute disease (commonly diarrhoea), several nutrient deficiencies probably occur simultaneously in growth-stunted children. 67 Cases with unreasonable results were excluded (flagged) from the analysis for each specific indicator. Some degree of height rounding was observed. The errors in measurement are likely to increase the standard deviation of the z-scores, and will also decrease the strength of observed associations between nutritional status and other indicators, particularly when observing the mean z-scores. However, if the rounding/heaping errors are randomly biased up or down, the effect on observed prevalence will be less. 68 The results confirm those of the DHS; no significant differences in levels of malnutrition could be observed between the two surveys. 69 WHO,1995. Cut-off values for public health significance. http://www.who.int/nutgrowthdb/en. Wasting below 5% is considered ‘acceptable’. 70 These percentages include children diagnosed with oedema. The prevalence of oedema in the sample was higher than expected. 71 Acute malnutrition can fluctuate seasonally or from one year to the other but in Rwanda the rates of acute malnutrition remain stable. Stunting is usually less likely to change dramatically. 72 WHO,1995. Cut-off values for public health significance. http://www.who.int/nutgrowthdb/en. Stunting above 40% is considered ‘very high’. The stunting prevalence can be qualified as ‘critical’ according to the ‘Measuring and interpreting malnutrition and mortality manual (WFP, 2005)’.
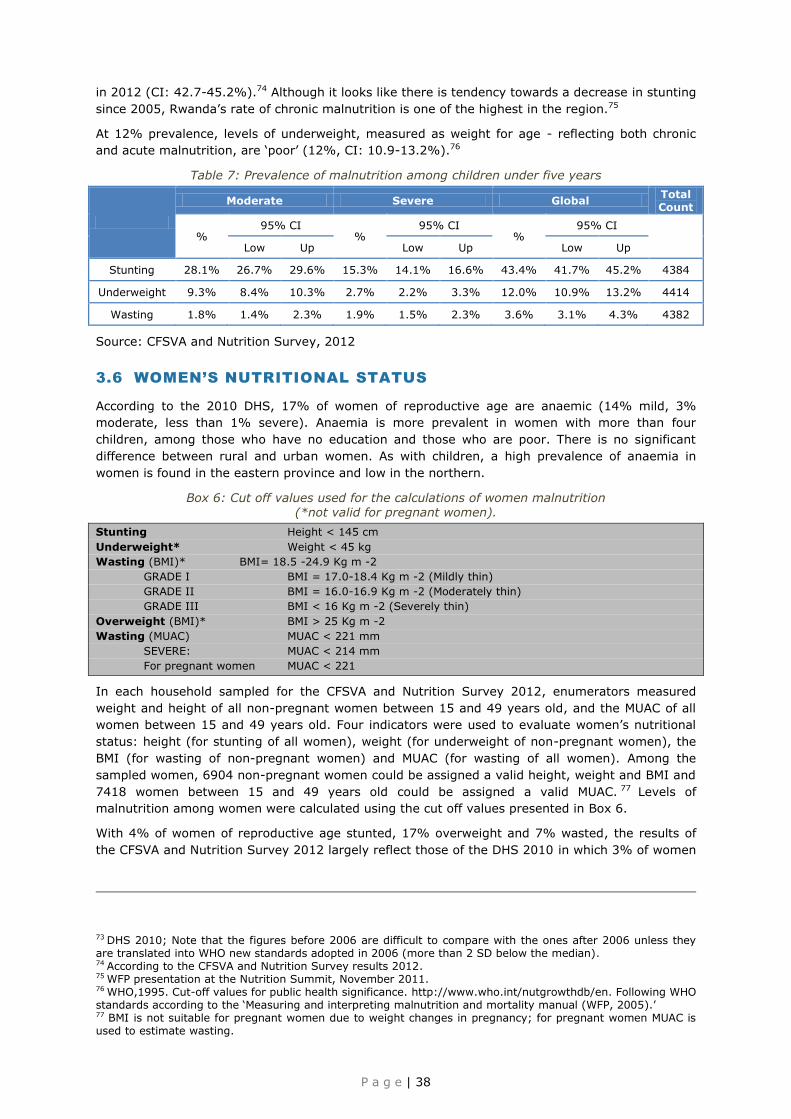
P a g e | 38
in 2012 (CI: 42.7-45.2%).74 Although it looks like there is tendency towards a decrease in stunting
since 2005, Rwanda’s rate of chronic malnutrition is one of the highest in the region.75
At 12% prevalence, levels of underweight, measured as weight for age - reflecting both chronic
and acute malnutrition, are ‘poor’ (12%, CI: 10.9-13.2%).76
Table 7: Prevalence of malnutrition among children under five years
Moderate Severe Global Total Count
% 95% CI
% 95% CI
% 95% CI
Low Up Low Up Low Up
Stunting 28.1% 26.7% 29.6% 15.3% 14.1% 16.6% 43.4% 41.7% 45.2% 4384
Underweight 9.3% 8.4% 10.3% 2.7% 2.2% 3.3% 12.0% 10.9% 13.2% 4414
Wasting 1.8% 1.4% 2.3% 1.9% 1.5% 2.3% 3.6% 3.1% 4.3% 4382
Source: CFSVA and Nutrition Survey, 2012
3.6 WOMEN’S NUTRITIONAL STATUS
According to the 2010 DHS, 17% of women of reproductive age are anaemic (14% mild, 3%
moderate, less than 1% severe). Anaemia is more prevalent in women with more than four
children, among those who have no education and those who are poor. There is no significant
difference between rural and urban women. As with children, a high prevalence of anaemia in
women is found in the eastern province and low in the northern.
Box 6: Cut off values used for the calculations of women malnutrition (*not valid for pregnant women).
Stunting Height < 145 cm
Underweight* Weight < 45 kg
Wasting (BMI)* BMI= 18.5 -24.9 Kg m -2
GRADE I BMI = 17.0-18.4 Kg m -2 (Mildly thin)
GRADE II BMI = 16.0-16.9 Kg m -2 (Moderately thin)
GRADE III BMI < 16 Kg m -2 (Severely thin)
Overweight (BMI)* BMI > 25 Kg m -2
Wasting (MUAC) MUAC < 221 mm
SEVERE: MUAC < 214 mm
For pregnant women MUAC < 221
In each household sampled for the CFSVA and Nutrition Survey 2012, enumerators measured
weight and height of all non-pregnant women between 15 and 49 years old, and the MUAC of all
women between 15 and 49 years old. Four indicators were used to evaluate women’s nutritional
status: height (for stunting of all women), weight (for underweight of non-pregnant women), the
BMI (for wasting of non-pregnant women) and MUAC (for wasting of all women). Among the
sampled women, 6904 non-pregnant women could be assigned a valid height, weight and BMI and
7418 women between 15 and 49 years old could be assigned a valid MUAC. 77 Levels of
malnutrition among women were calculated using the cut off values presented in Box 6.
With 4% of women of reproductive age stunted, 17% overweight and 7% wasted, the results of
the CFSVA and Nutrition Survey 2012 largely reflect those of the DHS 2010 in which 3% of women
73 DHS 2010; Note that the figures before 2006 are difficult to compare with the ones after 2006 unless they are translated into WHO new standards adopted in 2006 (more than 2 SD below the median). 74 According to the CFSVA and Nutrition Survey results 2012. 75 WFP presentation at the Nutrition Summit, November 2011. 76 WHO,1995. Cut-off values for public health significance. http://www.who.int/nutgrowthdb/en. Following WHO standards according to the ‘Measuring and interpreting malnutrition and mortality manual (WFP, 2005).’ 77 BMI is not suitable for pregnant women due to weight changes in pregnancy; for pregnant women MUAC is used to estimate wasting.
P a g e | 39
of reproductive age were stunted, 16% overweight and 7% wasted.78 The CFSVA and Nutrition
Survey 2012 further found that 5% of pregnant women are wasted (MUAC).
Box 7: Summary - The state of food security and nutrition in Rwanda in 2012
Food production is increasing in Rwanda, markets are functioning relatively well and food is flowing
easily within and outside the country thanks to the well-connected road network and market
infrastructure in Rwanda.
Markets constitute the first source of food for households, provide, on average, 65% of the food
consumed by a household; followed by household own production contributing an average of 30%.
A substantial amount of household expenses are spent on food (48%). While district markets
around the country are well connected by road, translating into reasonably good market
integration and price stability, for some rural households it is difficult to get to and from the
market.
Although there are variations between crops and regions, prices of the main food crops in Rwanda
vary seasonally, the general pattern is always an increase in prices up to the harvest and then a
gradual drop. However, the price increase is much more marked in the run up to the season A
harvest that takes place in December-January, than to the season B harvest (June-July).
Seasonal price variations of staple crops are an important constraint to household access to food,
especially during the lean seasons when household food stocks have run out and more people are
market dependent. Around December/January more than 60% of all households in Rwanda had
some food stocks from their (relatively good) 2012 season A harvest. This percentage decreases to
around 15% in May just before the season B harvest. In June, after season B harvest, almost 60%
of households again have food stocks.
One fifth (20%) of all households mentioned recurrent seasonal problems providing food to their
families during the year (seasonal food access problems), 17% of all households experienced
unusual difficulties at some point during the year in providing their families with food (acute food
access problems), and 14% encounter these problems most of the year (chronic food access
problems). This adds up to a total of 51% of all households reporting some type of difficulty in
accessing food in the 12 months preceding the survey.
In March/April 2012, just a few months before the season B harvest, around 1,717,000
households, representing 79% of all households in Rwanda, had acceptable food consumption. The
rest of the households (more than one in five - 21% - about 460,000) had unacceptable food
consumption and could be considered to be food insecure. These either had poor food consumption
(82,000 households, representing 4% of all households) or borderline food consumption patterns
(378,000 households, 17%). This shows clear improvement since the 2006 CFSVA and seems to
indicate a slight, although not confirmed, improvement in household food consumption since the
last CFSVA and Nutrition survey was conducted in February-March 2009.
Acute malnutrition among children between six months and five years is the only nutrition
indicator within ’acceptable’ limits (3.6%). The prevalence of chronic malnutrition (indicated by
stunting) among children between six months and five years is 43% and has remained ‘very high’
in Rwanda over the last 20 years. The prevalence of underweight, which reflects both chronic and
acute malnutrition, is ‘poor’ (12%). Among women of reproductive age 4% are stunted, 17%
overweight and 7% wasted. In addition, 5% of pregnant women are wasted (MUAC).
78 Percentage of wasted women was also measured in the 2009 CFSVA and Nutrition survey and the results were very similar.

P a g e | 40
4 UNDERSTANDING THE ISSUES BEHIND POOR FOOD
CONSUMPTION AND CHRONIC MALNUTRITION IN
RWANDA
Food production is increasing and food is flowing relatively easily within and outside the country.
Yet food access is problematic for half of all households in Rwanda. At least one fifth of Rwandan
households had poor food consumption in March/April 2012 and 43% of children under five are
chronically malnourished (46% in rural areas). This chapter looks at why some households have
poor food consumption or have members of their households malnourished and others not. It
discusses the parameters that were found to have significant causal relations as identified by the
CFSVA and Nutrition Survey 2012 analysis. General Linear Model (GLM) and multivariate logistic
regressions were used to isolate the key underlying factors affecting food consumption and
nutrition in Rwanda.
After correcting for all the other variables in the model, the variables found to be statistically
significant to explain household food consumption are:
Location (livelihood zones, urban/rural, distance to the main road, distance to the nearest
market)
Household livelihoods and wealth (livelihood groups, number of income activities,
household wealth)
Agriculture (size of land cultivated in season A, crop diversity, ownership of livestock,
cultivating a kitchen garden, whether the household still had food in stock from the last
harvest in April)
Household demographics (education of the household head, age of the head of household,
household size, crowding)
The variables found to be statistically significant to explain child stunting are:
Location (urban/rural, livelihood zones, distance to nearest hospital, slope)
Child age, sex and size at birth
Mother’s age, level of education, nutrition status (stunting)
Household wealth, crowding index
Child food consumption (for children between 12 and 23 months)
Factors that are known to influence malnutrition outcomes were included in the stunting model to
avoid confounding effects. They include child access to health services and source and treatment
of water consumed in the household. They are described in Box 8. A separate model was run for
children between 12 and 23 months to isolate the effect of their consumption and feeding
practices. The details of all the models are provided in Annex 11.
Table 8 gives an overview of these variables as well as their effect (positive, negative or no
demonstrated effect) on either food consumption score or stunting. In the following paragraphs
these variables are contextualized and discussed following the logic of the overall framework
presented in the first part of this report. They are grouped into: individual level factors/immediate
causes (section 4.1 What are the individual factors that determine child stunting?), household
level/underlying causes (section 4.2 What households are food insecure or have stunted children?)
and community level factors/basic causes (section 4.3 Where do the food insecure households and
the malnourished children live?).
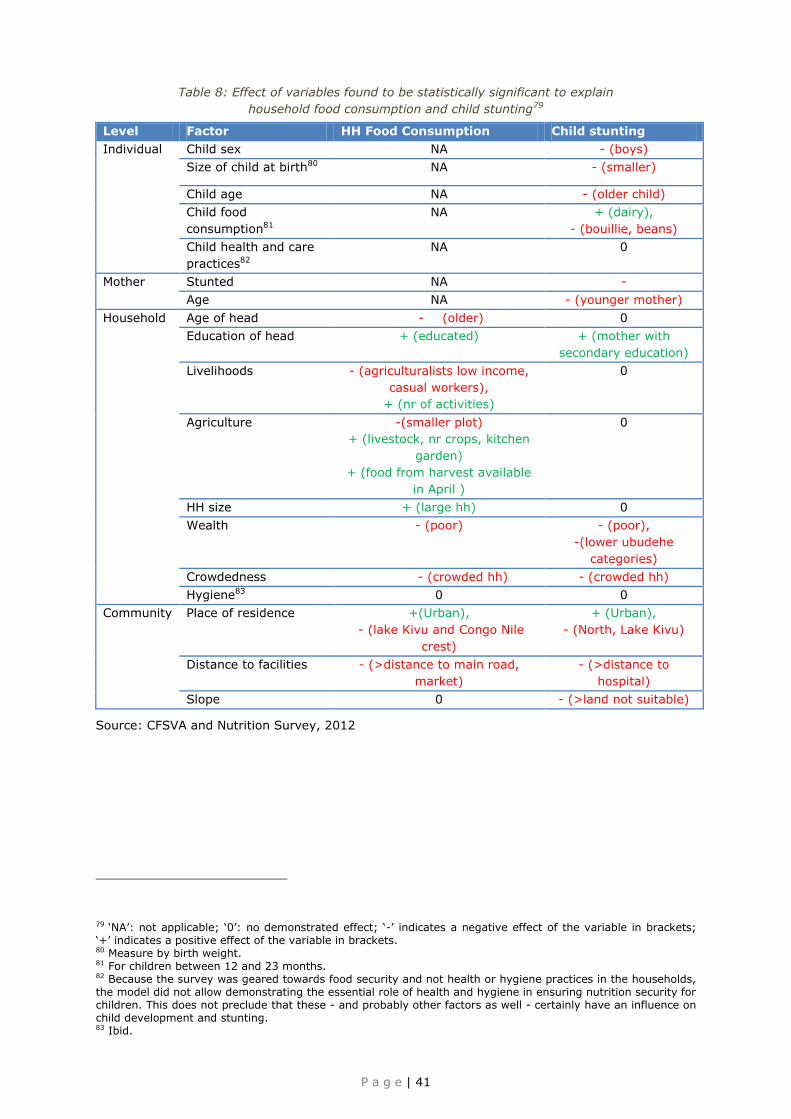
P a g e | 41
Table 8: Effect of variables found to be statistically significant to explain
household food consumption and child stunting79
Level Factor HH Food Consumption Child stunting
Individual Child sex NA - (boys)
Size of child at birth80 NA - (smaller)
Child age NA - (older child)
Child food
consumption81
NA + (dairy),
- (bouillie, beans)
Child health and care
practices82
NA 0
Mother Stunted NA -
Age NA - (younger mother)
Household Age of head - (older) 0
Education of head + (educated) + (mother with
secondary education)
Livelihoods - (agriculturalists low income,
casual workers),
+ (nr of activities)
0
Agriculture -(smaller plot)
+ (livestock, nr crops, kitchen
garden)
+ (food from harvest available
in April )
0
HH size + (large hh) 0
Wealth - (poor) - (poor),
-(lower ubudehe
categories)
Crowdedness - (crowded hh) - (crowded hh)
Hygiene83 0 0
Community Place of residence +(Urban),
- (lake Kivu and Congo Nile
crest)
+ (Urban),
- (North, Lake Kivu)
Distance to facilities - (>distance to main road,
market)
- (>distance to
hospital)
Slope 0 - (>land not suitable)
Source: CFSVA and Nutrition Survey, 2012
79 ‘NA’: not applicable; ‘0’: no demonstrated effect; ‘-’ indicates a negative effect of the variable in brackets; ‘+’ indicates a positive effect of the variable in brackets. 80 Measure by birth weight. 81 For children between 12 and 23 months. 82 Because the survey was geared towards food security and not health or hygiene practices in the households, the model did not allow demonstrating the essential role of health and hygiene in ensuring nutrition security for children. This does not preclude that these - and probably other factors as well - certainly have an influence on child development and stunting. 83 Ibid.

P a g e | 42
4.1 WHAT ARE THE INDIVIDUAL FACTORS THAT DETERMINE
CHILD STUNTING?
The conceptual framework around which this CFSVA and Nutrition Survey 2012 (see Figure 1) is
built suggests two immediate causes of malnutrition: inadequate dietary intake and unsatisfactory
health. The stunting analysis model included these variables and also accounted for non-contextual
variables that are known to impact strongly on the nutritional status of the children. At individual
level, the model only found the following variables to be significant predictors of child chronic
malnutrition: size of child at birth,84 a child’s age, sex, food consumption (12-23 month olds), as
well as the mother’s age, level of stunting and education.
4.1.1 Intergenerational cycle of chronic malnutrition
Stunting is described as the outcome of a failure to receive adequate nutrition over an extended
period and is also affected by recurrent or chronic illness.85 In addition, mothers’ health and
nutritional status are extremely important for the intra-uterine growth development of children.
Poor nutritional status of mothers impairs the physical and cognitive development of the children
even before they are born.
The CFSVA and Nutrition Survey 2012 results show that stunted mothers are more likely to have
stunted children (see Figure 19). Mothers who have completed secondary school are much less
likely to have stunted children (see Figure 20), confirming the findings of the 2010 DHS, which
found that stunting prevalence was 52% among children whose mother had no education, falling
to 45% among children whose mother had been to primary school and only 23% if the mother had
completed secondary school.86
The younger the mother the more likely her children are to be stunted.
Figure 19: Rates of child stunting by mother’s nutritional status
Source: CFSVA and Nutrition Survey, 2012
Figure 20: Rates of stunting by level of mother’s education
Source: CFSVA and Nutrition Survey, 2012
84 Measured by birth weight. 85 DHS 2010. 86 DHS 2010.
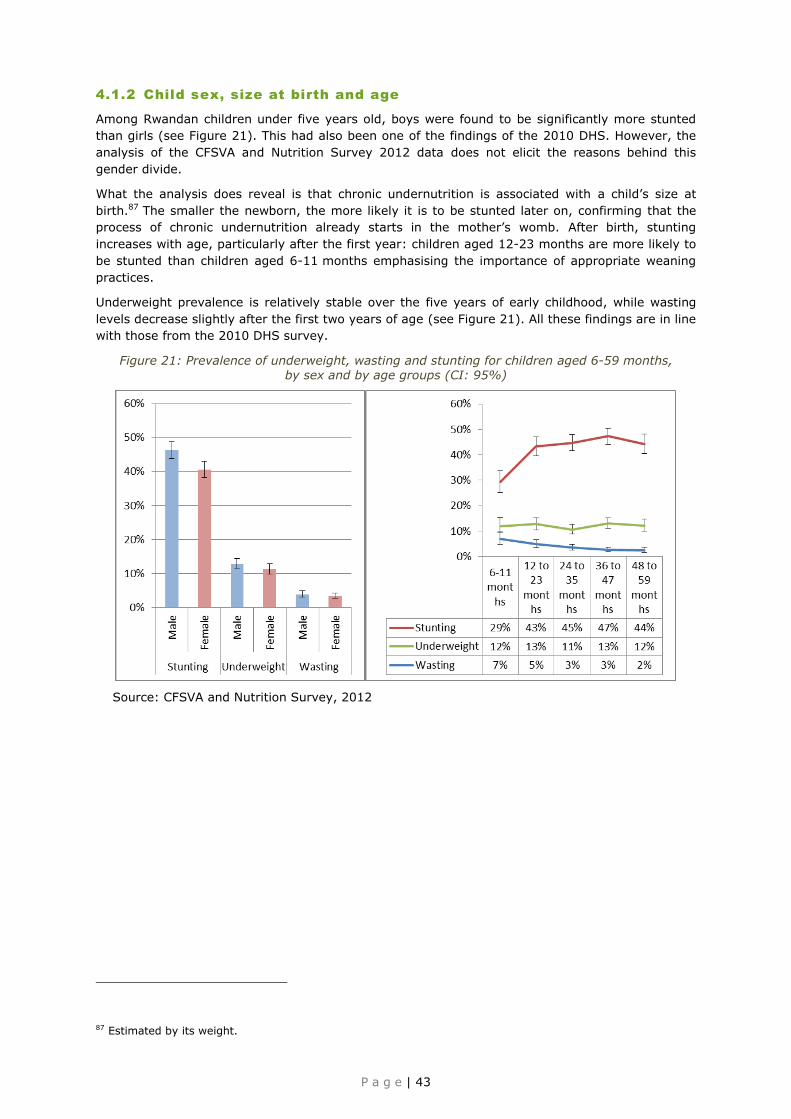
P a g e | 43
4.1.2 Child sex, size at birth and age
Among Rwandan children under five years old, boys were found to be significantly more stunted
than girls (see Figure 21). This had also been one of the findings of the 2010 DHS. However, the
analysis of the CFSVA and Nutrition Survey 2012 data does not elicit the reasons behind this
gender divide.
What the analysis does reveal is that chronic undernutrition is associated with a child’s size at
birth.87 The smaller the newborn, the more likely it is to be stunted later on, confirming that the
process of chronic undernutrition already starts in the mother’s womb. After birth, stunting
increases with age, particularly after the first year: children aged 12-23 months are more likely to
be stunted than children aged 6-11 months emphasising the importance of appropriate weaning
practices.
Underweight prevalence is relatively stable over the five years of early childhood, while wasting
levels decrease slightly after the first two years of age (see Figure 21). All these findings are in line
with those from the 2010 DHS survey.
Figure 21: Prevalence of underweight, wasting and stunting for children aged 6-59 months,
by sex and by age groups (CI: 95%)
Source: CFSVA and Nutrition Survey, 2012
87 Estimated by its weight.
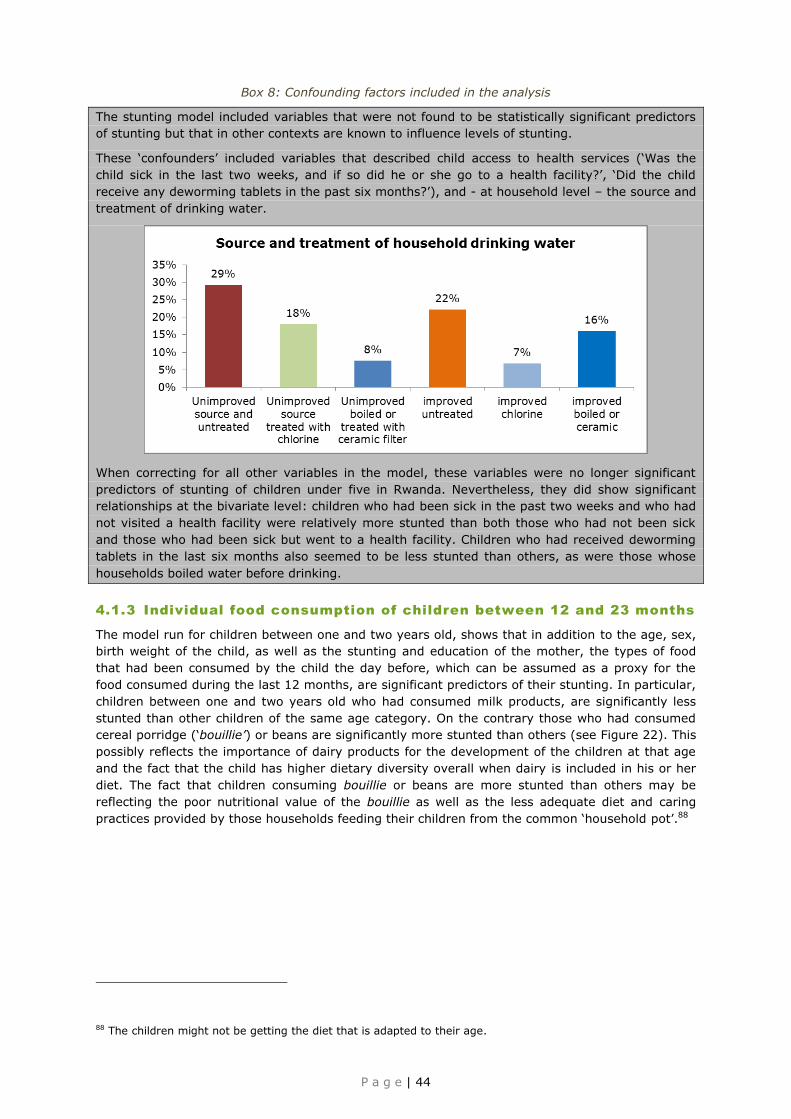
P a g e | 44
Box 8: Confounding factors included in the analysis
The stunting model included variables that were not found to be statistically significant predictors
of stunting but that in other contexts are known to influence levels of stunting.
These ‘confounders’ included variables that described child access to health services (‘Was the
child sick in the last two weeks, and if so did he or she go to a health facility?’, ‘Did the child
receive any deworming tablets in the past six months?’), and - at household level – the source and
treatment of drinking water.
When correcting for all other variables in the model, these variables were no longer significant
predictors of stunting of children under five in Rwanda. Nevertheless, they did show significant
relationships at the bivariate level: children who had been sick in the past two weeks and who had
not visited a health facility were relatively more stunted than both those who had not been sick
and those who had been sick but went to a health facility. Children who had received deworming
tablets in the last six months also seemed to be less stunted than others, as were those whose
households boiled water before drinking.
4.1.3 Individual food consumption of children between 12 and 23 months
The model run for children between one and two years old, shows that in addition to the age, sex,
birth weight of the child, as well as the stunting and education of the mother, the types of food
that had been consumed by the child the day before, which can be assumed as a proxy for the
food consumed during the last 12 months, are significant predictors of their stunting. In particular,
children between one and two years old who had consumed milk products, are significantly less
stunted than other children of the same age category. On the contrary those who had consumed
cereal porridge (‘bouillie’) or beans are significantly more stunted than others (see Figure 22). This
possibly reflects the importance of dairy products for the development of the children at that age
and the fact that the child has higher dietary diversity overall when dairy is included in his or her
diet. The fact that children consuming bouillie or beans are more stunted than others may be
reflecting the poor nutritional value of the bouillie as well as the less adequate diet and caring
practices provided by those households feeding their children from the common ‘household pot’.88
88 The children might not be getting the diet that is adapted to their age.

P a g e | 45
Table 9: Percentage of 12 - 23 month olds consuming certain food items the day before the survey
Food item Share of children aged 12-23 months
having consumed the items the day
before
Milk products 20%
Infant formula 2%
Porridge 65%
Eggs 3%
Beans 52%
Source: CFSVA and Nutrition Survey, 2012
At the bivariate level, eggs and infant formula were found to have a positive effect on chronic
malnutrition. However, when correcting for all other factors in the model they were not found to be
significant, probably because the effect of the infant formula and eggs was difficult to determine
since only 2% and 3% respectively of children were reported to have consumed them on the
previous day (see Table 9).
Figure 22: Effect of consumption of various foods on stunting of children aged 12-23 months89
Source: CFSVA and Nutrition Survey, 2012
89 The types of foods that had been consumed by the child the day before the survey, are assumed as a proxy for the food consumed during the last 12 months. The label ‘(ns)’ in the table indicates that the difference was not found to be statistically significant. Other variables included in the model as ‘confounding factors were child consumed meat the day before and child consumed tubers the day before.

P a g e | 46
Box 9: Summary - Immediate causes of high levels of stunting in Rwanda
The CFSVA and Nutrition survey 2012 reveals the following factors as individual/immediate causes
of stunting in children under five years:
o Young mothers, mothers who have not completed secondary education and mothers who are
stunted themselves are more likely to have stunted children.
o Individual factors: the smaller the baby at birth, the more likely it is to be stunted later on.
After birth, stunting levels increase with age, particularly after the first year. In Rwanda, boys
are more stunted than girls.
o Child food consumption: The types of foods consumed by children90 the day before the survey,
which can be assumed as a proxy for the food consumed during the last 12 months, were
significant predictors of their stunting. In particular, children between one and two years old
who had consumed milk products, were significantly less stunted than other children of the
same age category.
4.2 WHAT HOUSEHOLDS ARE FOOD INSECURE OR HAVE STUNTED
CHILDREN?
This section looks into the underlying household level factors that determine household food
consumption and child stunting.
4.2.1 Poor households
Lower ubudehe categories91
Since 2006, the government of Rwanda has generalized a system of classifying all Rwandan
households into six categories that reflect their poverty. The categories should be based on criteria
related to food insecurity and malnutrition. The broad description of each category is provided in
Table 10.
Table 10: Description of ubudehe categories
Category Description
1: Umutindi nyakujya (those in abject poverty)
Those who need to beg to survive. They have no land or livestock and lack shelter, adequate clothing and food. They are often sick and have no access to medical care. Their children are malnourished and they cannot afford to send them to school.
2: Umutindi (the very poor)
The main difference between the umutindi and the umutindi nyakujya is that this group is physically capable of working on land owned by others, although they themselves have either no land or very small landholdings, and no livestock.
3: Umukene (the poor)
These households have some land and housing. They live on their own labour and produce, and have no savings. They can eat, even if the food is not very nutritious. However they do not have a surplus to sell in the market. Their children do not always go to school and they often have no access to healthcare.
4: Umukene wifashije (the resourceful poor)
This group shares many of the characteristics of the umukene but, in addition, they have small ruminants and their children go to primary school.
5: Umukungu (the food rich)
This group has larger landholdings with fertile soil and enough to eat. They have livestock, often have paid jobs, and can access healthcare.
6: Umukire (the money rich)
This group has land and livestock, and often has salaried jobs. They have good housing, often own a vehicle, and have enough money to lend and get credit from banks. Many migrate to urban centres.
Source: Adapted from MINALOC
90 Children between 12 and 23 months. 91 While the survey was on-going, MINALOC was readjusting the ubudehe categories. It is possible that in some cases households did not report their ‘latest status’ as registered by MINALOC or chose not to answer this question. The new ubudehe categories were not available at the time of the analysis of the CFSVA and Nutrition Survey data, so the reported ubudehe categories were analysed. These findings should be handled with care and confirmed with more accurate data as soon as the up-to-date household classification is available.
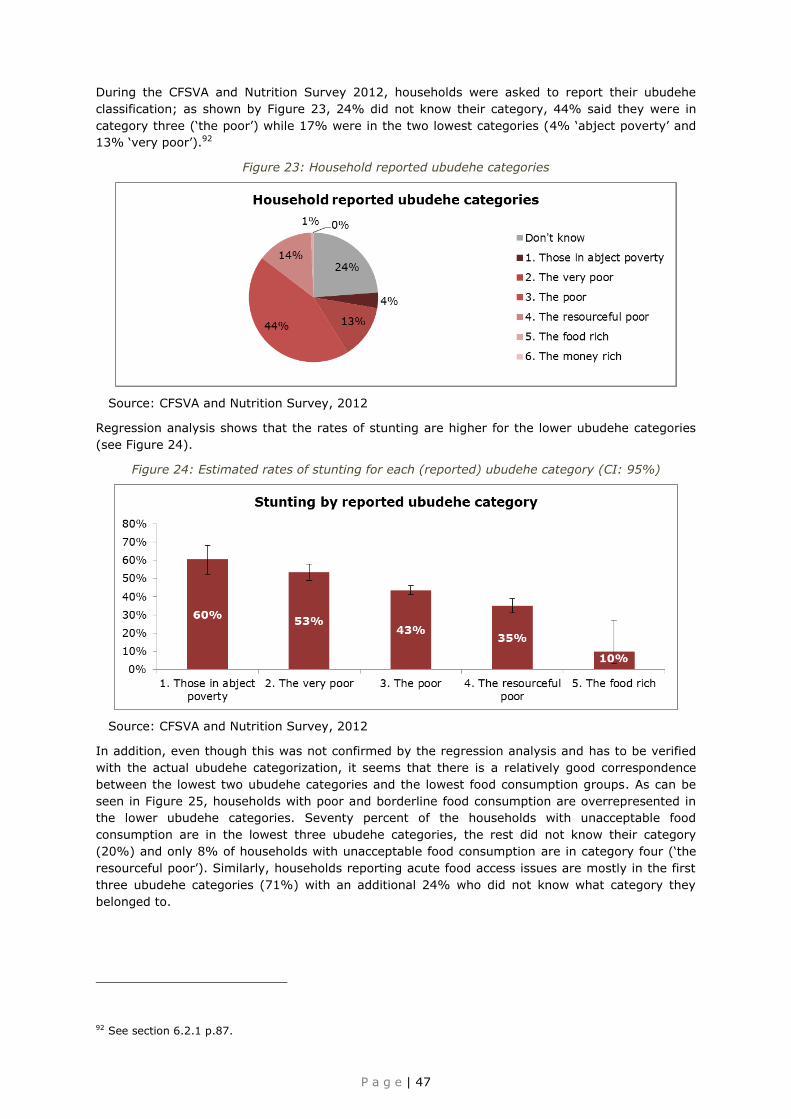
P a g e | 47
During the CFSVA and Nutrition Survey 2012, households were asked to report their ubudehe
classification; as shown by Figure 23, 24% did not know their category, 44% said they were in
category three (‘the poor’) while 17% were in the two lowest categories (4% ‘abject poverty’ and
13% ‘very poor’).92
Figure 23: Household reported ubudehe categories
Source: CFSVA and Nutrition Survey, 2012
Regression analysis shows that the rates of stunting are higher for the lower ubudehe categories
(see Figure 24).
Figure 24: Estimated rates of stunting for each (reported) ubudehe category (CI: 95%)
Source: CFSVA and Nutrition Survey, 2012
In addition, even though this was not confirmed by the regression analysis and has to be verified
with the actual ubudehe categorization, it seems that there is a relatively good correspondence
between the lowest two ubudehe categories and the lowest food consumption groups. As can be
seen in Figure 25, households with poor and borderline food consumption are overrepresented in
the lower ubudehe categories. Seventy percent of the households with unacceptable food
consumption are in the lowest three ubudehe categories, the rest did not know their category
(20%) and only 8% of households with unacceptable food consumption are in category four (‘the
resourceful poor’). Similarly, households reporting acute food access issues are mostly in the first
three ubudehe categories (71%) with an additional 24% who did not know what category they
belonged to.
92 See section 6.2.1 p.87.
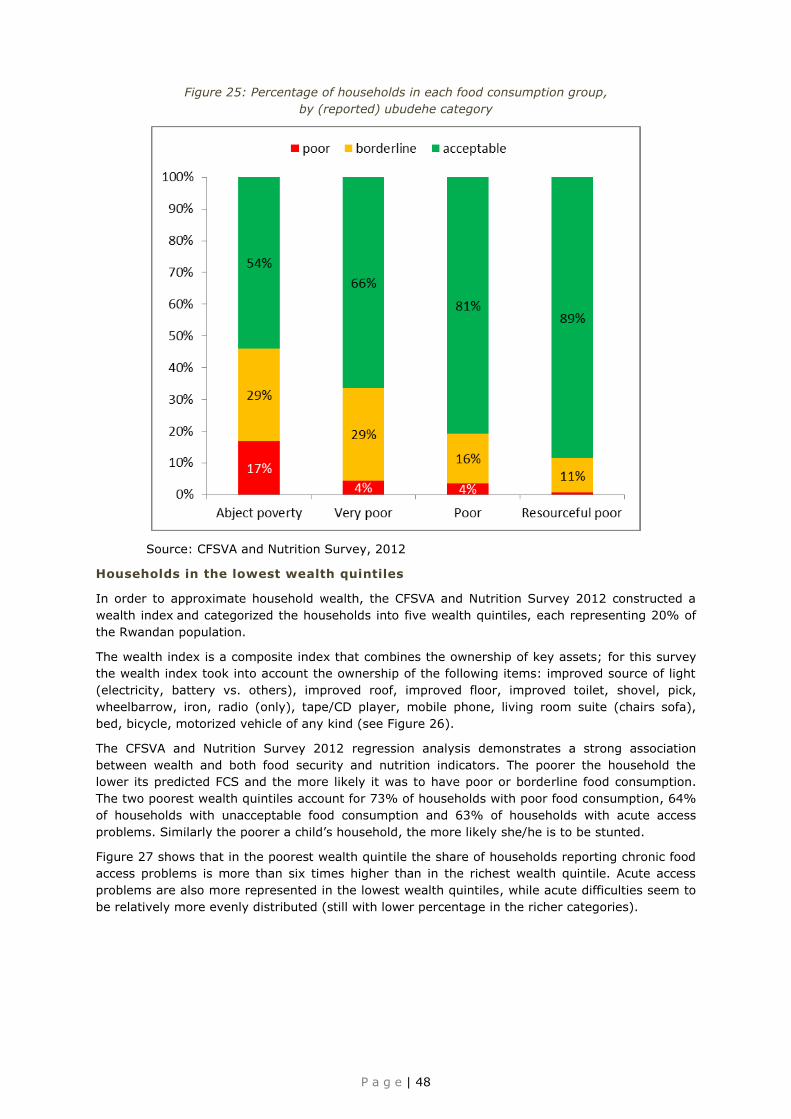
P a g e | 48
Figure 25: Percentage of households in each food consumption group,
by (reported) ubudehe category
Source: CFSVA and Nutrition Survey, 2012
Households in the lowest wealth quintiles
In order to approximate household wealth, the CFSVA and Nutrition Survey 2012 constructed a
wealth index and categorized the households into five wealth quintiles, each representing 20% of
the Rwandan population.
The wealth index is a composite index that combines the ownership of key assets; for this survey
the wealth index took into account the ownership of the following items: improved source of light
(electricity, battery vs. others), improved roof, improved floor, improved toilet, shovel, pick,
wheelbarrow, iron, radio (only), tape/CD player, mobile phone, living room suite (chairs sofa),
bed, bicycle, motorized vehicle of any kind (see Figure 26).
The CFSVA and Nutrition Survey 2012 regression analysis demonstrates a strong association
between wealth and both food security and nutrition indicators. The poorer the household the
lower its predicted FCS and the more likely it was to have poor or borderline food consumption.
The two poorest wealth quintiles account for 73% of households with poor food consumption, 64%
of households with unacceptable food consumption and 63% of households with acute access
problems. Similarly the poorer a child’s household, the more likely she/he is to be stunted.
Figure 27 shows that in the poorest wealth quintile the share of households reporting chronic food
access problems is more than six times higher than in the richest wealth quintile. Acute access
problems are also more represented in the lowest wealth quintiles, while acute difficulties seem to
be relatively more evenly distributed (still with lower percentage in the richer categories).

P a g e | 49
Figure 26: Percentage of households owning each asset, by wealth quintile
Source: CFSVA and Nutrition Survey, 2012
Figure 27: Percentage of households reporting seasonal, acute and chronic difficulties
in accessing food, by wealth quintile
Source: CFSVA and Nutrition Survey, 2012
Crowded households
While larger households have a higher predicted FCS, crowded households (based on the size of
the household and the number of rooms in the house) are less likely to be food secure and their
children are less likely to be stunted. This suggests that large households living in adequately sized
houses suffer less from poor food consumption and malnutrition than households cramped in small
homes, reflecting another dimension of poverty not captured by the household wealth index
discussed above.

P a g e | 50
Box 10: Reminder of poverty trends in Rwanda
According to official government statistics, the share of poor93 households has decreased by 21%
over five years from 57% in 2005/2006 to 45% in 2010-2011. In rural areas, the percentage of
poor households dropped from 62% to 49%. Extreme poverty decreased even more significantly
from 37% in 2005/2006 to 24% in 2011 (35% decrease) nationwide, while it fell from 40% to
26% (33% decrease) in rural areas over the same period.
Poverty reduction seems to have benefitted the poorest; between 2005/2006 and 2010/2011
inequality94 fell to below the levels of 10 years ago in all provinces. The northern and the eastern
provinces have seen the greatest improvement with reductions in poverty rates of 33% and 28%
respectively. The western province saw poverty reduced by 22% and the southern province by
14%. According to the EICV 3, poverty decreases over the past five years have particularly
benefited those reliant on non-farm wages or self-employment work or transfers. The main
reasons for the poverty reduction identified by the EICV 3 are: improved agricultural production,
increasing agro-business and increased availability of non-farm employment.
Despite all these improvements, poverty in Rwanda still remains widespread, affecting almost one
in two (45%) households. Rural areas have by far the highest percentage of poor and extreme
poor (22% poor in urban areas and 49% poor in rural areas). The southern and western provinces
have the highest percentages of poverty in Rwanda at 56% and 48% respectively. The poverty
levels remain much higher among households depending mainly on farm wage labour, followed by
those working in agriculture.
Average expenditure increased (in real terms) from 90,601 RWF per capita per year in 2000/2001
to 123,891 RWF in 2010/2011. Expenditure is lowest in the western province at 92,892 RWF per
capita per year and highest in Kigali City at 324,844 RWF per capita per year, followed by the
northern province at 109,995 RWF in 2011. Expenditure in rural areas averages around 98,896
RWF (up from 66,902 RWF in 2000).
Source: EICV 3
4.2.2 Households relying on less diverse livelihoods
Households with less livelihood activities
Households were asked how many livelihood activities their household depend on: almost half of
Rwandan households (49%) rely on two activities, 43% on one activity (mostly agriculture), and
8% on three. Households that mentioned four or more activities as well as those not mentioning
any livelihood activity at all represent less than 1% of all Rwandan households.
The regression analysis shows that having a higher number of livelihood activities is significantly
associated with better food consumption. Households with three livelihood activities have a
markedly higher food consumption score than those with fewer, and are much less likely to have
poor or borderline food consumption (see Figure 28).
93 The poverty line defines a level of household consumption per adult below which a household is considered to be poor. The national poverty line is based on a basket of food commodities sufficient to provide 2500 kcal per adult and to meet basic non-food requirements (defined as 64,000 RWF per adult per year in 2001, 90,000 RWF in 2006, and 118,000 RWF in 2011). An extreme poverty line of 45,000 RWF per adult per year was established in 2001, set at 63,500 RWF in 2006, and 83,000 RWF in 2011. This threshold is based on the level of expenditure needed to consume the basic food basket. 94 Inequality is here represented by the Gini coefficient. Between 2000 and 2005 it had increased from 0.47 in 2000 to 0.51 in 2005, especially in rural areas. These were high levels of inequality by global standards. According to the last EICV 3 report the Gini coefficient has decreased everywhere between 2005 and 2010, with levels below those of 10 years ago.

P a g e | 51
Figure 28: Unacceptable food consumption by number of household livelihood activities
Source: CFSVA and Nutrition Survey, 2012
Low income agriculturalists, casual and unskilled workers
Principal component and cluster analyses were used to group households that share similar
patterns of activities and the relative importance of those activities to the overall household
livelihood. They were further regrouped so that groups were as comparable as possible to the
2009 CFSVA and Nutrition Survey. This resulted in a total of nine livelihood groups: (1)
agriculturalists (2) agriculture and unskilled daily labourers, (3) agro-pastoralists, (4) agricultural
workers, (5) employees and business, (6) agro sellers, (7) others marginal livelihoods, (8)
informal sellers, (9) agro artisans. Since the group of agriculturalists was very large it was further
separated into two livelihood groups: ‘agriculturalists low income’ (calculated based on a per capita
expenditure below 118,000 RWF – the national poverty line), and ‘agriculturalists medium and
high income’, with per capita expenditure above the national poverty line. Figure 29 shows the
percentage of Rwandan households belonging to each livelihood group. Overall 40% of the
households in Rwanda can be classified as being ‘low income’ agriculturalists, 14% of households
rely on both agriculture and unskilled daily labour, while 13% rely on agriculture and livestock
raising.
The groups were distributed differently among urban, rural and peri-urban areas with those highly
reliant on agriculture more represented in rural areas while those more dependent on salaries,
sales and trade were more present in urban areas. Table 11 gives the main characteristics of each
livelihood group as well as its relative importance in urban, peri-urban and rural villages.
The results of the regression analysis show that low income agriculturalists, agricultural workers,
agriculture and unskilled daily labourers (among the main livelihood activities in the country, see
Table 11) have a lower predicted FCS than households that are reliant on employment and
business, agro-pastoralism, agriculture with medium/high income, selling of agriculture products
or those involved in informal selling (also see Figure 30).
Figure 29: Percentage of Rwandan households in each livelihood group
Source: CFSVA and Nutrition Survey, 2012
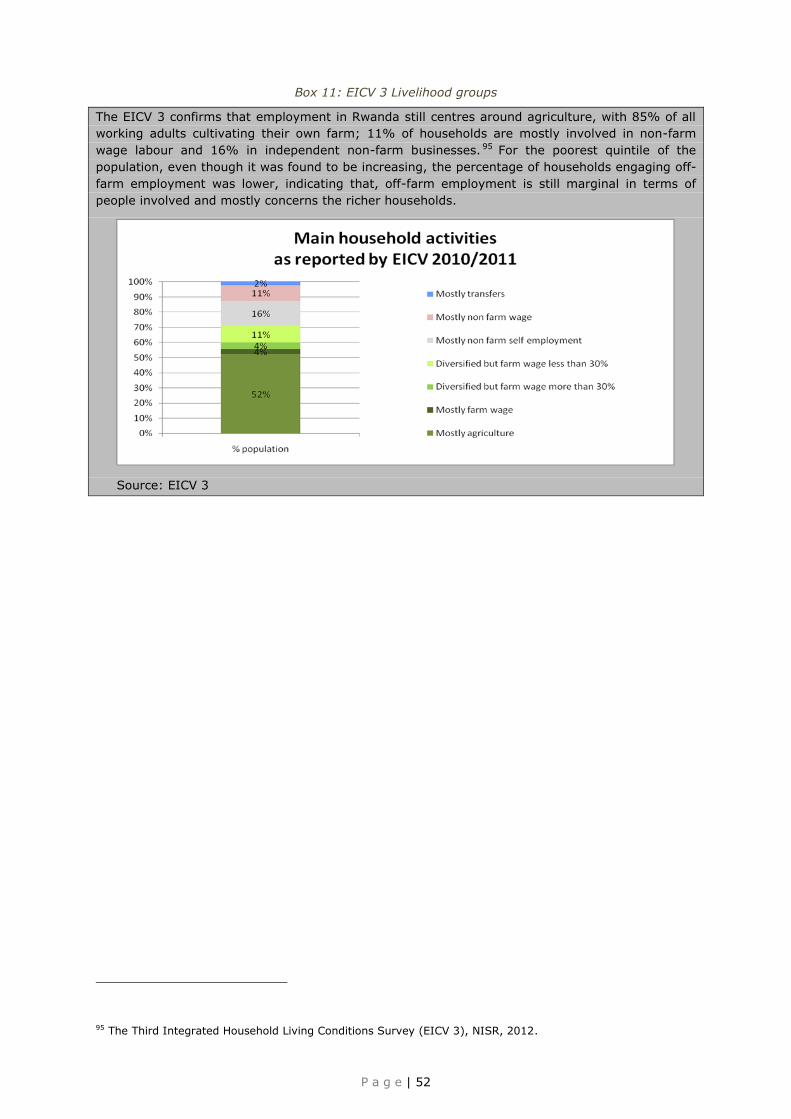
P a g e | 52
Box 11: EICV 3 Livelihood groups
The EICV 3 confirms that employment in Rwanda still centres around agriculture, with 85% of all
working adults cultivating their own farm; 11% of households are mostly involved in non-farm
wage labour and 16% in independent non-farm businesses. 95 For the poorest quintile of the
population, even though it was found to be increasing, the percentage of households engaging off-
farm employment was lower, indicating that, off-farm employment is still marginal in terms of
people involved and mostly concerns the richer households.
Source: EICV 3
95 The Third Integrated Household Living Conditions Survey (EICV 3), NISR, 2012.
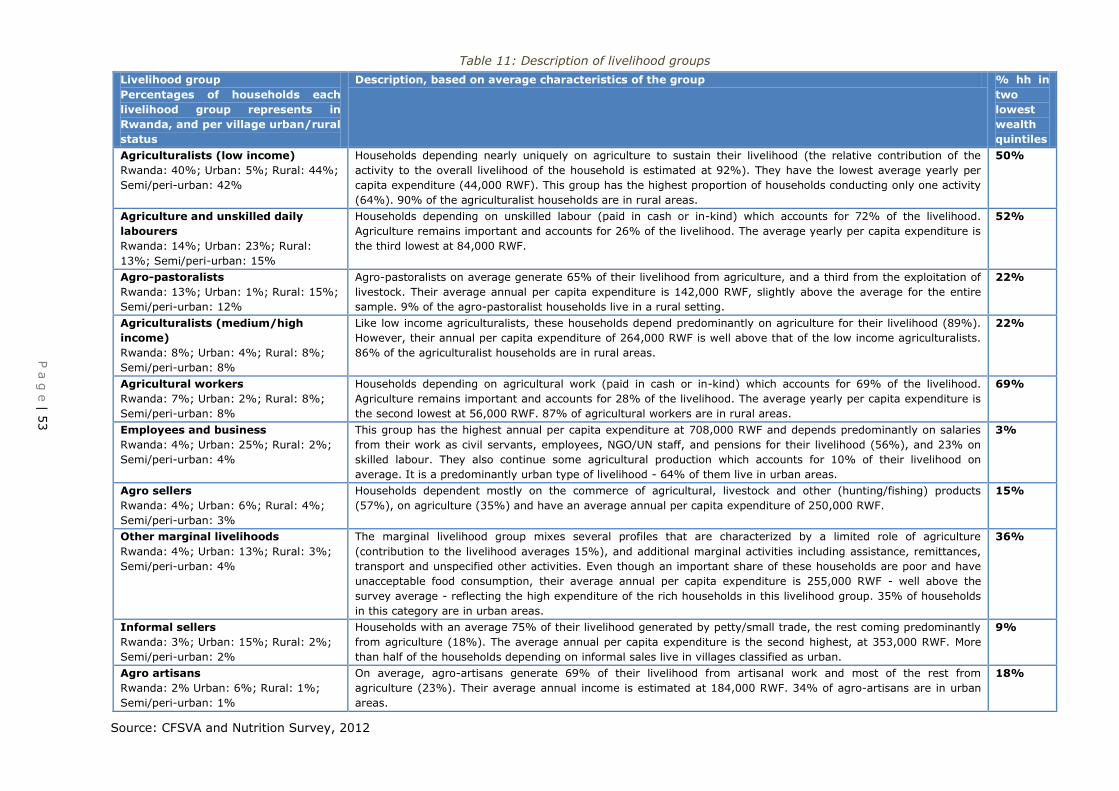
4
P a g e | 53
Table 11: Description of livelihood groups Livelihood group
Percentages of households each
livelihood group represents in
Rwanda, and per village urban/rural
status
Description, based on average characteristics of the group % hh in
two
lowest
wealth
quintiles
Agriculturalists (low income)
Rwanda: 40%; Urban: 5%; Rural: 44%;
Semi/peri-urban: 42%
Households depending nearly uniquely on agriculture to sustain their livelihood (the relative contribution of the
activity to the overall livelihood of the household is estimated at 92%). They have the lowest average yearly per
capita expenditure (44,000 RWF). This group has the highest proportion of households conducting only one activity
(64%). 90% of the agriculturalist households are in rural areas.
50%
Agriculture and unskilled daily
labourers
Rwanda: 14%; Urban: 23%; Rural:
13%; Semi/peri-urban: 15%
Households depending on unskilled labour (paid in cash or in-kind) which accounts for 72% of the livelihood.
Agriculture remains important and accounts for 26% of the livelihood. The average yearly per capita expenditure is
the third lowest at 84,000 RWF.
52%
Agro-pastoralists
Rwanda: 13%; Urban: 1%; Rural: 15%;
Semi/peri-urban: 12%
Agro-pastoralists on average generate 65% of their livelihood from agriculture, and a third from the exploitation of
livestock. Their average annual per capita expenditure is 142,000 RWF, slightly above the average for the entire
sample. 9% of the agro-pastoralist households live in a rural setting.
22%
Agriculturalists (medium/high
income)
Rwanda: 8%; Urban: 4%; Rural: 8%;
Semi/peri-urban: 8%
Like low income agriculturalists, these households depend predominantly on agriculture for their livelihood (89%).
However, their annual per capita expenditure of 264,000 RWF is well above that of the low income agriculturalists.
86% of the agriculturalist households are in rural areas.
22%
Agricultural workers
Rwanda: 7%; Urban: 2%; Rural: 8%;
Semi/peri-urban: 8%
Households depending on agricultural work (paid in cash or in-kind) which accounts for 69% of the livelihood.
Agriculture remains important and accounts for 28% of the livelihood. The average yearly per capita expenditure is
the second lowest at 56,000 RWF. 87% of agricultural workers are in rural areas.
69%
Employees and business
Rwanda: 4%; Urban: 25%; Rural: 2%;
Semi/peri-urban: 4%
This group has the highest annual per capita expenditure at 708,000 RWF and depends predominantly on salaries
from their work as civil servants, employees, NGO/UN staff, and pensions for their livelihood (56%), and 23% on
skilled labour. They also continue some agricultural production which accounts for 10% of their livelihood on
average. It is a predominantly urban type of livelihood - 64% of them live in urban areas.
3%
Agro sellers
Rwanda: 4%; Urban: 6%; Rural: 4%;
Semi/peri-urban: 3%
Households dependent mostly on the commerce of agricultural, livestock and other (hunting/fishing) products
(57%), on agriculture (35%) and have an average annual per capita expenditure of 250,000 RWF.
15%
Other marginal livelihoods
Rwanda: 4%; Urban: 13%; Rural: 3%;
Semi/peri-urban: 4%
The marginal livelihood group mixes several profiles that are characterized by a limited role of agriculture
(contribution to the livelihood averages 15%), and additional marginal activities including assistance, remittances,
transport and unspecified other activities. Even though an important share of these households are poor and have
unacceptable food consumption, their average annual per capita expenditure is 255,000 RWF - well above the
survey average - reflecting the high expenditure of the rich households in this livelihood group. 35% of households
in this category are in urban areas.
36%
Informal sellers
Rwanda: 3%; Urban: 15%; Rural: 2%;
Semi/peri-urban: 2%
Households with an average 75% of their livelihood generated by petty/small trade, the rest coming predominantly
from agriculture (18%). The average annual per capita expenditure is the second highest, at 353,000 RWF. More
than half of the households depending on informal sales live in villages classified as urban.
9%
Agro artisans
Rwanda: 2% Urban: 6%; Rural: 1%;
Semi/peri-urban: 1%
On average, agro-artisans generate 69% of their livelihood from artisanal work and most of the rest from
agriculture (23%). Their average annual income is estimated at 184,000 RWF. 34% of agro-artisans are in urban
areas.
18%
Source: CFSVA and Nutrition Survey, 2012
Pa
ge
| 53
Table 11: Description of livelihood groups
Liv
elih
oo
d g
rou
p
Percen
tag
es
of
hou
seh
old
s
each
livelih
ood
g
rou
p
rep
resen
ts
in
Rw
an
da, a
nd
per v
illag
e u
rban
/ru
ral
sta
tus
Descrip
tion
, based
on
avera
ge c
haracte
ris
tics o
f the g
ro
up
%
h
h in
two
low
est
wealth
qu
intile
s
Ag
ric
ultu
ralis
ts (
low
inco
me)
Rw
anda: 4
0%
; Urb
an: 5
%; R
ura
l: 44%
;
Sem
i/peri-u
rban: 4
2%
Household
s dependin
g nearly
uniq
uely
on agric
ultu
re to
susta
in th
eir
livelih
ood (th
e re
lativ
e contrib
utio
n of
the
activ
ity to
the o
vera
ll livelih
ood o
f the h
ousehold
is e
stim
ate
d a
t 92%
). They h
ave th
e lo
west a
vera
ge y
early
per
capita
expenditu
re (4
4,0
00 R
WF). T
his
gro
up h
as th
e h
ighest p
roportio
n o
f household
s c
onductin
g o
nly
one a
ctiv
ity
(64%
). 90%
of th
e a
gric
ultu
ralis
t household
s a
re in
rura
l are
as.
50
%
Ag
ric
ultu
re a
nd
un
skille
d d
aily
lab
ou
rers
Rw
anda: 1
4%
; Urb
an: 2
3%
; Rura
l:
13%
; Sem
i/peri-u
rban: 1
5%
Household
s dependin
g on unskille
d la
bour
(paid
in
cash or
in-k
ind)
whic
h accounts
fo
r 72%
of
the liv
elih
ood.
Agric
ultu
re re
main
s im
porta
nt a
nd a
ccounts
for 2
6%
of th
e liv
elih
ood. T
he a
vera
ge y
early
per c
apita
expenditu
re is
the th
ird lo
west a
t 84,0
00 R
WF.
52
%
Ag
ro
-pasto
ralis
ts
Rw
anda: 1
3%
; Urb
an: 1
%; R
ura
l: 15%
;
Sem
i/peri-u
rban: 1
2%
Agro
-pasto
ralis
ts o
n a
vera
ge g
enera
te 6
5%
of th
eir liv
elih
ood fro
m a
gric
ultu
re, a
nd a
third
from
the e
xplo
itatio
n o
f
livesto
ck.
Their
avera
ge annual
per
capita
expenditu
re is
142,0
00 R
WF,
slig
htly
above th
e avera
ge fo
r th
e entire
sam
ple
. 9%
of th
e a
gro
-pasto
ralis
t household
s liv
e in
a ru
ral s
ettin
g.
22
%
Ag
ric
ultu
ralis
ts (
med
ium
/h
igh
inco
me)
Rw
anda: 8
%; U
rban: 4
%; R
ura
l: 8%
;
Sem
i/peri-u
rban: 8
%
Lik
e lo
w in
com
e a
gric
ultu
ralis
ts, th
ese h
ousehold
s d
epend p
redom
inantly
on a
gric
ultu
re fo
r their liv
elih
ood (8
9%
).
How
ever, th
eir a
nnual p
er c
apita
expenditu
re o
f 264,0
00 R
WF is
well a
bove th
at o
f the lo
w in
com
e a
gric
ultu
ralis
ts.
86%
of th
e a
gric
ultu
ralis
t household
s a
re in
rura
l are
as.
22
%
Ag
ric
ultu
ral w
orkers
Rw
anda: 7
%; U
rban: 2
%; R
ura
l: 8%
;
Sem
i/peri-u
rban: 8
%
Household
s dependin
g on agric
ultu
ral
work
(p
aid
in
cash or
in-k
ind)
whic
h accounts
fo
r 69%
of
the liv
elih
ood.
Agric
ultu
re re
main
s im
porta
nt a
nd a
ccounts
for 2
8%
of th
e liv
elih
ood. T
he a
vera
ge y
early
per c
apita
expenditu
re is
the s
econd lo
west a
t 56,0
00 R
WF. 8
7%
of a
gric
ultu
ral w
ork
ers
are
in ru
ral a
reas.
69
%
Em
plo
yees a
nd
bu
sin
ess
Rw
anda: 4
%; U
rban: 2
5%
; Rura
l: 2%
;
Sem
i/peri-u
rban: 4
%
This
gro
up h
as th
e h
ighest a
nnual p
er c
apita
expenditu
re a
t 708,0
00 R
WF a
nd d
epends p
redom
inantly
on s
ala
ries
from
their w
ork
as c
ivil s
erv
ants
, em
plo
yees, N
GO
/UN
sta
ff, and p
ensio
ns fo
r their liv
elih
ood (5
6%
), and 2
3%
on
skille
d la
bour.
They als
o contin
ue som
e agric
ultu
ral
pro
ductio
n w
hic
h accounts
fo
r 10%
of
their
livelih
ood on
avera
ge. It is
a p
redom
inantly
urb
an ty
pe o
f livelih
ood - 6
4%
of th
em
live in
urb
an a
reas.
3%
Ag
ro
selle
rs
Rw
anda: 4
%; U
rban: 6
%; R
ura
l: 4%
;
Sem
i/peri-u
rban: 3
%
Household
s dependent
mostly
on th
e com
merc
e of
agric
ultu
ral,
livesto
ck and oth
er
(huntin
g/fis
hin
g)
pro
ducts
(57%
), on a
gric
ultu
re (3
5%
) and h
ave a
n a
vera
ge a
nnual p
er c
apita
expenditu
re o
f 250,0
00 R
WF.
15
%
Oth
er m
arg
inal liv
elih
ood
s
Rw
anda: 4
%; U
rban: 1
3%
; Rura
l: 3%
;
Sem
i/peri-u
rban: 4
%
The
marg
inal
livelih
ood
gro
up
mix
es
severa
l pro
files
that
are
chara
cte
rized
by
a
limite
d
role
of
agric
ultu
re
(contrib
utio
n to
the liv
elih
ood a
vera
ges 1
5%
), and a
dditio
nal m
arg
inal a
ctiv
ities in
clu
din
g a
ssis
tance, re
mitta
nces,
transport a
nd u
nspecifie
d o
ther a
ctiv
ities. E
ven th
ough a
n im
porta
nt s
hare
of th
ese h
ousehold
s a
re p
oor a
nd h
ave
unaccepta
ble
fo
od consum
ptio
n,
their
avera
ge annual
per
capita
expenditu
re is
255,0
00 RW
F -
well
above th
e
surv
ey a
vera
ge - re
flectin
g th
e h
igh e
xpenditu
re o
f the ric
h h
ousehold
s in
this
livelih
ood g
roup. 3
5%
of h
ousehold
s
in th
is c
ate
gory
are
in u
rban a
reas.
36
%
In
form
al s
elle
rs
Rw
anda: 3
%; U
rban: 1
5%
; Rura
l: 2%
;
Sem
i/peri-u
rban: 2
%
Household
s w
ith a
n a
vera
ge 7
5%
of th
eir liv
elih
ood g
enera
ted b
y p
etty
/sm
all tra
de, th
e re
st c
om
ing p
redom
inantly
from
agric
ultu
re (1
8%
). The a
vera
ge a
nnual p
er c
apita
expenditu
re is
the s
econd h
ighest, a
t 353,0
00 R
WF.
More
than h
alf o
f the h
ousehold
s d
ependin
g o
n in
form
al s
ale
s liv
e in
villa
ges c
lassifie
d a
s u
rban.
9%
Ag
ro
artis
an
s
Rw
anda: 2
% U
rban: 6
%; R
ura
l: 1%
;
Sem
i/peri-u
rban: 1
%
On avera
ge,
agro
-artis
ans genera
te 69%
of
their
livelih
ood fro
m artis
anal
work
and m
ost
of
the re
st
from
agric
ultu
re (2
3%
). Their a
vera
ge a
nnual in
com
e is
estim
ate
d a
t 184,0
00 R
WF. 3
4%
of a
gro
-artis
ans a
re in
urb
an
are
as.
18
%
Sourc
e: C
FSVA a
nd N
utritio
n S
urv
ey, 2
012
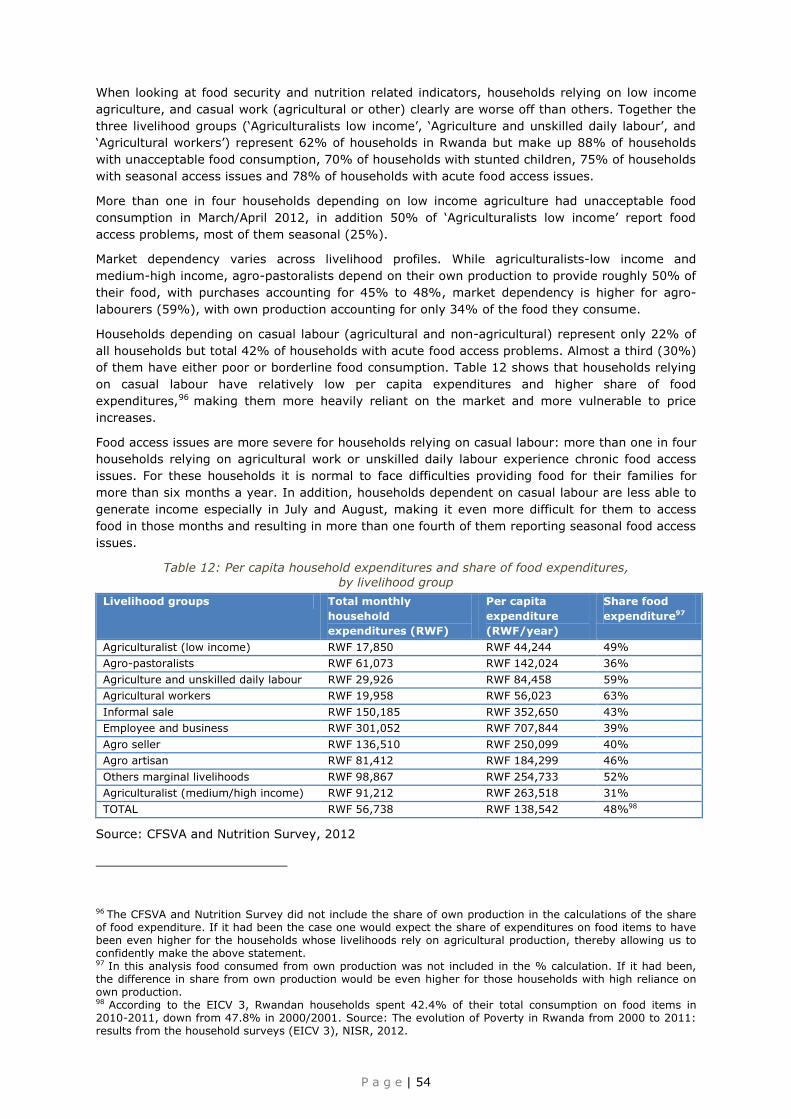
P a g e | 54
When looking at food security and nutrition related indicators, households relying on low income
agriculture, and casual work (agricultural or other) clearly are worse off than others. Together the
three livelihood groups (‘Agriculturalists low income’, ‘Agriculture and unskilled daily labour’, and
‘Agricultural workers’) represent 62% of households in Rwanda but make up 88% of households
with unacceptable food consumption, 70% of households with stunted children, 75% of households
with seasonal access issues and 78% of households with acute food access issues.
More than one in four households depending on low income agriculture had unacceptable food
consumption in March/April 2012, in addition 50% of ‘Agriculturalists low income’ report food
access problems, most of them seasonal (25%).
Market dependency varies across livelihood profiles. While agriculturalists-low income and
medium-high income, agro-pastoralists depend on their own production to provide roughly 50% of
their food, with purchases accounting for 45% to 48%, market dependency is higher for agro-
labourers (59%), with own production accounting for only 34% of the food they consume.
Households depending on casual labour (agricultural and non-agricultural) represent only 22% of
all households but total 42% of households with acute food access problems. Almost a third (30%)
of them have either poor or borderline food consumption. Table 12 shows that households relying
on casual labour have relatively low per capita expenditures and higher share of food
expenditures,96 making them more heavily reliant on the market and more vulnerable to price
increases.
Food access issues are more severe for households relying on casual labour: more than one in four
households relying on agricultural work or unskilled daily labour experience chronic food access
issues. For these households it is normal to face difficulties providing food for their families for
more than six months a year. In addition, households dependent on casual labour are less able to
generate income especially in July and August, making it even more difficult for them to access
food in those months and resulting in more than one fourth of them reporting seasonal food access
issues.
Table 12: Per capita household expenditures and share of food expenditures,
by livelihood group
Livelihood groups Total monthly
household
expenditures (RWF)
Per capita
expenditure
(RWF/year)
Share food
expenditure97
Agriculturalist (low income) RWF 17,850 RWF 44,244 49%
Agro-pastoralists RWF 61,073 RWF 142,024 36%
Agriculture and unskilled daily labour RWF 29,926 RWF 84,458 59%
Agricultural workers RWF 19,958 RWF 56,023 63%
Informal sale RWF 150,185 RWF 352,650 43%
Employee and business RWF 301,052 RWF 707,844 39%
Agro seller RWF 136,510 RWF 250,099 40%
Agro artisan RWF 81,412 RWF 184,299 46%
Others marginal livelihoods RWF 98,867 RWF 254,733 52%
Agriculturalist (medium/high income) RWF 91,212 RWF 263,518 31%
TOTAL RWF 56,738 RWF 138,542 48%98
Source: CFSVA and Nutrition Survey, 2012
96 The CFSVA and Nutrition Survey did not include the share of own production in the calculations of the share of food expenditure. If it had been the case one would expect the share of expenditures on food items to have been even higher for the households whose livelihoods rely on agricultural production, thereby allowing us to confidently make the above statement. 97 In this analysis food consumed from own production was not included in the % calculation. If it had been, the difference in share from own production would be even higher for those households with high reliance on own production. 98 According to the EICV 3, Rwandan households spent 42.4% of their total consumption on food items in 2010-2011, down from 47.8% in 2000/2001. Source: The evolution of Poverty in Rwanda from 2000 to 2011: results from the household surveys (EICV 3), NISR, 2012.
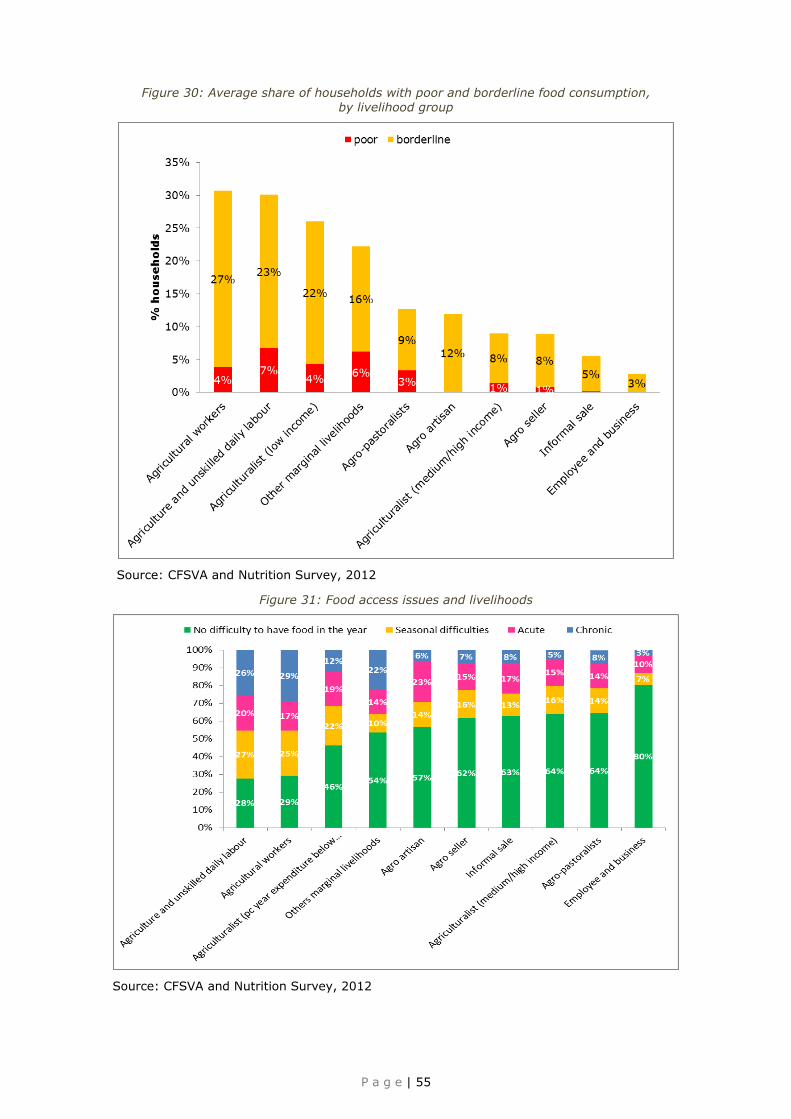
P a g e | 55
Figure 30: Average share of households with poor and borderline food consumption,
by livelihood group
Source: CFSVA and Nutrition Survey, 2012
Figure 31: Food access issues and livelihoods
Source: CFSVA and Nutrition Survey, 2012

P a g e | 56
Households cultivating small plots of land
Access to land is vital for the livelihoods of most rural households in Rwanda and a factor of
historical importance. Demographic pressure and underdevelopment of the agricultural sector have
resulted in small, semi-subsistence, and increasingly fragmented farms.
According to the survey, households that are not cultivating any land at all have significantly
better food consumption than others, showing that households not involved in agriculture at all are
relatively better off than those who are. Unsurprisingly these households are mostly urban or peri-
urban (63% in total). However when focusing on rural households those few households that are
not involved in agriculture (7% of all rural households) are relatively worse off - food consumption
wise - than the other rural households, with 33% having either poor or borderline food
consumption.
Figure 32: Percentage of households farming land in season A 2012, by land size
Source: CFSVA and Nutrition Survey, 2012
For households involved in agriculture and land cultivation, the regression analysis shows that the
smaller the plot of land cultivated the higher the likelihood of having a low food consumption
score. Eighty five percent of households in Rwanda cultivated land in season A 2012. Out of these
only 40% cultivated more than half a hectare (see Figure 32) and 26% between 0.2 and 0.5 ha.
The remaining farming households (35%) cultivated less than 0.2 ha of land in the 2012 season A.
In rural areas, 55% of farming households cultivated less than 0.5ha. These households account
for 70% of rural households with poor food consumption, 73% of households with access problems
and 67% of rural households with unacceptable food consumption (poor and borderline). 84% of
rural households that have poor food consumption either farm no land or farm less than 0.5ha.
Figure 33: Average FCS by land cultivation in season A 2012 and share of households with
unacceptable food consumption, by land size
Source: CFSVA and Nutrition Survey, 2012

P a g e | 57
Households with less diverse agricultural activities
The regression analysis demonstrates that the more crops a household cultivated in season A the
more likely it is to be have better food consumption. According to the 2012 survey findings,
households reporting acceptable food consumption cultivate an average of three crops, while those
with poor food consumption cultivate two (see Figure 33, Figure 34 and Figure 35). Similarly, as
illustrated by Figure 35, the regression analysis also shows that livestock ownership was
associated with higher levels of food security.
Figure 34: FCS by number of livestock owned and number of crops cultivated
Source: CFSVA and Nutrition Survey, 2012
More than half of households (58%) have a vegetable garden. These households show significantly
better food consumption patterns than those who do not, with only 18% of them having
unacceptable food consumption compared with 25% of the households who do not own a
vegetable garden (again demonstrated by the regression model).
Almost a third (29%) of households still had food stocks from their previous harvest available in
April. These households had significantly higher FCS than those that did not, emphasising yet
again the importance of access to food for household food security (see section 3.3).
Figure 35: Food consumption groups and cultivation of a household vegetable garden
Source: CFSVA and Nutrition Survey, 2012

P a g e | 58
Box 12: Households with food access problems, especially chronic are those with worst food
consumption
Figure 36 shows the percentage of households reporting food access problems for each of the 12
months preceding the interview, and - for each type of reported food access issue - the share of
households with poor, borderline and acceptable food consumption at the time of the survey.
Households that do not report any food access issues in the year are less likely to have poor or
borderline food consumption than the average Rwandan household; 89% of households not
reporting any food access problems in the year have acceptable food consumption compared with
79% for Rwanda. Households reporting chronic food access problems on the other hand have a
much lower percentage of households with acceptable food consumption (56%) and much higher
share of households with borderline and poor food consumption (34% compared to 17% nationally
for borderline, and 10% compared to 4% nationally for poor).
Figure 36: Households reporting difficulty in having enough food in the last 12 months,
by food consumption group
Source: CFSVA and Nutrition Survey, 2012
4.2.3 Vulnerable households
Households headed by the uneducated
As is further explained in chapter 5, great progress has been made in Rwanda in extending
education to all. Primary school completion has now reached 73% (78% for girls). However with a
net enrolment rate of 21%, access to secondary education still lags way behind primary and did
not reach the 40% target the government had set itself for 2010.99
The regression analysis shows that the higher the education level of the household head, the
higher the households predicted FCS, and the lower the likelihood of the household having
unacceptable food consumption (see Figure 37). This once again demonstrates the vital
importance of improving education and literacy levels of both men and women in Rwanda.
According to the EICV 3, 18% of men and 23% of women are illiterate, highlighting the
persistence of gender inequalities in Rwanda in 2012. The CFSVA and Nutrition Survey 2012 only
considers the literacy levels of household heads, and therefore estimates lower declared levels of
literacy. The gender gap evidenced by the EICV 3 is confirmed (and widened, see Table 13): while
some 33% of male heads of households are unable to read or write, the proportion rises to 66%
for women heads of household. It is worth emphasising that only one quarter of household heads
have completed primary school and a meagre two percent secondary.
99 EICV 3.
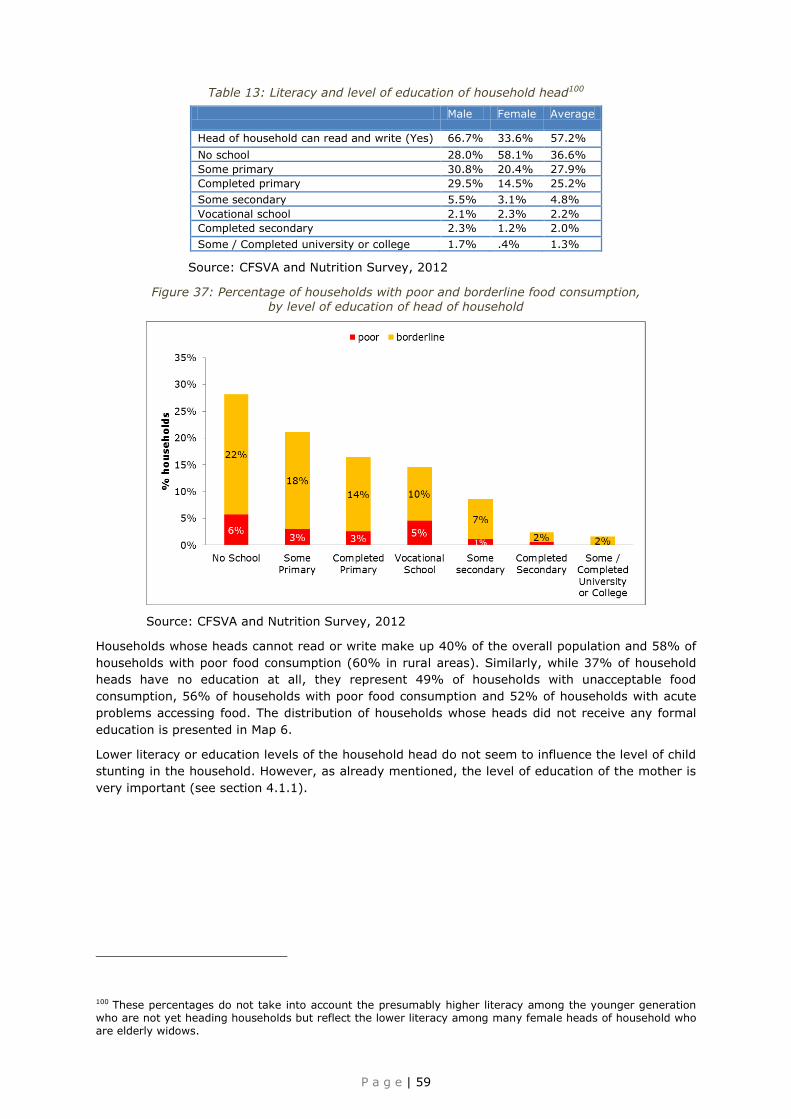
P a g e | 59
Table 13: Literacy and level of education of household head100
Male Female Average
Head of household can read and write (Yes) 66.7% 33.6% 57.2%
No school 28.0% 58.1% 36.6%
Some primary 30.8% 20.4% 27.9%
Completed primary 29.5% 14.5% 25.2%
Some secondary 5.5% 3.1% 4.8%
Vocational school 2.1% 2.3% 2.2%
Completed secondary 2.3% 1.2% 2.0%
Some / Completed university or college 1.7% .4% 1.3%
Source: CFSVA and Nutrition Survey, 2012
Figure 37: Percentage of households with poor and borderline food consumption, by level of education of head of household
Source: CFSVA and Nutrition Survey, 2012
Households whose heads cannot read or write make up 40% of the overall population and 58% of
households with poor food consumption (60% in rural areas). Similarly, while 37% of household
heads have no education at all, they represent 49% of households with unacceptable food
consumption, 56% of households with poor food consumption and 52% of households with acute
problems accessing food. The distribution of households whose heads did not receive any formal
education is presented in Map 6.
Lower literacy or education levels of the household head do not seem to influence the level of child
stunting in the household. However, as already mentioned, the level of education of the mother is
very important (see section 4.1.1).
100 These percentages do not take into account the presumably higher literacy among the younger generation who are not yet heading households but reflect the lower literacy among many female heads of household who are elderly widows.

P a g e | 60
Map 6: Proportion of households whose head did not receive any formal education
Source: CFSVA and Nutrition Survey, 2012
Households headed by the elderly
According to the EICV 3, 42% of the population in Rwanda is below 15 years of age and the
dependency ratio (number of young dependents for the working age group) has decreased from
0.9 in 2004 to 0.75 in 2011. As a consequence of the genocide, the proportion of women in the
middle age group is higher (about 55%), resulting in a high number of female headed households
(29% in rural areas according to the CFSVA and Nutrition Survey 2012).101 More than one in ten
households (11%) are headed by a disabled person.
The regression analysis demonstrated that households with an older head have a lower predicted
FCS; 28% of households with poor food consumption were headed by people over 60. Even though
at the bivariate level households headed by women as well as households headed by single heads
of households (in particular widows), and disabled heads of households102 have on average a lower
food consumption score than others, when considered together with other indicators in the model,
they are not predictors of the household food security or of child stunting. Possibly the
vulnerability of these households is already captured by other indicators in the model such as
poverty and the age of the household head (at 54 years the average age of female heads of
household is some 10 years higher than male).103
101 34% according to the DHS 2010. 102 Disabled heads of households constitute 11% of the population and 16% of those with poor food consumption and food access issues. 103 Almost one third (29%) of households in Rwanda are headed by women, yet they represent 36% of the households with unacceptable food consumption, and 39% of households with acute food access problems. Interestingly however, households that are headed by women only represent 17% of the households with stunted children, suggesting that even if women headed households are more likely to have poor food consumption, they are not necessarily more prone to having stunted children under five. One of the reasons for this is probably that many of these households are headed by widows, who would be older and therefore less likely to have children under five that could be stunted. In fact further analysis shows that over one fifth (21%) of all Rwandan households are headed by a person over 60 years old, and unsurprisingly these households only represent 10% of the households with stunted children under 5.

P a g e | 61
Box 13: Summary - Who are the food insecure and the malnourished?
In Rwanda, households not involved in agriculture at all, often living in urban areas, are relatively
better off than those that are involved. However, 85% of households in Rwanda cultivate land and
rely on agriculture or livestock as a main (and often only) livelihood activity. For many of these
households, access to productive land is a problem: some 60% cultivate plots smaller than half a
hectare (26% below 0.2 ha). Among households involved in agriculture and cultivating land, the
smaller the cultivated plot the more likely they are to have a low food consumption score.
The more crops a household cultivated in season A the more likely it is to be food secure. The
same goes for households engaged in a higher number of livelihood activities. Similarly, having a
household kitchen garden and owning livestock are associated with higher levels of food security.
Households who still had food stocks in April had a higher predicted FCS.
Low income agriculturalists, agricultural workers and unskilled daily labourers (among the main
livelihood activities in the country) have a lower food consumption score than households reliant
on employment and business, agro-pastoralism, agriculture with medium/high income, selling of
agriculture products and those involved in informal selling.
The higher the level of education of the household head, the lower the likelihood of the household
being food insecure. Households with an older head of household and crowded households (based
on the size of the household and the number of rooms in the house) are more likely to be food
insecure.
Stunted children were more likely to live in poor, crowded households of the lower ubudehe
categories.
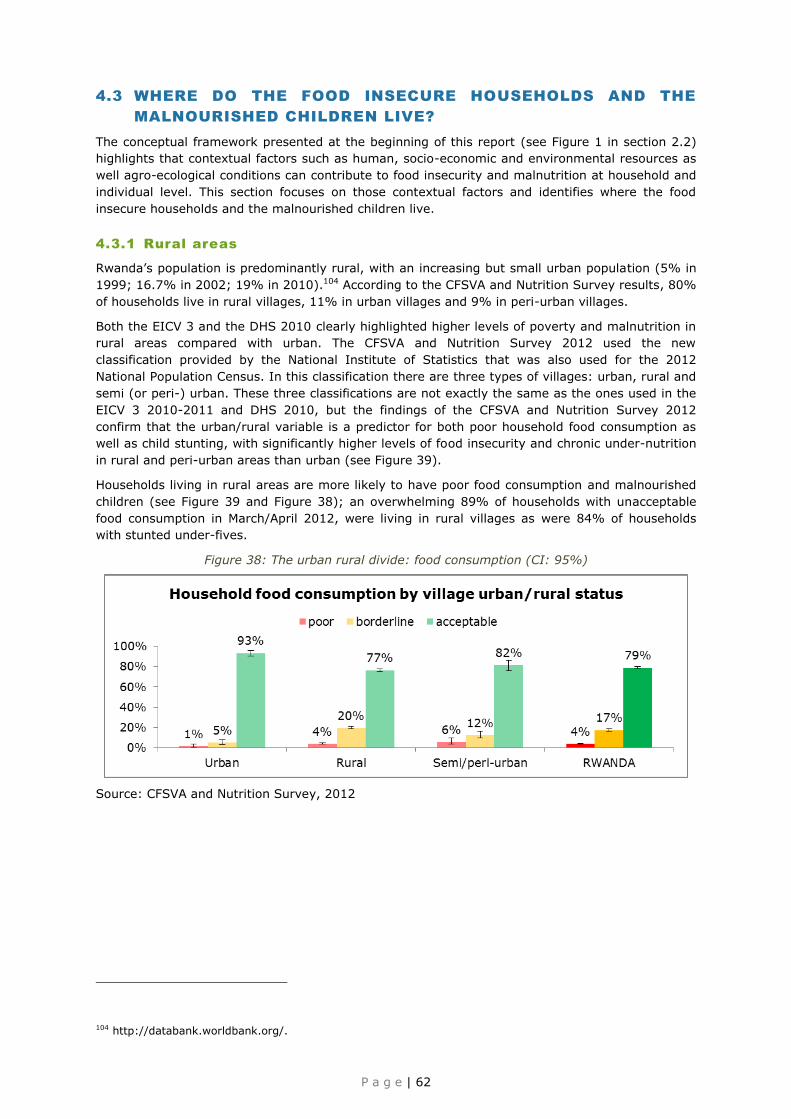
P a g e | 62
4.3 WHERE DO THE FOOD INSECURE HOUSEHOLDS AND THE
MALNOURISHED CHILDREN LIVE?
The conceptual framework presented at the beginning of this report (see Figure 1 in section 2.2)
highlights that contextual factors such as human, socio-economic and environmental resources as
well agro-ecological conditions can contribute to food insecurity and malnutrition at household and
individual level. This section focuses on those contextual factors and identifies where the food
insecure households and the malnourished children live.
4.3.1 Rural areas
Rwanda’s population is predominantly rural, with an increasing but small urban population (5% in
1999; 16.7% in 2002; 19% in 2010).104 According to the CFSVA and Nutrition Survey results, 80%
of households live in rural villages, 11% in urban villages and 9% in peri-urban villages.
Both the EICV 3 and the DHS 2010 clearly highlighted higher levels of poverty and malnutrition in
rural areas compared with urban. The CFSVA and Nutrition Survey 2012 used the new
classification provided by the National Institute of Statistics that was also used for the 2012
National Population Census. In this classification there are three types of villages: urban, rural and
semi (or peri-) urban. These three classifications are not exactly the same as the ones used in the
EICV 3 2010-2011 and DHS 2010, but the findings of the CFSVA and Nutrition Survey 2012
confirm that the urban/rural variable is a predictor for both poor household food consumption as
well as child stunting, with significantly higher levels of food insecurity and chronic under-nutrition
in rural and peri-urban areas than urban (see Figure 39).
Households living in rural areas are more likely to have poor food consumption and malnourished
children (see Figure 39 and Figure 38); an overwhelming 89% of households with unacceptable
food consumption in March/April 2012, were living in rural villages as were 84% of households
with stunted under-fives.
Figure 38: The urban rural divide: food consumption (CI: 95%)
Source: CFSVA and Nutrition Survey, 2012
104 http://databank.worldbank.org/.

P a g e | 63
Figure 39: The urban rural divide: child nutrition (CI: 95%)
Source: CFSVA and Nutrition Survey, 2012
Figure 40: The urban rural divide: nutrition of women in reproductive age (CI: 95%)
Source: CFSVA and Nutrition Survey, 2012
4.3.2 Isolated from roads and services
In order to better analyse constraints related to accessibility, the distance to the main roads used
regularly by cars, and public transport, were used as a proxy to assess village accessibility.105 The
distances were classified as follows: 0 – 2 km= close to main road; 2 – 5km= relatively close; 5 –
10 km= far; > 10 km= very far. Map 7 shows the distribution of main road accessibility in
Rwanda.
Based on the classification above; districts where households are more distant from main roads
are Rusizi, Nyamasheke, Karongi, Rutsiro, Ngororero (western province), Nyaruguru, Nyamagabe
(southern province), Gakenke, Rulindo and Gicumbi (northern province), as well as Kayonza and
Kirehe (eastern province). In these districts, a high proportion of households are living in villages
located more than 5 km from a main road.
105 The distance to the main road was calculated using the Euclidian distance from the main roads in the spatial
analyst tools of ArcGIS software.

P a g e | 64
Map 7: Road accessibility in Rwanda
Source: VAM WFP, 2012 based on the national road network dataset
Even though, when compared with other countries in the region, road network connectivity and
conditions are good in Rwanda, still the regression analysis indicates that household access to
roads is a significant predictor for food consumption. In fact, the further a household is from the
main road and from services such as a market, the more likely it is to have a lower food
consumption score (see Table 14). Similarly, children who were living further away from a hospital
were significantly more likely to be stunted (shown by the regression model).
Table 14: Time (in minutes) to access the nearest facilities out of the village, by households
Time to health facility (min)
Time to the market (min)
FCS category Poor 81 82
Borderline 77 86
Acceptable 67 75
Wealth quintile 1st poorest 78 87
2nd 76 86
3rd middle 73 81
4th 66 75
5th wealthiest 51 55
Type of village Urban 32 31
Rural 75 85
Semi/peri-urban 60 64
Source: CFSVA and Nutrition Survey, 2012
4.3.3 Steeply sloping land
Land degradation in Rwanda - often referred to as the country of a thousand hills - is characterised
by soil erosion and declining soil fertility and is driven by unsustainable land use practices, namely
deforestation, and over cultivation, often on steep slopes without appropriate soil conservation
measures.
The western highlands that reach over 4,500 m, divide the country between the Nile and the
Congo basin. West of the highlands, altitudes rapidly decrease to reach Lake Kivu that forms the

P a g e | 65
western border of Rwanda. East of the highlands, the Great East African Plateau (app. 950m
altitude), is characterized by swamps and lakes.
MINAGRI uses the following classification on the suitability of the land based on sloping levels of
the terrain:
Table 15: Agriculture suitability based on slopes
Slope Suitability Comment
0 – 6% Suitable The erosion hazard is not creating any serious problem
0 – 16% Suitable Cut-off drain is proposed to intercept the surface run-off from the higher slopes of the catchment
16 – 40% High slope Radical terraces recommended in order to be cultivated
40 – 60% Very high slope
Depending on soil depth can be cultivated with radical terraces
>60% Not suitable Recommended for forest planting
Source: MINAGRI, 2010 Based on FAO slope classification
Even though it was impossible to determine the soil and topographical characteristics of the exact
plots cultivated by households, an attempt was made, for the CFSVA and Nutrition Survey 2012, to
spatially analyse topography, soil erosion106 and soil fertility107 and to link them with household
food security. All the indicators were found to be significant predictors of the food consumption
score as well as stunting at the bivariate level, but when correcting for other factors in the models,
only the ‘percentage of slopes not suitable’ in the cell where the household’s village was located
turned out to be a predictor for chronic malnutrition.
Of the 85% of households that cultivated land during the 2012 season A, just half are farming soils
that are suitable for cultivation (slope <16%) while 10% are cultivating on slopes steeper than
40% and theoretically not suitable for agriculture. Most of these steep lands are located in the
western province and in the districts of Nyaruguru, Nyamagabe, Muhanga (southern province),
Gakenke, Rulindo and Gicumbi (northern province). These are districts characterized by high rates
of soil erosion (erosion over 10 tons/ha/year) and a low soil fertility index (around 0.3 compared
with around 0.7 in the eastern part of the country, see Map 8).
Over half (57%) of land-cultivating households use some type of soil erosion control measure.
Ditches only are the main measure employed (46% of cultivating households) followed by planting
trees and grasses (32%).
106 Modelling soil erosion was achieved using the Universal Soil Loss Equation (USLE). The USLE is composed of six factors to predict the long-term average annual soil loss (A). The equation includes the rainfall erosivity factor (R), the soil erodibility factor (K), the topographic factors (L and S) and the cropping management factors (C and P). The equation takes the simple product form: A= R x LS x CP. 107 Calculation of soil fertility index combines relevant soil characteristics – nutrients, pH, and organic matter.

P a g e | 66
Map 8: Potential soil erosion and soil fertility

P a g e | 67
4.3.4 High rates of stunting and food insecurity coincide in western
Rwanda
Between May 2011 and July 2012, FEWS NET - with the participation of government and partners -
carried out the revision of the Rwanda national livelihood zones (see Map 9) using a rapid
livelihoods assessment approach based on the Household Economy Analysis (HEA) that aims to
identify and describe trends and patterns in livelihoods. The process resulted in the identification of
12 livelihood zones (described in Annex 9):
(1) Lake Kivu Coffee Zone; (2) West Congo-Nile Crest Tea Zone; (3) Northwest Volcanic Irish
Potato Zone; (4) East Congo-Nile Highland Farming Zone; (5) Central Plateau Cassava and Coffee
Zone; (6) Northern Highlands Beans and Wheat Zone; (7) Central-Northern Highlands Irish potato,
Beans and Vegetable Zone; (8) Bugesera Cassava Zone; (9) Eastern Plateau Mixed Agriculture
Zone; (10) Southeastern Plateau Banana Zone; (11) Eastern Agro-Pastoral Zone; (12) Eastern
Semi-Arid Agro-Pastoral Zone.
Households cultivating land along the Congo-Nile crest have to deal with less fertile soils and soils
that are vulnerable to erosion. Vulnerability to soil erosion is high in the districts of Nyaruguru,
Huye, Nyamagabe and Muhanga (southern province), Karongi, Ngororero, Rusizi, Nyamasheke and
Nyabihu (western province), Rulindo, Gakenke, Gicumbi and Burera (northern province). Areas
with poor soil fertility are almost in the same areas as those vulnerable to soil erosion. Districts
with low soil fertility index are Nyamasheke, Karongi, Rutsiro and Ngororero (western province),
Burera, Gicumbi, Rulindo, Gakenke (northern province), Bugesera (eastern province), all districts
of Kigali City and the southern province.
In the regression analysis the FEWS NET livelihood zones were found to be significant predictors of
both household food consumption and chronic malnutrition in children under five.
Map 9: FEWS NET livelihood zones
Source: Based on information provided by FEWS NET
Households in western and southern livelihood zones face greater food
insecurity
The rural areas of the livelihood zones bordering Lake Kivu and West of the Congo Nile Crest have
the highest percentages of households with unacceptable food consumption (42% and 43%
respectively) followed by the East Congo Nile Crest (29%).
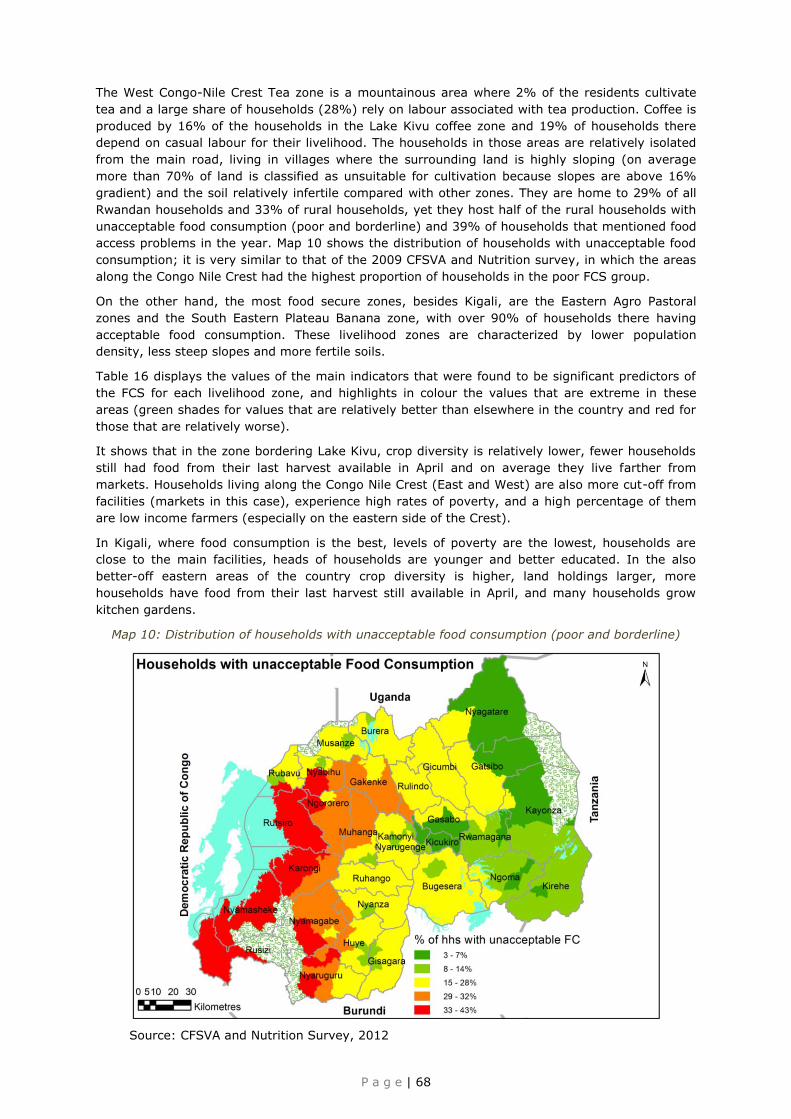
P a g e | 68
The West Congo-Nile Crest Tea zone is a mountainous area where 2% of the residents cultivate
tea and a large share of households (28%) rely on labour associated with tea production. Coffee is
produced by 16% of the households in the Lake Kivu coffee zone and 19% of households there
depend on casual labour for their livelihood. The households in those areas are relatively isolated
from the main road, living in villages where the surrounding land is highly sloping (on average
more than 70% of land is classified as unsuitable for cultivation because slopes are above 16%
gradient) and the soil relatively infertile compared with other zones. They are home to 29% of all
Rwandan households and 33% of rural households, yet they host half of the rural households with
unacceptable food consumption (poor and borderline) and 39% of households that mentioned food
access problems in the year. Map 10 shows the distribution of households with unacceptable food
consumption; it is very similar to that of the 2009 CFSVA and Nutrition survey, in which the areas
along the Congo Nile Crest had the highest proportion of households in the poor FCS group.
On the other hand, the most food secure zones, besides Kigali, are the Eastern Agro Pastoral
zones and the South Eastern Plateau Banana zone, with over 90% of households there having
acceptable food consumption. These livelihood zones are characterized by lower population
density, less steep slopes and more fertile soils.
Table 16 displays the values of the main indicators that were found to be significant predictors of
the FCS for each livelihood zone, and highlights in colour the values that are extreme in these
areas (green shades for values that are relatively better than elsewhere in the country and red for
those that are relatively worse).
It shows that in the zone bordering Lake Kivu, crop diversity is relatively lower, fewer households
still had food from their last harvest available in April and on average they live farther from
markets. Households living along the Congo Nile Crest (East and West) are also more cut-off from
facilities (markets in this case), experience high rates of poverty, and a high percentage of them
are low income farmers (especially on the eastern side of the Crest).
In Kigali, where food consumption is the best, levels of poverty are the lowest, households are
close to the main facilities, heads of households are younger and better educated. In the also
better-off eastern areas of the country crop diversity is higher, land holdings larger, more
households have food from their last harvest still available in April, and many households grow
kitchen gardens.
Map 10: Distribution of households with unacceptable food consumption (poor and borderline)
Source: CFSVA and Nutrition Survey, 2012

5
P a g e | 69
Table 16: Understanding food insecurity by livelihood zone108
Human Capital Livelihoods strategies Poverty Remoteness
Livelihood zone
Unaccepta
ble
food
consum
ption
Age h
ead o
f household
Household
siz
e
Household
head
without
education
Num
ber
of sourc
es o
f
incom
e
Unskille
d /
agricultura
l
alb
our
Low
incom
e f
arm
ers
Marg
inal livelihoods
Farm
ing h
ousehold
s
with m
ore
than .5 h
a
at
least
4 c
rops
HH
with h
om
e g
ard
ens
HH
with food fro
m
ow
n h
arv
est
in A
pril
Liv
esto
ck o
wners
hip
Low
est
2 w
ealth
quin
tile
spoor
Abje
ct
/ Very
Poor
(Ubudehe)
Cro
wdin
g index
Dis
tance t
o a
main
road
Tim
e t
o m
ark
et
(min
ute
s)
Kigali City Urban 3% 43.2 5.5 10% 1.3 20% 0% 18% 40% 24% 37% 4% 0.4 5% 6% 2.5 0.6 31
Semi-Urban 3% 46.9 5.4 38% 1.4 23% 45% 5% 23% 48% 49% 38% 0.4 24% 29% 2.3 2.2 64
Lake Kivu Semi-Urban 43% 47.9 5.3 41% 1.6 19% 39% 3% 46% 28% 58% 23% 0.4 28% 14% 1.8 1.3 79
Rural 42% 46.8 5.1 39% 1.8 20% 43% 2% 44% 26% 57% 19% 0.4 31% 16% 2.1 3.7 90
West Congo-Nile Crest
Rural 43% 46.8 5.0 45% 1.8 28% 36% 3% 32% 33% 56% 26% 0.5 49% 17% 2.4 4.2 92
Northwest Volcanic Urban 12% 44.5 5.8 23% 1.5 21% 9% 7% 41% 5% 60% 9% 0.3 11% 14% 2.0 0.9 24
Rural 20% 46.2 5.1 41% 1.7 32% 24% 4% 31% 13% 65% 21% 0.5 35% 19% 2.1 2.2 71
East Congo-Nile Highland
Rural 29% 47.9 4.7 40% 1.7 19% 52% 3% 34% 41% 62% 31% 0.7 50% 19% 2.2 3.9 87
Central Plateau Semi-Urban 13% 47.2 4.7 29% 1.6 22% 54% 3% 28% 58% 64% 34% 0.5 44% 15% 2.1 1.9 54
Rural 20% 47.8 4.8 34% 1.6 21% 51% 2% 38% 48% 55% 30% 0.6 49% 20% 2.3 4.5 62
Northern Highland Rural 22% 46.4 4.7 39% 1.6 16% 50% 3% 42% 19% 67% 44% 0.5 62% 8% 2.1 2.3 79
Central-Northern Highland
Rural 19% 49.7 4.9 40% 1.9 29% 36% 5% 37% 28% 67% 28% 0.7 34% 9% 2.2 3.2 105
Bugesera Rural 23% 45.7 4.7 42% 1.3 15% 59% 3% 29% 23% 35% 25% 0.6 53% 17% 2.3 3.6 71
Eastern Plateau Rural 19% 47.3 4.8 47% 1.7 19% 48% 2% 52% 52% 67% 43% 0.6 45% 20% 2.2 4.3 65
Southeastern Plateau Semi-Urban 6% 46.7 4.9 36% 1.7 18% 36% 5% 38% 40% 56% 37% 0.6 26% 23% 2.2 0.7 68
Rural 11% 48.0 4.6 40% 1.6 16% 39% 4% 46% 40% 62% 45% 0.6 31% 15% 2.2 5.5 65
Eastern Agropastoral Rural 7% 47.1 5.5 43% 1.9 20% 34% 5% 63% 47% 66% 43% 1.8 42% 12% 2.5 6.7 106
Eastern Semi-Arid Agropastoral
Rural 11% 43.9 4.9 33% 1.6 14% 39% 1% 55% 37% 86% 57% 0.5 49% 8% 2.5 10.9 144
Rwanda Average 21% 47.0 5.0 36% 1.6 21% 39% 4% 39% 37% 58% 29% 0.6 38% 16% 2.2 3.6 72
Source: CFSVA and Nutrition Survey, 2012
108 Cell colour coding: Shades of green indicate indicators relatively good for food security compared to the national average (the darker the better), Shades of red around indicators that are relatively bad for food security compared to the national average (the darker the worse).
Pa
ge
| 69
Table 16: Understanding food insecurity by livelihood zone
108
H
um
an C
apita
l Liv
elih
oods s
trate
gie
s
Poverty
Rem
ote
ness
Liv
elih
ood z
one
Unacceptable food
consumption
Age head of household
Household size
Household head
without education
Number of sources of
income
Unskilled / agricultural
albour
Low income farmers
Marginal livelihoods
Farming households
with more than .5 ha
at least 4 crops
HH with home gardens
HH with food from
own harvest in April
Livestock ownership
Lowest 2 wealth
quintilespoor
Abject / Very Poor
(Ubudehe)
Crowding index
Distance to a main
road
Time to market
(minutes)
Kig
ali C
ity
Urb
an
3%
43.2
5.5
10%
1.3
20%
0%
18%
40%
24%
37%
4%
0.4
5%
6%
2.5
0.6
31
Sem
i-Urb
an
3%
46.9
5.4
38%
1.4
23%
45%
5%
23%
48%
49%
38%
0.4
24%
29%
2.3
2.2
64
Lake K
ivu
Sem
i-Urb
an
43
%
47.9
5.3
41%
1.6
19%
39%
3%
46%
28%
58%
23%
0.4
28%
14%
1.8
1.3
79
Rura
l 4
2%
46.8
5.1
39%
1.8
20%
43%
2%
44%
26%
57%
19%
0.4
31%
16%
2.1
3.7
90
West C
ongo-N
ile
Cre
st
Rura
l 4
3%
46.8
5.0
45%
1.8
28%
36%
3%
32%
33%
56%
26%
0.5
49%
17%
2.4
4.2
92
North
west V
olc
anic
U
rban
12
%
44.5
5.8
23%
1.5
21%
9%
7%
41%
5%
60%
9%
0.3
11%
14%
2.0
0.9
24
Rura
l 2
0%
46.2
5.1
41%
1.7
32%
24%
4%
31%
13%
65%
21%
0.5
35%
19%
2.1
2.2
71
East C
ongo-N
ile
Hig
hla
nd
Rura
l 2
9%
47.9
4.7
40%
1.7
19%
52%
3%
34%
41%
62%
31%
0.7
50%
19%
2.2
3.9
87
Centra
l Pla
teau
Sem
i-Urb
an
13
%
47.2
4.7
29%
1.6
22%
54%
3%
28%
58%
64%
34%
0.5
44%
15%
2.1
1.9
54
Rura
l 2
0%
47.8
4.8
34%
1.6
21%
51%
2%
38%
48%
55%
30%
0.6
49%
20%
2.3
4.5
62
North
ern
Hig
hla
nd
Rura
l 2
2%
46.4
4.7
39%
1.6
16%
50%
3%
42%
19%
67%
44%
0.5
62%
8%
2.1
2.3
79
Centra
l-North
ern
H
ighla
nd
Rura
l 1
9%
49.7
4.9
40%
1.9
29%
36%
5%
37%
28%
67%
28%
0.7
34%
9%
2.2
3.2
105
Bugesera
Rura
l 2
3%
45.7
4.7
42%
1.3
15%
59%
3%
29%
23%
35%
25%
0.6
53%
17%
2.3
3.6
71
Easte
rn P
late
au
Rura
l 1
9%
47.3
4.8
47%
1.7
19%
48%
2%
52%
52%
67%
43%
0.6
45%
20%
2.2
4.3
65
South
easte
rn P
late
au
Sem
i-Urb
an
6%
46.7
4.9
36%
1.7
18%
36%
5%
38%
40%
56%
37%
0.6
26%
23%
2.2
0.7
68
Rura
l 1
1%
48.0
4.6
40%
1.6
16%
39%
4%
46%
40%
62%
45%
0.6
31%
15%
2.2
5.5
65
Easte
rn A
gro
pasto
ral
Rura
l 7
%
47.1
5.5
43%
1.9
20%
34%
5%
63%
47%
66%
43%
1.8
42%
12%
2.5
6.7
106
Easte
rn S
em
i-Arid
Agro
pasto
ral
Rura
l 1
1%
43.9
4.9
33%
1.6
14%
39%
1%
55%
37%
86%
57%
0.5
49%
8%
2.5
10.9
144
Rw
anda
Avera
ge
21
%
47.0
5.0
36%
1.6
21%
39%
4%
39%
37%
58%
29%
0.6
38%
16%
2.2
3.6
72
Sourc
e: C
FSVA a
nd N
utritio
n S
urv
ey, 2
012
108 C
ell c
olo
ur c
odin
g: S
hades o
f gre
en in
dic
ate
indic
ato
rs re
lativ
ely
good fo
r food s
ecurity
com
pare
d to
the n
atio
nal a
vera
ge (th
e d
ark
er th
e b
ette
r), Shades o
f red a
round in
dic
ato
rs th
at a
re
rela
tively
bad fo
r food s
ecurity
com
pare
d to
the n
atio
nal a
vera
ge (th
e d
ark
er th
e w
ors
e).

P a g e | 70
Children in the northern and in the western livelihood zones are more stunted
The northern livelihood zones have the worse stunting rates of the country, exceeding 60% in
rural areas followed by areas bordering Lake Kivu where in rural areas where the prevalence of
stunting is estimated at 51%, and along the Congo Nile Crest (50%) (see Map 11).
Map 11: Distribution of stunting
Source: CFSVA and Nutrition Survey, 2012
Table 17 displays the values of the main indicators that through modelling were found to be
significant predictors of stunting for each livelihood zone, and highlights in colour the values that
are extreme in these areas (green shades for values that are relatively better than elsewhere in
the country and red for those that are relatively worse).
According to Table 17, the only factors included in the regression model that could explain the high
rates of stunting in the Northwest Volcanic rural areas would be inappropriate feeding practices of
children between 12 and 23 months (78% of children are fed un-nutritious ‘bouillie’, the highest
percentage in Rwanda), and the relatively high percentage of uneducated mothers (30% compared
to 23% nationally).
More explanatory factors come up for the northern highland areas, where mothers are on average
much younger and less educated than elsewhere in the country (33% uneducated compared to a
national average of 23%) and levels of poverty are among the highest in Rwanda (58% of children
in the lowest two wealth quintiles compared to a national average of 40%). Child feeding practices
are worse than in other areas, with no children between 12 and 23 months receiving any milk
products known to be essential for the development of children that age (while the national
average is 20% of children being fed milk products). Land in the northern highland areas is more
sloping and therefore less suitable for agriculture.
Kigali City is the province where prevalence of stunting is by far the lowest (19% in urban areas
and 32% in rural areas). Table 17 suggests that this is due to the low rate of poverty, especially in
urban areas, overall better educated mothers, closer services (in this case hospitals), and much
more adequate feeding practices for children between 12 and 23 months than in the rest of the
country, with high percentages of children consuming formula, milk products, eggs, and less being
fed from the common household pot (beans).
Because the survey was geared towards food security and not health or hygiene practices in the
households, the model did not allow for demonstrating the essential role of health and hygiene in
ensuring nutrition security for children. This does not preclude that these - and probably other
factors as well - certainly have an influence on child development and stunting. These should be
researched more deeply, especially in the northern areas where low education and poor feeding
practices alone cannot explain why stunting affects three in five children.

6
P a g e | 71
Table 17: Understanding malnutrition by livelihood zone109
Mother Household
Child Diet
Livelihood zone
Stu
nting r
ate
Sm
all b
irth
siz
e
Age
Stu
nte
d
Uneducate
d
Abje
ct
/ Very
Poor
Ubudehe
2 p
oore
st
wealth
quin
tile
s
Cro
wdin
g index
Not
suitable
slo
pes %
Dis
tance t
o h
ospital
(min
ute
s)
Exclu
siv
e b
reastf
din
g
Form
ula
Milk -
pro
ducts
Eggs
Beans (
hh p
ot)
Tubers
Bouillie
Kigali City Urban 19% 13% 31 1% 5% 6% 5% 3.1 4% 35 57% 9% 37% 5% 33% 46% 71%
Semi-Urban 32% 29% 32 0% 23% 29% 28% 2.6 15% 78 63% 8% 33% 8% 58% 58% 75%
Lake Kivu Semi-Urban 44% 14% 33 6% 10% 14% 29% 2.0 7% 43 59% 0% 9% 0% 36% 36% 55%
Rural 50% 20% 31 2% 17% 16% 26% 2.4 10% 60 66% 1% 8% 2% 39% 38% 74%
West Congo-Nile Crest Rural 51% 7% 31 2% 29% 17% 43% 2.8 17% 75 58% 0% 10% 3% 46% 71% 54%
Northwest Volcanic Urban 40% 6% 32 0% 10% 14% 11% 2.3 6% 28 83% 0% 50% 0% 67% 83% 67%
Rural 61% 9% 31 1% 30% 19% 31% 2.4 7% 57 73% 2% 22% 2% 44% 54% 78%
East Congo-Nile Highland Rural 50% 14% 32 4% 22% 19% 50% 2.6 21% 77 73% 0% 14% 5% 62% 63% 56%
Central Plateau Semi-Urban 39% 19% 33 1% 16% 15% 50% 2.5 3% 58 65% 0% 21% 7% 29% 57% 57%
Rural 42% 15% 32 2% 26% 20% 49% 2.8 6% 69 58% 3% 30% 3% 36% 52% 62%
Northern Highland Rural 60% 14% 29 1% 33% 8% 58% 2.5 29% 78 66% 0% 0% 0% 43% 33% 52%
Central-Northern Highland Rural 44% 17% 31 1% 27% 9% 32% 2.6 28% 73 70% 0% 10% 0% 58% 58% 60%
Bugesera Rural 48% 14% 31 4% 36% 17% 59% 2.7 0% 54 65% 0% 21% 0% 71% 87% 61%
Eastern Plateau Rural 43% 14% 31 1% 16% 20% 45% 2.7 6% 63 77% 0% 14% 0% 70% 56% 72%
Southeastern Plateau Semi-Urban 40% 11% 31 2% 40% 23% 37% 2.7 3% 71 72% 9% 27% 9% 73% 45% 73%
Rural 35% 17% 32 2% 19% 15% 28% 2.6 4% 65 77% 1% 22% 3% 74% 57% 64%
Eastern Agropastoral Rural 38% 18% 32 1% 35% 12% 48% 2.8 4% 102 54% 3% 16% 0% 51% 38% 68%
Eastern Semi-Arid Agropastoral Rural 45% 15% 32 0% 37% 8% 57% 3.2 4% 129 55% 6% 11% 0% 83% 56% 67%
Rwanda average 43% 15% 32 2% 23% 16% 40% 2.7 10% 65.7 66% 2% 20% 3% 51% 54% 65%
Source: CFSVA and Nutrition Survey, 2012
109 Green indicates relatively good compared to the national average; red relatively bad compared to the national average.
Pa
ge
| 71
Table 17: Understanding m
alnutrition by livelihood zone109
Moth
er
Household
Child
Die
t
Liv
elih
ood z
one
Stunting rate
Small birthsize
Age
Stunted
Uneducated
Abject / Very Poor
Ubudehe
2 poorest wealth
quintiles
Crowding index
Not suitable slopes %
Distance to hospital
(minutes)
Exclusive breastfding
Formula
Milk - products
Eggs
Beans (hh pot)
Tubers
Bouillie
Kig
ali C
ity
Urb
an
19
%
13%
3
1
1%
5%
6%
5%
3
.1
4%
3
5
57%
9%
37%
5%
33%
46%
71%
Sem
i-Urb
an
32
%
29%
3
2
0%
23%
29%
28%
2
.6
15%
7
8
63%
8%
33%
8%
58%
58%
75%
Lake K
ivu
Sem
i-Urb
an
44
%
14%
3
3
6%
10%
14%
29%
2
.0
7%
4
3
59%
0%
9%
0%
36%
36%
55%
Rura
l 5
0%
20%
3
1
2%
17%
16%
26%
2
.4
10%
6
0
66%
1%
8%
2%
39%
38%
74%
West C
ongo-N
ile C
rest
Rura
l 5
1%
7%
3
1
2%
29%
17%
43%
2
.8
17%
7
5
58%
0%
10%
3%
46%
71%
54%
North
west V
olc
anic
U
rban
40
%
6%
3
2
0%
10%
14%
11%
2
.3
6%
2
8
83%
0%
50%
0%
67%
83%
67%
Rura
l 6
1%
9%
3
1
1%
30%
19%
31%
2
.4
7%
5
7
73%
2%
22%
2%
44%
54%
78%
East C
ongo-N
ile H
ighla
nd
Rura
l 5
0%
14%
3
2
4%
22%
19%
50%
2
.6
21%
7
7
73%
0%
14%
5%
62%
63%
56%
Centra
l Pla
teau
Sem
i-Urb
an
39
%
19%
3
3
1%
16%
15%
50%
2
.5
3%
5
8
65%
0%
21%
7%
29%
57%
57%
Rura
l 4
2%
15%
3
2
2%
26%
20%
49%
2
.8
6%
6
9
58%
3%
30%
3%
36%
52%
62%
North
ern
Hig
hla
nd
Rura
l 6
0%
14%
2
9
1%
33%
8%
58%
2
.5
29%
7
8
66%
0%
0%
0%
43%
33%
52%
Centra
l-North
ern
Hig
hla
nd
Rura
l 4
4%
17%
3
1
1%
27%
9%
32%
2
.6
28%
7
3
70%
0%
10%
0%
58%
58%
60%
Bugesera
Rura
l 4
8%
14%
3
1
4%
36%
17%
59%
2
.7
0%
5
4
65%
0%
21%
0%
71%
87%
61%
Easte
rn P
late
au
Rura
l 4
3%
14%
3
1
1%
16%
20%
45%
2
.7
6%
6
3
77%
0%
14%
0%
70%
56%
72%
South
easte
rn P
late
au
Sem
i-Urb
an
40
%
11%
3
1
2%
40%
23%
37%
2
.7
3%
7
1
72%
9%
27%
9%
73%
45%
73%
Rura
l 3
5%
17%
3
2
2%
19%
15%
28%
2
.6
4%
6
5
77%
1%
22%
3%
74%
57%
64%
Easte
rn A
gro
pasto
ral
Rura
l 3
8%
18%
3
2
1%
35%
12%
48%
2
.8
4%
1
02
54%
3%
16%
0%
51%
38%
68%
Easte
rn S
em
i-Arid
Agro
pasto
ral
Rura
l 4
5%
15%
3
2
0%
37%
8%
57%
3
.2
4%
1
29
55%
6%
11%
0%
83%
56%
67%
Rw
anda
avera
ge
43
%
15
%
32
2
%
23
%
16
%
40
%
2.7
1
0%
6
5.7
6
6%
2
%
20
%
3%
5
1%
5
4%
6
5%
Sourc
e: C
FSVA a
nd N
utritio
n S
urv
ey, 2
012
109 G
reen in
dic
ate
s re
lativ
ely
good c
om
pare
d to
the n
atio
nal a
vera
ge; re
d re
lativ
ely
bad c
om
pare
d to
the n
atio
nal a
vera
ge.
P a g e | 71
Table 17: Understanding malnutrition by livelihood zone109
Mother Household
Child Diet
Livelihood zone
Stu
nting r
ate
Sm
all b
irth
siz
e
Age
Stu
nte
d
Uneducate
d
Abje
ct
/ Very
Poor
Ubudehe
2 p
oore
st
wealth
quin
tile
s
Cro
wdin
g index
Not
suitable
slo
pes %
Dis
tance t
o h
ospital
(min
ute
s)
Exclu
siv
e b
reastf
din
g
Form
ula
Milk -
pro
ducts
Eggs
Beans (
hh p
ot)
Tubers
Bouillie
Kigali City Urban 19% 13% 31 1% 5% 6% 5% 3.1 4% 35 57% 9% 37% 5% 33% 46% 71%
Semi-Urban 32% 29% 32 0% 23% 29% 28% 2.6 15% 78 63% 8% 33% 8% 58% 58% 75%
Lake Kivu Semi-Urban 44% 14% 33 6% 10% 14% 29% 2.0 7% 43 59% 0% 9% 0% 36% 36% 55%
Rural 50% 20% 31 2% 17% 16% 26% 2.4 10% 60 66% 1% 8% 2% 39% 38% 74%
West Congo-Nile Crest Rural 51% 7% 31 2% 29% 17% 43% 2.8 17% 75 58% 0% 10% 3% 46% 71% 54%
Northwest Volcanic Urban 40% 6% 32 0% 10% 14% 11% 2.3 6% 28 83% 0% 50% 0% 67% 83% 67%
Rural 61% 9% 31 1% 30% 19% 31% 2.4 7% 57 73% 2% 22% 2% 44% 54% 78%
East Congo-Nile Highland Rural 50% 14% 32 4% 22% 19% 50% 2.6 21% 77 73% 0% 14% 5% 62% 63% 56%
Central Plateau Semi-Urban 39% 19% 33 1% 16% 15% 50% 2.5 3% 58 65% 0% 21% 7% 29% 57% 57%
Rural 42% 15% 32 2% 26% 20% 49% 2.8 6% 69 58% 3% 30% 3% 36% 52% 62%
Northern Highland Rural 60% 14% 29 1% 33% 8% 58% 2.5 29% 78 66% 0% 0% 0% 43% 33% 52%
Central-Northern Highland Rural 44% 17% 31 1% 27% 9% 32% 2.6 28% 73 70% 0% 10% 0% 58% 58% 60%
Bugesera Rural 48% 14% 31 4% 36% 17% 59% 2.7 0% 54 65% 0% 21% 0% 71% 87% 61%
Eastern Plateau Rural 43% 14% 31 1% 16% 20% 45% 2.7 6% 63 77% 0% 14% 0% 70% 56% 72%
Southeastern Plateau Semi-Urban 40% 11% 31 2% 40% 23% 37% 2.7 3% 71 72% 9% 27% 9% 73% 45% 73%
Rural 35% 17% 32 2% 19% 15% 28% 2.6 4% 65 77% 1% 22% 3% 74% 57% 64%
Eastern Agropastoral Rural 38% 18% 32 1% 35% 12% 48% 2.8 4% 102 54% 3% 16% 0% 51% 38% 68%
Eastern Semi-Arid Agropastoral Rural 45% 15% 32 0% 37% 8% 57% 3.2 4% 129 55% 6% 11% 0% 83% 56% 67%
Rwanda average 43% 15% 32 2% 23% 16% 40% 2.7 10% 65.7 66% 2% 20% 3% 51% 54% 65%
Source: CFSVA and Nutrition Survey, 2012
109 Green indicates relatively good compared to the national average; red relatively bad compared to the national average.

P a g e | 72
As shown by Map 12, that overlays prevalence of unacceptable food consumption with stunting,
the areas with the highest rates of households with unacceptable food consumption are also those
with the highest prevalence of stunting, except in the northern volcanic areas, which have very
high stunting but average percentages of households with poor food consumption.
Map 12: Distribution of unacceptable food consumption and stunting
Source: CFSVA and Nutrition Survey, 2012
Provincial distribution of food insecurity
Some 65% of all rural households with unacceptable food consumption and over half (53%) of
rural households with stunted children live in the western and southern provinces.
Rates of acceptable food consumption are lowest in the western province followed by the southern
province. The province with the highest share of households with acceptable food consumption is
by far Kigali (between 88% and 96% households have acceptable food consumption) followed by
the eastern province (between 84% and 88%, see Figure 41).
The western province accounts for the largest numbers and highest rates of food insecure
households. Although it is home to less than a quarter of all Rwandan households, half of all
households with poor food consumption live there, as do 38% of those with borderline food
consumption, 30% of those reporting any food access issues and 28% of households with one or
more stunted children under five. Between 59% and 65% of households there have acceptable
food consumption (compared with 79% nationally), and only one third of households reported not
having had any problems in providing food for their household in the 12 months preceding the
survey. Seasonal food access issues were reported there by 29% of the households, a higher
proportion than any other province (see Figure 42).

P a g e | 73
Figure 41: Household levels of food consumption in Rwanda in March/April 2012 (CI: 95%)
Source: CFSVA and Nutrition Survey, 2012
Figure 42: Percentage of households reporting seasonal, acute and chronic difficulties in accessing food, by province
Source: CFSVA and Nutrition Survey, 2012
Households that reported acute food access issues are more prevalent in the northern and western
provinces (22% and 20% of households respectively) compared with other provinces. The lowest
percentage is in Kigali City (7%).
Provincial distribution of malnutrition
Figure 43 illustrates that child stunting is highest in the northern and western provinces where
more than half of children are stunted, and lowest in Kigali (fewer than one in four). Underweight
is significantly lower in Kigali than in other provinces. Wasting is highest in the southern and
eastern provinces and lowest in Kigali.
The rates of malnutrition for women of reproductive age by province are given in Annex 3. The
survey results are in line with those of the 2010 DHS, showing that women in Kigali are more
likely to be overweight than elsewhere, but all other malnutrition indicators seem to be lower there
(although the differences are not significant for this survey).
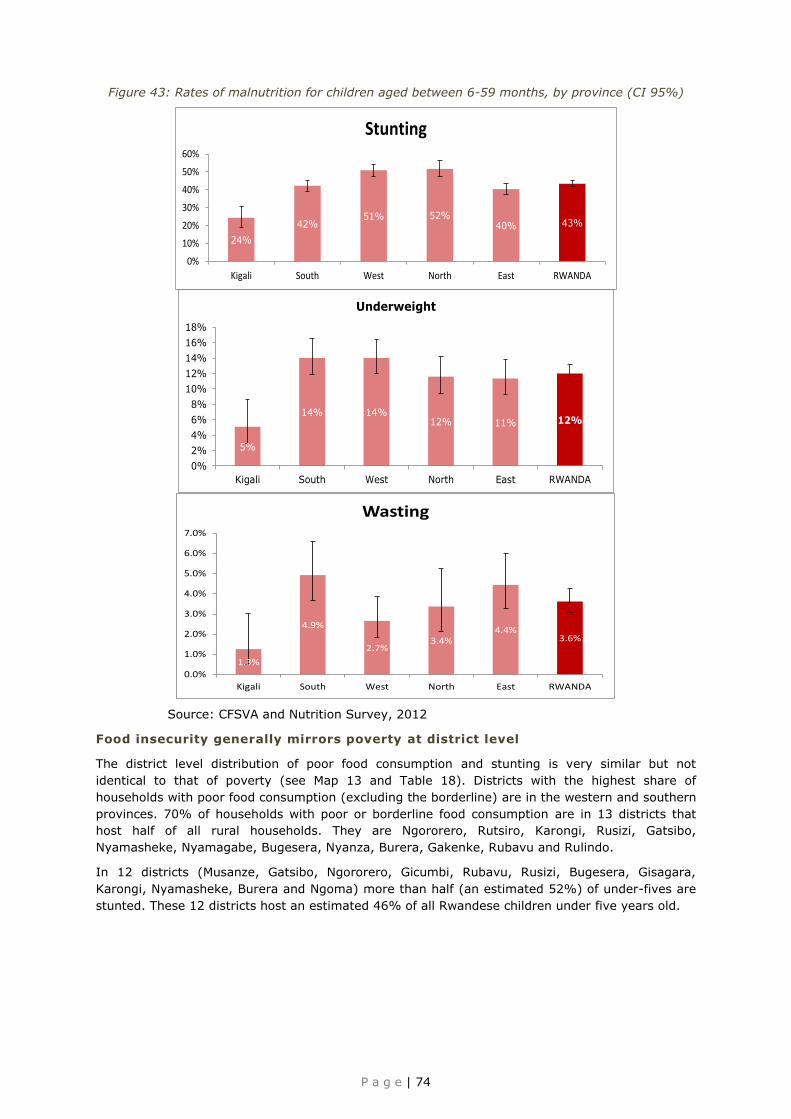
P a g e | 74
Figure 43: Rates of malnutrition for children aged between 6-59 months, by province (CI 95%)
Source: CFSVA and Nutrition Survey, 2012
Food insecurity generally mirrors poverty at district level
The district level distribution of poor food consumption and stunting is very similar but not
identical to that of poverty (see Map 13 and Table 18). Districts with the highest share of
households with poor food consumption (excluding the borderline) are in the western and southern
provinces. 70% of households with poor or borderline food consumption are in 13 districts that
host half of all rural households. They are Ngororero, Rutsiro, Karongi, Rusizi, Gatsibo,
Nyamasheke, Nyamagabe, Bugesera, Nyanza, Burera, Gakenke, Rubavu and Rulindo.
In 12 districts (Musanze, Gatsibo, Ngororero, Gicumbi, Rubavu, Rusizi, Bugesera, Gisagara,
Karongi, Nyamasheke, Burera and Ngoma) more than half (an estimated 52%) of under-fives are
stunted. These 12 districts host an estimated 46% of all Rwandese children under five years old.
24%
42%51% 52%
40% 43%
0%
10%
20%
30%
40%
50%
60%
Kigali South West North East RWANDA
Stunting
5%
14% 14%12% 11% 12%
0%
2%
4%
6%
8%
10%
12%
14%
16%
18%
Kigali South West North East RWANDA
Underweight
1.3%
4.9%
2.7%3.4%
4.4%3.6%
0.0%
1.0%
2.0%
3.0%
4.0%
5.0%
6.0%
7.0%
Kigali South West North East RWANDA
Wasting

P a g e | 75
Map 13: Distribution of households in the poorest two wealth quintiles
Source: CFSVA and Nutrition Survey, 2012
Box 14: Summary - Where do the food insecure and the malnourished live?
The rural areas of the livelihood zones bordering Lake Kivu and West of the Congo Nile Crest have
the highest percentages of households with unacceptable food consumption (42% and 43%
respectively) followed by the East Congo Nile Crest (29%). The northern livelihood zones have the
worst stunting rates of the country, exceeding 60% in rural areas followed by areas bordering Lake
Kivu where in rural areas where the prevalence of stunting is estimated at 51%, and along the
Congo Nile Crest (50%).
The province where the proportion of households with acceptable food consumption is highest is by
far Kigali110 followed by the eastern province.111 The highest prevalence of stunting is in the
northern112 and western113 provinces followed by the southern114 and eastern.115 Kigali has the
lowest estimated prevalence of stunting of all provinces.116
Areas with the highest rates of households with poor food consumption are also the areas where
the prevalence of stunting is highest except in the northern volcanic areas which have very high
stunting but average percentages of households with poor food consumption.
The district level distribution of poor food consumption is very similar to that of poverty: districts
with the highest share of households with poor food consumption are in the western and southern
provinces.
110 With between 88% and 96% households with acceptable food consumption. 111
Between 84% and 88% households with acceptable food consumption. 112 (51.7%, CI 47.4-56.1%). 113 (50.9%, CI 47.3-54.4%). 114 (42.2%, CI 39.2-45.3%). 115 (40.3%, CI 37,2-43.5%). 116 (24.4%, CI 18.9-30.7%).
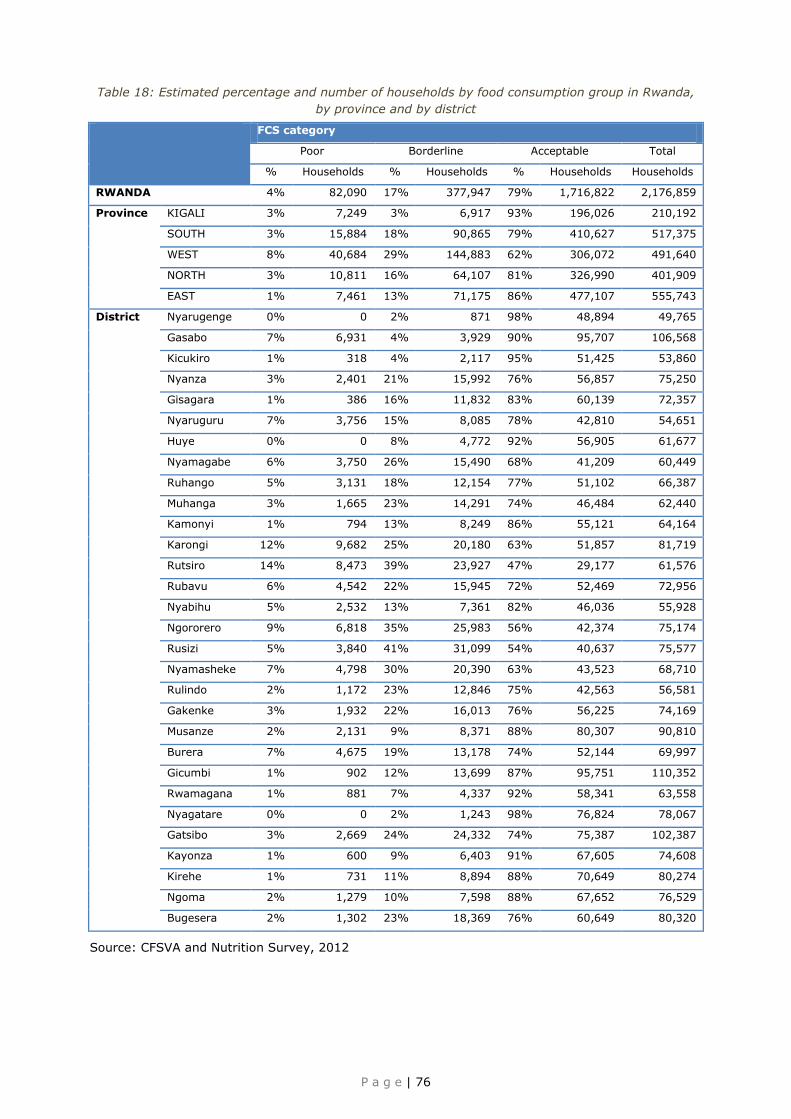
P a g e | 76
Table 18: Estimated percentage and number of households by food consumption group in Rwanda,
by province and by district
FCS category
Poor Borderline Acceptable Total
% Households % Households % Households Households
RWANDA 4% 82,090 17% 377,947 79% 1,716,822 2,176,859
Province KIGALI 3% 7,249 3% 6,917 93% 196,026 210,192
SOUTH 3% 15,884 18% 90,865 79% 410,627 517,375
WEST 8% 40,684 29% 144,883 62% 306,072 491,640
NORTH 3% 10,811 16% 64,107 81% 326,990 401,909
EAST 1% 7,461 13% 71,175 86% 477,107 555,743
District Nyarugenge 0% 0 2% 871 98% 48,894 49,765
Gasabo 7% 6,931 4% 3,929 90% 95,707 106,568
Kicukiro 1% 318 4% 2,117 95% 51,425 53,860
Nyanza 3% 2,401 21% 15,992 76% 56,857 75,250
Gisagara 1% 386 16% 11,832 83% 60,139 72,357
Nyaruguru 7% 3,756 15% 8,085 78% 42,810 54,651
Huye 0% 0 8% 4,772 92% 56,905 61,677
Nyamagabe 6% 3,750 26% 15,490 68% 41,209 60,449
Ruhango 5% 3,131 18% 12,154 77% 51,102 66,387
Muhanga 3% 1,665 23% 14,291 74% 46,484 62,440
Kamonyi 1% 794 13% 8,249 86% 55,121 64,164
Karongi 12% 9,682 25% 20,180 63% 51,857 81,719
Rutsiro 14% 8,473 39% 23,927 47% 29,177 61,576
Rubavu 6% 4,542 22% 15,945 72% 52,469 72,956
Nyabihu 5% 2,532 13% 7,361 82% 46,036 55,928
Ngororero 9% 6,818 35% 25,983 56% 42,374 75,174
Rusizi 5% 3,840 41% 31,099 54% 40,637 75,577
Nyamasheke 7% 4,798 30% 20,390 63% 43,523 68,710
Rulindo 2% 1,172 23% 12,846 75% 42,563 56,581
Gakenke 3% 1,932 22% 16,013 76% 56,225 74,169
Musanze 2% 2,131 9% 8,371 88% 80,307 90,810
Burera 7% 4,675 19% 13,178 74% 52,144 69,997
Gicumbi 1% 902 12% 13,699 87% 95,751 110,352
Rwamagana 1% 881 7% 4,337 92% 58,341 63,558
Nyagatare 0% 0 2% 1,243 98% 76,824 78,067
Gatsibo 3% 2,669 24% 24,332 74% 75,387 102,387
Kayonza 1% 600 9% 6,403 91% 67,605 74,608
Kirehe 1% 731 11% 8,894 88% 70,649 80,274
Ngoma 2% 1,279 10% 7,598 88% 67,652 76,529
Bugesera 2% 1,302 23% 18,369 76% 60,649 80,320
Source: CFSVA and Nutrition Survey, 2012

7
P a g e | 77
Box 15: Comparing the district distribution of poor households (according to EICV 3) and percentage of households in the two poorest wealth quintiles (according to CFSVA and Nutrition Survey 2012)
As shown by Figure 44, even though the data was collected at different times and the indicators are based on a completely different methodology, both the EICV 3
poverty indicator and CFSVA and Nutrition Survey 2012 wealth index show very similar patterns in district level distribution of poverty,117 confirming that poverty
is largely a rural phenomenon and that a higher share of poor households can be found in the southern province than in all other provinces.
Figure 44: Percentage of poor households (according to EICV 3) and percentage of households in the two poorest wealth quintiles (according to CFSVA and
Nutrition Survey 2012) per district.
Source: EICV 3 for poverty estimates and CFSVA and Nutrition Survey 2012 for households in the poorest wealth quintiles
117 Note that wealth quintiles are based on asset wealth, whereas the EICV 3 poverty calculations are based on consumption figures. Considering that they are not calculated in the
same way or over the same period the observed differences between the two indicators can be considered quite small.
Pa
ge
| 77
Box 15: C
omparing the district distribution of poor households (according to EIC
V 3) and
percentage of households in the two poorest w
ealth quintiles (according to CFS
VA and N
utrition Survey 2012)
As s
how
n b
y F
igure
44, e
ven th
ough th
e d
ata
was c
olle
cte
d a
t diffe
rent tim
es a
nd th
e in
dic
ato
rs a
re b
ased o
n a
com
ple
tely
diffe
rent m
eth
odolo
gy, b
oth
the E
ICV 3
poverty
indic
ato
r and C
FSVA a
nd N
utritio
n S
urv
ey 2
012 w
ealth
index s
how
very
sim
ilar p
atte
rns in
dis
trict le
vel d
istrib
utio
n o
f poverty
,117 c
onfirm
ing th
at p
overty
is la
rgely
a ru
ral p
henom
enon a
nd th
at a
hig
her s
hare
of p
oor h
ousehold
s c
an b
e fo
und in
the s
outh
ern
pro
vin
ce th
an in
all o
ther p
rovin
ces.
Fig
ure
44:
Perc
enta
ge of
poor
household
s (a
ccord
ing to
EIC
V 3)
and perc
enta
ge of
household
s in
th
e tw
o poore
st
wealth
quin
tiles (a
ccordin
g to
CFSVA and
Nutritio
n S
urv
ey 2
012) p
er d
istric
t.
Sourc
e: E
ICV 3
for p
overty
estim
ate
s a
nd C
FSVA a
nd N
utritio
n S
urv
ey 2
012 fo
r household
s in
the p
oore
st w
ealth
quin
tiles
117 N
ote
that w
ealth
quin
tiles a
re b
ased o
n a
sset w
ealth
, where
as th
e E
ICV 3
poverty
calc
ula
tions a
re b
ased o
n c
onsum
ptio
n fig
ure
s. C
onsid
erin
g th
at th
ey are
not c
alc
ula
ted in
the
sam
e w
ay o
r over th
e s
am
e p
erio
d th
e o
bserv
ed d
iffere
nces b
etw
een th
e tw
o in
dic
ato
rs c
an b
e c
onsid
ere
d q
uite
sm
all.

P a g e | 78
5 HOW SHOCKS IMPACT FOOD SECURITY
5.1 RISK AND VULNERABILITY APPROACH
The objective of a food security risk analysis is to identify populations and regions likely to
experience serious declines in their future food security status because of the effects of a particular
hazard. Within the context of the 2012 Rwanda CFSVA and Nutrition Survey, risk analysis
combines hazard analysis with vulnerability analysis. The nature and extent of potential hazards
and existing conditions of vulnerability that together could harm exposed people, property,
services, livelihoods and the environment on which they depend are analysed and evaluated.
The purpose of a vulnerability analysis is to estimate reasonably well how many households in a
certain area would become food insecure if a specific hazard occurred in that area. The first task in
conducting a vulnerability analysis is to assess the types of shocks communities and households
are typically exposed to and how effective their strategies for managing risk are.
Household livelihood strategies and outcomes, including food security, are influenced by the
environment in which people live. Within this environment, critical trends (e.g. population growth,
national and international economic trends, governance and technological changes), seasonal
cycles (of prices, production, livelihood strategies) and shocks (natural and man-made) frame the
vulnerability context.118
Box 16: Definitions useful for food security risk analysis119
Food security risk analysis: A methodology to determine the nature and extent of risk to food
security by analysing potential hazards and evaluating existing conditions of vulnerability that could pose a threat to household food security.
Hazard/shock: The potential to cause harm; also, the probability of a potentially damaging phenomenon occurring within a given time period and area. A hazard can be expressed mathematically as the probability of occurrence of an event of certain intensity, in a specific site, and during a determined period of exposure.
Hazard/shock analysis: Identification, study and monitoring of any hazard/shock to determine its potential, origin, characteristics and behaviour.
Vulnerability to food insecurity: The conditions that increase the susceptibility of a household to the effect of hazards on its food security. Vulnerability is a function of a household’s exposure to a specific hazard (e.g. flood, drought) and its coping capacity (or the direct impact of the hazard on the household, mitigated by its coping capacity).
Coping capacity: The means by which a household uses available resources to face adverse
consequences that could lead to a decrease in household level food security.
Risk to food insecurity: The probability of food insecurity resulting from interactions between a natural or human-induced hazard and vulnerable conditions. The probability of a loss of food security depends on the hazard, vulnerability of households, and the number of households in the affected area. This relationship can be represented by the following equation: R = H • Pop • Vul
Where: R is the risk for food insecurity (in number of hh/year in a sub-area)
H is the hazard, which depends on the probability of a given hazard of a certain intensity in that area (in percentage) Pop is the population living in a the area (in number of hh) Vul is the vulnerability of the population (a function of the exposure of lives and livelihoods and household resilience with regard to the effects on their food security) (as a percentage of all hhs in the sub-area)
118 DFID (1999) Sustainable Livelihood Guidance Sheet, Department for International Development. 119 Source: adapted from the United Nations International Strategy for Disaster Reduction (UN-ISDR) terminology.

P a g e | 79
5.2 MAIN SHOCKS
A shock is any event that may affect the food security and the nutrition status of a household. For
analysis sake the described shocks we categorized as either covariate120 (affecting the community)
or idiosyncratic121 (at household level).
The shock inventory, presented in Table 19, identifies the types of shocks that have a possibility of
occurring in a given area of the country. For this report the list of shocks was based on secondary
information provided by MIDIMAR on hazards/risks most likely to produce the shocks that incur
the most severe impacts at household level. This information was completed with household and
community level information collected during the CFSVA and Nutrition Survey 2012.
The household questionnaire of the CFSVA and Nutrition Survey 2012 asked if households had
been exposed to any unusual situation during the last year that affected their ability to provide for
themselves, eat in the manner they were accustomed to, or affected what the households owned.
Nationally, 38% of the sampled households experienced such situations, peaking at 54% in the
western province. In other provinces the share of households mentioning a shock was lower (21%
in Kigali and between 32% and 36% in the other three provinces). Shocks were reported more in
rural areas (41%) than urban or peri urban areas (26% and 25% respectively). Districts where
more than 50% of households reported a shock are Ngororero (81%), Rutsiro (78%), Nyabihu
(66%), Kirehe (64%), Gatsibo (62%), and Karongi (54%).
Table 19: Community and household level shocks
Covariate (community level) shocks Idiosyncratic (household level) shocks
Natural hazard induced disasters: Hydro meteorological disasters
Rainfall deficit/irregular rains, prolonged dry spell Floods Landslides and mudslides Hailstones Geophysical disasters Earthquake Volcanic activity Biological disasters122 Unusually high level of crop pests and disease Unusually high level of livestock diseases Unusually high level of human disease/epidemic123 Socio-economic shocks Insecurity/violence Unusually high prices for food Unusually high cost of agricultural inputs (seed, fertilizer etc)
Loss or reduced income for a household member
Serious illness or accident of household member Death of the head of the household Death of a working household member Death of other household member Theft of productive resources Fires
Source: MIDIMAR and CFSVA and Nutrition Survey, 2012
Among livelihood groups, low income agriculturalists and agro-pastoralists reported most shocks,
(48% and 46% respectively), followed by 38% of unskilled daily labourers and 37% of agricultural
workers. Only 14% of medium to high income agriculturalists reported having experienced a shock
that affected their ability to provide for their households. Since it is unlikely that the high income
agriculturalists experienced fewer shocks than other households this low percentage probably
indicates that the shocks did not affect their ability to provide for their households. This hypothesis
120 Covariate shock or disaster: a serious disruption of the functioning of a community or a society involving widespread human, material, economic or environmental losses and impacts, which exceeds the ability of the affected community or society to cope using its own resources. (Adapted from UNSIDR definitions for Disaster Risk Reduction, 2009). 121 Idiosyncratic shock or household level shock: event with a negative impact on nutrition status and/or food security of the household. (Adapted from the WFP EFSA handbook second edition’s definition). 122 Epidemics are considered as Biological Hazards (UNISDR Terminology for Disaster Risk Reduction). This classification follows the definitions of Natural Disaster by the UN Office for the Coordination of Humanitarian Affairs, “natural disasters can be divided into three specific groups: hydro meteorological disasters, geophysical disasters and biological disasters”. 123 Epidemic is a biological hazard (as per UNISDR definition, 2009).

P a g e | 80
is supported by Figure 45 which shows that richer households reported fewer shocks than poorer.
It also indicates that the wealth quintile is a good proxy for the household coping capacity.
Figure 45: Share of households reporting shocks in the 12 months preceding the interview, by reported food access problems and wealth quintiles
Source: CFSVA and Nutrition Survey, 2012
Table 20 shows that the most commonly reported shocks are related to illness, accident, inability
to work and death of a household member (reported by 15% of all households, or 39% of
households that reported a shock) followed by rainfall deficits, irregular rains or dry spells (8% of
all households). All the other shocks were reported by less than 5% of all households and included
floods (2%) and unusually high prices of food (1% of all households).
The types of main shocks reported by a household obviously depend on the household livelihood.
For example, households relying on agricultural or livestock production tend to report the climate
related shocks they experienced, while households relying on labour or other more urban activities
tend to report more shocks related to the inability of a household member to work.
The distribution of the reported shocks, as well as the types of households reporting them, again
indicates that households in the western province have more difficulties in their daily lives. In fact,
the western province accounts for one third of all the households reporting at least one shock. The
shocks that were most reported in the western province are climate related (36% of households
reporting at least one shock) or involve the illness/accident of one of their household members
(30% of the households reporting at least one shock).
It also confirms that rural households, poorer households and those headed by women and
disabled people are experiencing more difficulties in their daily lives. Almost three quarters (71%)
of households that had to deal with chronic difficulties in accessing food had experienced at least
one shock in the year preceding the interview, which is higher than for households that reported
having seasonal or acute issues with getting food (see Figure 45).
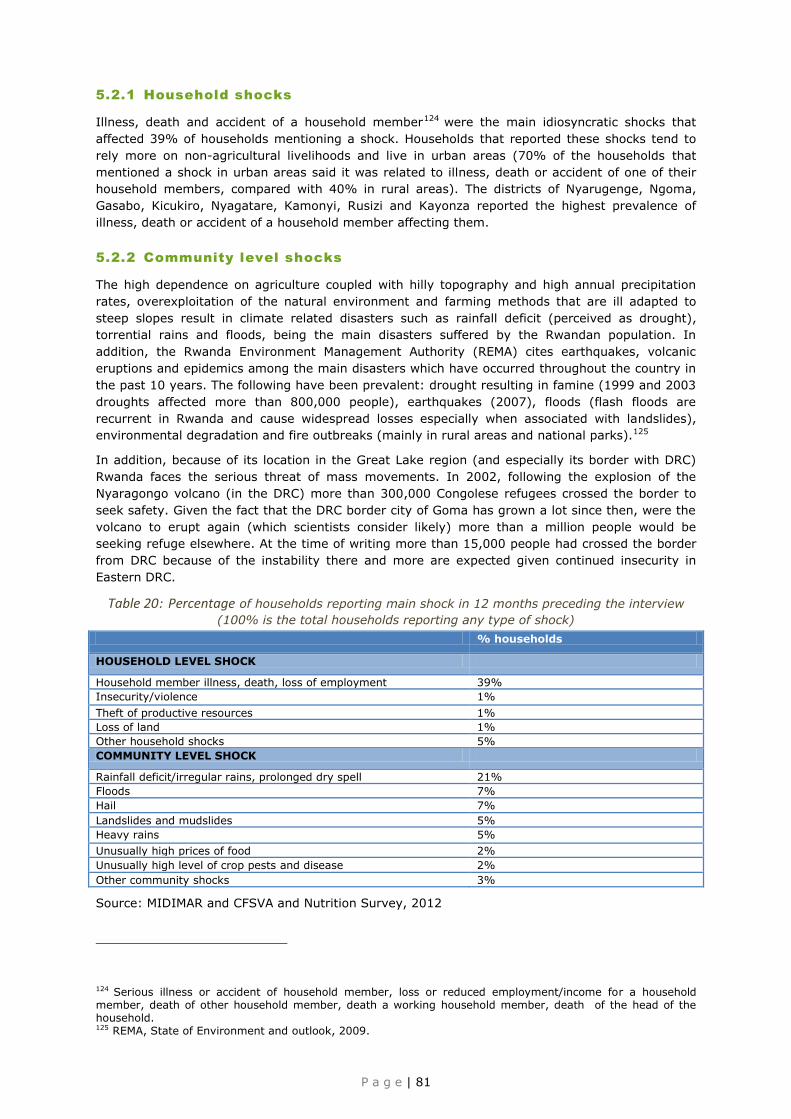
P a g e | 81
5.2.1 Household shocks
Illness, death and accident of a household member124 were the main idiosyncratic shocks that
affected 39% of households mentioning a shock. Households that reported these shocks tend to
rely more on non-agricultural livelihoods and live in urban areas (70% of the households that
mentioned a shock in urban areas said it was related to illness, death or accident of one of their
household members, compared with 40% in rural areas). The districts of Nyarugenge, Ngoma,
Gasabo, Kicukiro, Nyagatare, Kamonyi, Rusizi and Kayonza reported the highest prevalence of
illness, death or accident of a household member affecting them.
5.2.2 Community level shocks
The high dependence on agriculture coupled with hilly topography and high annual precipitation
rates, overexploitation of the natural environment and farming methods that are ill adapted to
steep slopes result in climate related disasters such as rainfall deficit (perceived as drought),
torrential rains and floods, being the main disasters suffered by the Rwandan population. In
addition, the Rwanda Environment Management Authority (REMA) cites earthquakes, volcanic
eruptions and epidemics among the main disasters which have occurred throughout the country in
the past 10 years. The following have been prevalent: drought resulting in famine (1999 and 2003
droughts affected more than 800,000 people), earthquakes (2007), floods (flash floods are
recurrent in Rwanda and cause widespread losses especially when associated with landslides),
environmental degradation and fire outbreaks (mainly in rural areas and national parks).125
In addition, because of its location in the Great Lake region (and especially its border with DRC)
Rwanda faces the serious threat of mass movements. In 2002, following the explosion of the
Nyaragongo volcano (in the DRC) more than 300,000 Congolese refugees crossed the border to
seek safety. Given the fact that the DRC border city of Goma has grown a lot since then, were the
volcano to erupt again (which scientists consider likely) more than a million people would be
seeking refuge elsewhere. At the time of writing more than 15,000 people had crossed the border
from DRC because of the instability there and more are expected given continued insecurity in
Eastern DRC.
Table 20: Percentage of households reporting main shock in 12 months preceding the interview
(100% is the total households reporting any type of shock)
% households
HOUSEHOLD LEVEL SHOCK
Household member illness, death, loss of employment 39%
Insecurity/violence 1%
Theft of productive resources 1%
Loss of land 1%
Other household shocks 5%
COMMUNITY LEVEL SHOCK
Rainfall deficit/irregular rains, prolonged dry spell 21%
Floods 7%
Hail 7%
Landslides and mudslides 5%
Heavy rains 5%
Unusually high prices of food 2%
Unusually high level of crop pests and disease 2%
Other community shocks 3%
Source: MIDIMAR and CFSVA and Nutrition Survey, 2012
124 Serious illness or accident of household member, loss or reduced employment/income for a household member, death of other household member, death a working household member, death of the head of the household. 125 REMA, State of Environment and outlook, 2009.
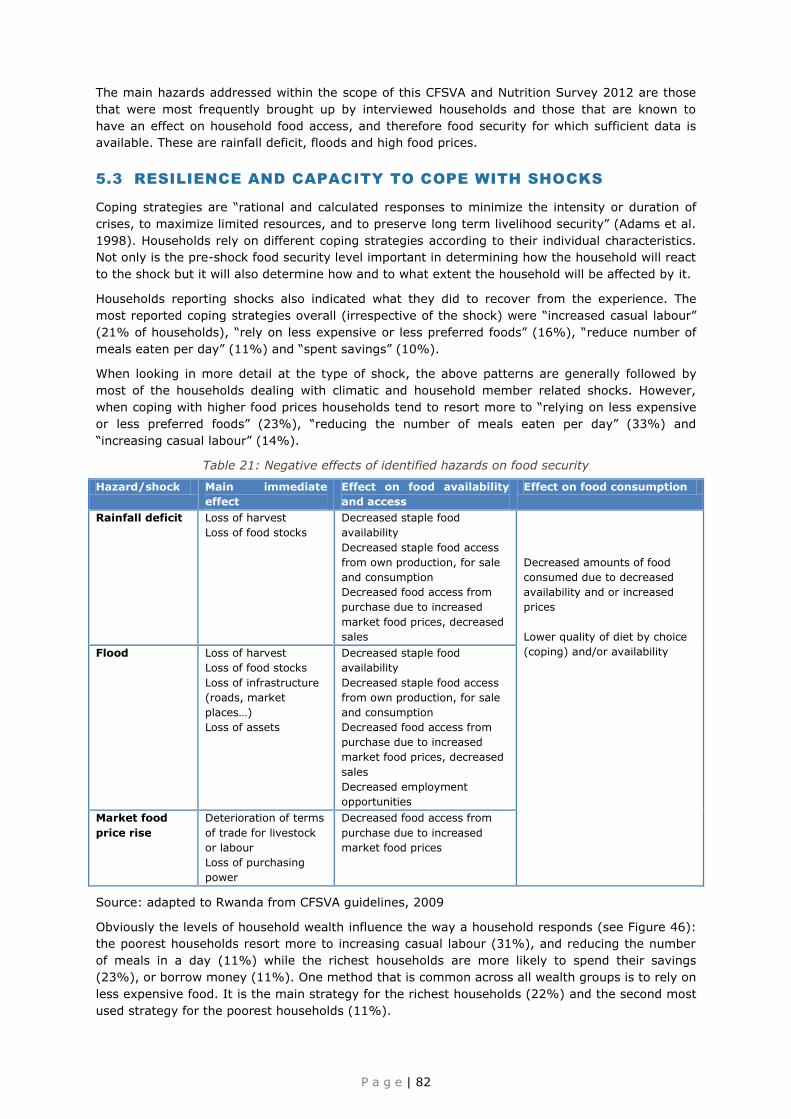
P a g e | 82
The main hazards addressed within the scope of this CFSVA and Nutrition Survey 2012 are those
that were most frequently brought up by interviewed households and those that are known to
have an effect on household food access, and therefore food security for which sufficient data is
available. These are rainfall deficit, floods and high food prices.
5.3 RESILIENCE AND CAPACITY TO COPE WITH SHOCKS
Coping strategies are “rational and calculated responses to minimize the intensity or duration of
crises, to maximize limited resources, and to preserve long term livelihood security” (Adams et al.
1998). Households rely on different coping strategies according to their individual characteristics.
Not only is the pre-shock food security level important in determining how the household will react
to the shock but it will also determine how and to what extent the household will be affected by it.
Households reporting shocks also indicated what they did to recover from the experience. The
most reported coping strategies overall (irrespective of the shock) were “increased casual labour”
(21% of households), “rely on less expensive or less preferred foods” (16%), “reduce number of
meals eaten per day” (11%) and “spent savings” (10%).
When looking in more detail at the type of shock, the above patterns are generally followed by
most of the households dealing with climatic and household member related shocks. However,
when coping with higher food prices households tend to resort more to “relying on less expensive
or less preferred foods” (23%), “reducing the number of meals eaten per day” (33%) and
“increasing casual labour” (14%).
Table 21: Negative effects of identified hazards on food security
Hazard/shock Main immediate
effect
Effect on food availability
and access
Effect on food consumption
Rainfall deficit Loss of harvest
Loss of food stocks
Decreased staple food
availability
Decreased staple food access
from own production, for sale
and consumption
Decreased food access from
purchase due to increased
market food prices, decreased
sales
Decreased amounts of food
consumed due to decreased
availability and or increased
prices
Lower quality of diet by choice
(coping) and/or availability Flood Loss of harvest
Loss of food stocks
Loss of infrastructure
(roads, market
places…)
Loss of assets
Decreased staple food
availability
Decreased staple food access
from own production, for sale
and consumption
Decreased food access from
purchase due to increased
market food prices, decreased
sales
Decreased employment
opportunities
Market food
price rise
Deterioration of terms
of trade for livestock
or labour
Loss of purchasing
power
Decreased food access from
purchase due to increased
market food prices
Source: adapted to Rwanda from CFSVA guidelines, 2009
Obviously the levels of household wealth influence the way a household responds (see Figure 46):
the poorest households resort more to increasing casual labour (31%), and reducing the number
of meals in a day (11%) while the richest households are more likely to spend their savings
(23%), or borrow money (11%). One method that is common across all wealth groups is to rely on
less expensive food. It is the main strategy for the richest households (22%) and the second most
used strategy for the poorest households (11%).

P a g e | 83
Over 40% of households relying on casual labour126 resort to increasing casual labour to cope with
a shock, while, unsurprisingly, only 4% of employees and business men do this. Households
involved in marginal livelihoods rely most on friends, relatives and eating fewer meals per day.127
Figure 46: Percentage of households adopting ‘increased casual labour’ and ‘spend savings’ as
coping strategy, by wealth quintile
Source: CFSVA and Nutrition Survey, 2012
The analysis of the ‘reduced coping strategy index’ again shows that the poorer the household the
more likely it is to adopt more severe coping mechanisms (higher CSI), and whereas all
households sometimes rely on less preferred and less expensive foods, only poor households
reduce the number of meals eaten in a day, limit portion size at mealtimes or restrict consumption
by adults so that small children can eat (see Figure 47).
Figure 47: Number of days in the week during which coping strategies are used by households in
each wealth quintile
Source: CFSVA and Nutrition Survey, 2012
The CSI of households with stunted children is significantly higher than that of households with
children under five who are not stunted (see Figure 48). Similarly, the CSI of households with
unacceptable food consumption is significantly higher than that of households with acceptable food
consumption (see Figure 49).
126 44% for “agricultural workers” and 42% for “agriculture and daily labour.” 127 When confronted with a shock, 11% have household members eat at relatives' or neighbours', 13% borrow food or rely on help from friends or relatives and 16% reduce the number of meals eaten in a day.

P a g e | 84
Figure 48: Average CSI and use of coping strategies in households with and without stunted
children (only considering households with children under 5 (CU5))
Source: CFSVA and Nutrition Survey, 2012
Figure 49: Average CSI and use of coping strategies in households by food consumption group
Source: CFSVA and Nutrition Survey, 2012
Figure 50: Share of households not having recovered from shock by wealth quintile
Source: CFSVA and Nutrition Survey, 2012
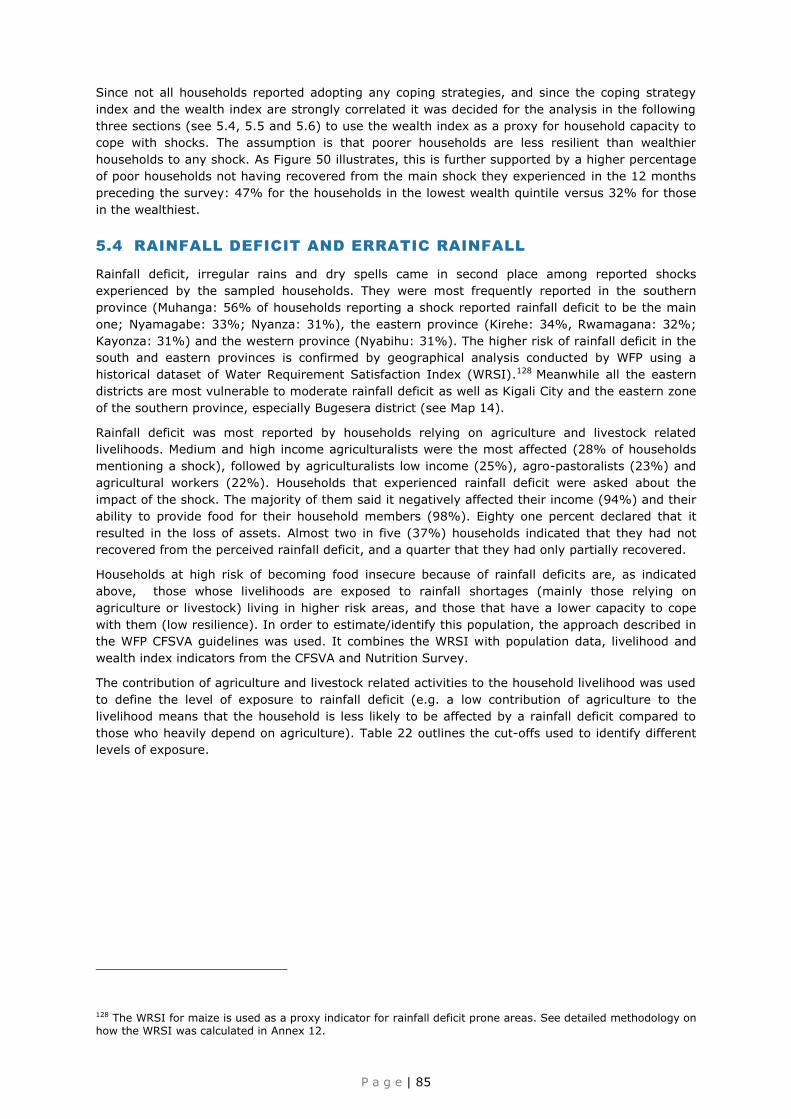
P a g e | 85
Since not all households reported adopting any coping strategies, and since the coping strategy
index and the wealth index are strongly correlated it was decided for the analysis in the following
three sections (see 5.4, 5.5 and 5.6) to use the wealth index as a proxy for household capacity to
cope with shocks. The assumption is that poorer households are less resilient than wealthier
households to any shock. As Figure 50 illustrates, this is further supported by a higher percentage
of poor households not having recovered from the main shock they experienced in the 12 months
preceding the survey: 47% for the households in the lowest wealth quintile versus 32% for those
in the wealthiest.
5.4 RAINFALL DEFICIT AND ERRATIC RAINFALL
Rainfall deficit, irregular rains and dry spells came in second place among reported shocks
experienced by the sampled households. They were most frequently reported in the southern
province (Muhanga: 56% of households reporting a shock reported rainfall deficit to be the main
one; Nyamagabe: 33%; Nyanza: 31%), the eastern province (Kirehe: 34%, Rwamagana: 32%;
Kayonza: 31%) and the western province (Nyabihu: 31%). The higher risk of rainfall deficit in the
south and eastern provinces is confirmed by geographical analysis conducted by WFP using a
historical dataset of Water Requirement Satisfaction Index (WRSI).128 Meanwhile all the eastern
districts are most vulnerable to moderate rainfall deficit as well as Kigali City and the eastern zone
of the southern province, especially Bugesera district (see Map 14).
Rainfall deficit was most reported by households relying on agriculture and livestock related
livelihoods. Medium and high income agriculturalists were the most affected (28% of households
mentioning a shock), followed by agriculturalists low income (25%), agro-pastoralists (23%) and
agricultural workers (22%). Households that experienced rainfall deficit were asked about the
impact of the shock. The majority of them said it negatively affected their income (94%) and their
ability to provide food for their household members (98%). Eighty one percent declared that it
resulted in the loss of assets. Almost two in five (37%) households indicated that they had not
recovered from the perceived rainfall deficit, and a quarter that they had only partially recovered.
Households at high risk of becoming food insecure because of rainfall deficits are, as indicated
above, those whose livelihoods are exposed to rainfall shortages (mainly those relying on
agriculture or livestock) living in higher risk areas, and those that have a lower capacity to cope
with them (low resilience). In order to estimate/identify this population, the approach described in
the WFP CFSVA guidelines was used. It combines the WRSI with population data, livelihood and
wealth index indicators from the CFSVA and Nutrition Survey.
The contribution of agriculture and livestock related activities to the household livelihood was used
to define the level of exposure to rainfall deficit (e.g. a low contribution of agriculture to the
livelihood means that the household is less likely to be affected by a rainfall deficit compared to
those who heavily depend on agriculture). Table 22 outlines the cut-offs used to identify different
levels of exposure.
128 The WRSI for maize is used as a proxy indicator for rainfall deficit prone areas. See detailed methodology on how the WRSI was calculated in Annex 12.
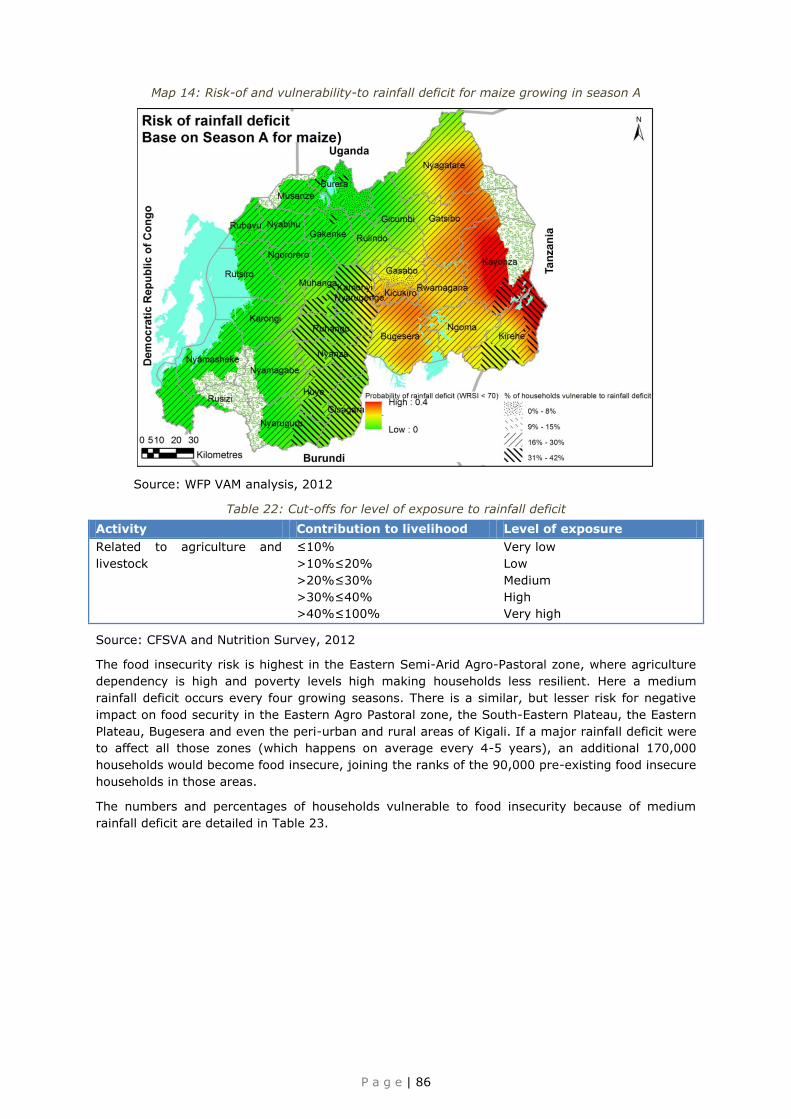
P a g e | 86
Map 14: Risk-of and vulnerability-to rainfall deficit for maize growing in season A
Source: WFP VAM analysis, 2012
Table 22: Cut-offs for level of exposure to rainfall deficit
Activity Contribution to livelihood Level of exposure
Related to agriculture and
livestock
≤10%
>10%≤20%
>20%≤30%
>30%≤40%
>40%≤100%
Very low
Low
Medium
High
Very high
Source: CFSVA and Nutrition Survey, 2012
The food insecurity risk is highest in the Eastern Semi-Arid Agro-Pastoral zone, where agriculture
dependency is high and poverty levels high making households less resilient. Here a medium
rainfall deficit occurs every four growing seasons. There is a similar, but lesser risk for negative
impact on food security in the Eastern Agro Pastoral zone, the South-Eastern Plateau, the Eastern
Plateau, Bugesera and even the peri-urban and rural areas of Kigali. If a major rainfall deficit were
to affect all those zones (which happens on average every 4-5 years), an additional 170,000
households would become food insecure, joining the ranks of the 90,000 pre-existing food insecure
households in those areas.
The numbers and percentages of households vulnerable to food insecurity because of medium
rainfall deficit are detailed in Table 23.

8
P a g e | 87
Table 23: Risk for food security from medium rainfall deficit in season A
Livelihood zone
Probability for
rainfall deficit (WRSI<70) seas. A
Food insecure households
(poor+borderline food consumption)
Food secure households
VULNERABLE to rainfall deficit (WRSI<70)
Total food insecure households in case of rainfall deficit (WRSI<70)
Kigali City 19%
Urban 4,675 3% 622 0% 5,297 4%
Peri-urban 422 2% 5,794 24% 6,216 26%
Rural 301 6% 1,141 21% 1,443 27%
Lake Kivu Coffee 0%
Urban 1,721 18% 219 3% 1,940 21%
Peri-urban 9,252 41% 2,227 10% 11,478 51%
Rural 74,453 41% 31,154 17% 105,606 58%
West Congo-Nile Crest Tea
0% Rural 49,936 42% 21,985 19% 71,921 61%
Northwest Volcanic Irish Potato
0%
Urban 6,723 15% 1,996 5% 8,718 20%
Peri-urban 1,307 14% 2,461 26% 3,767 40%
Rural 27,430 20% 33,283 25% 60,712 45%
East Congo-Nile Highland Subsistence Farming
2%
Urban 225 10% - 0% 225 10%
Peri-urban 5,878 24% 4,284 17% 10,163 41%
Rural 81,419 30% 81,593 30% 163,012 60%
Central Plateau Cassava and Coffee
7%
Urban 1,211 7% 1,350 8% 2,561 15%
Peri-urban 6,391 13% 14,442 29% 20,833 42%
Rural 60,879 20% 95,235 31% 156,115 51%
Northern Highland Beans and Wheat
0% Peri-urban 2,024 36% 1,194 20% 3,218 56%
Rural 13,628 22% 25,240 40% 38,868 61%
Central-Northern Highland Potato, Beans and Veg.
3% Urban 929 10% 929 10% 1,858 20%
Rural 26,217 18% 34,789 24% 61,006 42%
Bugesera Cassava 20%
Urban - 0% - 0% - 0%
Peri-urban 1,068 11% 2,279 24% 3,346 36%
Rural 19,727 23% 25,083 29% 44,810 51%
Eastern Plateau Mixed Agriculture
17% Peri-urban 6,129 50% 1,155 10% 7,284 60%
Rural 28,240 20% 41,698 29% 69,938 49%
Southeastern Plateau Banana
20%
Urban 567 6% - 0% 567 6%
Peri-urban 1,508 6% 6,700 27% 8,208 33%
Rural 18,419 11% 43,914 26% 62,333 37%
Eastern Agropastoral 23% Peri-urban - 0% 940 19% 940 19%
Rural 5,498 6% 24,848 29% 30,346 36%
Eastern Semi-Arid Agropastoral
24% Rural 3,860 10% 15,835 42% 19,695 53%
RWANDA
Urban 16,051 7% 5,116 2% 21,167 9%
Peri-urban 33,978 18% 41,475 22% 75,453 40%
Rural 410,007 23% 475,798 27% 885,805 51%
Total 460,037 21% 522,388 24% 982,425 45%
Source: CFSVA and Nutrition Survey, 2012
Pa
ge
| 87
Table 23: Risk for food security from
medium
rainfall deficit in season A
Liv
elih
ood z
one
Pro
bability
for
rain
fall d
efic
it (W
RSI<
70) s
eas. A
Food in
secure
household
s
(poor+
bord
erlin
e fo
od
consum
ptio
n)
Food s
ecure
household
s
VU
LN
ERABLE to
rain
fall d
efic
it (W
RSI<
70)
Tota
l food in
secure
household
s in
case o
f rain
fall d
efic
it (WRSI<
70)
Kig
ali C
ity
19%
Urb
an
4,6
75
3%
6
22
0%
5
,297
4%
Peri-u
rban
422
2%
5
,794
24%
6
,216
26%
Rura
l 3
01
6%
1
,141
21%
1
,443
27%
Lake K
ivu C
offe
e
0%
Urb
an
1,7
21
18%
2
19
3%
1
,940
21%
Peri-u
rban
9,2
52
41%
2
,227
10%
1
1,4
78
51%
Rura
l 7
4,4
53
41%
3
1,1
54
17%
1
05,6
06
58%
West C
ongo-N
ile C
rest
Tea
0%
Rura
l 4
9,9
36
42%
2
1,9
85
19%
7
1,9
21
61%
North
west V
olc
anic
Irish
Pota
to
0%
Urb
an
6,7
23
15%
1
,996
5%
8
,718
20%
Peri-u
rban
1,3
07
14%
2
,461
26%
3
,767
40%
Rura
l 2
7,4
30
20%
3
3,2
83
25%
6
0,7
12
45%
East C
ongo-N
ile H
ighla
nd
Subsis
tence F
arm
ing
2%
Urb
an
225
10%
-
0%
2
25
10%
Peri-u
rban
5,8
78
24%
4
,284
17%
1
0,1
63
41%
Rura
l 8
1,4
19
30%
8
1,5
93
30%
1
63,0
12
60%
Centra
l Pla
teau C
assava
and C
offe
e
7%
Urb
an
1,2
11
7%
1
,350
8%
2
,561
15%
Peri-u
rban
6,3
91
13%
1
4,4
42
29%
2
0,8
33
42%
Rura
l 6
0,8
79
20%
9
5,2
35
31%
1
56,1
15
51%
North
ern
Hig
hla
nd B
eans
and W
heat
0%
Peri-u
rban
2,0
24
36%
1
,194
20%
3
,218
56%
Rura
l 1
3,6
28
22%
2
5,2
40
40%
3
8,8
68
61%
Centra
l-North
ern
H
ighla
nd P
ota
to, B
eans
and V
eg.
3%
U
rban
929
10%
9
29
10%
1
,858
20%
Rura
l 2
6,2
17
18%
3
4,7
89
24%
6
1,0
06
42%
Bugesera
Cassava
20%
Urb
an
- 0%
-
0%
-
0%
Peri-u
rban
1,0
68
11%
2
,279
24%
3
,346
36%
Rura
l 1
9,7
27
23%
2
5,0
83
29%
4
4,8
10
51%
Easte
rn P
late
au M
ixed
Agric
ultu
re
17%
Peri-u
rban
6,1
29
50%
1
,155
10%
7
,284
60%
Rura
l 2
8,2
40
20%
4
1,6
98
29%
6
9,9
38
49%
South
easte
rn P
late
au
Banana
20%
Urb
an
567
6%
-
0%
5
67
6%
Peri-u
rban
1,5
08
6%
6
,700
27%
8
,208
33%
Rura
l 1
8,4
19
11%
4
3,9
14
26%
6
2,3
33
37%
Easte
rn A
gro
pasto
ral
23%
Peri-u
rban
- 0%
9
40
19%
9
40
19%
Rura
l 5
,498
6%
2
4,8
48
29%
3
0,3
46
36%
Easte
rn S
em
i-Arid
Agro
pasto
ral
24%
Rura
l 3
,860
10%
1
5,8
35
42%
1
9,6
95
53%
RW
AN
DA
U
rban
16,0
51
7%
5
,116
2%
2
1,1
67
9%
Peri-u
rban
33,9
78
18%
4
1,4
75
22%
7
5,4
53
40%
Rura
l 4
10,0
07
23%
4
75,7
98
27%
8
85,8
05
51%
T
ota
l 4
60
,03
7
21
%
52
2,3
88
2
4%
9
82
,42
5
45
%
Sourc
e: C
FSVA a
nd N
utritio
n S
urv
ey, 2
012
P a g e | 88
5.5 FLOODS
Deforestation and poor agricultural practices cause soil erosion, rock falls, landslides and floods,
which destroy crops, houses and other infrastructure (roads, bridges and schools) and often kill or
injure people and animals.
Flash floods and landslides are frequent during the rainy seasons in the steep areas of the north-
western part of the country, especially in Rubavu, Nyabihu and Musanze districts when the ground
is saturated and water either cannot run off, or cannot run off quickly enough to stop
accumulating.
Riverine floods are more frequent in the marshlands of the country - low lying areas along major
streams and lakes - and occur when run-off from sustained and heavy rainfall exceeds the capacity
of a river's channel. Although households having access to marshland have the opportunity to
cultivate during season C (dry season), their increased exposure to floods means important areas
of crops cultivated in those marshlands are destroyed. The CFSVA and Nutrition Survey 2012 data
confirms this distribution; whereas in the whole country 8% of households declared that they had
been affected by floods, the proportion was much higher in marshland districts (see Map 15) which
include Bugesera (50%), Musanze (24%), Ngororero (22%), Nyanza (16%), Nyaruguru (15%),
Huye (13%) and Gisagara (11%).
Map 15: Distribution of marshlands in Rwanda
Source: Data from CGIS-NUR
For the CFSVA and Nutrition Survey analysis, only riverine floods are taken into account.
Marshland areas were considered to be at risk of flooding. Households exposed to flooding were
again those whose livelihoods relied heavily on agriculture and livestock. And again the poorest
households (poorest two quintiles) were considered the least resilient to floods.
When considering factors described above, 19% of all households in Rwanda are vulnerable to
floods with 29% of them in the southern province, 26% in the western and only 2% in Kigali City.
Among them 29% of households already have borderline food consumption patterns, so they are
likely to fall into poor food consumption patterns should their livelihood be affected.
P a g e | 89
5.6 INCREASES IN STAPLE FOOD PRICES
Given the concern about a global food price crisis, the CFSVA and Nutrition Survey 2012 looks into
food price increases even though they were mentioned as a shock by just 2% of households
mentioning a shock. The percentage was much higher for households in urban areas (11%) and
for households that normally rely on the market as their food source. It was mostly reported in the
urban districts of of Kicukiro (6%), Nyarugenge (3%) and Gasabo (13%) where most households
are market reliant as well as in the following districts with infertile soils and a high percentage of
food insecure households: Rusizi (9%), Kamonyi (7%), Musanze (6%), Huye (5%), Nyabihu (5%),
Nyamasheke (3%), Nyamagabe (3%), Gisagara (3%), Gakenke (2%) and Karongi (2%).
To analyse how price increases impact on household vulnerability to food insecurity, increases in
bean prices are used since they are a staple food both produced and consumed by households
throughout Rwanda. According to the data collected during the CFSVA and Nutrition Survey 2012,
households in Rwanda spent on average almost one third (29%) of their monthly food
expenditures on beans. Households at risk of becoming food insecure because of increases in bean
prices are poor and reliant on markets for beans, and living in areas where price increases are
more likely (see Map 16).
As mentioned in the section on food prices, bean prices are on average highest in November, when
the districts of Gatisbo (eastern province), Rulindo and Gakenke (northern province) reported a
high percentage of households relying on markets.129
Households in the lowest two wealth quintiles that relied on the market as a main source of beans
constituted 27% of Rwandan households (21% of them in the eastern and 57% in the southern
and western provinces.) Of those 29% already had borderline food consumption (7% poor) in
March-April 2012, indicating that their food security could be severely impacted since their
resilience to shocks is low.
In the western province bean prices tend to be highest in April, at which time – using the same
criteria as described above – 19% of households can be considered to be vulnerable to price
increases. 41% of western households already had unacceptable food consumption in March-April
2012 (10% poor food consumption and 31% borderline) so their food security would be further
compromised by the price rise.
129 For the CFSVA and Nutrition Survey 2012 households had to report for each month of the year where they
sourced their beans (either own production, purchase or food aid).
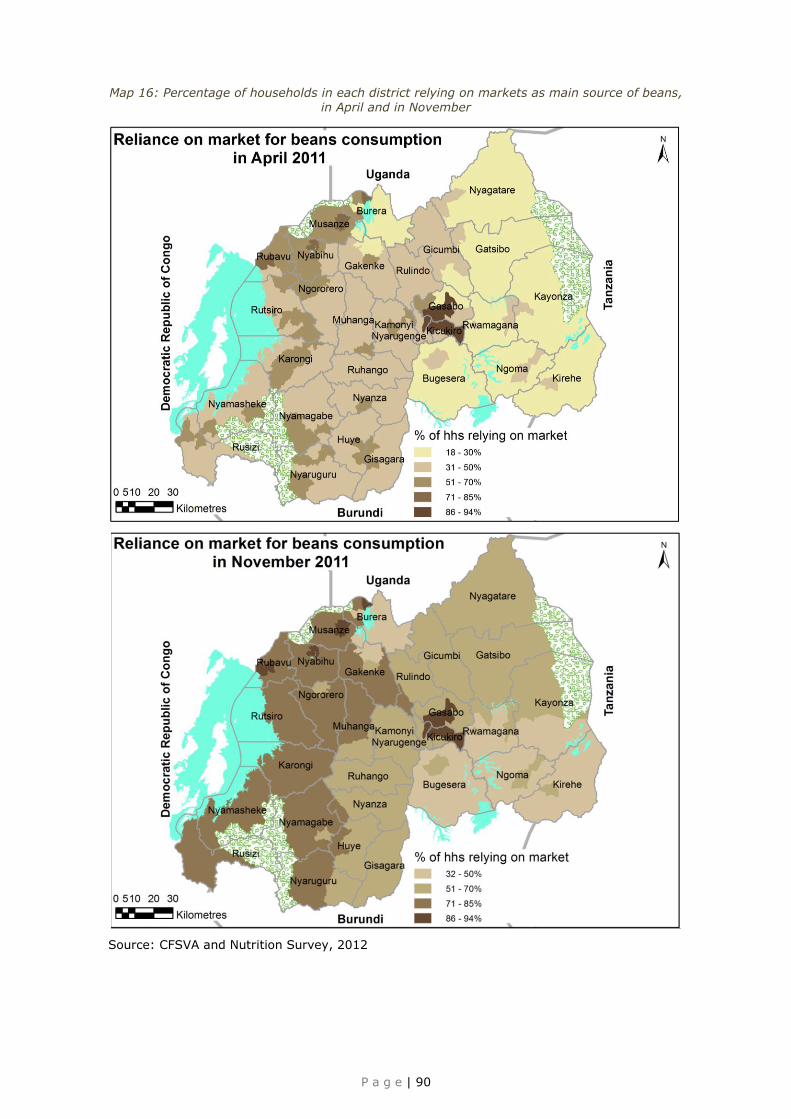
P a g e | 90
Map 16: Percentage of households in each district relying on markets as main source of beans,
in April and in November
Source: CFSVA and Nutrition Survey, 2012

P a g e | 91
Box 17: Summary - Shocks to food security
Nationally, 38% of households in Rwanda mentioned having experienced an unusual situation
during the last year that affected their ability to provide for themselves, eat in the manner they
were accustomed to, or what they owned. The most commonly reported shocks were related to
illness, accident, inability to work or even death of a household member (reported by 15% of all
households, or 39% of households that reported a shock) followed by rainfall deficits, irregular
rains or dry spells (8% of all households). All the other shocks were reported by fewer than 5% of
all households and included floods (2%) and unusually high prices of food (1% of all households).
The distribution of the reported shocks as well as the types of households reporting show that
households residing in the western province, rural households, poorer households, households
relying on low income agriculture and agro-pastoralists, as well as those headed by women and
disabled people, are experiencing more difficulties in their daily lives.
The coping strategy index and the wealth index are strongly correlated. The most reported coping
strategies overall (irrespective of the shock) were “increased casual labour” (21% of households),
“relying on less expensive or less preferred foods” (16%), “reducing the number of meals eaten
per day” (11%) and “spending savings” (10%).
If a major rainfall deficit were to affect the eastern province (which happens on average every 4-5
years), an additional 170,000 households would be at risk of becoming food insecure.
Furthermore almost one fifth (19%) of Rwandan households can be considered vulnerable to floods
and again one fifth to increases in bean prices.
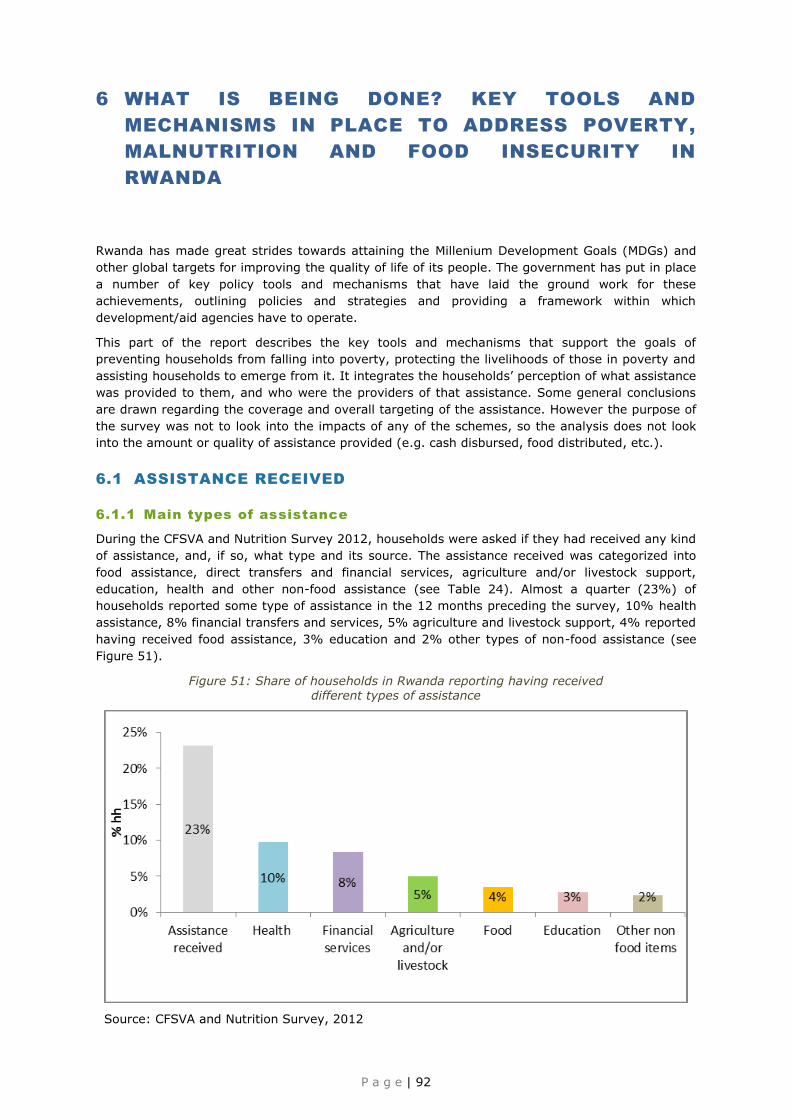
P a g e | 92
6 WHAT IS BEING DONE? KEY TOOLS AND
MECHANISMS IN PLACE TO ADDRESS POVERTY,
MALNUTRITION AND FOOD INSECURITY IN
RWANDA
Rwanda has made great strides towards attaining the Millenium Development Goals (MDGs) and
other global targets for improving the quality of life of its people. The government has put in place
a number of key policy tools and mechanisms that have laid the ground work for these
achievements, outlining policies and strategies and providing a framework within which
development/aid agencies have to operate.
This part of the report describes the key tools and mechanisms that support the goals of
preventing households from falling into poverty, protecting the livelihoods of those in poverty and
assisting households to emerge from it. It integrates the households’ perception of what assistance
was provided to them, and who were the providers of that assistance. Some general conclusions
are drawn regarding the coverage and overall targeting of the assistance. However the purpose of
the survey was not to look into the impacts of any of the schemes, so the analysis does not look
into the amount or quality of assistance provided (e.g. cash disbursed, food distributed, etc.).
6.1 ASSISTANCE RECEIVED
6.1.1 Main types of assistance
During the CFSVA and Nutrition Survey 2012, households were asked if they had received any kind
of assistance, and, if so, what type and its source. The assistance received was categorized into
food assistance, direct transfers and financial services, agriculture and/or livestock support,
education, health and other non-food assistance (see Table 24). Almost a quarter (23%) of
households reported some type of assistance in the 12 months preceding the survey, 10% health
assistance, 8% financial transfers and services, 5% agriculture and livestock support, 4% reported
having received food assistance, 3% education and 2% other types of non-food assistance (see
Figure 51).
Figure 51: Share of households in Rwanda reporting having received different types of assistance
Source: CFSVA and Nutrition Survey, 2012

P a g e | 93
Table 24: Types of assistance received and sources
Type of assistance Detailed assistance Possible sources of
assistance
Food aid Food for school children
Food for pregnant and breastfeeding women
Food for work
Food for training
One cup of milk per child
Free food distributions
Treatment of malnutrition (through supplementary or
therapeutic feeding)
Other food assistance programmes
Government
WFP
Other UN agencies
NGO
Mosques and churches
Community
Other
Don’t know
Financial transfers and
services
Social security/caisse sociale
VUP direct support
VUP public works
VUP access to financial services
Ubudehe credit scheme/loan (individual or group)
Access to credit/loans for agricultural/livestock related
activities
Access to credit/loans for non-agricultural/livestock
related activities
Direct transfers (other than VUP)
Agriculture and
livestock support
Agricultural input assistance (tools, seeds, fertilizer,
etc.)
Training and technical assistance in
agricultural/livestock practices
Provision of large livestock (eg. cow)
Provision of small livestock (eg. chicken, rabbits)
Fish ponds
Veterinary services
Education School materials etc
Health Medical services
Other non-food
assistance
Construction/building materials
Water and/or sanitation
Source: CFSVA and Nutrition Survey, 2012
6.1.2 Main sources of assistance
Government efforts to assist the neediest in Rwanda are supported by the international community
and complemented by activities of partner organisations, mainly donors, NGOs and the UN.
Figure 52 shows that the government of Rwanda is by far the largest provider of assistance (80%
of the responses, and usually over 75% for the different types of assistance), followed at a
distance by NGOs (with 9% of the responses) and the UN (4%, largely WFP). Religious institutions,
such as mosques and churches, also provide some assistance (3%). For most types of assistance
the relative importance of the providers are roughly in line with this, except for education (for
which NGOs are mentioned as the most important providers at 42%), and food aid (WFP 40%,
excluding the food given by friends and relatives).
Figure 52: Sources of assistance mentioned by households
Source: CFSVA and Nutrition Survey, 2012

P a g e | 94
Box 18: The importance of friends and relatives
The analysis presented in this chapter excludes the assistance provided by friends and relatives. If
included, friends and relatives come second to the government in providing assistance. This is
more marked in urban than in rural areas. In urban areas the main sources of assistance are
government (70%), followed by friends and relatives (13%), NGOs (9%) and religious institutions
(5%). In rural areas the sources are the same, only the percentages change with more weight
given to the government (80%), and less to friends and relatives (7%), NGOs (6%) and religious
institutions (2%).
The percentage of households receiving food aid almost doubles (from 4% to 7% nationally) if one
includes the support from relatives. Similarly the share of households receiving ‘free food’
quadruples from 1% to 4%. In urban areas, friends and relatives constitute the source of food
assistance in 70% of cases, compared with 46% in rural areas, reflecting at the same time the
importance of the social network in Rwanda and the absence of other sources of food assistance in
urban areas. For other types of assistance, the inclusion or exclusion of support from friends and
relatives does not change the assistance reported as drastically.
According to the EICV 3, income from transfer (family and friends) has also seen an important
increase over the past five years. According to the CFSVA and Nutrition Survey 2012 data, 6% of
households reported remittances in the last 12 months. Remittances were especially important for
the ‘other marginal livelihoods’ group where they contributed to 19% of the livelihoods. Among
households that received remittances from their relatives during the 12 months preceding the
survey, 35% of them received up to 10,000 RWF, 27% from 10,000 to 20,000 RWF, 16% from
20,000 to 50,000 and 22% more than 50,000 RWF. Households receiving more than 50,000 RWF
in the last 12 months were mostly households in higher wealth categories (78% were in the
highest wealth quintile).
6.1.3 Geographical coverage of assistance
Map 17 shows the percentage of households reporting some type of assistance, excluding support
from friends and relatives.
Coverage of all types of assistance combined is relatively equally distributed over the provinces
with the exception of Kigali province where only 13% of households were covered, compared with
23% nationally. The coverage is relatively higher in the northern province (27% of households
reported some assistance), and the lowest in the western province est (21%).
At district level, the highest levels of coverage were reported in Musanze, Gisagara and Kayonza
where over 40% of all households reported receiving some kind of assistance. In Musanze this is
due to higher reported support to agriculture and livestock rearing, in Kayonza higher levels of
food aid (school feeding, see later on) and in Gisagara higher levels of health support. Apart from
Kigali province, the lowest levels of assistance were reported in the districts of Rusizi (12%),
Nyabihu and Kamonyi (both 13%).
Kigali accounts for the least households receiving assistance (only 5%) reflecting its lower
population and the lower coverage mentioned above. In contrast, the eastern province hosts 28%
of all households reporting any assistance. Direct transfers and financial support, food assistance
as well as education and other non-food assistance were more reported in the eastern province.
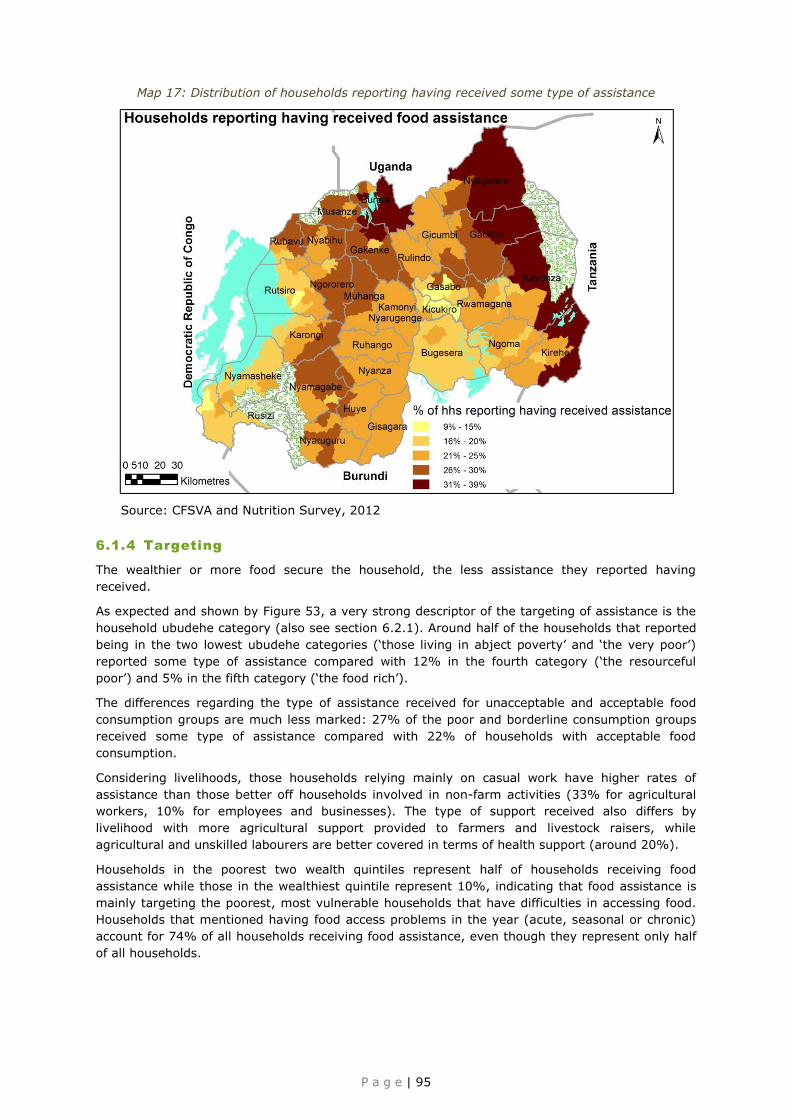
P a g e | 95
Map 17: Distribution of households reporting having received some type of assistance
Source: CFSVA and Nutrition Survey, 2012
6.1.4 Targeting
The wealthier or more food secure the household, the less assistance they reported having
received.
As expected and shown by Figure 53, a very strong descriptor of the targeting of assistance is the
household ubudehe category (also see section 6.2.1). Around half of the households that reported
being in the two lowest ubudehe categories (‘those living in abject poverty’ and ‘the very poor’)
reported some type of assistance compared with 12% in the fourth category (‘the resourceful
poor’) and 5% in the fifth category (‘the food rich’).
The differences regarding the type of assistance received for unacceptable and acceptable food
consumption groups are much less marked: 27% of the poor and borderline consumption groups
received some type of assistance compared with 22% of households with acceptable food
consumption.
Considering livelihoods, those households relying mainly on casual work have higher rates of
assistance than those better off households involved in non-farm activities (33% for agricultural
workers, 10% for employees and businesses). The type of support received also differs by
livelihood with more agricultural support provided to farmers and livestock raisers, while
agricultural and unskilled labourers are better covered in terms of health support (around 20%).
Households in the poorest two wealth quintiles represent half of households receiving food
assistance while those in the wealthiest quintile represent 10%, indicating that food assistance is
mainly targeting the poorest, most vulnerable households that have difficulties in accessing food.
Households that mentioned having food access problems in the year (acute, seasonal or chronic)
account for 74% of all households receiving food assistance, even though they represent only half
of all households.
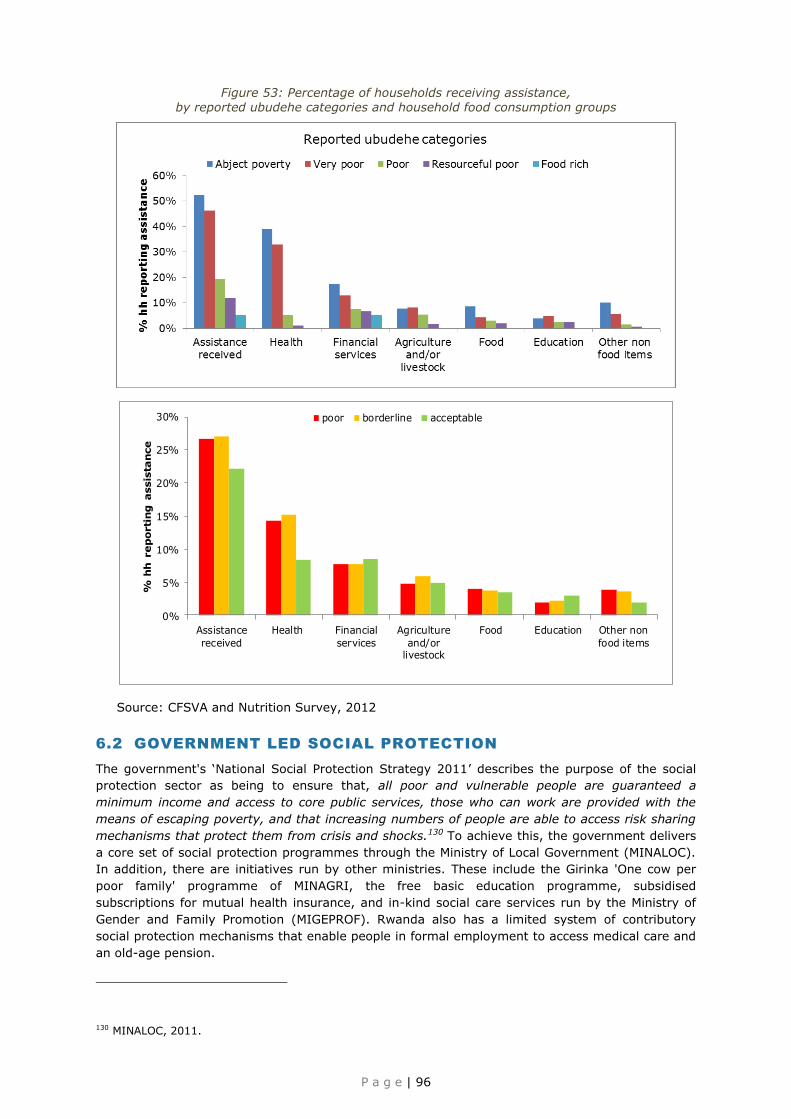
P a g e | 96
Figure 53: Percentage of households receiving assistance,
by reported ubudehe categories and household food consumption groups
0%
5%
10%
15%
20%
25%
30%
Assistance
received
Health Financial
services
Agriculture
and/orlivestock
Food Education Other non
food items
% h
h reporti
ng assis
tance
poor borderline acceptable
Source: CFSVA and Nutrition Survey, 2012
6.2 GOVERNMENT LED SOCIAL PROTECTION
The government's ‘National Social Protection Strategy 2011’ describes the purpose of the social
protection sector as being to ensure that, all poor and vulnerable people are guaranteed a
minimum income and access to core public services, those who can work are provided with the
means of escaping poverty, and that increasing numbers of people are able to access risk sharing
mechanisms that protect them from crisis and shocks.130 To achieve this, the government delivers
a core set of social protection programmes through the Ministry of Local Government (MINALOC).
In addition, there are initiatives run by other ministries. These include the Girinka 'One cow per
poor family' programme of MINAGRI, the free basic education programme, subsidised
subscriptions for mutual health insurance, and in-kind social care services run by the Ministry of
Gender and Family Promotion (MIGEPROF). Rwanda also has a limited system of contributory
social protection mechanisms that enable people in formal employment to access medical care and
an old-age pension.
130 MINALOC, 2011.

P a g e | 97
6.2.1 Ubudehe programme to help the vulnerable and very poor
households
In 2001 the Ministries of Local Government and Finance launched the Ubudehe programme to help
the vulnerable and very poor households. It was rolled out country-wide in 2006. The programme
finances interventions targeting either entire communities (umudugudu projects) or an individual
household. Support is provided for agriculture, livestock, construction of markets, electrification,
schools and water supply. Households are categorized by their communities into six ubudehe
categories based on household level poverty.
Households were asked to report their ubudehe status and almost 76% of interviewed households
could provide it (see section 4.2.1 p. 46). The community-based household ubudehe categories
are supposed to be strongly linked to lack of land, poor soils, rainfall deficit/weather and lack of
livestock (see Figure 54). The analysis of the reported ubudehe categories against those criteria
shows that they are reflected in the categories. Judging by the reported ubudehe categories the
system of identifying the poor and food insecure households seems to be effective and confirms
the 2010 analysis of the World Bank according to which “the ‘ubudehe’ poor households have
significantly lower per capita consumption than the ‘ubudehe’ non-poor households.”
Figure 54: Household livestock ownership and expenditures, by self-reported ubudehe category
Source: CFSVA and Nutrition Survey, 2012
However, as shown by Figure 55, it is very likely that the system can still be improved by
correcting both inclusion and exclusion errors; some poor or food insecure households appeared to
be classified as rich, while some richer households are classified as poor. As mentioned above, this
needs to be confirmed with the analysis of the revised 2012 ubudehe household categories.
Figure 55: Household food consumption group and wealth quintile,
by self-reported ubudehe category
Source: CFSVA and Nutrition Survey, 2012

P a g e | 98
6.2.2 Vision 2020 Umurenge Programme (VUP)
The main social protection programme run by MINALOC, and a flagship of the Economic
Development and Poverty Reduction Strategy (EDPRS) 2008–2012, is the Vision 2020 Umurenge
Programme (VUP). Its objective is to reduce extreme poverty in targeted Imirenge (sectors) of
Rwanda. It has three pillars: a programme of public works for very poor households that are able
to work ('VUP public works');131 a cash transfer for very poor households with no labour capacity
('VUP direct support');132 and a programme of financial services ('VUP financial services'),133 of
which the main instrument so far has been the microcredit scheme, the Ubudehe Credit Scheme,
that provides small loans at low interest rates to individuals or groups.
The targeting of the VUP programme takes place at two levels: sector and household. All 30
districts across Rwanda are targeted. Within each district, sectors are ranked by local authorities
through a participatory approach considering food security, water access, distance to education,
distance to health centre, level of village settlement (Umudugu-zation). The sector that is
perceived as the poorest is targeted first, followed by the second poorest, and so on until the
entire district is covered. At the time of writing this report, four sectors had been prioritized in
each district. Looking at the distribution of the poorest wealth quintiles within the VUP level sectors
it does not appear that the highest priority districts are those with a higher percentage of poor
households, or that households with poorer food consumption patterns are more represented in
the priority VUP sectors when compared with the others. This probably reflects the fact that, so
far, the prioritization of the districts has been done within provinces and therefore it is very
relative, with poorer districts selected as high priority in the eastern province still wealthier than
lower priority districts in the southern or western provinces. Since July 2012 however, the system
has been scaled up and corrected. The EICV 3 ranking of the districts was used to prioritize the
poorest districts and the ubudehe classification was used to identify the priority sectors. In the
poorest districts 4 or even 5 additional sectors were prioritised while in the richer districts no new
sectors were prioritised for the scale up.
At household level, according to VUP guidance, direct services should only be provided to
households from ubudehe categories 1 and 2 with no working-able member; public works are
intended for households from categories 1 and 2 with at least one working-able member; and all
ubudehe categories can access financial services. The guidelines seem to be roughly followed in
the implementation: according to household level reports of assistance, the coverage of VUP direct
support and public works is highest for the households from lowest ubudehe classes while financial
services, loans and caisse sociale are also accessible to ‘the resourceful poor and above categories’
(ubudehe category 5, see Figure 56).
The types of financial assistance reported by most households are VUP public works (3%) followed
by the ubudehe credit scheme (2%) and VUP access to financial services (2%). These schemes are
more present in VUP priority sectors, but households living in the highest priority VUP sectors do
not necessarily have better access to VUP services than those in lower priority districts (see Figure
57).
131 Public Works (PW) was launched in May 2008 and offers temporary work on community infrastructure projects (mainly terracing, anti-erosion ditches, and road rehabilitation) at a locally determined wage rate, to one member of extremely poor households that have adult labour capacity. 132 Direct Support (DS) was launched second in January 2009 and provides regular unconditional cash transfers, calibrated by household size, to all extremely poor households in targeted Imirenge that have no adult member who is able to work. 133 Financial Services launched most recently in January 2010 has three sub-components: access to credit, beneficiary training (e.g. financial literacy), and a challenge fund (matching grant facility whereby local people raise a portion of the capital costs and VUP matches this with grant funds). Cutting across all these sub-components is linking beneficiaries to the financial system and providing them with access to savings facilities. Bank accounts were opened for all participants when the VUP was launched. Loans can be taken out by individuals, groups, or cooperatives for any livelihood activity that is approved by the local loan committee. Loans must be repaid within one year, and an interest rate of 2% is levied – well below commercial interest rates for credit.

P a g e | 99
Figure 56: Households reporting VUP assistance, by self-reported ubudehe category
Source: CFSVA and Nutrition Survey, 2012
Figure 57: Percentage of households reporting financial assistance, by type of VUP sector
Source: CFSVA and Nutrition Survey, 2012
Even though VUP is the main component of the social protection strategy in Rwanda, MINALOC
also runs two other social assistance schemes - the Genocide Survivors Support and Assistance
Fund (FARG), and the Rwanda Demobilisation and Reintegration Commission (RDRC) that provide
beneficiaries with cash transfers and support in accessing education and health services. In
addition, MIGEPROF and the global fund support orphans and vulnerable children. These
programmes are included in the assistance schemes described above, but not detailed, because
the CFSVA and Nutrition Survey 2012 only attempted to specifically identify the VUP schemes.
6.3 LIVELIHOODS, AGRICULTURE AND LIVESTOCK SUPPORT
Overall the most commonly mentioned support in agriculture and livestock is the provision of
agricultural inputs as well as livestock. These are mostly provided by the government (mentioned
by 78% of the households reporting livestock and agriculture assistance in Rwanda), and appear to
be largely concentrated in the northern province, which accounts for 40% of all households
mentioning some agricultural or livestock support. This reflects the high number of agricultural
support projects in those areas, especially in Musanze, a district that hosts over one fifth of all
households receiving any agricultural support and where 23% of households report having
received agricultural inputs. NGOs are the second source of agriculture and livestock services after
the government.

P a g e | 100
The Government has adopted a policy of land consolidation and regionalization of crops in a bid to
move away from the small, semi-subsistence, and increasingly fragmented farms that characterize
agriculture in Rwanda. The strategy is to combine plots from different households and all cultivate
the same crop (usually maize but also other crops such as wheat or sorghum) with the rationale of
saving costs and increasing yields. The strategy of MINAGRI is to continue to raise rural incomes
and thereby reduce poverty, through crop intensification, ranging from irrigation to animal
husbandry. So far, according to the CFSVA and Nutrition Survey 2012, this government policy has
affected a quarter (24%) of farming households with on average 60% of cultivated land
consolidated. The share of land consolidated increases for those farming smaller plots: some 80%
of land is consolidated for those cultivating less than 0.1 ha.
In the past years, the government has been emphasizing access to other mostly non-farm
employment. Still, agriculture remains the backbone of the Rwandan economy. MINAGRI promotes
livestock rearing through development programmes such as disease control, artificial insemination,
hatchery development, One Cow Per Poor Family, fish farming and small-ruminants
development.134 This is believed to have resulted in significant increases in the animal populations
across Rwanda.
The One Cow programme was set up in 2006 with the aim of improving nutrition and soil
productivity. A project focusing on small livestock health, productivity and expansion complements
the programme. According to Figure 58, overall 2% of households reported having received a large
animal in the 12 months preceding the surveys and 1% a small animal.135 The provision of large
livestock was reported in Gicumbi (7% of households), Kirehe (5%) and Bugesera (4%) districts.
Small livestock provision was chiefly reported in Nyamagabe district (6% of households) followed
by Nyamasheke, Musanze, Gatsibo and Kirehe (3% of households) districts. The survey data
indicate that very few households reported any training/technical assistance, fish ponds or
veterinary services.
Figure 58: Household agricultural and livestock assistance, by province
Source: CFSVA and Nutrition Survey, 2012
The targeting of the agricultural assistance seems to follow the reported ubudehe categories with a
slightly higher percentage of households in the lower ubudehe classes reporting agricultural
assistance (both inputs and livestock). However when looking at the wealth quintiles and the levels
of household food consumption, there is no indication that agricultural assistance is reaching the
poorest or most food insecure as a priority.
134 Ministry of Agriculture & Animal Resources Annual Report FY 2010/2011. 135 Figures reported by the EICV 3 2010/2011 are much higher but it is unclear as to what period they refer: 4% of rural households received a cow under the One Cow Programme, mainly in the eastern province, while 10% of rural households received an animal from an NGO or social protection scheme.

P a g e | 101
6.4 EDUCATION SUPPORT
The Ministry of Education (MINEDUC) proudly reports on the great progress that has been made in
Rwanda in extending education to all over the past five years. During this time the poor in
particular seem to have benefited greatly from improved access to education.136 The current policy
is free universal education to the end of the ninth year (primary and lower secondary education),
with plans to raise this to 12 years of education (higher secondary). Net enrolment in primary
schools, although not up to the 100% target for 2010 are very high in Rwanda compared with
neighbouring countries with an overall net enrolment rate of 95%137 in 2010. Teachers are now
teaching in English as well as French and of course in Kinyarwanda. Primary school completion has
now reached 79% (82% for girls) – but that still leaves 20% of children not yet completing
primary school, so literacy and vocational training are top priorities.138
With a net enrolment rate of 23% (see Table 25), access to secondary education still lags behind
primary and does not reach the 40% target the government had set itself for 2010. Secondary
school is still paid for by families, for some of which the fees can be very hefty, and this is
contributing to inequality. Access to secondary school among children in the highest quintile is four
times higher than access among children in the lowest quintile (though inequality has fallen from a
rate of 10 times higher in 2006). While enrolment rates for boys and girls are similar for secondary
school, attendance rates are disparate: for every two boys attending secondary school, there is
only one girl.139
Table 25: Enrolment rates
Boys (%) Girls (%) Total (%) Net enrolment rate primary education 94 97 95
Net enrolment rate secondary education 22 24 23
Source: MINEDUC, 2011
The generalized subsidized support such as free basic education for all was not reported by
households, which explains the low percentage of reported education assistance (only 3%).
6.5 MULTISECTORAL STRATEGY TO ELIMINATE MALNUTRITION
Fighting chronic malnutrition is high on the government’s agenda with MINISANTE coordinating the
efforts to develop and implement policies and strategies addressing the causes of malnutrition in
Rwanda. In April 2009, the Rwandan Government launched the National Emergency Plan to
eliminate malnutrition, which was anchored in the National Nutrition Policy of 2007. This led to the
National Multi-sectoral Strategy to Eliminate Malnutrition 2010-2013. The primary objective of the
current strategy is to reduce all forms of malnutrition by 30% by 2013. This also led to efforts by
MINAGRI to draft an action plan to contribute to the implementation of the National Multi-sectoral
Strategy to Eliminate Malnutrition in Rwanda. There are many interventions targeting malnutrition
across the country, coordinated by MINISANTE and implemented by different partners. These
include health worker training, kitchen gardening, cooking and nutrition demonstrations,
community based nutrition programme (CBNP), etc. These interventions are mainly designed to
combat acute malnutrition while fewer interventions are in place to prevent chronic malnutrition.
6.6 HEALTH
According to the household reporting in the CFSVA and Nutrition Survey 2012, most health
support is concentrated in the southern province (33% of households receive health support) and
in particular in Gisagara district (11%). According to the EICV 3, the trend of mutuelle de santé
coverage is quite positive with 78% of households having health insurance (compared to 68% in
136 MINEDUC Report, 2010/11. 137 MINEDUC Report, 2010/11. 138 MINEDUC Report, 2010/11. 139 EICV 3.

P a g e | 102
2007). At individual level, however, gender disparities in coverage occur with 67% of women
compared to 71% of men being insured.140
6.7 FOOD ASSISTANCE
Four percent of Rwandan households received some sort of food assistance in the 12 months prior
to the survey. As mentioned earlier this percentage rises to 7% when including support from
friends and relatives. The bulk of the food assistance consists of food for school children (from
WFP) in Huye, Kayonza, Nyamagabe and Kirehe. 141 Other types of food assistance include
therapeutic and supplementary feeding (1% of households in the eastern and western provinces),
one cup of milk per child (1% of households in the West) and free food distributions in the eastern
(2% of households), northern and southern provinces (1%).
More than 70% of the households receiving food aid are in the eastern and southern provinces.
Huye, Kayonza and Kirehe districts alone account for 40% of these, reflecting the presence there
of WFP school feeding activities.
In terms of targeting, the data only suggests a slightly higher coverage of the poorest ubudehe
categories and the lowest wealth quintiles but does not indicate that food insecure households are
the focus of the food assistance. This is probably because of the strong geographical concentration
of food aid (and in particular school feeding) in areas that are no longer the most food insecure or
the poorest in Rwanda.142
Box 19: Summary - What is being done in Rwanda to address food insecurity and malnutrition?
In Rwanda a number of initiatives are already in place to address food insecurity and malnutrition.
These include the MINALOC led Ubudehe programme to help the vulnerable and very poor
households and Vision 2020 Umurenge Programme (VUP). The MINAGRI has programmes in place
to support livelihoods, agriculture and livestock. Education is high on the government agenda as is
malnutrition; the Ministries of Health and Agriculture are implementing the Rwandan Multi-sectoral
strategy to eliminate malnutrition in Rwanda.
Almost one in four (23%) households reported having received some type of assistance in the 12
months preceding the survey: 10% reported health assistance, 8% financial transfers and
services, 5% agriculture and livestock support, 4% food assistance, 3% education and 2% other
types of non-food assistance. The government of Rwanda is by far the largest provider of
assistance (80% of the responses, and usually over 75% for the different types of assistance),
followed at a distance by NGOs (with 9% of the responses) and the UN (4%, largely WFP).
Coverage of all types of assistance combined is relatively equally distributed over the provinces
with the exception of Kigali province where only 13% of households were covered, versus 23%
nationally. The coverage is relatively higher in the northern province (where 27% of households
reported some assistance), and the lowest in the western province (21%).
As expected, a very strong descriptor of the targeting of assistance is the household ubudehe
category. The wealthier or more food secure the household, the less assistance it reported having
received. Even though the analysis of the reported ubudehe categories shows that they are
strongly linked to poverty, food insecurity, malnutrition, lack of land, poor soils, rainfall
deficit/weather and lack of livestock, the system can still be improved by the correcting of both
inclusion and exclusion errors. The highest VUP priority districts are not necessarily those with a
higher percentage of poor households, or of households with poorer food consumption patterns
and food assistance is poorly targeted.
140 MINISANTE annual report 2010/11. 141 Unsurprisingly school feeding was most mentioned in the districts where WFP is most present and most successful in involving communities with its school feeding programme. 142 The coverage of the school feeding was set up just after a major drought that struck the East and South of Rwanda.
P a g e | 103
7 THE WAY FORWARD TO TACKLE FOOD
INSECURITY AND MALNUTRITION
This report has shown that food insecurity and malnutrition in Rwanda has many causes which can
only be addressed through a multi-sector approach. Food insecurity and malnutrition are linked
with household poverty and livelihoods, agriculture and lack of education. Efforts in all these
sectors, within a policy environment that puts food security and malnutrition at the centre stage
will be necessary to continue reducing the alarming levels of chronic malnutrition among Rwandan
children and providing food security for all.
It is not sufficient to focus only on poverty reduction. Food insecurity and malnutrition need to be
explicitly addressed.
7.1 CONCLUSION
Food production is increasing in Rwanda, markets are functioning relatively well and food is flowing
easily within and outside the country thanks to the well-connected road network and market
infrastructure.
Still, more than half (51%) of all households reported some type of difficulty in accessing food in
the year preceding the survey: one fifth of all households reported seasonal food access problems,
and in March/April 2012, over one in five households (21%) had unacceptable food consumption
and could be considered food insecure. They either had poor food consumption (representing 4%
of all households) or borderline food consumption (17%). This shows clear improvement since the
2006 CFSVA and seems to indicate a slight, although not confirmed, improvement in household
food consumption since the last CFSVA and Nutrition survey was conducted in February-March
2009.
Percentages of households with unacceptable food consumption are especially high in the rural
areas bordering Lake Kivu (above 40%) and along the Congo Nile Crest, where soils are less fertile
and the land more susceptible to erosion. The western province accounts for the largest numbers
and highest rates of food insecure households (37%). Kigali has by far the highest proportion of
households with acceptable food consumption (93%) followed by the eastern province (86%),
which is relatively better off than other provinces but most prone to rainfall deficit. If a major
rainfall deficit were to affect the eastern province (which happens every 4-5 years) an additional
170,000 households would become food insecure.
Food insecure households are typically poor, rural households, living in small crowded homes,
depending on low income agriculture and casual labour. They rely on a small number of livelihood
activities; they often have no kitchen garden and their household food stocks are not sufficient to
last through the lean season until the next harvest. The farther households are located from a
main road or market, the more likely they are to be food insecure. Food insecure households are
more likely to be headed by a lowly educated, elderly person. Food insecure households involved
in agriculture and land cultivation are likely to farm small plots of land (less than 0.5 ha).
Conversely, households relying on more diversified activities, and especially urban households not
involved in agricultural production, are better off in terms of food security. The more crops a
household cultivates and the more livestock it owns the more likely it is to be food secure.
Acute malnutrition among children between six months and five years is the only nutrition
indicator within ’acceptable’ limits (3.6%). The prevalence of underweight, which reflects both
chronic and acute malnutrition, is ‘poor’ at 12%. The prevalence of chronic malnutrition (stunting)
among children between six months and five years has remained ‘very high’ over the last 20 years
and still stands at 43%. The northern livelihood zones have the highest rates of stunting,
exceeding 60% in rural areas, followed by rural areas bordering Lake Kivu (51% stunting), and
along the Congo Nile Crest (50%). At provincial level, the northern and western provinces have
the highest rates of stunting with over half of all children between six months and five years of age
stunted. Stunting is lowest in Kigali (24%).

P a g e | 104
Boys are more stunted than girls. The smaller the baby at birth, the more likely it is to be stunted
later on, and stunting increases with age. Stunted children are more likely to live in poor, crowded,
rural households that are farther away from services (hospital), often on steeply sloping land. They
have young, lowly educated mothers who are themselves stunted. Child feeding practices of
children between 12 and 23 months - in particular the types of foods consumed by children - are
significant predictors of their stunting. In particular, children between one and two years old who
had consumed milk products were significantly less stunted than other children of the same age
category.

P a g e | 105
7.2 RECOMMENDATIONS
Recommendations are given here on the refining of safety net and social protection targeting,
improving household living conditions, livelihoods, increasing and diversifying agricultural
production at household level and enhancing community resilience to food and nutrition insecurity.
Lastly, recommendations are provided on food security monitoring to keep track of progress and
inform decision makers about potential threats.
Since the scope of the CFSVA and Nutrition Survey 2012 was not to analyse the health component
in relation to food insecurity and malnutrition, no recommendations regarding health are given
here. Nevertheless health interventions are essential to ensure adequate food security and
nutrition.
7.2.1 Improve coverage and targeting of assistance and social
protection safety nets
Main finding Suggested intervention Primary target groups
Food insecure and malnourished
households are relatively well
captured by the ubudehe
classification system: 70% of
households with unacceptable food
consumption and 58% of households
with malnourished children are in the
lowest three ubudehe categories.
The current ubudehe system can be built
on and serve as a targeting tool for
expanded social safety nets.
Refine the targeting criteria allowing for
more inclusion of the most vulnerable,
poor food consumption and nutritionally
insecure households in the ubudehe
classes.
Country.
Reported assistance is reaching 27%
of households with unacceptable food
consumption and 25% of households
with chronically malnourished
children under five.
Expand social safety nets to reduce
exclusion of malnourished and food
insecure households and continue to
increase key social protection instruments’
coverage of the extreme poor and
vulnerable by taking geographical
distribution of food insecurity and
malnutrition into account in scale up plans.
Poor, food insecure and
malnourished
households.
20% of all households reported
seasonal problems in accessing food
in the 12 months preceding the
survey.
Scale up and implement seasonal
interventions (e.g. seasonal safety nets, off
farm employment opportunities) to help
those households experiencing seasonal
food insecurity and ensure that transfer
programmes take seasonal peaks of food
insecurity into account.
Seasonal food insecure
households.
Rates of stunting are highest in the
North.
65% of the rural households with
unacceptable food consumption and
over half (53%) of the rural
households with stunted children are
in the western and southern
provinces.
The three livelihood zones along the
Congo Nile Crest host half of the rural
households with unacceptable food
consumption (poor and borderline)
and about one third of the rural
households with stunted children.
Geographical targeting of the next
selection of VUP sectors should focus on
those districts that have the highest
numbers of food insecure and
malnourished people.
Create synergies with complementary
programmes that promote nutrition and
food security.
Encourage retargeting of food assistance
programmes to districts with high levels of
food insecurity and malnutrition.
Zones along the Congo-
Nile Crest and bordering
Lake Kivu for both food
security and stunting, as
well as North for
stunting.

P a g e | 106
7.2.2 Improve household living conditions, livelihood strategies and
tackle poverty
Main finding Suggested intervention Primary target
groups
Statistical analysis shows that household level poverty
is associated with both food insecurity and child
stunting.
Reduce poverty by all possible
means, through well targeted
and designed safety nets and
pro-poor growth initiatives.
Country.
Rural households struggling with food insecurity often
live in villages that are further away from infrastructure
such as roads, schools, markets and health centres.
Rural infrastructure development,
especially in areas with high food
insecurity.
Remote rural
villages.
Households relying on more diversified activities, and
especially urban households not involved in agricultural
production are better off in terms of food security. On
the contrary, households relying only on subsistence
agriculture and farming small plots (<0.5ha) in areas of
fragile land are more vulnerable to food insecurity.
Promote alternative livelihood
development programmes,
develop and diversify livelihood
opportunities, especially non-
agricultural employment where
possible.
Zones along the
Congo-Nile
Crest and
bordering Lake
Kivu.
7.2.3 Improve and diversify agricultural production
Main finding Suggested intervention Primary target
groups
Households that still had food stocks at the
time of the survey had better food
consumption. Own production contributed on
average to 30% of the food consumed in the
household.
Support productivity at household
level so as to increase the time
household food stocks last and
maximize benefits for the small
landholders.
Country, especially
rural areas.
Statistical analysis shows that kitchen gardens,
higher crop diversity and livestock ownership
are associated with greater household food
security.
Encourage kitchen gardens, diversity
in crop production and support
appropriate livestock rearing.
Country, especially
rural areas.
On average and for all crops produced,
households are selling 23% of their
production, and consuming 71%. Wealthier
farmers who also rely on sales of agricultural
product have better food security.
Increase local agricultural production
as well as sales of agricultural
produce and marketing to stimulate
farmer income.
Encourage local purchases of surplus
maize and/or other commodities by
government and food aid agencies.
Cooperatives, small
scale commercial
farmers.
Poor soil fertility, soil erosion, steeps slopes
characterize areas with higher levels of
unacceptable food consumption and stunting.
Promote best productive and
sustainable practices (e.g. soil
fertility enhancement and anti-
erosion measures).
Areas where soil
erosion and low soil
fertility are a
problem.
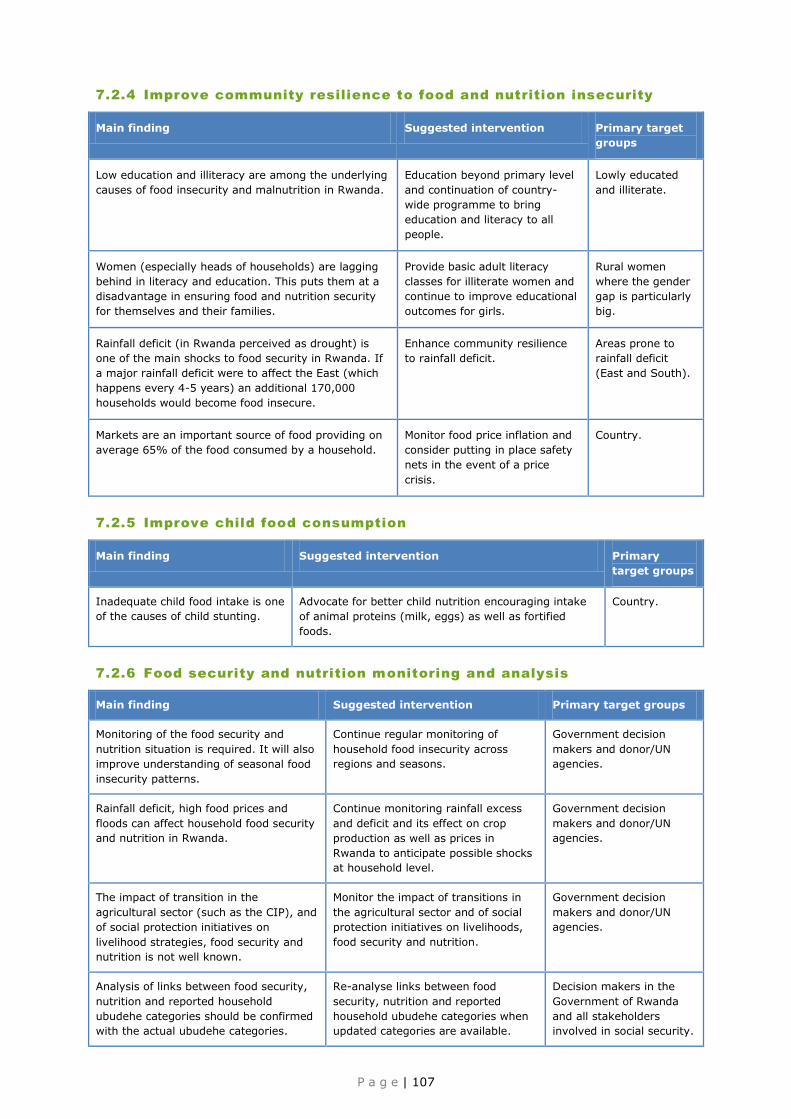
P a g e | 107
7.2.4 Improve community resilience to food and nutrition insecurity
Main finding Suggested intervention Primary target
groups
Low education and illiteracy are among the underlying
causes of food insecurity and malnutrition in Rwanda.
Education beyond primary level
and continuation of country-
wide programme to bring
education and literacy to all
people.
Lowly educated
and illiterate.
Women (especially heads of households) are lagging
behind in literacy and education. This puts them at a
disadvantage in ensuring food and nutrition security
for themselves and their families.
Provide basic adult literacy
classes for illiterate women and
continue to improve educational
outcomes for girls.
Rural women
where the gender
gap is particularly
big.
Rainfall deficit (in Rwanda perceived as drought) is
one of the main shocks to food security in Rwanda. If
a major rainfall deficit were to affect the East (which
happens every 4-5 years) an additional 170,000
households would become food insecure.
Enhance community resilience
to rainfall deficit.
Areas prone to
rainfall deficit
(East and South).
Markets are an important source of food providing on
average 65% of the food consumed by a household.
Monitor food price inflation and
consider putting in place safety
nets in the event of a price
crisis.
Country.
7.2.5 Improve child food consumption
Main finding Suggested intervention Primary
target groups
Inadequate child food intake is one
of the causes of child stunting.
Advocate for better child nutrition encouraging intake
of animal proteins (milk, eggs) as well as fortified
foods.
Country.
7.2.6 Food security and nutrition monitoring and analysis
Main finding Suggested intervention Primary target groups
Monitoring of the food security and
nutrition situation is required. It will also
improve understanding of seasonal food
insecurity patterns.
Continue regular monitoring of
household food insecurity across
regions and seasons.
Government decision
makers and donor/UN
agencies.
Rainfall deficit, high food prices and
floods can affect household food security
and nutrition in Rwanda.
Continue monitoring rainfall excess
and deficit and its effect on crop
production as well as prices in
Rwanda to anticipate possible shocks
at household level.
Government decision
makers and donor/UN
agencies.
The impact of transition in the
agricultural sector (such as the CIP), and
of social protection initiatives on
livelihood strategies, food security and
nutrition is not well known.
Monitor the impact of transitions in
the agricultural sector and of social
protection initiatives on livelihoods,
food security and nutrition.
Government decision
makers and donor/UN
agencies.
Analysis of links between food security,
nutrition and reported household
ubudehe categories should be confirmed
with the actual ubudehe categories.
Re-analyse links between food
security, nutrition and reported
household ubudehe categories when
updated categories are available.
Decision makers in the
Government of Rwanda
and all stakeholders
involved in social security.

P a g e | 108
ANNEXES (INCLUDED IN THE CD-ROM)
Annex 1: Data tables
Annex 2: Definitions and computation of main indicators
Annex 3: Prevalence of malnutrition among women in reproductive age by province
Annex 4: List of enumerators and supervisors
Annex 5: Check lists and questionnaires
Annex 6: Validation of the food consumption score as a proxy indicator for food security
Annex 7: Market integration of beans, sweet and Irish potatoes
Annex 8: Seasonal price patterns for maize, sweet potato and Irish potato
Annex 9: Description of FEWS NET livelihood zones
Annex 10: Detailed methodology
Annex 11: Methodology and results of the General Linear regression and Logistic regression
models
Annex 12: Water Requirement and Satisfaction Index methodology
Annex 13: References


MINALOC MIDIMAR
MINISANTE MIGEPROF
MINAGRI NISR